
Abstract
This study examines the geographical dimension of access to higher education in Greece by mapping spatial disparities in the distribution of vathmos prosvasis, the decisive score for being accepted in one of the country’s tertiary education departments. Influenced by the ‘spatial turn’ in the humanities and the social sciences, this paper takes a geographical approach. Spatial autocorrelation indices (Moran’s I) show that examinees from mountainous settlements, insular areas, and inner city neighbourhoods are much less likely to achieve a score that would allow them to enter one of the country’s higher educational institutions. The authors use the ‘oval’ metaphor in order to describe these differences. A number of explanatory variables at school catchment area level reduce the variation in vathmos prosvasis, but no conclusions can be made with regards to casual relationships between school neighbourhood characteristics and individual scores. The alarmingly low scores in a specific geographical region, the so-called ‘Pomakohoria’, are discussed as an example of how access to higher education in Greece is being affected by location.
Introduction
This study examines the geographical dimension of access to higher education in Greece by mapping spatial disparities in the distribution of vathmos prosvasis, the decisive score for being accepted in one of the country’s tertiary education departments. Vathmos prosvasis, literally ‘the access score’, is the weighted average of the grades achieved in the Greek national university entrance examinations known as the panelladikes. Being the only requirement for entering one of the country’s 20 universities and 14 technological institutions, panelladikes are high-stakes examinations and although they have been accused of forcing students into a distorted competition by increasing the need for private preparatory classes, they have managed to retain high levels of social acceptance through the years (Kassotakis and Verdis, 2013).
The first reason for choosing a geographical approach for studying inequalities in vathmos prosvasis is methodological. A notable lack of information with regards to students’ socioeconomic status in Greece has resulted in the lack of large, nationwide studies associating access to higher education with background variables such as parental income, education, and occupation. In the current study we have addressed this problem by using spatially oriented census data published for the first time in 2013, the year that our outcome variable was measured. To the problem of lack of background variables for research one must add the unavailability of anonymised individual scores in the national university entrance examinations. This also applies to scores aggregated at school level. We were privileged enough, however, to access anonymised data at individual and school levels through a personal request to the Secretary General of the Greek Ministry of Education. That is how this study has been made possible.
The second reason for choosing a geographical approach is theoretical. The ‘spatial turn’ that is currently gaining place in the humanities and the social sciences (see Löw, 2016) has opened new questions in educational research by calling attention to the spatial aspects of power relations in educational systems (Robertson, 2010), by questioning, among other things, the precedence of time over space in comparative education research (Larsen and Beech, 2015), and by paving the way for the publication of books such as the Geography of Education: Scale, Space and Location in the Study of Education (Brock, 2016) that theorise the spatial approach in educational research. And although in the current study we do not explore the relationship between the physical environment and the inequality in educational outcomes, we do review a number of geographically oriented studies in education. Our research questions are as follows: (a) are there regional disparities in vathmos prosvasis with respect to the results of the 2013 national examinations in Greece; and (b) if regional disparities do exist, how could they be explained with the data that are available?
Literature review
Geographically oriented educational research
Despite the abundance of geographically oriented research in educational outcomes and provisions, scholars are still perplexed in the grammar of a possible spatial approach to educational inequalities, notes Robertson (2010). Authors with geographical training have tried to embrace the concerns of education sociologists using different explanatory frameworks. Among these frameworks are Durkheim’s notion of ‘social space’ (Buttimer, 1969), especially as it has been brought out by the neo-Marxist philosopher Henri Lefebvre (1991), Bourdieu’s notions of habitus (Bourdieu, 1977) and ‘social capital’ (Bourdieu, 2008), Giddens’s (1984) notion of locales, and Lévy’s (1994) notion of ‘spatial capital’.
Geographically oriented research in education appeared in the 1990s with a study about the importance of residential environment on students’ attainment (Bradford, 1990). This line of research was later continued in the work of Ainsworth (2002) who in his paper ‘why it takes a village?’ discussed the mediation of neighborhood effects on educational achievement and built a number of regression models that predicted educational outcomes from a number of statistics at school neighbourhood level. Ainsworth (2002) focused on the mechanisms of the neighbourhood effects and used for this purpose the terms ‘collective socialisation’, ‘neighbourhood social capital’, and ‘differential occupational opportunity’. He claimed that his study constituted ‘a step forward to both the urban and the educational literatures’ (Ainsworth, 2002: 143). His mechanisms are still recognised as standard theoretical knowledge within a social geographers’ analytical framework (Brattbakk, 2014).
Ainsworth’s (2002) original work may not have brought a ‘paradigm shift’ in educational research as he had predicted but a number of educationally centred papers did appear in Urban Studies, the leading journal in urban sociology. In a special issue of this journal, edited by Butler and Hamnett (2007), Gordon and Monastiriotis (2007) discussed the effect of the geographical context on English secondary school public examinations and found that local educational policies on schools’ status, selective character, and composition, affect school-level success rates. In another volume of Urban Studies, Webber and Butler (2007) discussed the role of neighbourhood characteristics in predicting the scores in the British General Certificate of Secondary Education. Similarly, Brattbakk and Wessel (2013) explored the influence of neighbourhood on educational achievement in Oslo and found small but statistically significant effects.
Similar studies have appeared in other academic journals as well. Johnston et al. (2006) compared the cultural segregation across local education authorities in England between schools and neighbourhoods and found that segregation is larger between schools than between neighbourhoods. Kauppinen (2008) investigated how the neighbourhood effect in Helsinki is associated with the socioeconomic composition of the school. Maloutas (2007) investigated educational inequality in different types of residential areas in Athens and discussed the middle-class strategies of school choice. Maloutas et al. (2013) studied educational outcomes in relation to urban inequalities in the Athens metropolitan area. Maloutas and Lobato (2015) have similarly discussed how the housing market in Athens and Dortmund is connected with educational inequalities. Noyes (2013) used spatial approaches to map mathematics attainment and participation in the United Kingdom, and Barthon and Monfroy (2010) studied the spatial dimension of school choices at the city of Lille. Finally, issues related to the new public management in education, such as school choice and marketisation, have most frequently been approached from a spatial perspective, especially in the United States (Logan et al., 2012; Lubienski and Dougherty, 2009).
Previous studies in inequalities in access to higher education in Greece
The discipline of sociology appeared in Greece very late in comparison to the other countries of the historical Western Europe and the United States. This is because sociology was considered ‘Marxist science’ in Greece (Kokosalakis, 1998) and in the period prior to the restoration of democracy in 1974 the supporters of left-wing ideologies were systematically marginalised in this country. After the restoration of democracy in 1974 a new period, the so-called metapolitefsi, began and the first country-specific sociological studies appeared in books and academic journals both in Greece and abroad. One of the first Greek scholars to do sociological work on education in this country was Tsoukalas (1976) in his doctoral thesis in Paris. The first paper on education to be published in a Greek sociological journal was in fact spatially oriented. In this paper, Eliou (1976) used the official statistics of the 1971 census and mapped geographical disparities in the educational level of the Greek households. The scale in Eliou’s (1976) study would be today’s second level of territorial units for statistics in Greece, the so-called peripheries. Around that period, Μeimaris and Nikolakopoulos (1978) published the first paper on educational inequalities in Greece in which they used correspondence analysis to link undergraduates’ social background to the characteristics of the tertiary institutions that they attended.
Since then, every quantitative sociological study in Greece has confirmed the relation between socioeconomic background and access to higher education (Chrysakis et al., 2009; Gouvias, 1998a, 1998b; Gouvias et al., 2012; Sianou-Kyrgiou, 2006, 2008). In the studies that we report, the measuring of socioeconomic background has been based on self-reported information, specifically on questionnaires completed by the students. In some of these studies advanced statistical techniques have modelled multivariate relationships among different explanatory variables such as study arrangements or attending evening preparatory courses (Gouvias et al., 2012; Kontogiannopoulou-Polydorides, 1995). A nationwide study however has not been conducted so far due to the lack of reliable measures at the explanatory and dependent variables levels.
Method
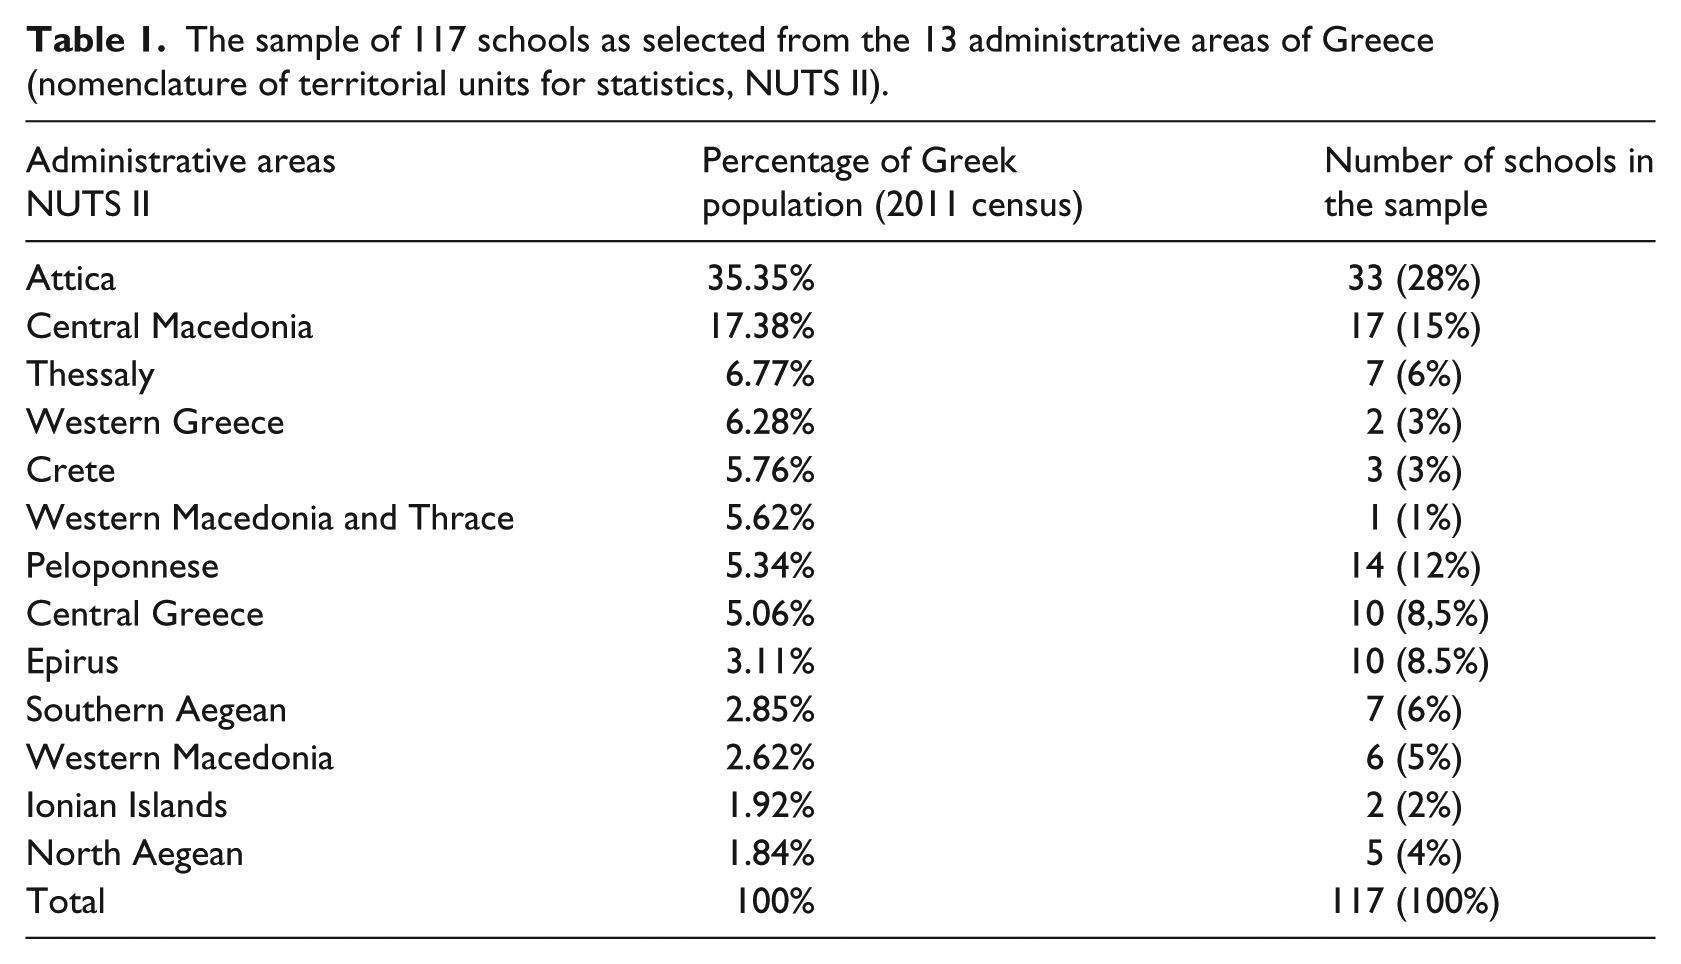
As discussed in the introduction of our work, we have examined the scores of the 2013 panelladikes examinations in order to map the percentages of access to higher education across the smallest geographical units for statistics in Greece. In addition, we have combined these data with data from the latest ‘general population census’ (Hellenic Statistical Authority, 2011). We were thus able to construct spatial autocorrelation models and hierarchical linear models, similarly to ones that Noyes (2013) has done in his study on mathematics attainment in the United Kingdom. Further on, we have selected a representative sample of 117 schools (8848 students) from the population of the state higher secondary schools (lykeia). The schools have been selected from the 13 administrative regions of Greece, the second level in the nomenclature of territorial units for statistics, NUTS II), according to each region’s population (see Table 1). The distribution of students’ vathmos prosvasis in our sample is almost identical to the distribution of the same variable in the population (see Table 2). Given the population mean score of 11.75 and the population standard deviation of 4.31, the sample size is adequate for a type I error of a = 0.001 and a statistical power of (1 ─ β) > 0.995.
The sample of 117 schools as selected from the 13 administrative areas of Greece (nomenclature of territorial units for statistics, NUTS II).
The distribution of the access scores a in the sample and the population.
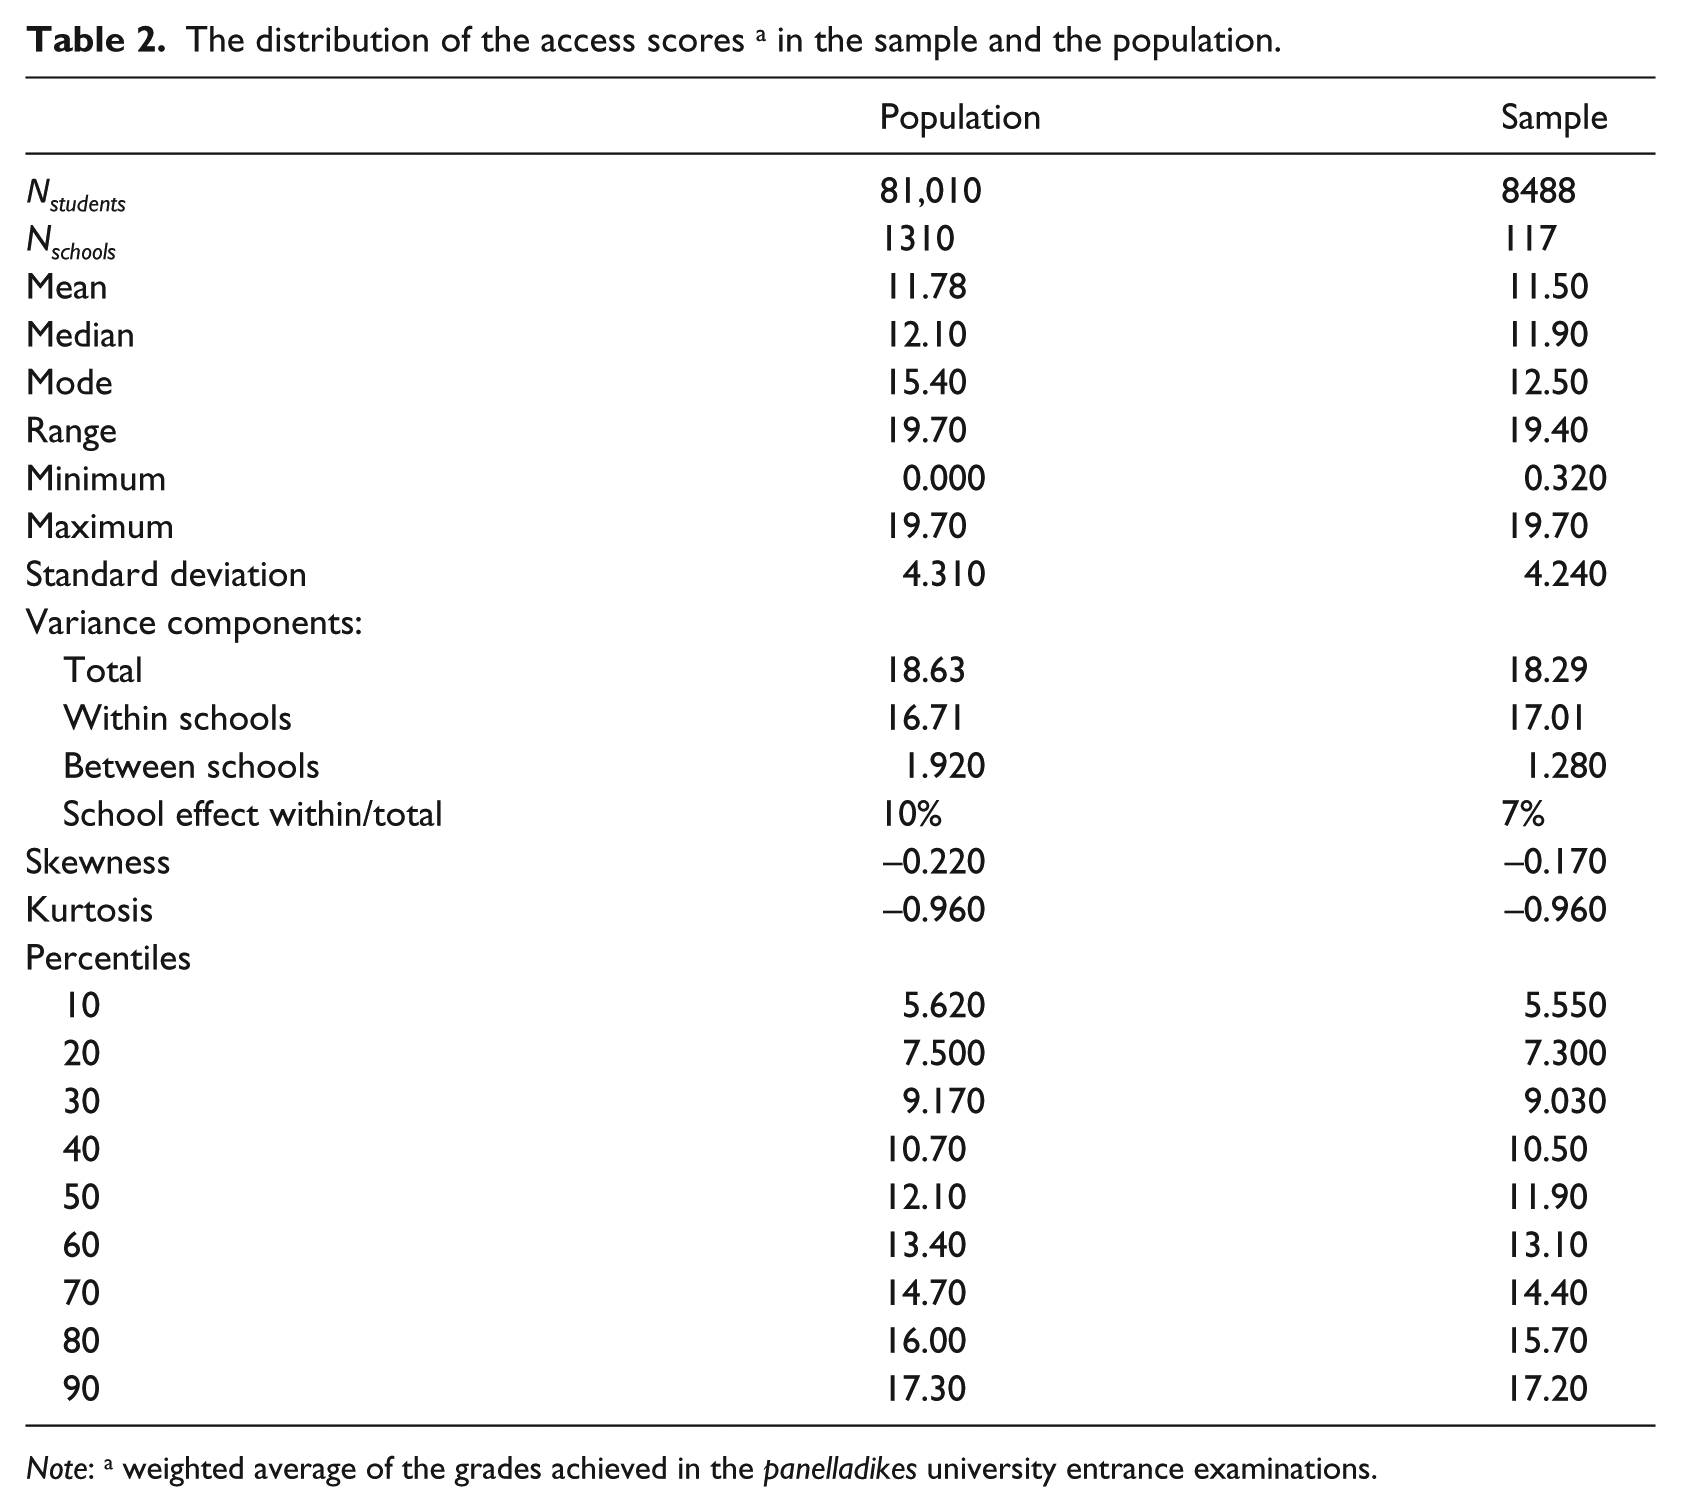
Note: a weighted average of the grades achieved in the panelladikes university entrance examinations.
With the use of free cartographic software (QGIS), we have verified the exact administrative boundaries of the catchment areas of each one of the schools in our sample. This was not an easy task. The borders of the catchment areas are often a matter of negotiation and bitter undocumented disputes between the teachers of neighbouring schools. This is because the size of a catchment area is related to the number of the students that attend a particular school and, consequently, to the number of teachers that a particular school can employ. In Greece, teachers are employed for teaching a specific number of groups of students per week. The minimum number of students to be considered as a group is 12. If the number of groups is smaller than required, the teachers are either asked to teach in more than one school or to move to the district of another educational directorate. There are 59 regional educational directorates in Greece, each one responsible for the local administrative and didactical issues.
The independent variables at school catchment area level have been: (a) the percentage of households with at least an adult holding a degree equivalent with International Standard Classification of Education (ISCED) levels 6, 7, and 8; (b) the percentage of economically inactive residents; (c) the percentage of country homes; and (d) the percentage of houses with size equal to or larger than 100 m2. In order to achieve normality, we transformed the initial scores of these variables to the logarithmic scale. The distributions of the independent variables are presented in Table 3.
Descriptive statistics of the explanatory variables at schools’ catchment areas level.
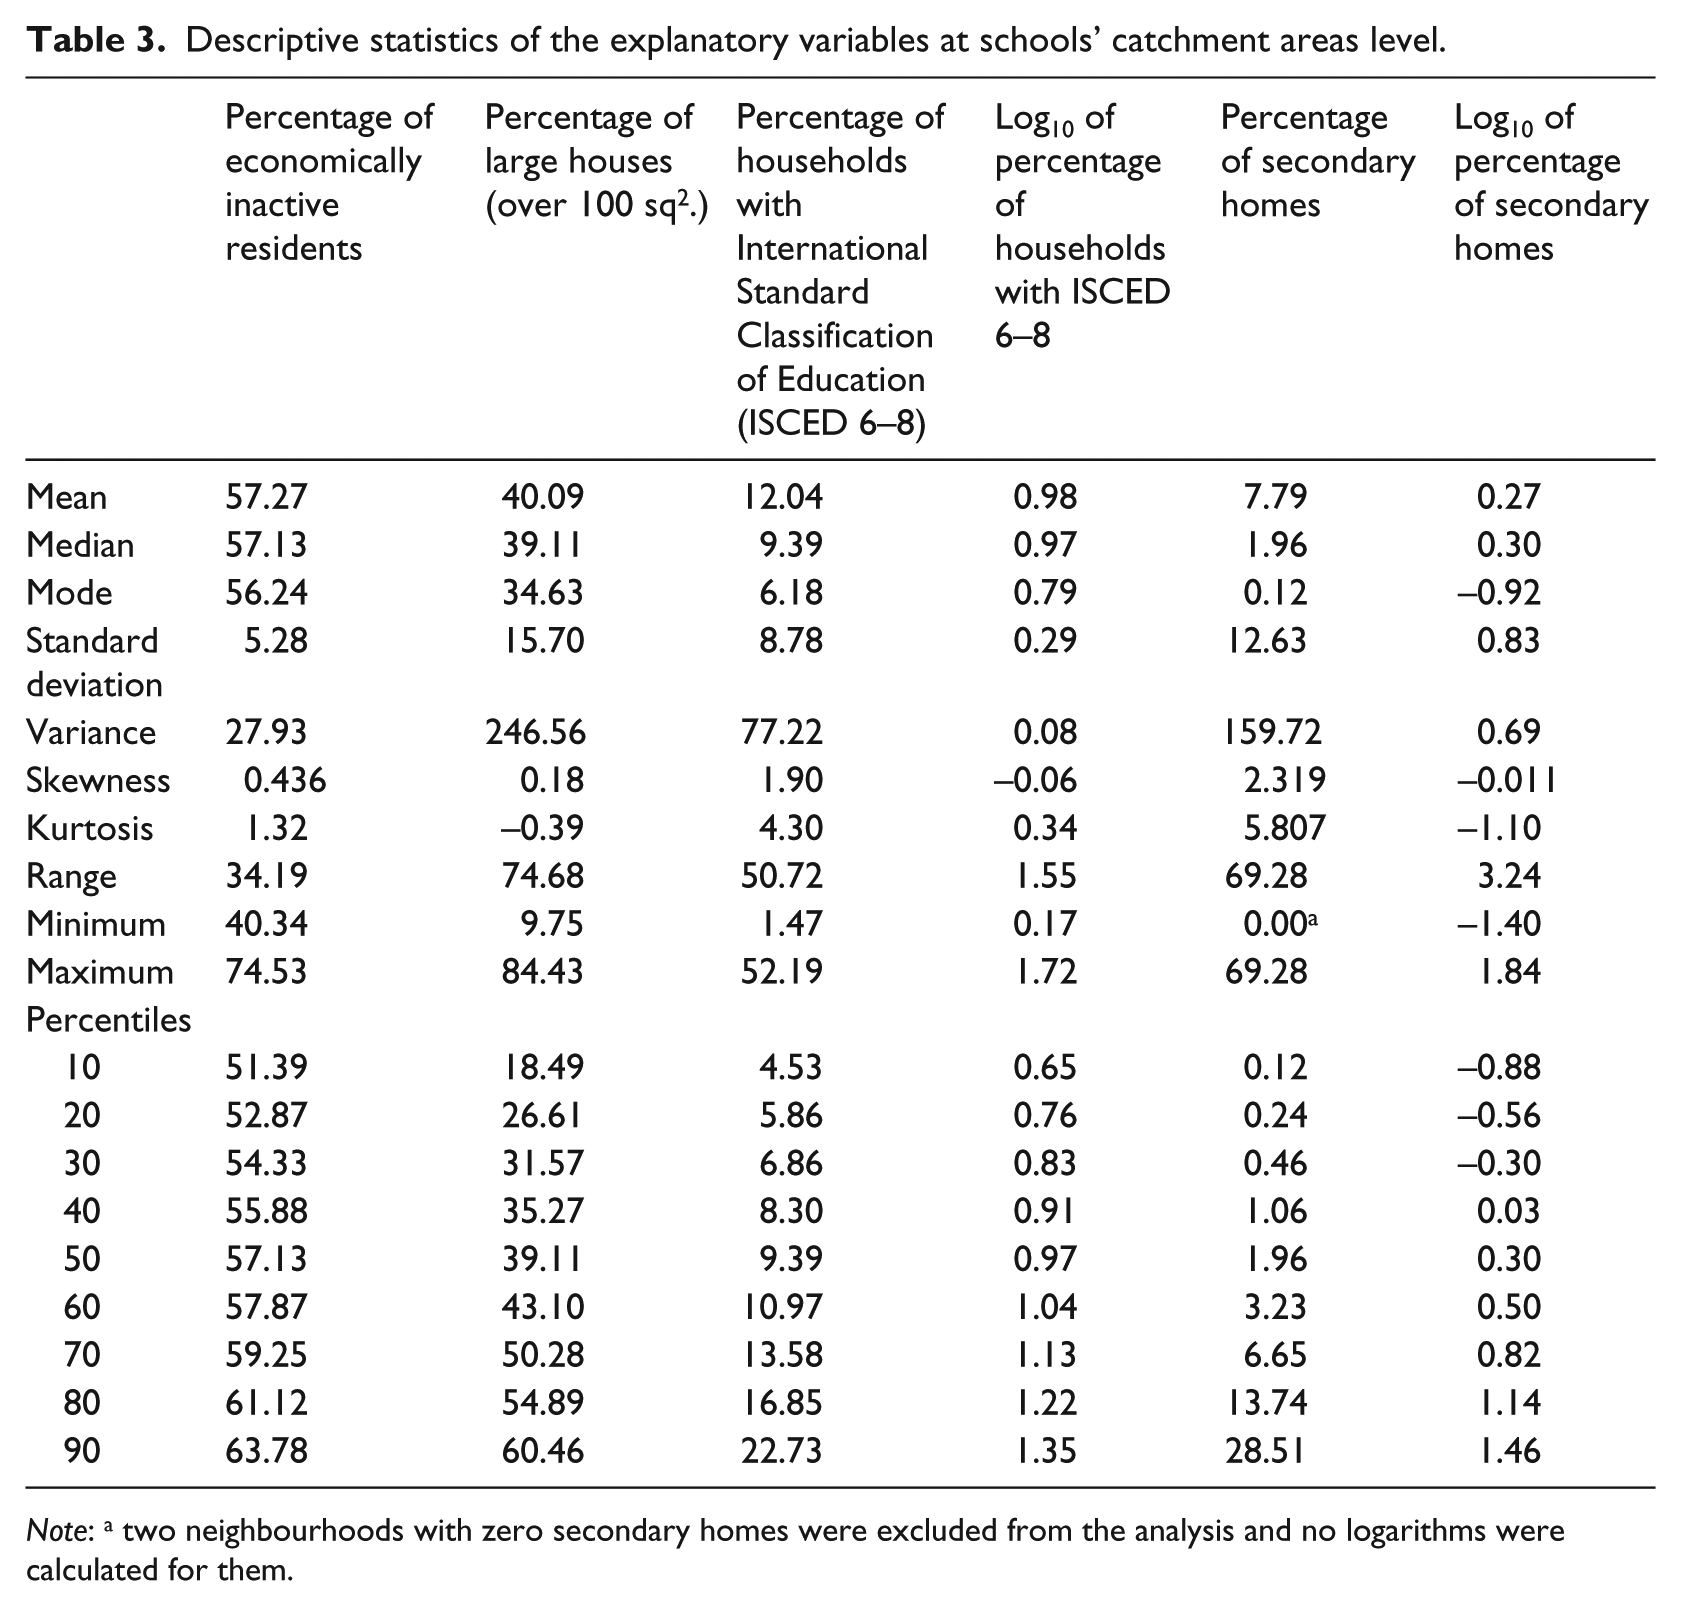
Note: a two neighbourhoods with zero secondary homes were excluded from the analysis and no logarithms were calculated for them.
The lack of both prior achievement measures and socioeconomic background measures, has left us with only three explanatory variables at student level: ‘Scientific Direction’; ‘Technological Direction’; and ‘repeat examination’. The first two are dummy variables comparing average differences among groups of students that focus on different subjects in their final year of the secondary school. The ‘Theoretical Direction’ (the Humanities) focuses on Modern Greek, Ancient Greek, History, and Latin; ‘Scientific Direction’ focuses on Modern Greek, Mathematics, Physics, and Chemistry; and ‘Technological Direction’ focuses on Modern Greek Language, Statistics, Informatics, and Economic Theories. The group of the ‘Theoretical Direction’ is the basis of the comparison in our study.
The third variable at student level is also dichotomous and compares the average scores of the students that took the examination for the first time with those who repeated the examinations. Examinees can repeat the examinations either because their initial level of achievement is insufficient for entering higher education or because they are targeting more prestigious university departments. The students who took the examination for the first time are the basis of the comparison.
Findings
Descriptive statistics at neighbourhood level
As we discussed in the previous section, four independent variables have been used at neighbourhood level in the current study. The first is the percentage of the households with at least one member with ISCED 6–8. In our sample, this percentage is 12%, three units below the Organisation for Economic Co-operation and Development (OECD) average for 2009 (Organisation for Economic Co-operation and Development, 2010). In half of the schools’ catchment areas, the percentage of households with ISCED levels 6–8 is between 5% and 15%. The catchment area with the higher percentage of households with ISCED 6–8 (52.19%) was that of the 26th Lyceum of Athens (37°58’40.61”N, 23°44’47.45”E), located in Kolonaki, an affluent artistic neighbourhood in the heart of Athens. About one-third of residents of Kolonaki hold a university degree (ISCED 6). Another 14% hold a Master’s degree (ISCED 7) and another 6.64% hold a doctorate degree (ISCED 8). High values in this factor were also found at the high-class area of Psychiko (40.14%) in the north district of Athens (37°59’57.86”N, 23°46’43.15”E). Kalogirou (2010) has found that the proportion of Master’s and PhD degree holders in Psychiko is 10.9%, a figure very similar to 12.73% that we have found in the current study. The lowest percentage in this indicator was found in Nea Vissa, a lowland town, part of the northernmost municipality of Greece of Orestiada at the Evros Prefecture and near the border with Turkey (41°35΄N, 26°32΄E). According to the 2011 census the population of Nea Vissa was around 2805 persons.
The second independent variable at school level is the percentage of large houses in schools’ catchment areas. The mean size of the houses in a geographical area has been used in the literature as a proxy measure of ‘spatial capital’, according to Foley (2003). A Greek study by Emmanuel (2004) seems to support this view, as positive correlation has been found between dwelling size and the socioeconomic status of the households in the city of Athens. According to Eurostat (2016), the mean dwelling size in Greece for all degrees of urbanicity is 88.6 m2, slightly over the mean dwelling size of 2001 for this country (Dol and Haffner, 2010). According to the Hellenic Statistical Authority (2014), the mean Greek house usually consists of 3 rooms and the mean dwelling size per person is around 34.6 m2. The percentage of houses of size ⩾ 100 m2 in Greece is 27.2%. There are 1,734,612 such houses (27%), out of the total 6,371,901 houses (Hellenic Statistical Authority, 2014).
Apart from the size of the houses, another independent variable in our study is the percentage of homes in an area that are used as holiday homes (country homes). This variable can be perceived as a proxy measure of an area’s urbanicity, that is, the degree to which a given geographical area is urban (Paris, 2011). Country homes in Greece abound in mountainous, insular and coastal areas. The neighbourhood with the largest percentage of country houses in our sample is Goura, a small settlement 91 km south-west of Corinth. Half of the dwellings in Goura are country houses. In contrast, the percentage of country homes in the urban working-class neighbourhoods of Athens, Thessaloniki, Patra, Larissa, and Eleusis is essentially equal to zero.
A fourth explanatory variable in the current study is the percentage of economically inactive residents in schools’ catchment areas. From an economic perspective, ‘inactive’ are those who are neither ‘employed’ nor ‘unemployed’. In Greece, the economically inactive are usually the grandparents, uncles, aunts, cousins and other relatives of young adults and, most importantly, the mothers who do not work. In Greece, the relatives create non-typical extended families contributing to the raising of the children in rural and urban areas alike. The members of these non-typical extended families may not live in the same dwelling but they often use a number of ‘housing strategies’ to live nearby, as Tosi (1995) argues. According to the Hellenic Statistical Authority (2016), around 40.69% of people in Greece over the age of 15 are economically inactive. The percentage of the typical form of extended families in Greece is 3.9% of the population of families, according to Iacovou and Skew (2011). The percentage of the non-typical extended families in the form that we described earlier, however, is unknown.
The school area with the largest percentage of economically inactive persons in the sample was the village of Raptopoulo in the region Evrytania (39°9΄Ν, 21°28΄Ε) with 74.53% of its residents economically inactive. The area with the next higher percentage of economically inactive is the catchment area of the Lyceum of Pentapoli, a small village near the town of Serres in Northern Greece (41°3΄N, 23°41΄E). In the area of Pentapoli, 72.39% of the people were economically inactive. On the other side, the area with the smaller percentage of economically inactive dwellers is the neighbourhood of the 1st Lyceum in the island of Kos (36.39%), a vacation island in the Dodecanese chain in the south-eastern Aegean Sea (36°53΄N, 27°17΄E). As expected, small percentages of economically inactive residents have also been found in the catchment areas of a number of schools in the inner-city areas of Athens and Thessaloniki, the two larger cities of Greece.
The map of inequalities in university access scores
The analysis of the scores of the national university entrance examinations of 2013 has revealed spatial inequalities with regard to vathmos prosvasis. Figure 1 presents box plots that compare the distributions of the scores across the 59 regional educational directorates. The variance between the directorates amounts to a small 1% of the total variance in students’ university access grade.
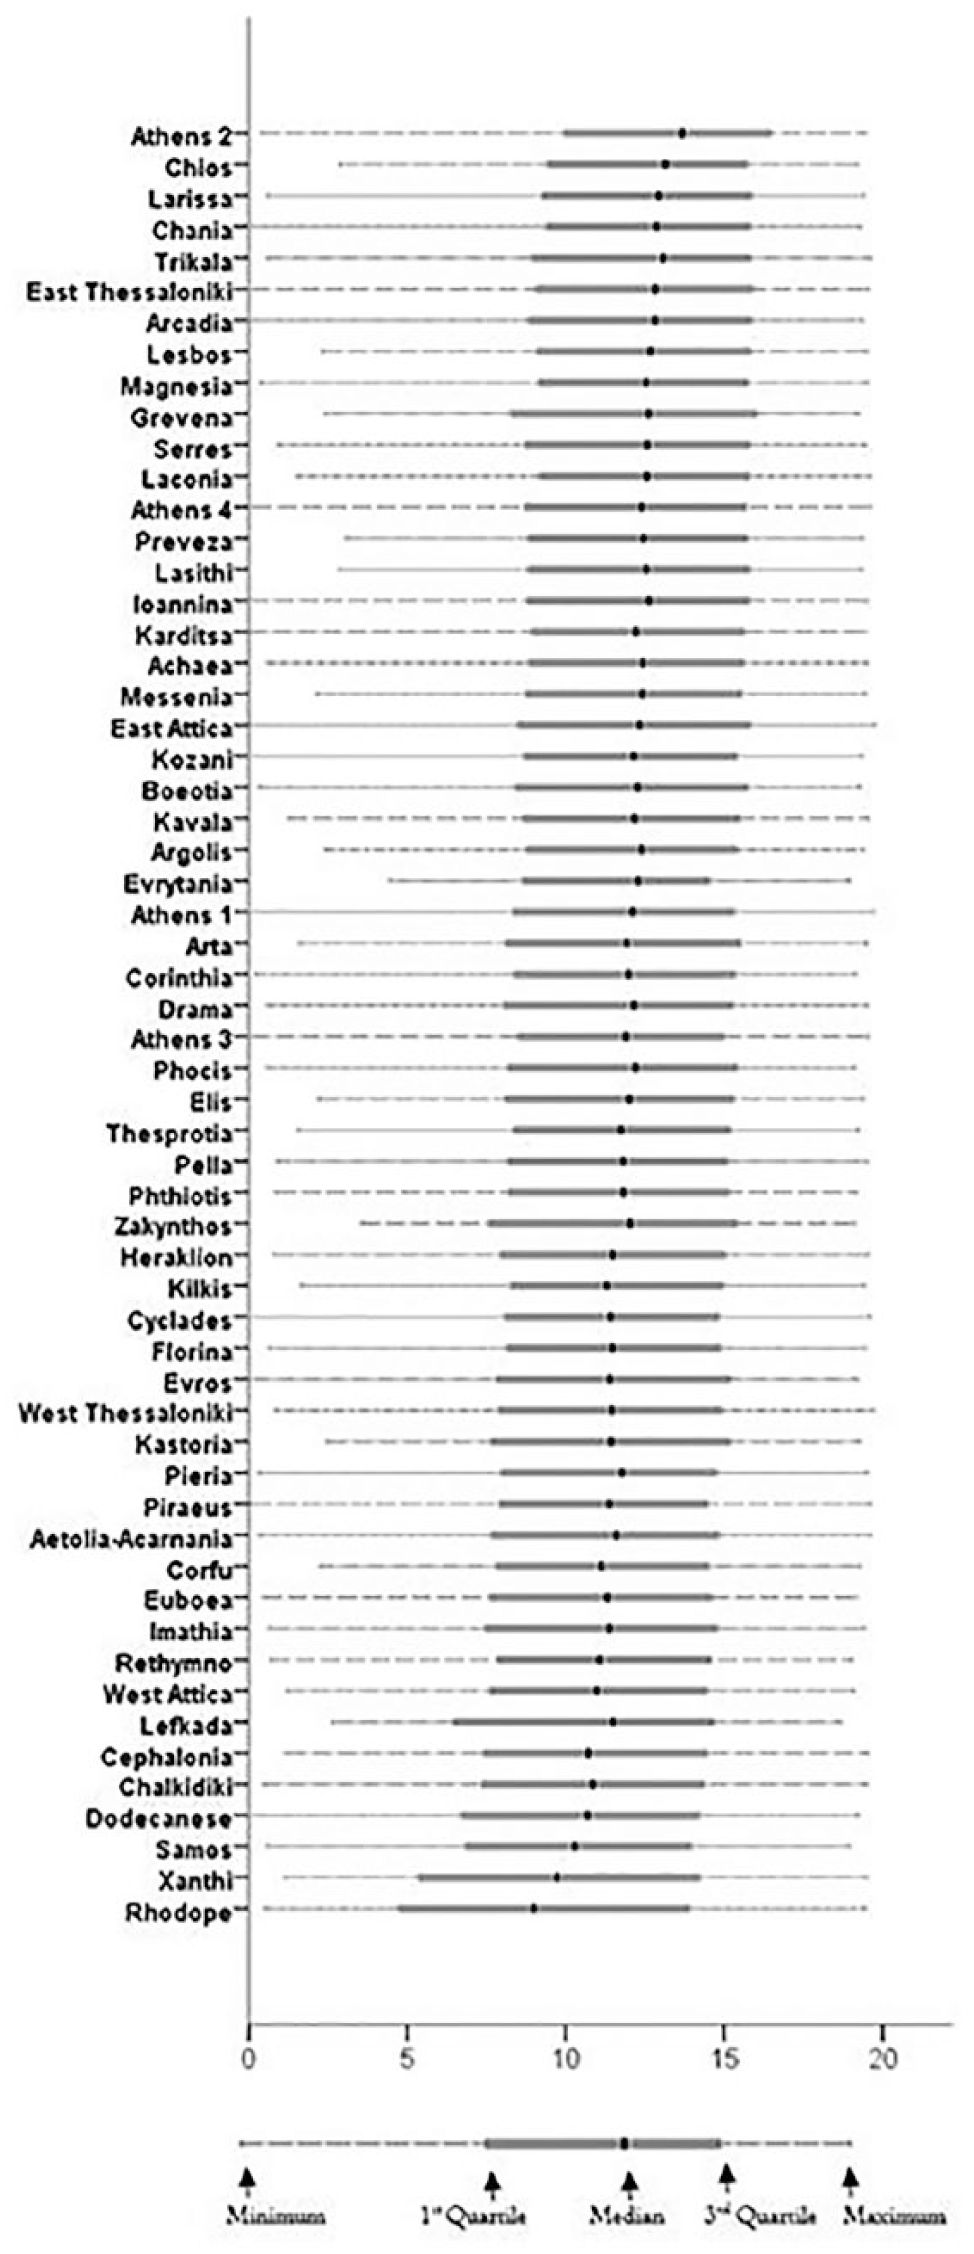
Box plots comparing vathmos prosvasis across 59 local educational directorates.
Figure 2 depicts percentages of university access scores larger than or equal to the third quintile of their distribution (QU3 = 13.4), among the 325 ‘Kallikratian’ municipalities of Greece. ‘Kallikratian’ municipalities are the smallest administrative units for geographical statistics in Greece (NUTS III). They were created by the ‘Kallikratis’ programme, officially known as the ‘new architecture of self-governing entities and deconcentrated administration’ (Nomos 3852/10, 2010). Lighter shades of grey in Figure 2 represent higher percentages of scores larger than or equal to the third quintile. A score in the two upper fifths of the distribution can secure a place in a good university department. Darker shades represent smaller percentages of scores in the two upper fifths of the distribution. The colour white indicates lack of statistical information.
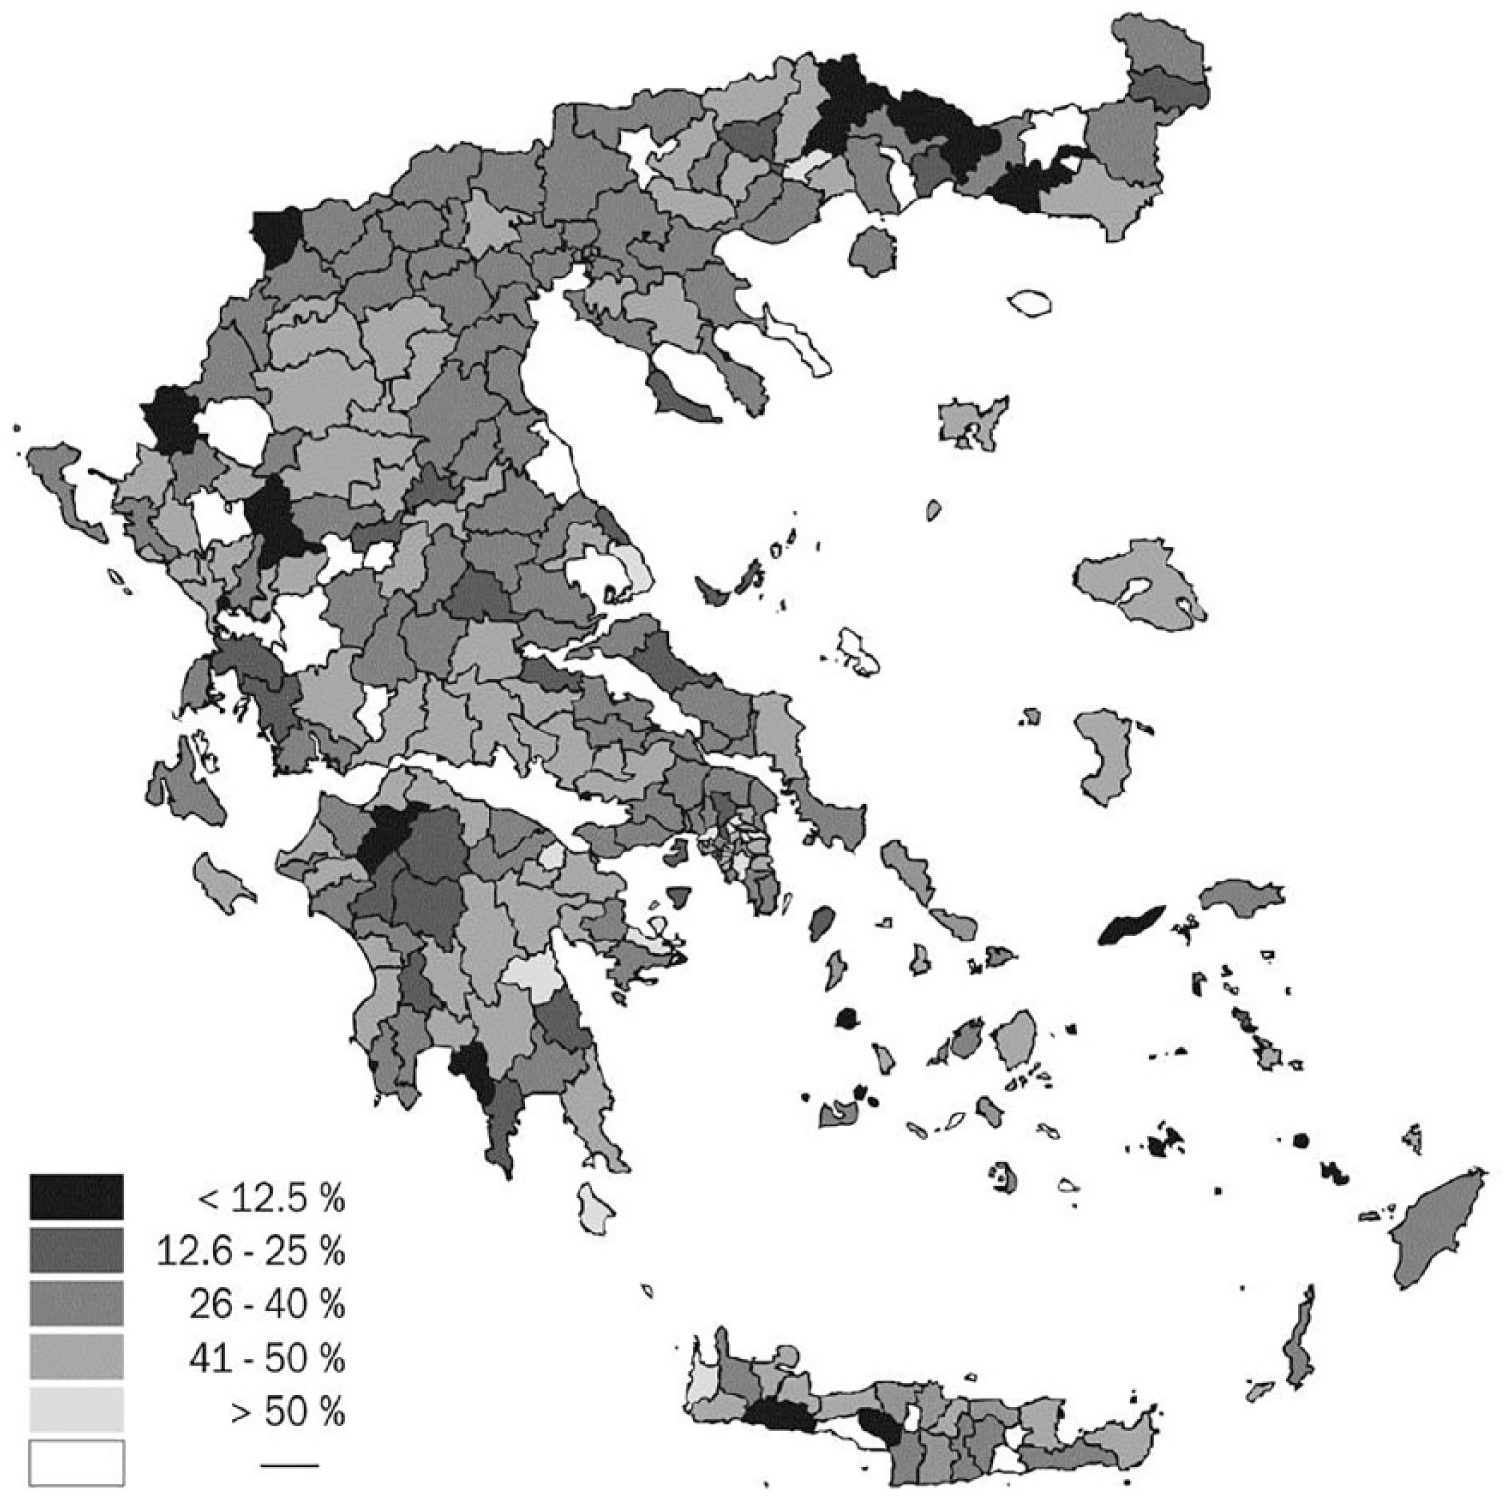
Percentages of vathmos prosvasis larger than or equal to 13.4 across 315 municipalities.
The ‘black’ areas on Figure 2 point out to a number of mountainous municipalities at the western and north-western parts of Greece, a number of mountainous regions at Peloponnese and Crete, a number of small islands, and, most importantly, the regions of the Rhodope Mountains in the broader region of Thrace, a case that we will discuss later. More than 50% of the examinees in these ‘black’ areas have scored below the first quintile of the distribution (QU1 = 7.5). The grades in the first fifth of the distribution are not sufficient for entrance even at the country’s less prestigious institutions. Simply put, the ‘black’ areas are ‘out the map’ of entrance to tertiary education.
The similarity of the scores across neighbouring municipalities on the map in Figure 2 has been evaluated using Moran’s I, an indicator of spatial autocorrelation. Moran’s I is the normalised sum of the cross products of the deviations from the means between neighbouring units of analysis (Moran, 1950). The observed value of this statistic is compared to its expected value under the null hypothesis of spatial randomness and a z score has been produced. In our study, the overall nationwide Moran’s I have been found to be positive, an indication for spatial clustering. The nominal value of this statistic is not as important as other correlation coefficients. We have found that z = 4.456, p < 0.0001, an indication that spatial clustering is statistically significant. Anselin’s (1995) local indicators of spatial association (the ‘local’ Moran’s I), has further suggested a cluster of low achievement at the north-eastern municipalities (namely, Paranesti, Xanthi, Myki, Avdira, Iasmos, and Komotini), and a cluster of high achievement at the municipality of central Athens and its northern districts. In the next section, we will be focusing on the first of these clusters, which includes the cities of Xanthi and Komotini, and the nearby villages at the Rhodope Mountains.
Explaining the inequalities
With the existing data at student and neighbourhood levels, we built four hierarchical regression models that we present in Table 4. The first, Model A, the ‘unconditional means random intercept model’, is essentially an analysis of variance. This model shows that when no explanatory variables are present in the analysis, the ratio of neighbourhood level variance to the total variance is 7%.
Hierarchical regression models predicting ‘vathmos porsvasis’ a (117 schools, 8488 students).
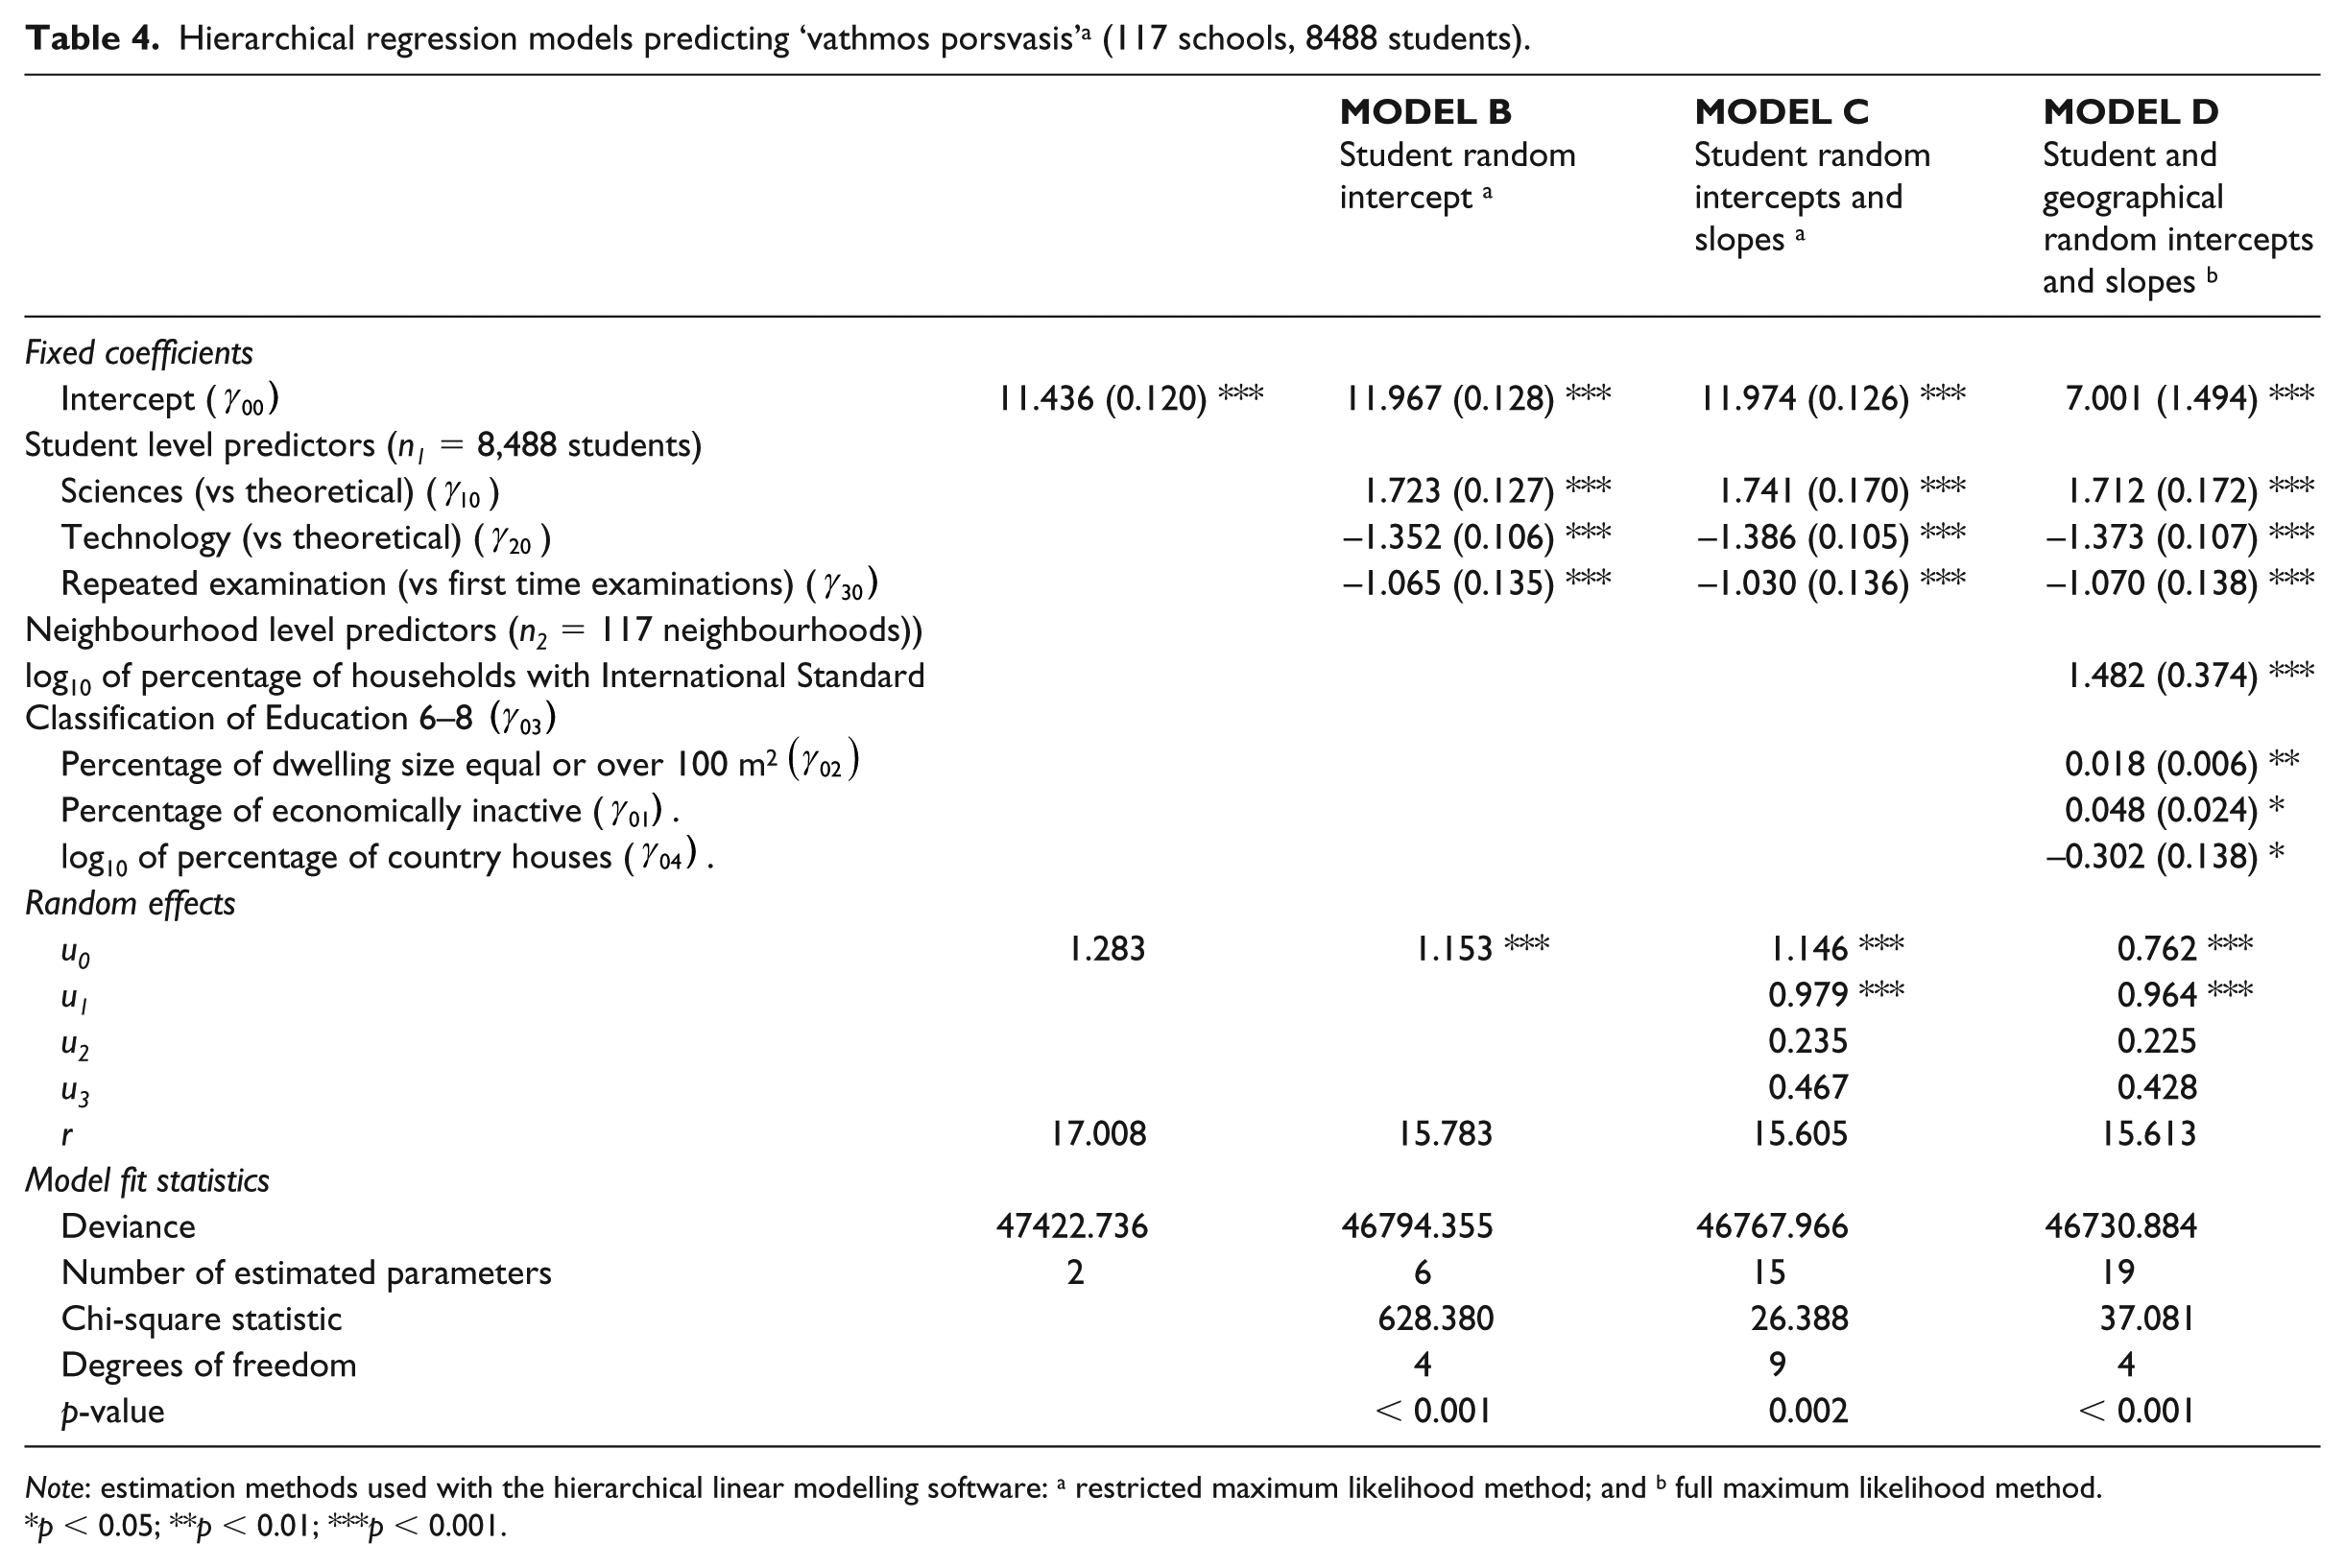
Note: estimation methods used with the hierarchical linear modelling software: a restricted maximum likelihood method; and b full maximum likelihood method.
p < 0.05; **p < 0.01; ***p < 0.001.
In Model B, the ‘student level random intercept’, three student-level explanatory variables have been added. The coefficients
Model C is an elaboration of Model B with the difference that the regression lines vary also in terms of their slopes and not only in the ordinates. Model D adds the spatial dimension to Model C. The statistical significance of the coefficient
The case of ‘Pomakohoria’ on Rhodope Mountains
Statistical evidence already presented, marks the alarmingly low scores achieved in regions of the Rhodope Mountains and in the broader Greek region of Thrace. We decided to travel to this specific area and explain the discrepancy in our outcome variable. This region is unique to Greece as being the place of the so-called ‘old’ Greek Muslim minority. Until today the region of Trace has been a point of territorial and political claims from a neighbouring country.
In October 2013 we visited a number of villages on the Rhodope Mountains known by their collective name as ‘Pomakohoria’ or ‘the villages of Pomaki people’. This name derives from the Bulgarian word ‘Pomachamedanci’ that means ‘Islamicised’. We were accompanied in this journey by the head teacher of the local high school, himself a teacher of theology. We stopped at the village of Echinos at the heart of the Muslim community. We entered the cafeneio (the local traditional café) of the village where men with callused hands slurped their Turkish coffee. Young women in colourful hijabs were walking across the central square. This was not a common sight in the eyes of an Athenian visitor. More than 95% of the population in Greece belongs traditionally to the Greek Orthodox Church, which is believed to have preserved Greek identity during the Ottoman Empire years.
The people in ‘Pomakohoria’ represent what Tsitselikis (2012) has described as the ‘historical Muslim minority’ of Greece. They are descendants of the Thracian Muslims (mostly Sunnis) who were exempt from the compulsory population exchange between Greece and Turkey in accordance with the Treaty of Lausanne 1923 (Martin, 2007). The local community consists of three separate ethno-linguistic groups: a large group with Turkish conscience, which amounts to half of the community’s population; a smaller ‘Pomak’ group (the indigenous people) that amounts to 30% of the population; and a Roma group that amounts to the remaining 20% (Lytra, 2007). For the last 20 years, Turkish has practically become the lingua franca in the region (Lytra, 2007).
Apart from their common language, the people at ‘Pomakohoria’ share the same topography and the same living conditions. They are also engaged in similar livestock activities. Most importantly, however, the younger members of this community share similar educational settings. Students who live in ‘Pomakohoria’ can opt to attend one of the 228 primary minority schools and the two secondary minority schools in the city of Xanthi. The Head of the Local Educational Authority has noted the problem of trilingualism in this educational environment and has described how trilingualism ‘discourages’ Muslim students. As he writes, ‘their mother tongue is the “Pomak” and, apart from the Greek, they also learn Turkish in order to read the Koran’ (Papadopoulos, 2013).
The issue of language, together with other geographically specific characteristics of this place (historical and cultural), has led to the introduction of the only geographically specific affirmative educational policy in Greece. According to this policy, an additional 0.5% of the places in the Greek universities are annually reserved for the Muslims who either live in Thrace or are of Thracian origin (Ziaka, 2009). It is estimated that between 1996 and 2009, three thousand students have made use of this affirmative action (Zachos and Chava, 2015). This means that although educational opportunities for the young people in ‘Pomakohoria’ appear to be restricted, a geographically oriented compensatory policy is used to balance the effects of socioeconomic disadvantage. In our opinion, this is an example of how ‘location’ can be a central element in the formation of national educational policies.
Discussion
In the latest OECD country report for Greece it is stated that there is ‘selected evidence pointing to regional disparities in educational attainment’ in this country and that ‘the data on regional school and student performance, while limited, suggest a correlation between the state of educational provision and educational outcomes in individual prefectures and the socio-economic conditions of the area’ (Organisation for Economic Co-operation and Development, 2018: 36). In the current study we have discussed the geographical disparities in an important element of the Greek educational system, namely the vathmos prosvasis, that is, the decisive score for university entrance in this country.
The absence of published research on this topic points out to a number of other country-specific problems, such as the unavailability of official statistics for research and the lack of access to data held by the central government. By adopting a geographical approach, we were able to overcome the problem of lack of information and join an ongoing international discussion on the issue of fairness in access to higher education (see Meyer et al., 2013; Mountford-Zimdars and Sabbagh, 2013). As a matter of fact, in one of the comparative studies on access to higher education, Chankseliani (2013) has examined how urbanicity, an essentially geographical factor, has affected access to higher education in post-Soviet Georgia.
Location is an important factor in geographically fragmented countries and this also applies to Greece, where public services, such as the health system, the transportation, the public administration, and the supply of electricity, are being affected by the country’s geographical environment. Greece is full of geographical antitheses. 80% of the mainland is mountainous, a fact that has created the conditions for the formation of many small isolated communities. Half of the country’s population of 11 million lives in the area of Athens. In the seas that lie to the west, east and south of the mainland there are more than one thousand islands, many of which are secluded with only few residents, whereas some other islands are vacation destinations for the upper social classes.
From a comparative perspective, Caraveli and Tsiovas (2011) have described how geographical disparities have played a crucial role in the history, the culture, and the economic development of Greece while Mouzelis (1978) has described how Greeks left their isolated communities during the 1960s and moved to Athens in search of better opportunities. Realistically, ‘better opportunities’ means jobs, health care, better living conditions, and, in the case of education, larger schools. Most significantly, urban areas offer opportunities for evening preparatory classes, which, according to Kassotakis and Verdis (2013), are essential for achieving a good grade in the national examinations. Schools in remote and difficult to access areas of Greece (mostly the mountain communities and the islands) are small and considerably less well equipped in terms of infrastructure. It is therefore of no surprise that educational achievement in Greece is, among other things, a matter of geographical coordinates.
From a theoretical perspective, the effects of location on educational inequalities in Greece could be thought of as taking place on a ‘meso’ sociological level, between the ‘macro’ and ‘micro’ levels in Coleman’s (1990) model. In the Foundations of Sociological Theory Coleman (1990) introduced an idea, according to which a macro level social phenomenon can set off actions between individuals at a micro level. This move is the stern of a metaphorical ‘boat’. Individual behaviour brings horizontal changes at the personal level through complex social and psychological processes. This move is the ‘hull’ of the ‘boat’. Changes at the micro level can then result in subsequent macro-level phenomena, in an upwards move, imagined by Coleman (1990) as the ‘prow’ of the ‘boat’. Location could be seen as the ‘meso’ level in the aforementioned theory. The origins of a locational ‘meso’ level can be found in the works of the scholars of the ‘Chicago School’ of sociology, who, according to Matthews (1977: 140), saw ‘geographically located and spatially defined’ patterns of inequality in the great American cities. Such a locational ‘meso’ level can also be seen in the works of other American sociologists, such as Wilson (1987) and Sampson (2012), and also in field experiments in the USA, such as the ‘Moving to Opportunity’ study in five American cities (Chetty et al., 2016).
The first research question of the present study has examined the geographical disparities in the scores of the university entrance examinations in Greece for the year 2013. Using a geographically centred approach we were able to conclude that the decisive score for entering a higher education institution in Greece differs significantly among the upland, the lowland and the coastal areas. Within urban areas there are differences between the affluent high-class neighbourhoods and the densely populated inner-city zones. The map of Greece that we present in Figure 2 is essentially a picture of the fragmentation in access to higher education. If we were asked to describe this map, we would use a visual metaphor that would have the form of an oval. The circumference of this oval would symbolise the peripheral areas of the country where the lowest scores in the national examinations are observed. A ‘plus’ sign added near the centre of the oval would symbolise the high scores observed in Athens. A ‘minus’ sign on the top of the oval would be a symbol of the alarmingly low achievement at ‘Pomakohoria’, the villages on the Rhodope Mountains. The trilingual secondary students in these visited villages and the governmental educational policies for this geographical area are examples of how education in Greece is being affected by location.
The second research question of the current study has examined the impact of a number of explanatory variables on vathmos porsvasis, the university access score. It has been found that some of the demographic characteristics of the school catchment areas, such as the size and the use of houses, and also the percentage of non-typical extended families, can reduce to a small but statistically significant degree the variance in the distribution of vathmos prosvasis. It has to be stressed, however, that even though our results do not contradict the well-known relationship between socioeconomic status and educational achievement, the risk of ecological fallacy (Firebaugh, 2010) has been of significant concern. For this reason, the coefficients that we present in Table 3 should not be seen as suggesting causal relationships between schools’ demographic characteristics and individual scores. On the other hand, the geographical autocorrelation indices and the simple ‘variance components’ statistics that we present do not entail such a risk.
In this study we have presented the map of the disparities in the Greek vathmos prosvasis, something that could inform the discussion on fairness in access to higher education in this country. ‘Maps help to present and decode immediate and practical answers to the perceived locations and relationships of persons, objects and perceptions in the social milieu’, according to Paulston and Liebman (1994: 215). Larsen (2009: 138) has similarly argued that ‘a map does not just chart, it unlocks and formulates meaning. It forms bridges … between disparate ideas that we did not know were previously connected’. The map of the disparities in vathmos prosvasis that we have presented, could help policy-makers to decode ‘immediate and practical answers’ in terms of fairness in access to higher education in Greece.
Finally, although from a theoretical perspective location does matter in geographically fragmented countries, our study should not be seen as an argument for the priority of geography in the study of educational inequalities at the expense of the classical large-scale sociological theories. Upon this, we subscribe to the view of Rees et al. (2007: 269) who have warned about ‘the simplistic conceptualizations of geography’ and the ‘obvious need to avoid the accusation of “spatial fetishism”, where spatially-specific outcomes are delineated in ways which obscure the reality of the social processes which underpin them’.
Footnotes
Declaration of conflicting interests
The author(s) declared no potential conflicts of interest with respect to the research, authorship, and/or publication of this article.
Funding
The author(s) disclosed receipt of the following financial support for the research, authorship and/or publication of this article: The present work was conducted as part of the ‘Thales’ programme, which aimed at fostering interdisciplinary research among Greek universities. ‘Thales’ was co-financed by the European Union (European Social Fund – ESF) and Greek national funds through the Operational Programme ‘Education and Lifelong Learning’ of the National Strategic Reference Framework (NSRF).