
Abstract
Literature on global international student mobility (ISM) highlights the uneven nature of student flows – from the developing to the developed world – however, studies have yet to address whether this pattern is replicated within expanding regional networks. Utilizing social network analysis, UNESCO ISM data, and World Bank income classifications, this paper examines economic inequality in ISM from 2008–2012 globally and within the Southern African Development Community, the European Higher Education Area, the Union of South American Nations, and University Mobility in Asia and the Pacific. Findings reaffirm previous global analyses which indicate that higher-income countries play a preeminent role as receivers; whereas, lower-income countries function primarily as source nations. This study demonstrates that this pattern is replicated fractally within the four regional networks as well. Globally and regionally, economically developed countries comprise the core of the world-system in tertiary education while less-developed nations are relegated to peripheral status.
Introduction
“The challenge is to recognise the complexities and nuances of the modern context and then seek to create a global academic environment that recognises the need to ensure that academic relationships are as equal as possible. Recognising inequality is the first step. The second is to create a world that ameliorates these inequalities” (Altbach, 2004: 24).
The number of degree-seeking, internationally mobile students has doubled since the beginning of the 21st century, from two million students in 2000 to approximately four million students in 2012 (UNESCO, 2015a). These students now comprise 1.8% of total global tertiary enrollment, a development that is unprecedented since medieval Europe (Altbach, 1998, 2004; UNESCO, 2015a). Yet, despite international student mobility’s (ISM) historical antecedents, it is more recently that the political, social, economic, cultural, scientific, and technological hallmarks of globalization have fueled the growth of the knowledge economy and elevated the role of the university as an engine of progress (Altbach, 1998, 2004; Altbach and Knight, 2007; Findlay, 2010; Knight, 2008). Students have responded by crossing national borders as consumers in search of an academic advantage and, in the process, have played a part in the internationalization of tertiary education (Knight, 2008; Perkins and Neumayer, 2014). This dynamic shift in ISM offers an important opportunity to assess how current student mobility flows operate and to explore ways in which these trends will impact the future of ISM in tertiary education.
Literature on ISM has also grown, mirroring the recent precipitous increase in student flows (e.g. Altbach, 1998, 2004; Gürüz, 2008; Knight, 2012; Shields, 2013; Streitwieser et al., 2012; Wei, 2012). Much of the research has touched on the uneven nature of global mobility patterns that indicate students primarily traverse from the developing to the developed world, though others have begun highlighting the rise in student mobility among developing nations (e.g. Altbach, 1998, 2004; Altbach and Knight, 2007; Findlay et al., 2011; Soudien, 2009; Tikly and Dachi, 2009; Waters and Brooks, 2010). What remains underexplored is whether economic inequality among sending and receiving nations in ISM exists not only on a global scale, but within established regional education networks as well. Utilizing social network analysis, UNESCO (2015b) ISM data, and World Bank income classifications, this study employs a world-systems perspective to critically examine economic inequality in ISM flows globally and within four regional education networks, comprising both developed and developing countries, from 2008–2012. The regional networks studied are: Southern African Development Community (SADC), European Higher Education Area (EHEA), Union of South American Nations (UNASUR), and University Mobility in Asia and the Pacific (UMAP). This study is unique in that it is the first to examine mobility flows in multiple regional tertiary education networks, which have been largely ignored in the literature. Additionally, this is one of few studies on ISM to employ social network analysis, a methodological tool designed for analyzing relationship patterns among actors that allows for a visual depiction of student movement. I also build upon the work done by Perkins and Neumayer (2014) who analyzed 105 sending and receiving nations, by incorporating 210 source countries and 134 destination countries in my global analysis to approximate a fully global picture of ISM.
The primary objectives of this paper are to: (1) better understand global and regional patterns of ISM within the developed and developing world; and (2) identify whether the patterns of economic inequality found in global student flows are found within regional tertiary education networks. Findings indicate that the hegemonic nature of ISM found at the global level is, in fact, replicated regionally. Developed and/or higher-income countries play a preeminent role in the regional networks as receivers; whereas, developing/lower-income countries function primarily as source nations. Illustrative of a fractal relationship among the global and regional networks, a repeating self-similar pattern of economic inequality is evident at both geographic scales. 1 This suggests that economically developed countries comprise the core of the world-system in tertiary education while less developed nations are relegated to peripheral status. This has created a dynamic which particularly undermines the explicit purpose of the regional networks – to support the economic and educational development of the whole. I begin with an overview of the research on three processes which have encouraged global ISM and facilitated uneven student movement, followed by the current landscape in regional ISM and a summary of the regional education networks included in this study. I then report the results which provide a new analysis of current trends in regional ISM and the ways in which these trends reflect well-researched inequalities in global ISM.
Catalysts of global international student mobility
“Not since the medieval period has such a large proportion of the world’s students been studying outside their home countries” (Altbach, 2004: 11). This second rise in “borderless education” has, in large part, stemmed from several interconnected processes, including: globalization; the evolution of the knowledge economy; and the massification of tertiary education (Middlehurst, 2001: 3). What is significant about these three phenomena and their impact on ISM is that each has played a role in increasing opportunity for mobility or served as an impetus. However, they have simultaneously constrained ISM through reinforcing uneven mobility patterns that benefit higher-income nations at the expense of the developing world.
Globalization refers to expansive and complex developments in politics, civic life, economics, culture, science, and technology that have touched every corner of tertiary education and must be addressed by university leaders in the modern era (Altbach, 2004; Furukawa et al., 2013; Knight, 2008; Rivza and Teichler, 2007). Technology, in particular, has had an important impact on ISM because the increasing ease of cross-border communication allows students to study virtually anywhere (Altbach, 2004; Gürüz, 2008). Yet, while opening opportunities for student mobility, globalization has equally contributed to a hegemonic world-system in tertiary education. Through facilitating a broader tertiary environment, globalization has encouraged student mobility patterns to become spatially uneven and reflect a dominant orientation toward the developed world (Perkins and Neumayer, 2014). In 2009 alone, 56% of internationally mobile students flowed from a developing to developed nation while less than 1% of ISM flows followed the reverse trajectory (Perkins and Neumayer, 2014). Research on ISM has identified several supply-side and demand-side factors that draw students (primarily from developing countries) to study, and perhaps stay, in developed nations (Altbach, 1998; Hazen and Alberts, 2006; Perkins and Neumayer, 2014). Drivers for ISM include: the value of an international degree; family expectations; access to globally-ranked tertiary institutions; opportunities to study in English; and the allure of an international experience.
Individual students have directly benefited from the educational opportunities offered at tertiary institutions in developed nations, which may garner them entry into a transnational capitalist class as well as an international career (Findlay, 2010; Findlay et al., 2011). Yet, where individual students have gained, the developing world has suffered through the loss of academic talent, known as “brain drain” (Altbach, 1998). Brain drain refers to skilled migration from developing countries, and it can have far-reaching impacts on economic and educational growth (Lowell et al., 2004; Solimano, 2008). In fact, estimates suggest that 30–50% of the developing world’s science, technology, engineering and mathematics-educated population resides in a developed nation (Lowell et al., 2004). The migration literature has also introduced the concept of “brain circulation” to underscore that the movement of people and knowledge is not always unidirectional and permanent (Knight, 2012; Lowell et al., 2004). Internationally mobile students can positively influence the economy in their country of origin through skills transfer upon return, or by creating opportunities for innovation and transnational cooperation from abroad (Han et al., 2015; Ruiz, 2014). However, researchers have noted that brain circulation may be a euphemistic term serving to normalize what the developing world ultimately experiences as a “net brain loss” (Ackers, 2005; Knight, 2012: 28).
As universities are increasingly compelled to operate within this globalized world they are also ushered into an international race for the “best and brightest” as a means of gaining institutional prestige; a “global battle for talent” (Gürüz, 2008; Hazelkorn, 2009: 79; Portnoi et al., 2010: 2). Rather than labor or capital, the economy of the 21st century is dependent on education; therefore, tertiary institutions play a fundamental role in economic growth (Brown and Lauder, 2006; Gürüz, 2008; Robertson, 2005). In the knowledge economy, development, growth, and competitiveness are driven by knowledge and its acquisition (Gürüz, 2008). Economic and social spheres trade in information rather than commodities (Shields, 2013). However, the demand for knowledge lends itself to the creation of a hierarchical system at the expense of the developing world because elite technical and specialized education and well-financed infrastructure draw students to “world class universities” in developed nations (Altbach, 2004; Portnoi et al., 2010; Rivza and Teichler, 2007; Salmi, 2009; Shields, 2013). The resultant uneven flow of internationally mobile students has serious economic and developmental consequences in both the short- and long-term. In the short-term, students channel billions of dollars in tuition and living expenses out of developing nations and into developed economies through the process of ISM (Siegmund, 2009). In the long-term, internationally mobile students may opt to build their careers in developed nations, undermining tertiary systems, economies, and human capital development in the developing world (Altbach, 1998; Knight, 2012).
Encouraged by both globalization and the more recent development of the knowledge economy is the massification of tertiary education. Between 1900 and 2000 the number of students enrolled in tertiary education grew from 500,000 to 100 million; this represents an increase in attendance from less than 1% to 20% of the world’s college-aged population (Schofer and Meyer, 2005). However, the massification of tertiary education began in earnest worldwide following World War II and has been the most important trend in tertiary education globally despite political, economic, and educational differences among nations (Altbach, 1998; Barnett and Wu, 1995). Inextricable from the massification of tertiary education is the rise in competition. Modern societies demand a highly-skilled workforce, and tertiary institutions have been charged with policing access into esteemed occupations through examinations, rigorous training, and conferring certification upon completion (Altbach, 1998; Middlehurst, 2001). Thus, the massification of tertiary education has led to the requirement of additional “sorting mechanisms” as a greater number of students compete for the limited number of spaces at the top of the knowledge pyramid in any given occupation (Altbach, 1998: 9; Ilon, 2010). This “means that the world’s best and brightest go shopping internationally” and tertiary institutions compete by providing high quality educational opportunities (Gürüz, 2008; Ilon, 2010: 22). Those institutions that have historically been able to compete in this marketplace of talent have been the leading research universities situated in the developed world (Altbach, 2004).
Globalization, the evolution of the knowledge economy, and the massification of tertiary education have all served as push–pull factors in the growth of global ISM. Students are pushed by the need to acquire specialized training offered by research institutions in order to compete in the knowledge economy amidst the growing university-educated workforce. They are pulled to the developed world by brand name, or “superbrand,” universities and the educational opportunities they afford (Morgan, 2011: para. 4). Beyond these macro-level global processes, a second major development in ISM has been the relatively recent growth in regional ISM and the creation of regional education networks. The remainder of this paper serves to contribute to this emergent regional conversation and link regional processes to established global patterns.
Regional international student mobility
Though the United States, the United Kingdom, France, Australia, and Germany remained the top destinations for internationally mobile students in 2012, their share of ISM flows has declined from 55% to 47% over the last decade due to the growth in popularity of regional mobility (UNESCO, 2015a). Remaining within the region is emerging as a preferred option for internationally mobile students primarily due to cost and cultural familiarity (Knight, 2008; UNESCO, 2015a). However, the current literature on regional mobility is narrow and primarily examines country dyads or triads, explores short-term credit rather than long-term degree mobility flows within the European Region Action Scheme for the Mobility of University Students (ERASMUS) program or European Union, or illustrates how individual countries are engaged in the process of becoming regional education hubs (Collins, 2008; Didelon and Richard, 2012; Gillespie, 2009; Knight, 2011; Rivza and Teichler, 2007; Shields and Edwards, 2010; Souto-Otero et al., 2013; Stetar et al., 2010; Wong and Wen, 2013; Yoon et al., 2013). Research has yet to examine mobility patterns within established regional networks comprised entirely of developing countries or to determine if there are trends in ISM flows among multiple regions. Given the growth in regional student mobility and the shortcomings of the current literature, this study examines four regional networks (SADC, EHEA, UNASUR, and UMAP) which are located in various areas of the world and comprise both developed and developing nations to ascertain whether the core–periphery patterns in sending and receiving relationships research has indicated are evident in global ISM are fractally represented at a regional geographic scale.
The SADC is an economic and educational consortium comprising Angola, Botswana, Democratic Republic of the Congo, Lesotho, Malawi, Mauritius, Mozambique, Namibia, Seychelles, South Africa, Swaziland, Tanzania, Zambia, and Zimbabwe. ISM within the SADC is meant to facilitate the “human resource development needs of the region, which is critical if the [SADC] is to become a major social and economic development bloc” (Ministry of Education, 2001: 30; Tikly and Dachi, 2009). Additionally, student mobility within the SADC exposes students to the diverse ideologies embraced by the people and the countries within the SADC (Ministry of Education, 2001). Member nations are encouraged to reserve a minimum of 5% of their places in tertiary education for students from other SADC countries and recently, students in the SADC have become one of the most mobile cohorts in the world (SARUA, 2011; UNESCO, 2012).
The EHEA comprises the following member states: Albania; Andorra; Armenia; Austria; Azerbaijan; Belgium; Bosnia and Herzegovina; Bulgaria; Croatia; Cyprus; Czech Republic; Denmark; Estonia; Finland; France; Georgia; Germany; Greece; Holy See; Hungary; Iceland; Ireland; Italy; Kazakhstan; Latvia; Liechtenstein; Lithuania; Luxembourg; Malta; Moldova; Montenegro; Netherlands; Norway; Poland; Portugal; Romania; Russia; Serbia; Slovakia; Slovenia; Spain; Sweden; Switzerland; the Former Yugoslav Republic of Macedonia; Turkey; Ukraine; and the United Kingdom. Formalized in 1999 through the Bologna Declaration, the Bologna Process initiated a more integrated European tertiary education system and laid the groundwork for a regional network, through encouraging broad recognition of degree qualifications, improved quality assurance among programs, and a transferable credit system – the European Credit Transfer and Accumulation System (EHEA, 2014). In 2010, the EHEA was established as part of the tenth anniversary of the Bologna Process and strives to continue the development of more “comparable, compatible, and coherent” tertiary systems across Europe to improve student mobility and cross-border employability (EHEA, 2014: para. 2). Resultantly, ISM in Europe has become “highly regional and less ‘international’” than in other parts of world (Teekens, 2014: 1). Eighty-three percent of internationally mobile students from the EHEA stay in the region as opposed to 17% who choose to study outside of it (Teekens, 2014).
Created in 2008, UNASUR established the South American Council for Education, Culture, Science, Technology, and Innovation, which has since been subdivided into three units, one of which is the South American Council of Education. These councils have worked to improve integration, equity, and participation in tertiary education throughout the region, and to better facilitate student and faculty mobility (Riggirozzi, 2012; UNASUR, 2016). First steps for UNASUR have been proposals on the creation of a system for improving university quality, developing an institutional network to provide scholarships, and universal recognition of accreditation systems among participating nations (Perrotta, 2016). Though UNASUR’s initiatives are primarily in the proposal phase, a sub-regional network, MERCOSUR, has an educational division that has been in operation since 1991, which has focused on quality assessment, qualification recognition, a credit transfer system, and the growth of a regional mobility cooperative (Perrotta, 2016). A number of the participating countries in UNASUR are members of MERCOSUR which has resulted in the integration of many MERCOSUR goals within the larger UNASUR’s agenda and highlights the region’s long-term efforts toward increasing student mobility. Member countries of UNASUR are: Argentina; Bolivia; Brazil; Chile; Colombia; Ecuador; Guyana; Paraguay; Peru; Suriname; Uruguay; and Venezuela.
Lastly, UMAP is comprised of the following member states: Australia; Bangladesh; Brunei Darussalam; Cambodia; Ecuador; Fiji; Hong Kong; India; Indonesia; Japan; Kazakhstan; South Korea; Macao; Malaysia; Mexico; Mongolia; Papua New Guinea; Philippines; Reunion Island; Samoa; Taiwan; Thailand; and Vietnam. 2 UMAP was founded in 1993 as a voluntary association meant to enhance international understanding through the promotion of student and staff mobility in the region (UMAP, 2016). There are currently over 400 participating universities throughout the member nations (UMAP, 2016). Students participating in a UMAP exchange have the option to study in the host country for up to a full academic year (two semesters), their tuition fees at the host university are waived, and the credit they earn is accepted at their home institution based on the UMAP Credit Transfer Scheme (UMAP, 2016).
World-systems perspective
The world-systems perspective is a critical strategy for explaining the organization of flows of capital and labor in the global economy (Wallerstein, 2004). World-systems, which has Marxist roots, focuses on how the unequal nature of the global economy serves a fundamental purpose of domination. Part of the world-systems perspective, the core–periphery hierarchy, argues that the core benefits from their stronger economic position through the ability to monopolize the production of highly profitable commodities and trade in a manner that funnels surplus value from the periphery into developed economies. The periphery, on the other hand, produces less profitable goods and is vulnerable to “plunder,” or the extraction of valuable resources by the core (Wallerstein, 2004). Though plunder is “self-liquidating” it leads to immense short-term gains for the core and consequences that are not felt until the mid-term, so its use as a medium through which to maintain global influence is felt even in the modern world-system (Wallerstein, 2004: 28). In the world-systems perspective, the core and periphery are defined as systems of production; however, researchers have utilized these terms to highlight core–periphery relationships among other entities, such as nations and institutions, because they house the economic actors who engage in the global economy (Clayton, 2004; Wallerstein, 2004).
World-systems has a particularly appropriate application in conceptualizing the inherent hierarchy of the global tertiary system and the role developing and developed nations play as senders and receivers in ISM flows, respectively. Dominant, world-class universities most often located in developed nations control the production and dissemination of knowledge; provide leadership in research, teaching, and institutional organization; benefit from their location in wealthier countries through well-funded infrastructure (e.g. libraries, laboratories); enjoy more academic freedom; and are home to highly-qualified staff, professors, and students (Altbach, 1998, 2004). The tertiary systems of developing nations are often entirely composed of peripheral teaching institutions and they rely on core universities in developed nations for research and training (Altbach, 1998, 2004). Furthermore, this structure of dominance is beginning to permanently embed itself in the global tertiary system. As Altbach notes, “It is now more difficult to become a major player in international higher education…the price of entry has risen…universities in countries without deep financial resources will find it virtually impossible to join the ranks of the top academic institutions” (Altbach, 2004: 8).
The core–periphery dynamic among the world’s tertiary institutions has impacted ISM in significant ways. Internationally mobile students flow primarily from developing to developed nations and many choose not to return upon degree completion, opting instead to build a career in the destination country (Altbach, 2004). The loss of academic talent from the developing world weakens their tertiary systems; yet, it is promoted by core universities which seek to harbor the world’s leading scholars (Altbach, 2004). “In this way, the developing world has helped [developed nations] to maintain [their] already overwhelming lead in science and scholarship” (Altbach, 2004: 15). Thus, the hegemonic nature of ISM mirrors the world-systems perspective on the global economy. Core nations have monopolized productive control of the profitable commodities – core universities – and further exacerbate their dominance through extracting students from the developing world, thereby securing continued global influence.
Two critiques of world-systems theory have centered on the unit of analysis – the global economy – and the tenet that economies and systems influence human development, since this may serve to undervalue the role of individual agency (Petras, 1981; Wallerstein, 2004; Worsley, 1980). The first critique, focused on the unit of analysis, is offered by intellectual bodies (e.g. positivists, orthodox Marxists, and state autonomists) who believe that nations should serve as foci rather than the world system (Wallerstein, 2004). In fact, recent research and the findings of this paper appear to support the idea that individual countries do not solely stimulate uneven ISM patterns, but rather each nation’s position within the international economic system, and the associated advantages or disadvantages aligned with that position, create the hierarchical core–periphery pattern (Perkins and Neumayer, 2014). Depicting how this pattern influences ISM is best accomplished when viewed through a lens of transnational economic inequity, suggesting that the push–pull factors of globalization, the knowledge economy, and the massification of tertiary education have an overarching effect on student movement beyond what is occurring within any singular nation. The second critique leveled at world-systems theory questions where human agency resides within the influence of the global economic system. Though it can be argued that internationally mobile students are making individualized decisions when choosing to complete their degree overseas, it would be difficult to assert that these decisions are not affected by global processes. Research has indicated that many internationally mobile students flow toward world-class universities in core countries because they are drawn by brand name institutions and the educational opportunities they afford (Altbach, 2004; Morgan, 2011; Portnoi et al., 2010; Rivza and Teichler, 2007; Salmi, 2009; Shields, 2013). The prestigious positions these universities occupy on a global level are possible because a world system exists in which nations hold unequal economic power and, as a result, unequal tertiary education offerings. This discrepancy is the context in which ISM occurs and student decisions are made.
Data and methods
The following two research questions guided the construction of the social networks and the analysis of the results in this study:
What patterns exist among all countries participating in ISM relative to the income classification of the countries where students are from and the income classification of the countries where students go?
What ISM income classification-related patterns emerge specifically among countries in the SADC, EHEA, UNASUR, and UMAP regional networks?
Data
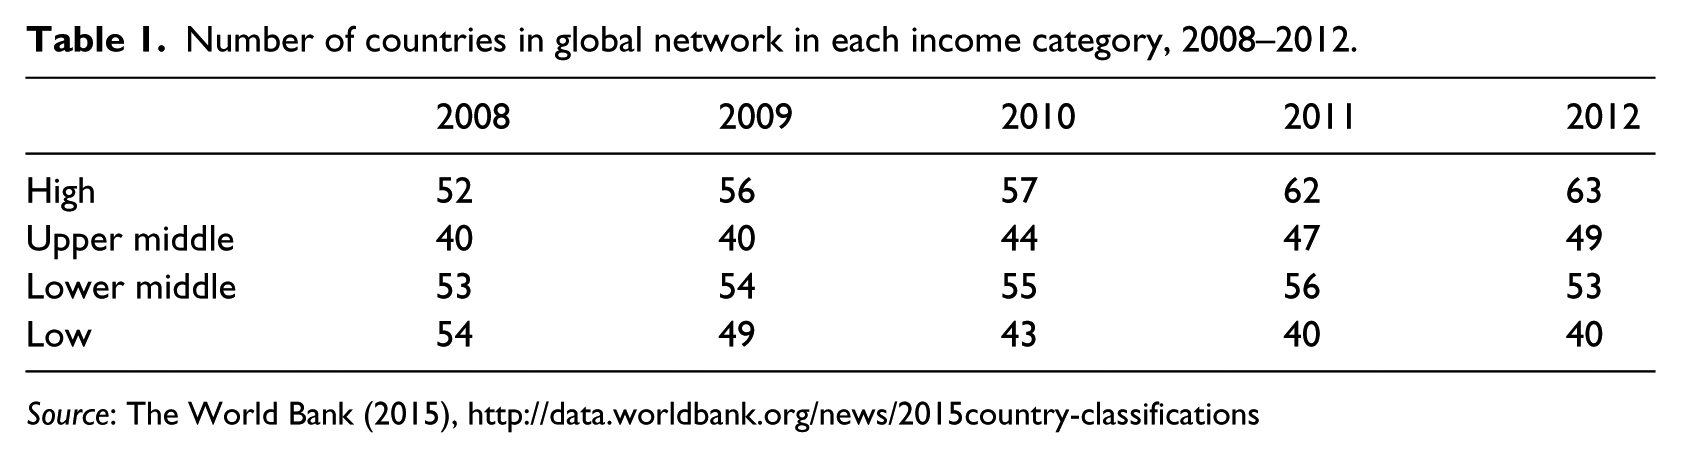
Data stemmed from publicly-available information on the global flow of tertiary-level students provided by UNESCO (2015b). All countries with available data from 2008–2012 3 were included in the global analysis; this was 210 source countries and 134 destination countries. The member countries of the SADC (15), the EHEA (47), the UNASUR (12), and UMAP (19) were included in the regional analyses. Data for the regional networks also spanned the years from 2008–2012 and was sourced from UNESCO (2015b). UNESCO (2015a) defines ISM, or internationally mobile students, as those who have crossed an international border between two countries to study. These students are not residents or citizens of the country in which they are studying. Additionally, UNESCO (2015a) only provides counts for those students who are degree-seeking meaning that they are not enrolled for short-term, for-credit study and exchange programs that are less than a full school year. Country income classifications were from the World Bank. The World Bank (2015) sorts all member economies and economies with populations over 30,000 into four income categories (low, lower middle, upper middle, and high) based on estimates of gross national income per capita for the previous year. 4 For convenience in reporting and analysis, The World Bank (2015) labeled all low- and middle-income counties as “developing” and high-income countries as “developed.” These categorizations were used for this study. However, it is important to note that countries labeled as developing are not all experiencing similar levels of development nor is any preferred, final stage of development indicated (World Bank, 2015).
Tables 1 and 2, provide an overview of how many countries in the global and regional networks fall into each of the four income categories from 2008–2012. Countries without an income classification from the World Bank are not represented in the tables. This included 11 countries who reported no incoming students and reported sending 69,563 students over the five years, which was less than 1% of the total number of internationally mobile students from 2008–2012. Gibraltar, Turks and Caicos Islands, and Tuvalu were the only three countries out of the eleven that were assigned an income category at some point during 2008–2012 and are included in the global network table for those years (2011 and 2012).
Number of countries in global network in each income category, 2008–2012.
Number of countries in regional networks in each income category, 2008–2012.
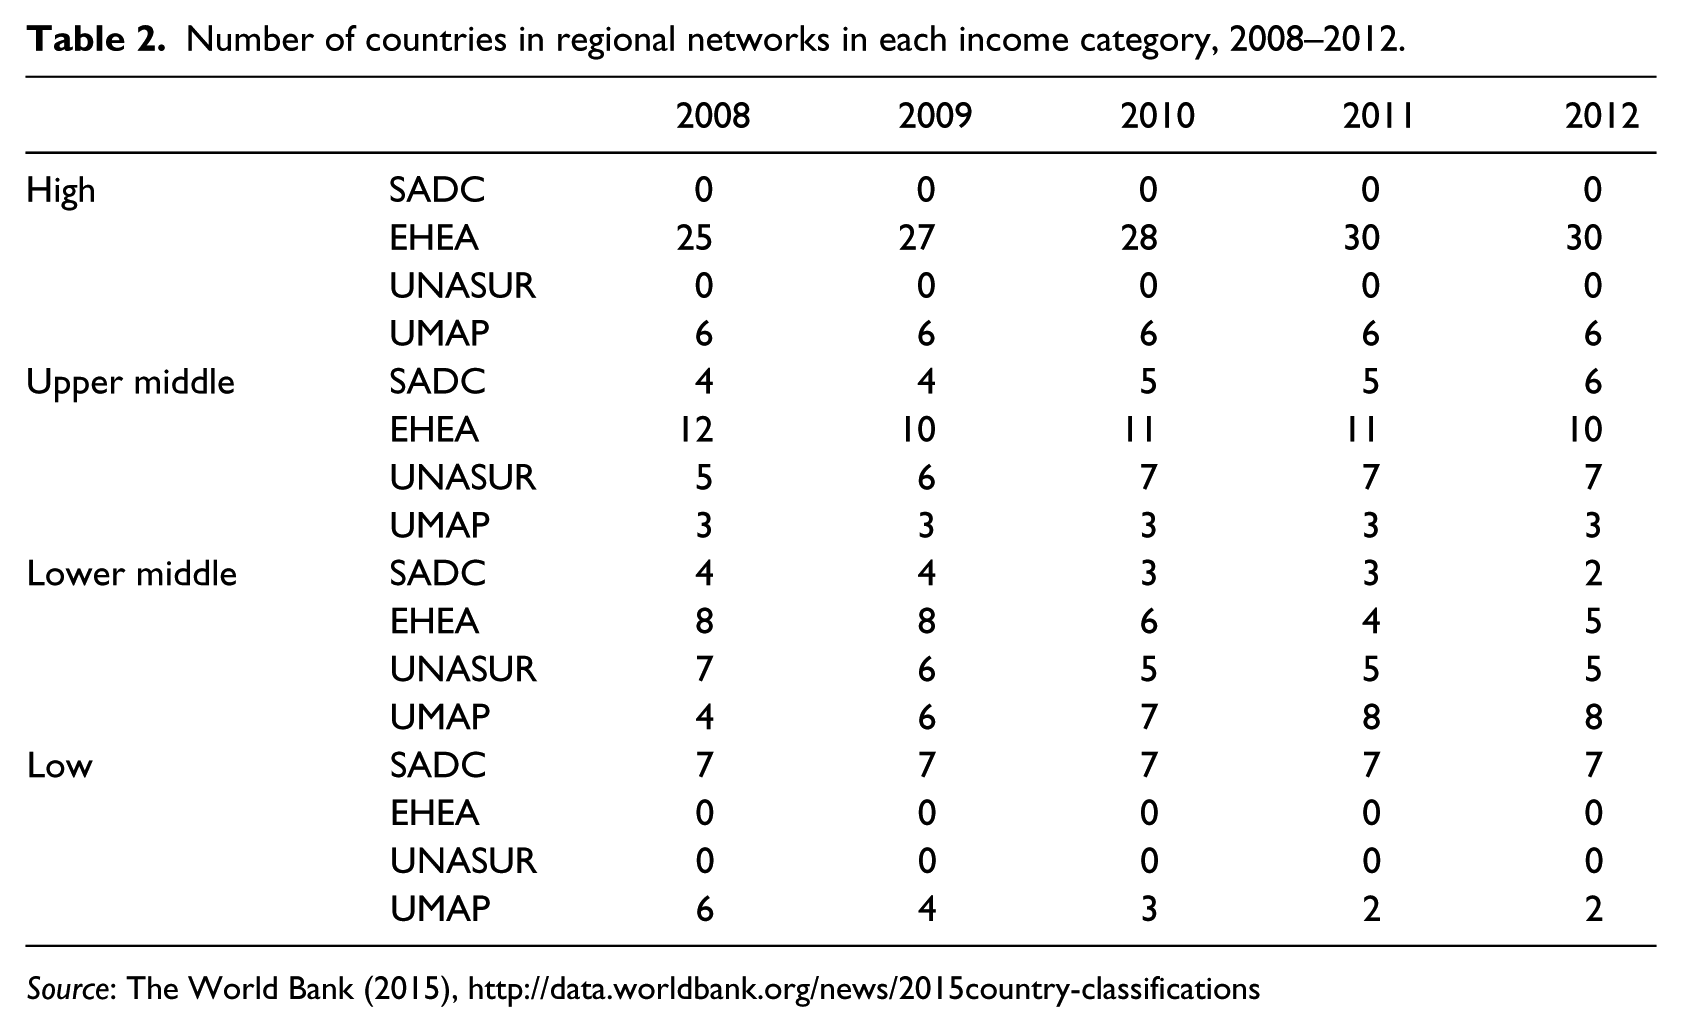
From 2008–2012, the number of high-income countries increases globally while the number of low-income countries decreases, but during each of these five years every income classification accounts for between 20–30% of the total number of countries in the global network. In the following section however, the results will illustrate that global student destination flows among countries within the four different income categories do not match this pattern. Rather, higher-income countries receive the vast majority of internationally mobile students. Among the regional networks, income categories remain fairly stable. Yet, similar to the global network, the results will show that high- and upper middle-income nations receive the greatest number of internationally mobile students in their respective regions even though they comprise the minority of countries in two out of the four regional networks.
Methods
Social network analysis is a quantitative application of graph theory that examines relationships among social actors (Carrington and Scott, 2011). Therefore, social network analysis can be an effective tool for exploring how ISM flows shape the “relational positioning” of countries within an education network (Shields, 2013: 617). All social network graphs in this analysis are directed; that is, relationships are one-directional (e.g. Canada may be sending students to the United States but the United States may not be sending students to Canada). All network analysis was completed in both Pajek 3 and Gephi 0.8.2, which are nonproprietary network analysis software programs available on the Internet. The social networks were visualized in Tableau, proprietary data analytics software. 5 ISM data have a few limitations. Counts of internationally mobile students are often underestimated due to differences in reporting techniques and ways of identifying and defining the population (Shields, 2013). Additionally, not every country provides data on the number and origin of incoming students.
Results
I present the results in two sections. Section one examines the global ISM network for the years 2008–2012. Section two explores trends within the regional education networks over the same five-year period. Each section includes social network analysis measures of density and average degree in order to highlight broad trends in network connectivity over time in addition to visualizations of each network that illustrate sending and receiving patterns in relationship to country income classifications. The paper concludes with a discussion section which examines how the hegemonic core–periphery relationship exhibited between higher-income and lower-income nations in the global network is fractally represented within the regional networks as well.
The global network
In social network analysis, density is a proportion that represents the number of present connections in a network relative to the total possible connections in a network of the same size (de Nooy, 2011; Shields, 2013). In Gephi 0.8.2 a graph that is maximally dense has all possible ties and a density score equal to 1. An ISM network that grows denser over time is realizing a greater number of possible ties between countries and more equality in sending and receiving relationships between nations in the network (Shields, 2013). A network that remains stagnant or exhibits decreasing density is one in which countries are solidifying their positions as either senders or receivers and students are becoming isolated on a decreasing number of paths between nations participating in the network (Shields, 2013). These networks demonstrate less equitable relationships.
Average degree reflects the mean number of connections per country in the network (de Nooy et al., 2011). A measure of structural cohesion, low average degree is demonstrative of a poorly connected network and over time this indicates little growth in the number of ties between countries. Conversely, high average degree indicates a greater number of connections between countries and a denser network. 6 Figures 1 and 2 track the density and average degree of the global network from 2008–2012, respectively. Findings indicate that from 2008–2011, the density of the global network increased incrementally which suggests a growing number of connections between nations. This means that not only was the number of students participating in the global network increasing at this time, but also the number of pathways on which these students flowed was similarly rising. Though at its highest value the density of the global network in 2011 measured 0.174, which means only 17% of the potential paths were present and highlights the fact that the global network is weakly connected with numerous unrealized ties. While this is due in part to the fact that the global network is relatively large meaning that the number of potential ties is equally significant, it does reveal that students in the network are traversing very few of the potential connections between nations. From 2011–2012, the density of the global network decreases slightly, which may indicate that the network is beginning to stabilize and that students will remain concentrated on the ties that have already been realized. The relatively low density of the global network and its stabilization or potential decline align with the literature on uneven mobility patterns and world-systems perspective, which both underscore the primarily unidirectional movement of internationally mobile students from the developing to the developed world; from the periphery to the core. A global ISM network in which students were dispersed across the range of pathways between potential source and destination countries would exhibit higher density and an increase in this measure over time as a greater number of potential connections were continuously actualized (Shields, 2013).
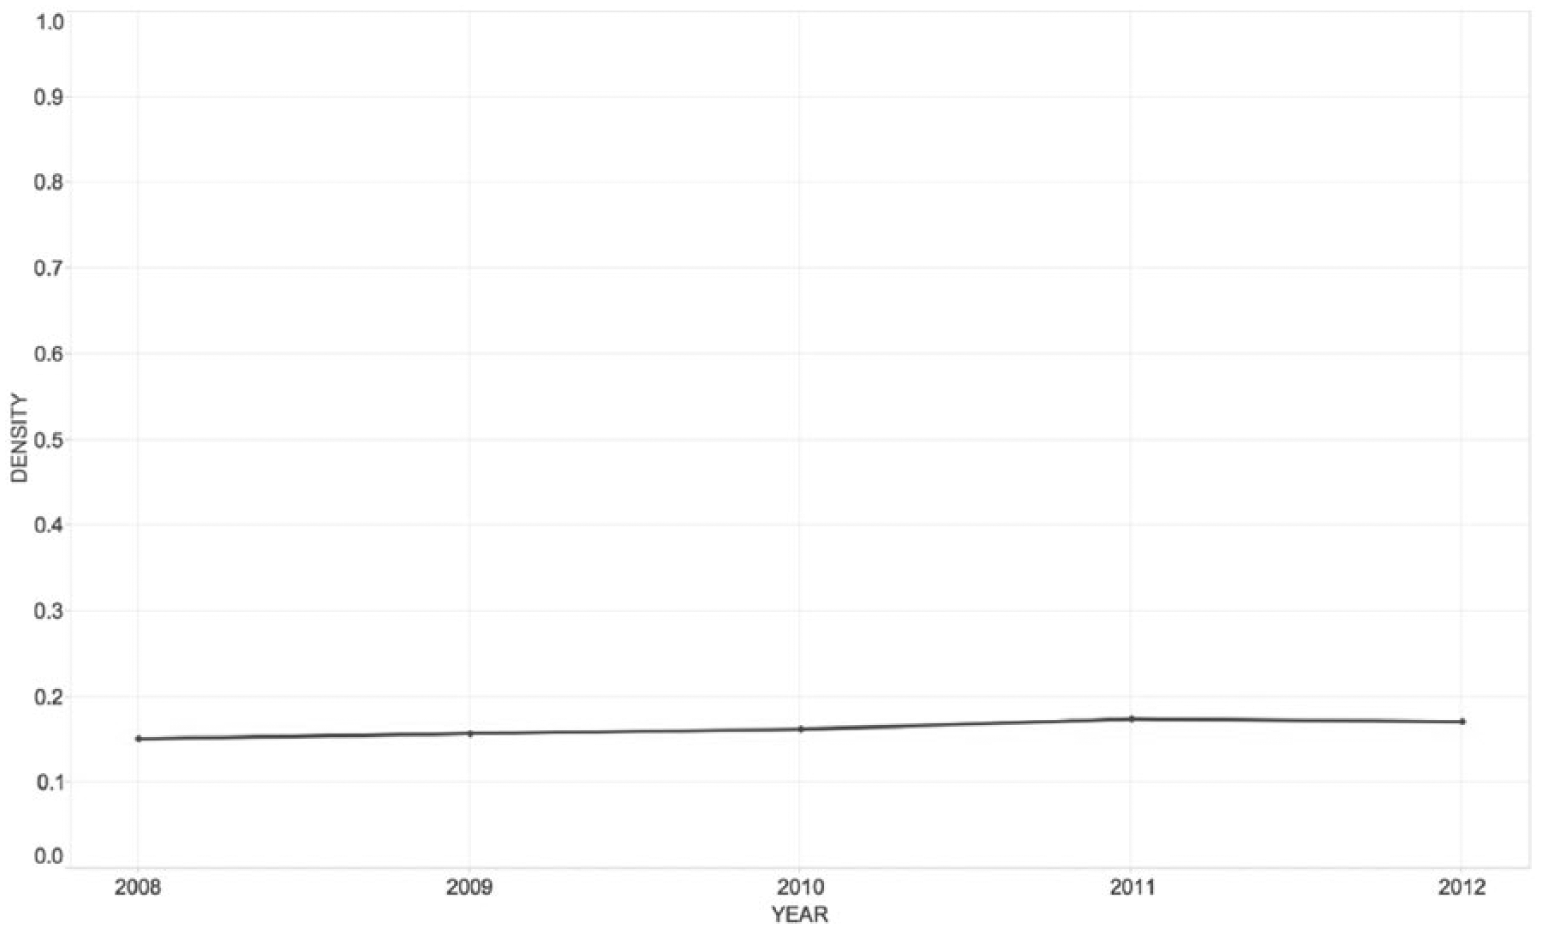
Global network density, 2008–2012.
Global network average degree, 2008–2012.
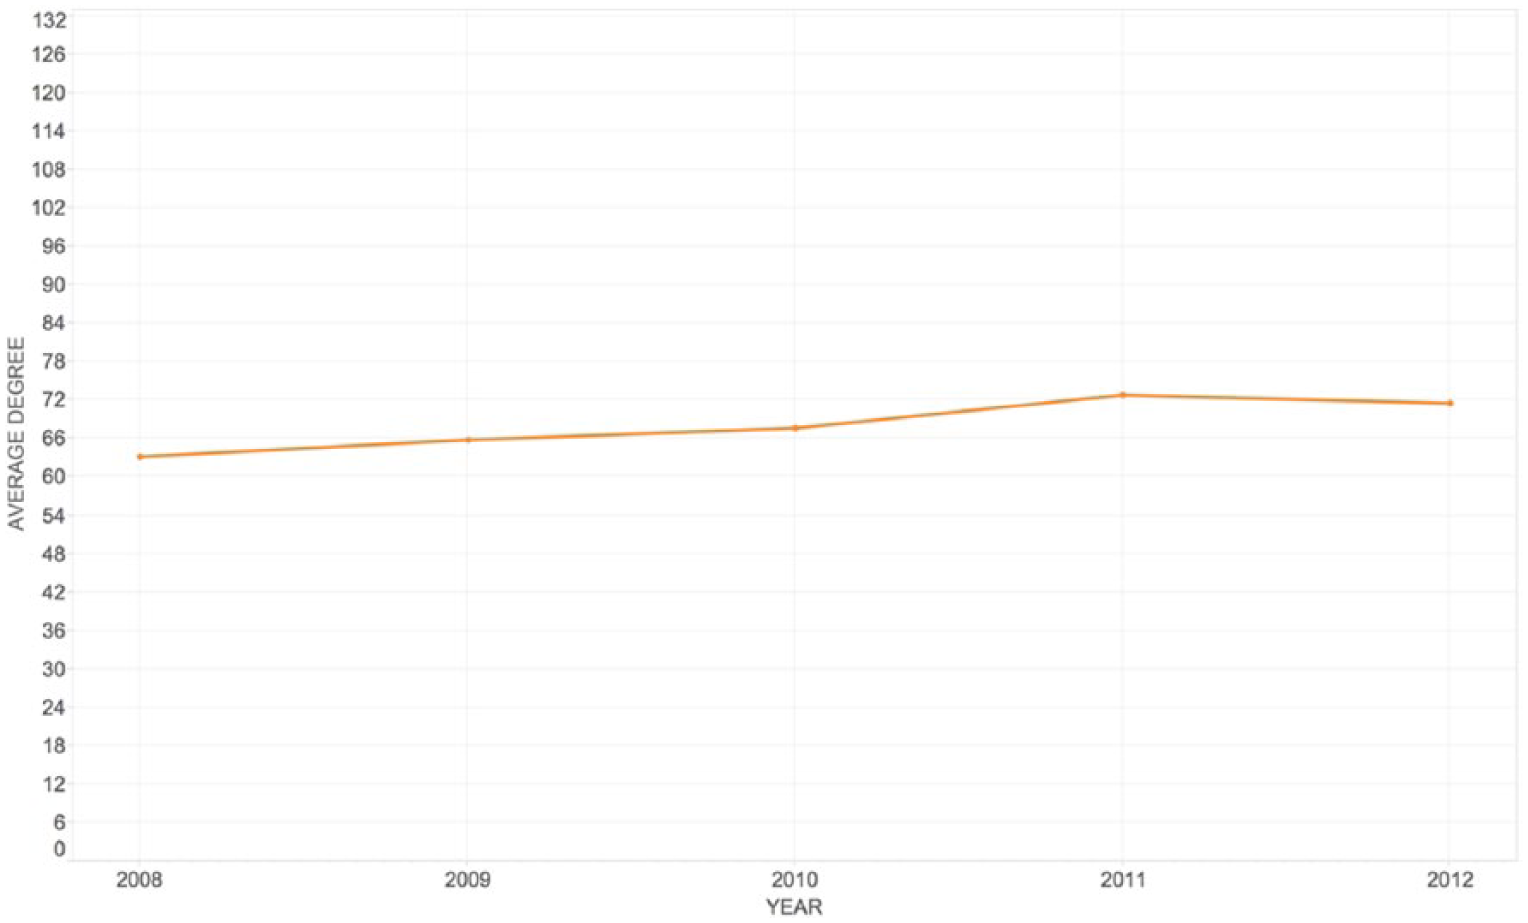
The average degree of a network is related to its density measure. A greater mean number of connections per country in an ISM network corresponds to a higher percentage of realized connections out of all possible ties. The average degree of countries in the global ISM network rises from 2008–2010 and, similar to the network’s density reaches its peak in 2011 and declines in 2012. The highest measure of average degree for the global network is a mean of 73 ties per nation. The global network analysis included 210 source countries and 134 destination countries. Accounting for only the 134 destination countries, a network of that size would be maximally dense, if all countries were engaged in a relationship of sending and receiving students from one another, at 17,822 realized connections. Therefore, an average degree of 73 for the global ISM network is not only low, but likely indicative of internationally mobile students flowing primarily from lower-income nations to higher-income nations. A large number of unrealized connections between countries and a low mean number of ties per nation support this critical framing of the global network.
In addition to measures of overall network connectivity, visualizations of ISM destination and source patterns by income aid in illustrating whether flows in the global network are uneven. Figure 3 7 depicts how many of the total number of internationally mobile students in the global network went to countries categorized in each of the four World Bank (2015) income classifications (low, lower middle, upper middle, and high). Low-, lower middle-, and upper middle-income countries are all classified as developing; whereas, high-income countries are considered developed (World Bank, 2015). The pattern of student movement in the global network over this five-year period is clear. Students flow overwhelmingly toward developed nations followed progressively by each lower income classification with low-income nations receiving the smallest proportion of internationally mobile students. From 2008–2012, high-income nations received between 81–87% of the total number of internationally mobile students. Low-income nations saw only 1% of global student mobility flows during these five years.
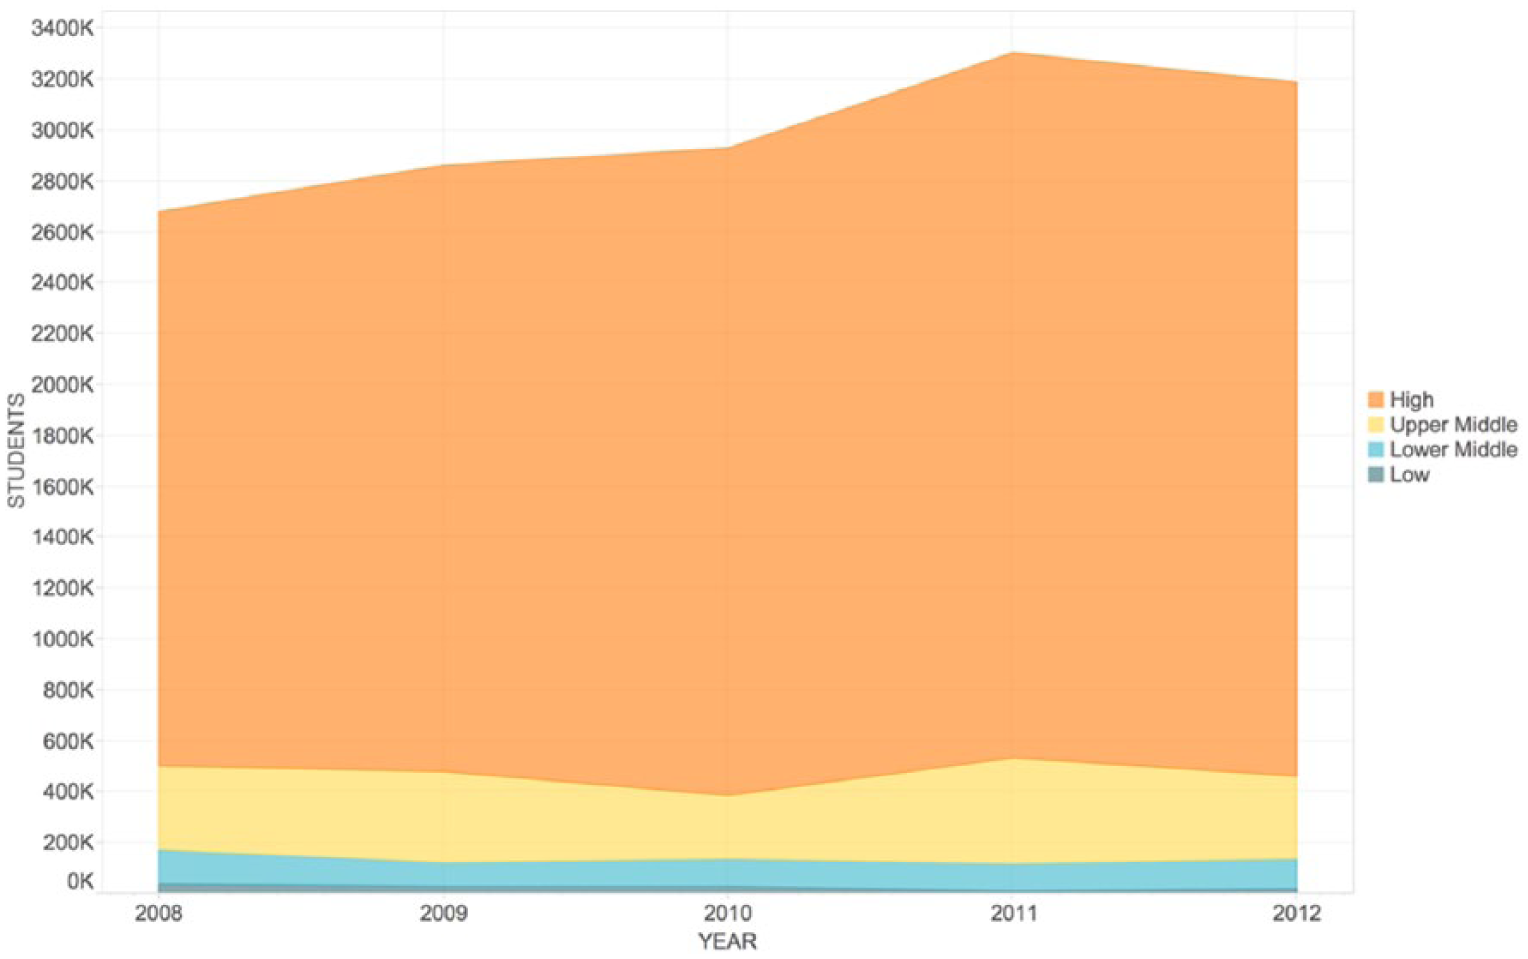
Global international student mobility destination patterns by income level, 2008–2012.
Figure 4 is a visualization of the number of students in the global ISM network that come from countries within each of the four income classifications. Though the majority of students arrive in high-income countries, internationally mobile students originate in larger numbers from nations in each of the four income categories. This means that developed nations play a significant role in the global network as both source and destination countries while peripheral, developing nations are subject to plunder, or the extraction of valuable resources, in the tertiary education world-system. Through ISM, low-, lower middle-, and upper middle-income nations experience academic and economic divestment during students’ time to degree and perhaps beyond, that may inhibit national development (Knight, 2012; Siegmund, 2009). Table 3 lists the top 20 destination and source countries in the global ISM network in addition to the number of incoming or outgoing students. A reflection of Figures 3 and 4, what is evident in Table 1 is that the top destination countries are high-income, developed nations and the top source countries exhibit more diffusion among the differing income categories.
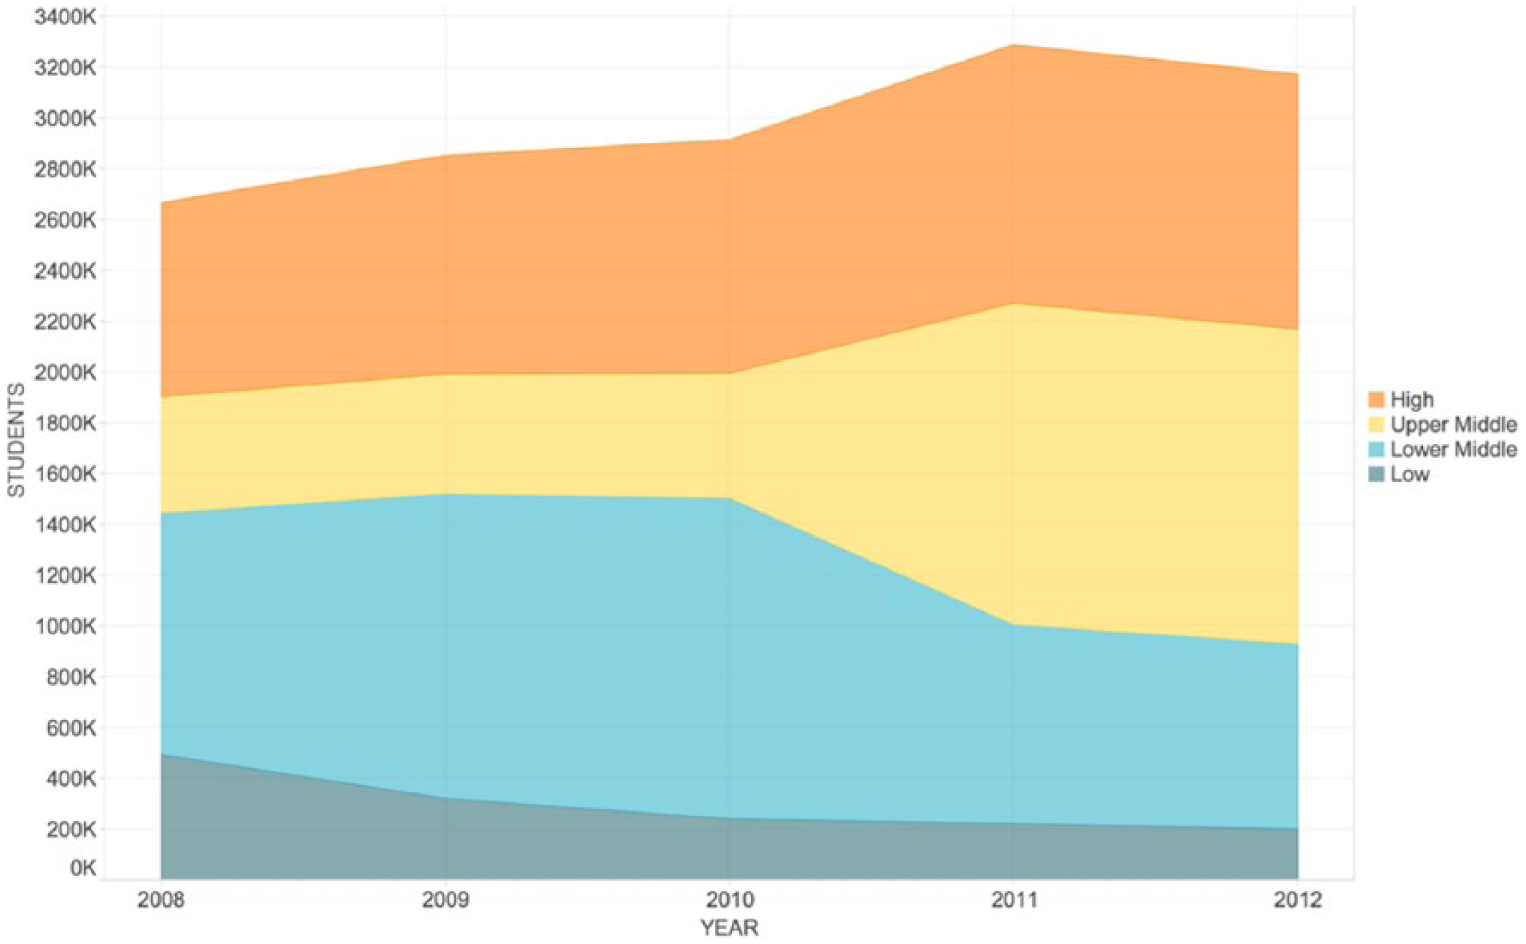
Global international student mobility source patterns by income level, 2008–2012.
Top 20 destination and source countries globally, 2008–2012.
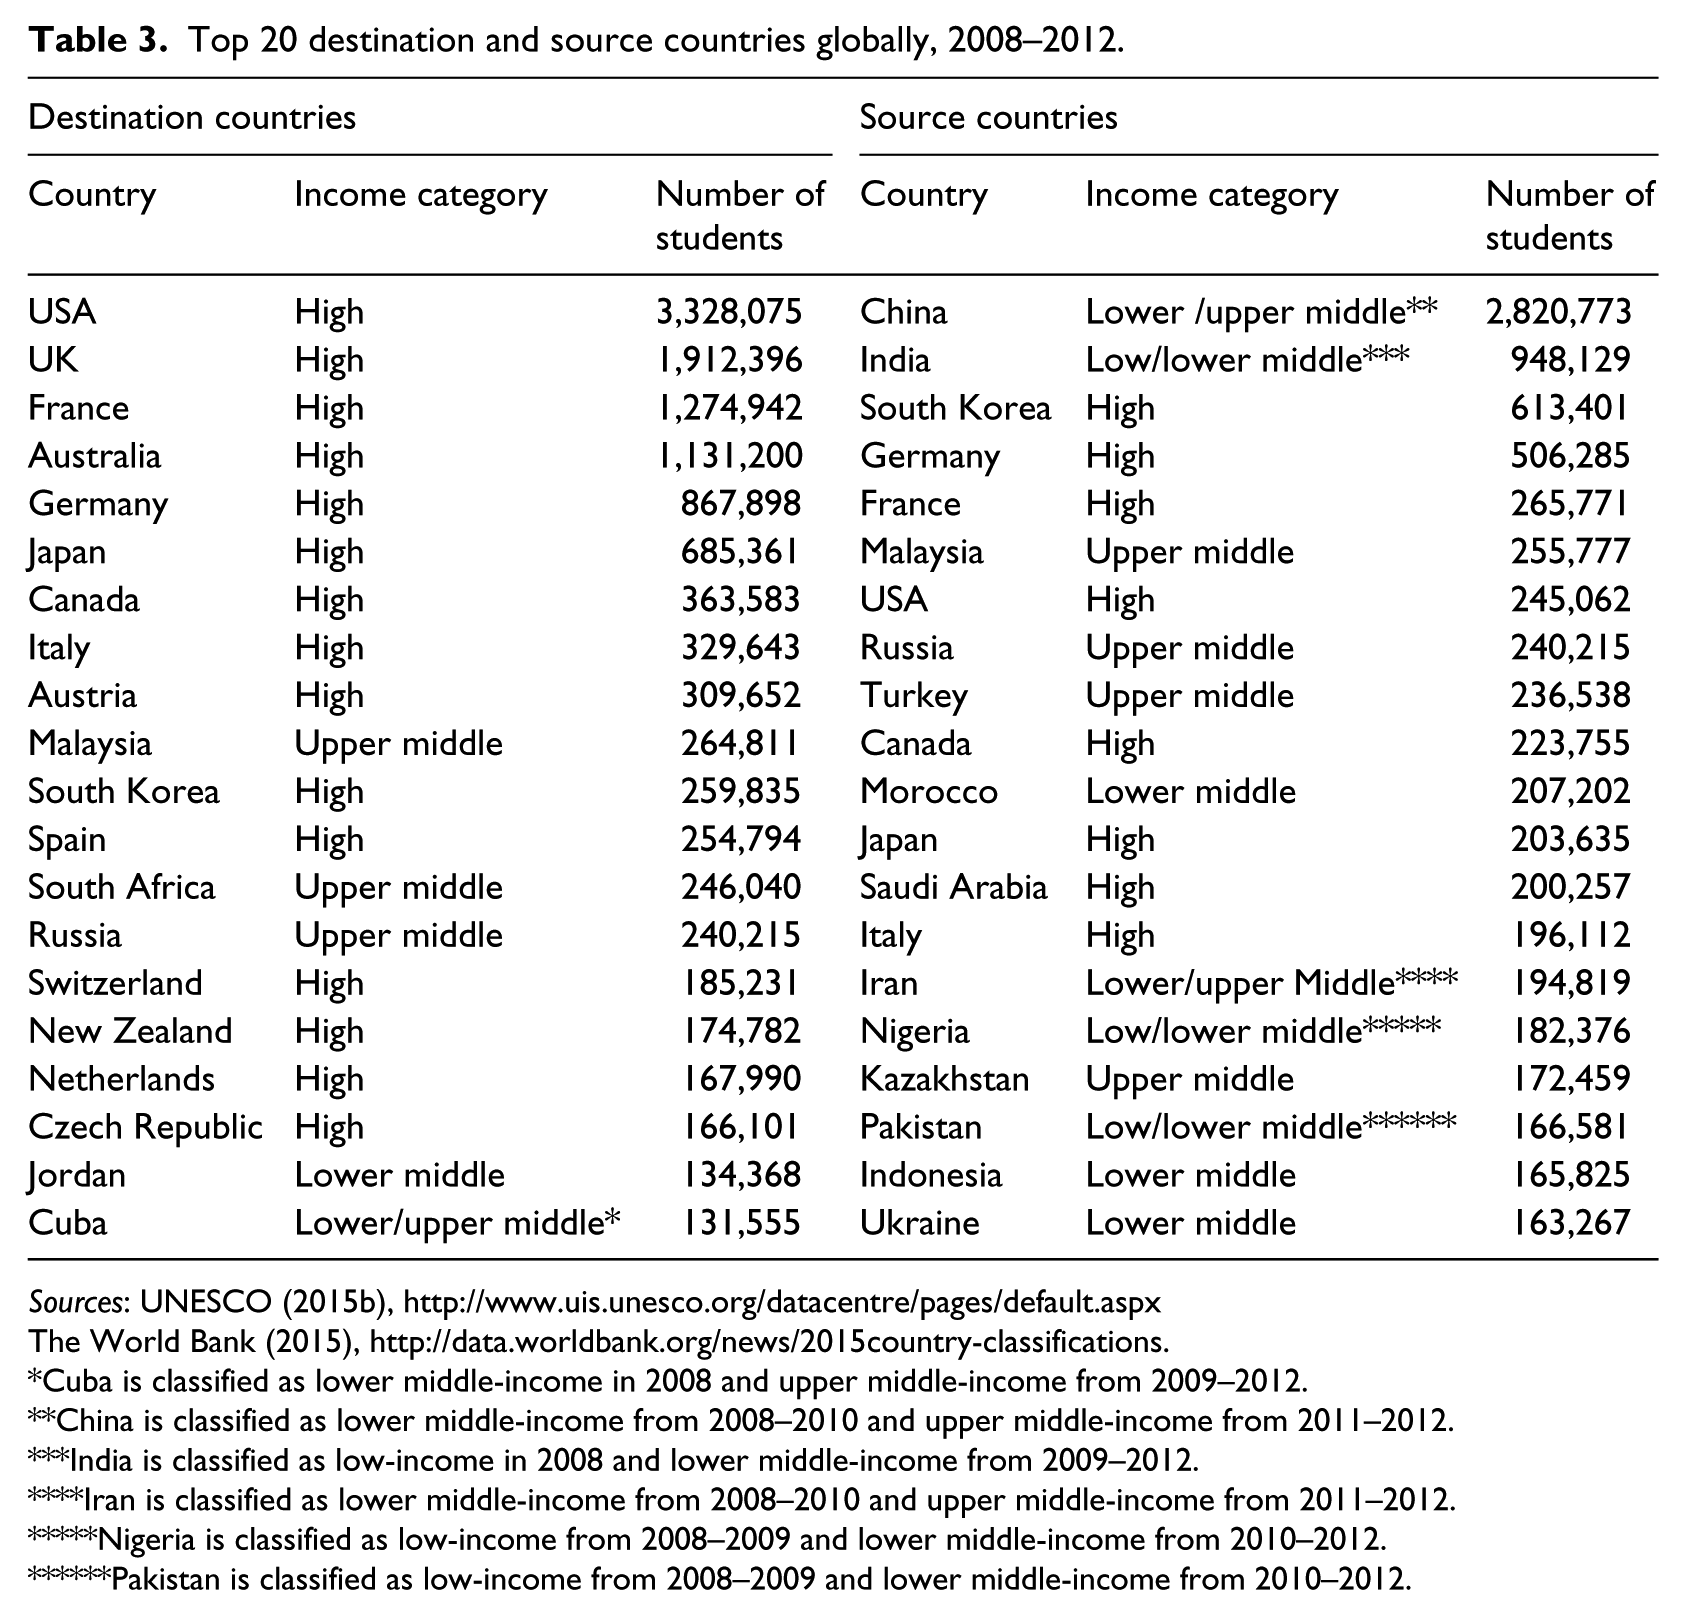
Cuba is classified as lower middle-income in 2008 and upper middle-income from 2009–2012.
China is classified as lower middle-income from 2008–2010 and upper middle-income from 2011–2012.
India is classified as low-income in 2008 and lower middle-income from 2009–2012.
Iran is classified as lower middle-income from 2008–2010 and upper middle-income from 2011–2012.
Nigeria is classified as low-income from 2008–2009 and lower middle-income from 2010–2012.
Pakistan is classified as low-income from 2008–2009 and lower middle-income from 2010–2012.
The five-year trends for the global ISM network align with the literature on uneven student mobility patterns as well as the world-systems perspective on core–peripheral relationships between the developed and developing world. The low density and average degree of the global network indicate that students are sequestered on a small percentage of realized ties. The visualizations of destination and source patterns by income classification support the contention that these ties originate in the developing world and end in developed nations. In order to identify if economic inequality in ISM is fractally represented at a regional level, I provide density and average degree measures of the SADC, EHEA, UNASUR, and UMAP as well as a network visualization for each region which highlights student movement between all of the participating nations.
Regional networks
Figures 5 and 6 show the density and average degree measures of the regional networks. The graphics demonstrate that the trends for the two regions that include high-income countries, EHEA and UMAP, are denser networks with higher average degrees meaning that more connections are realized. In 2012, 65% of total possible ties in the EHEA network were utilized for student mobility and the average degree for each country in the network was 60. The two regional networks without high-income nations, SADC and UNASUR, have far lower density measures and average degrees from 2008–2012. This indicates that even within regional networks students flow toward developed nations. However, in regions composed mostly of high-income countries a pattern of more equitable exchange between sending and receiving internationally mobile students is exhibited. The trend lines for all four regions remained relatively stable; overall decreases and increases in connectivity were minimal. This indicates that the networks are not becoming more integrated; rather, individual countries are maintaining their positions as source nations or recipient hubs.
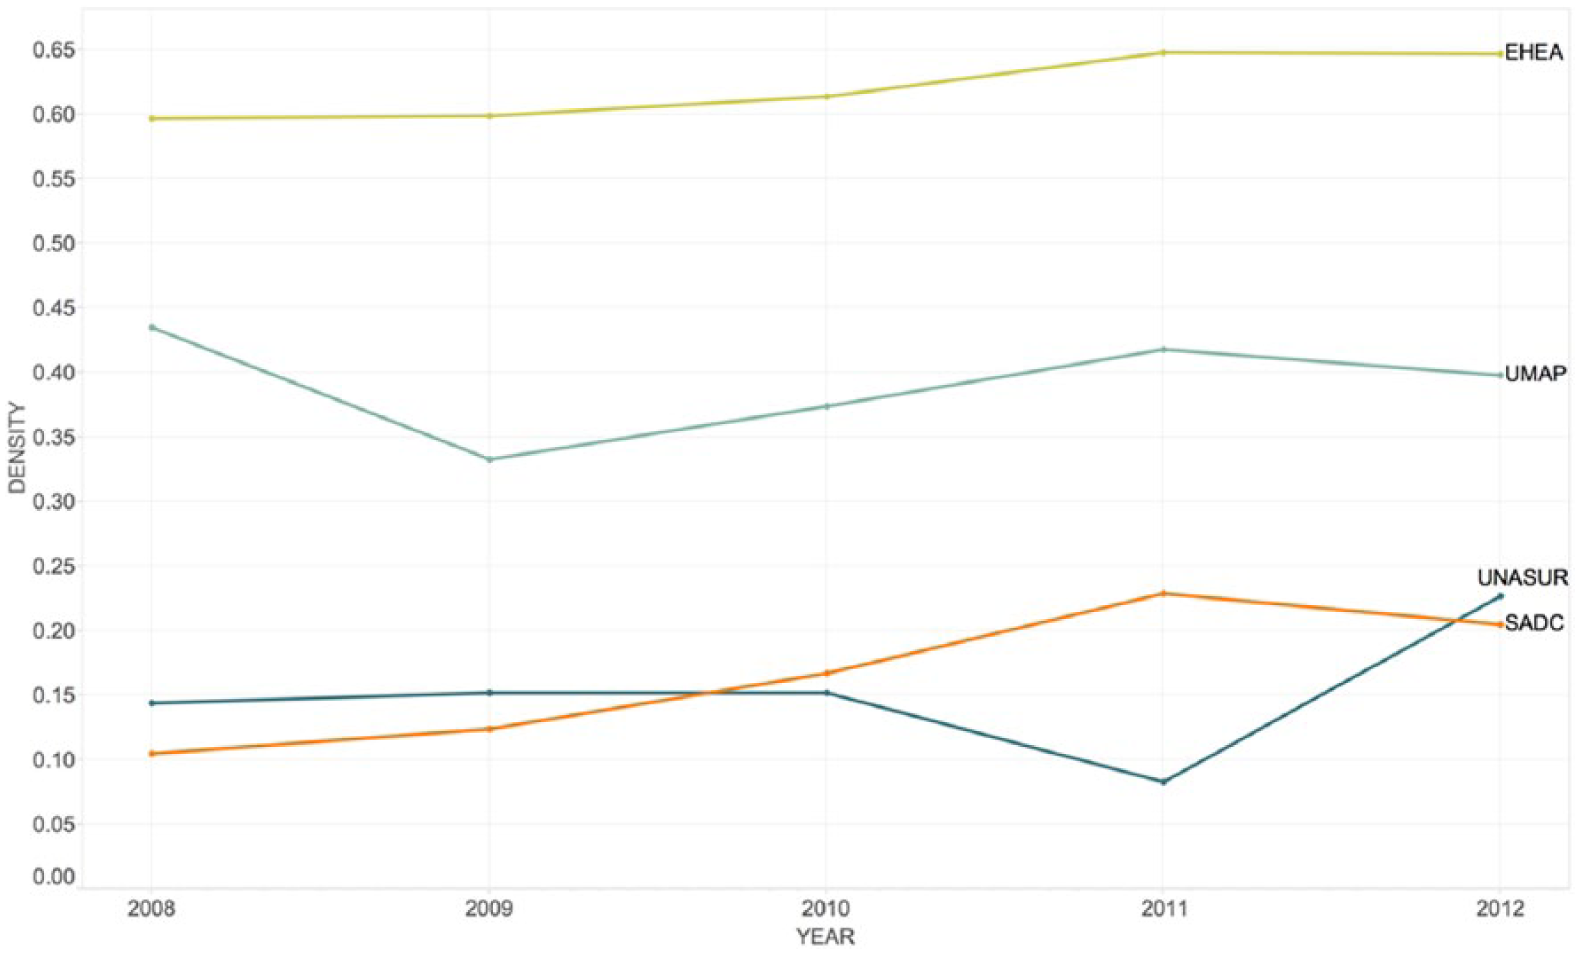
Regional network density, 2008–2012.
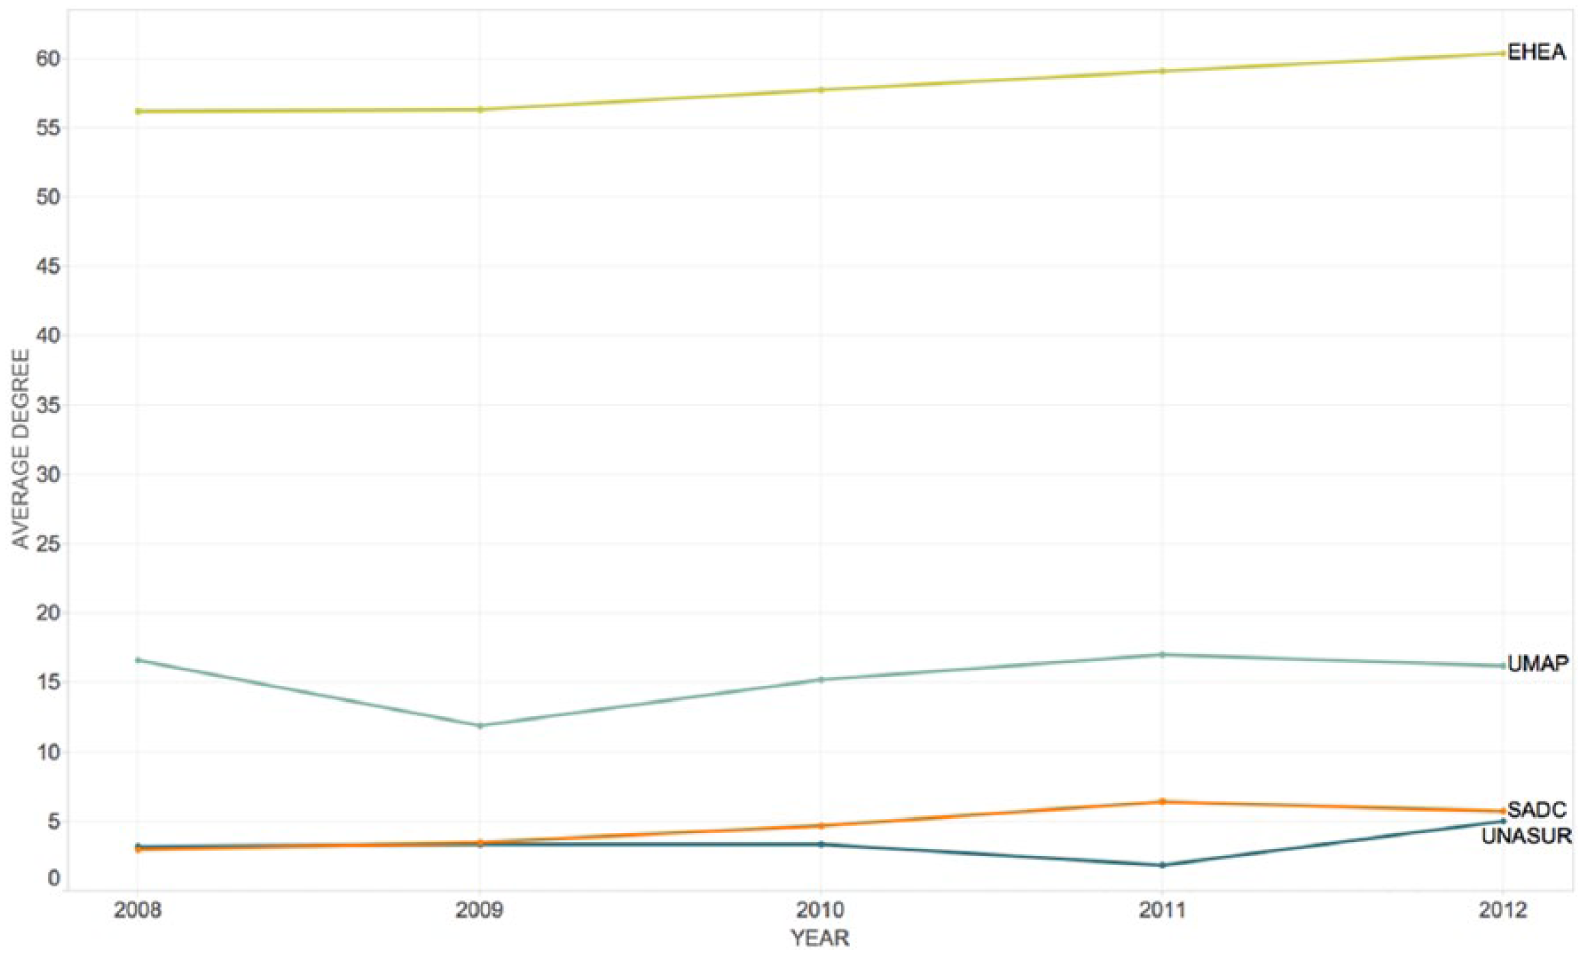
Regional network average degree, 2008–2012.
Figures 7, 8, 9, and 10, visualize connections within the SADC, EHEA, UNASUR, and UMAP regional networks for the years 2008–2012. In each chord diagram, the chords represent internationally mobile students flowing from the country of origin to a destination country in the regional network. The chords are shaded by country of origin. The width of a chord at its origination point, the portion of the diagram representing the country of origin, is reflective of the percentage of the total number of internationally mobile students in the regional network traveling on that singular pathway. For example, in Figure 7, Zimbabwe is sending 40% of the total number of internationally mobile students in the SADC regional network to South Africa. In Figure 8, which depicts the EHEA network, Germany’s outgoing students are shaded in a light green and are flowing to France and the United Kingdom, among other nations. At the left end of the light green outgoing chords from Germany are chords of differing colors which indicate Germany’s incoming students and the countries which they are from. For instance, Russia is sending approximately 1% of the total number of internationally mobile students in the EHEA regional network to Germany. Prominent countries in each network are labeled on the chord diagram with the country’s income classification in parentheses (H = high, UM = upper middle, LM = lower middle, and L = low).
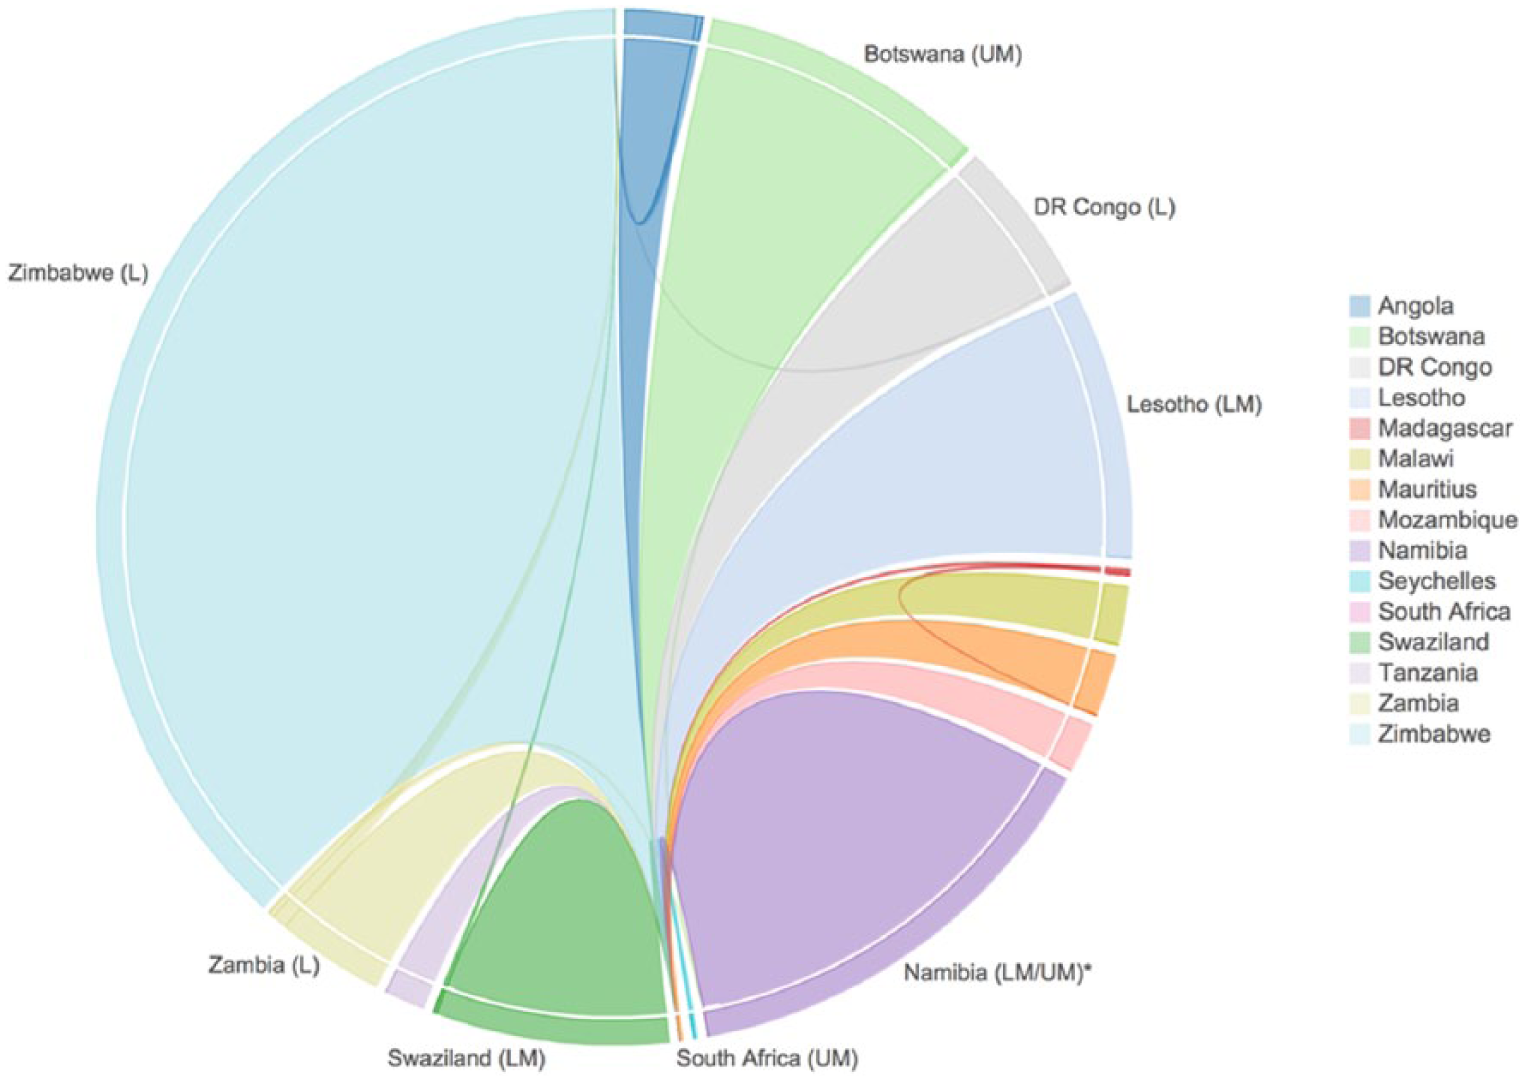
SADC network, 2008–2012.
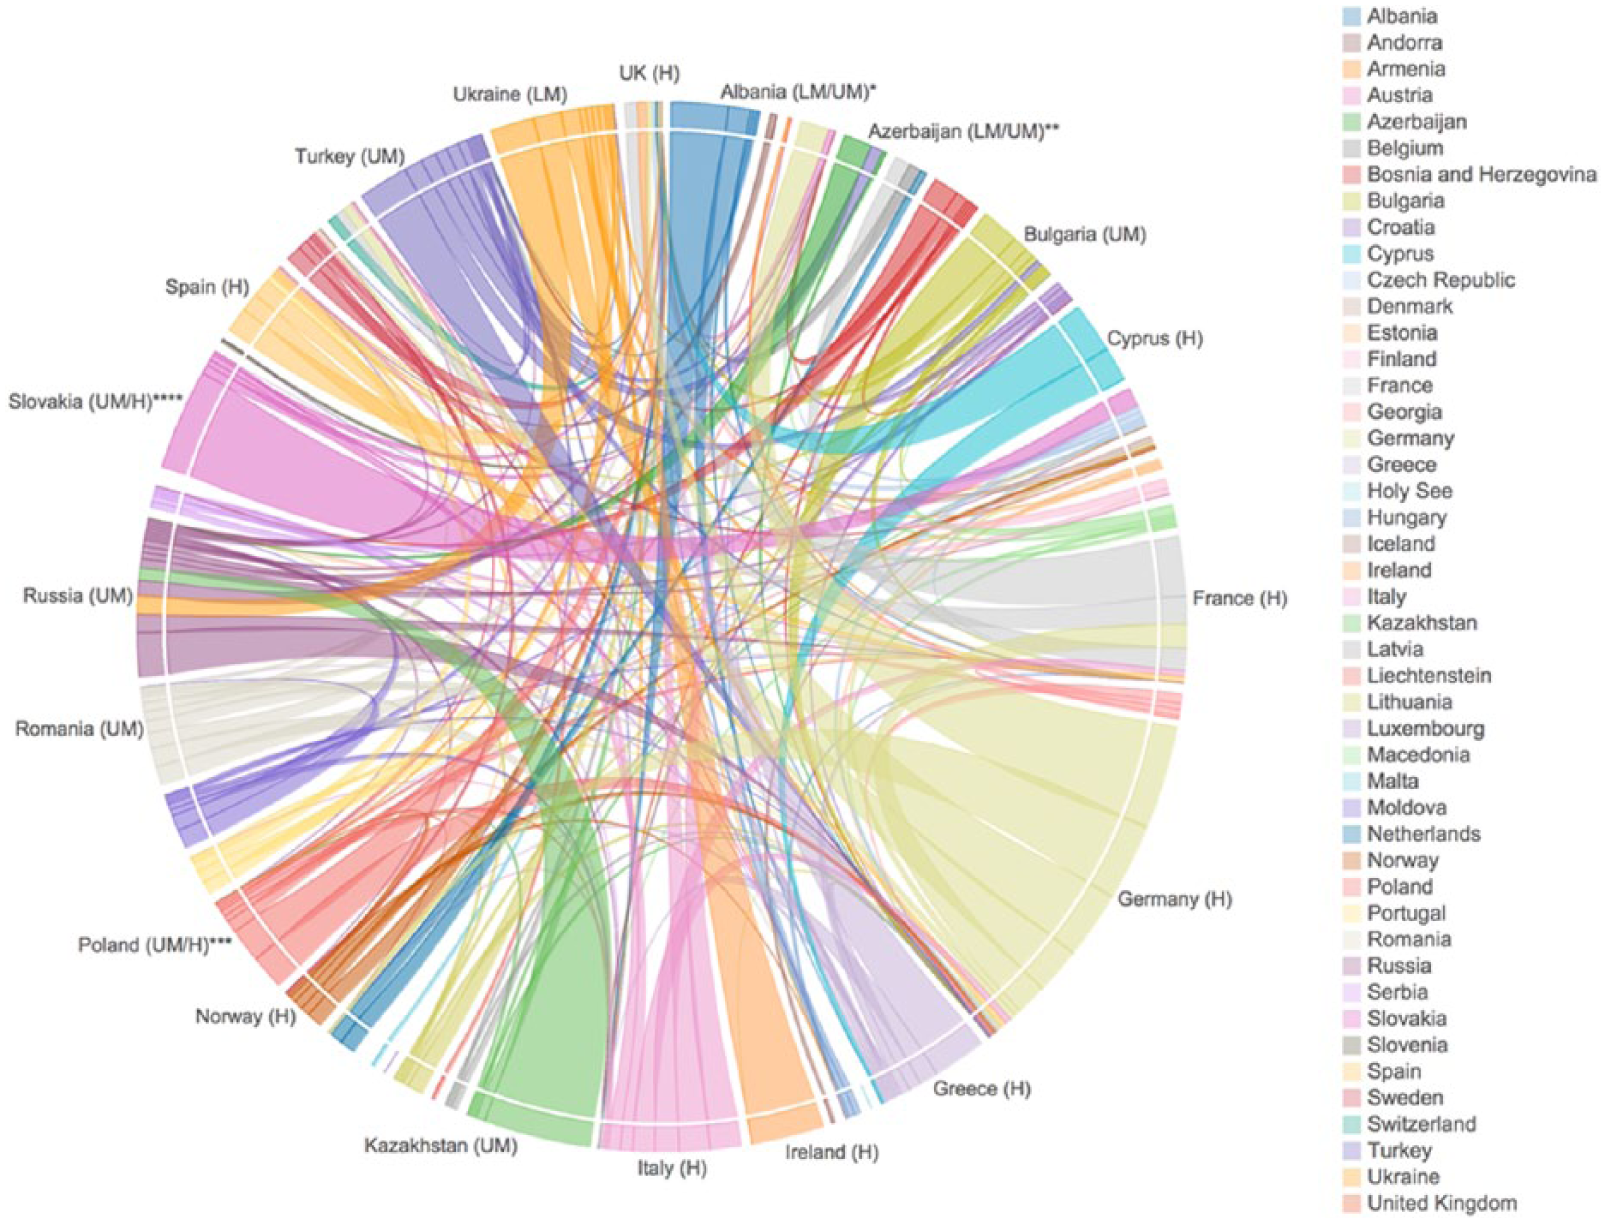
EHEA network, 2008–2012.
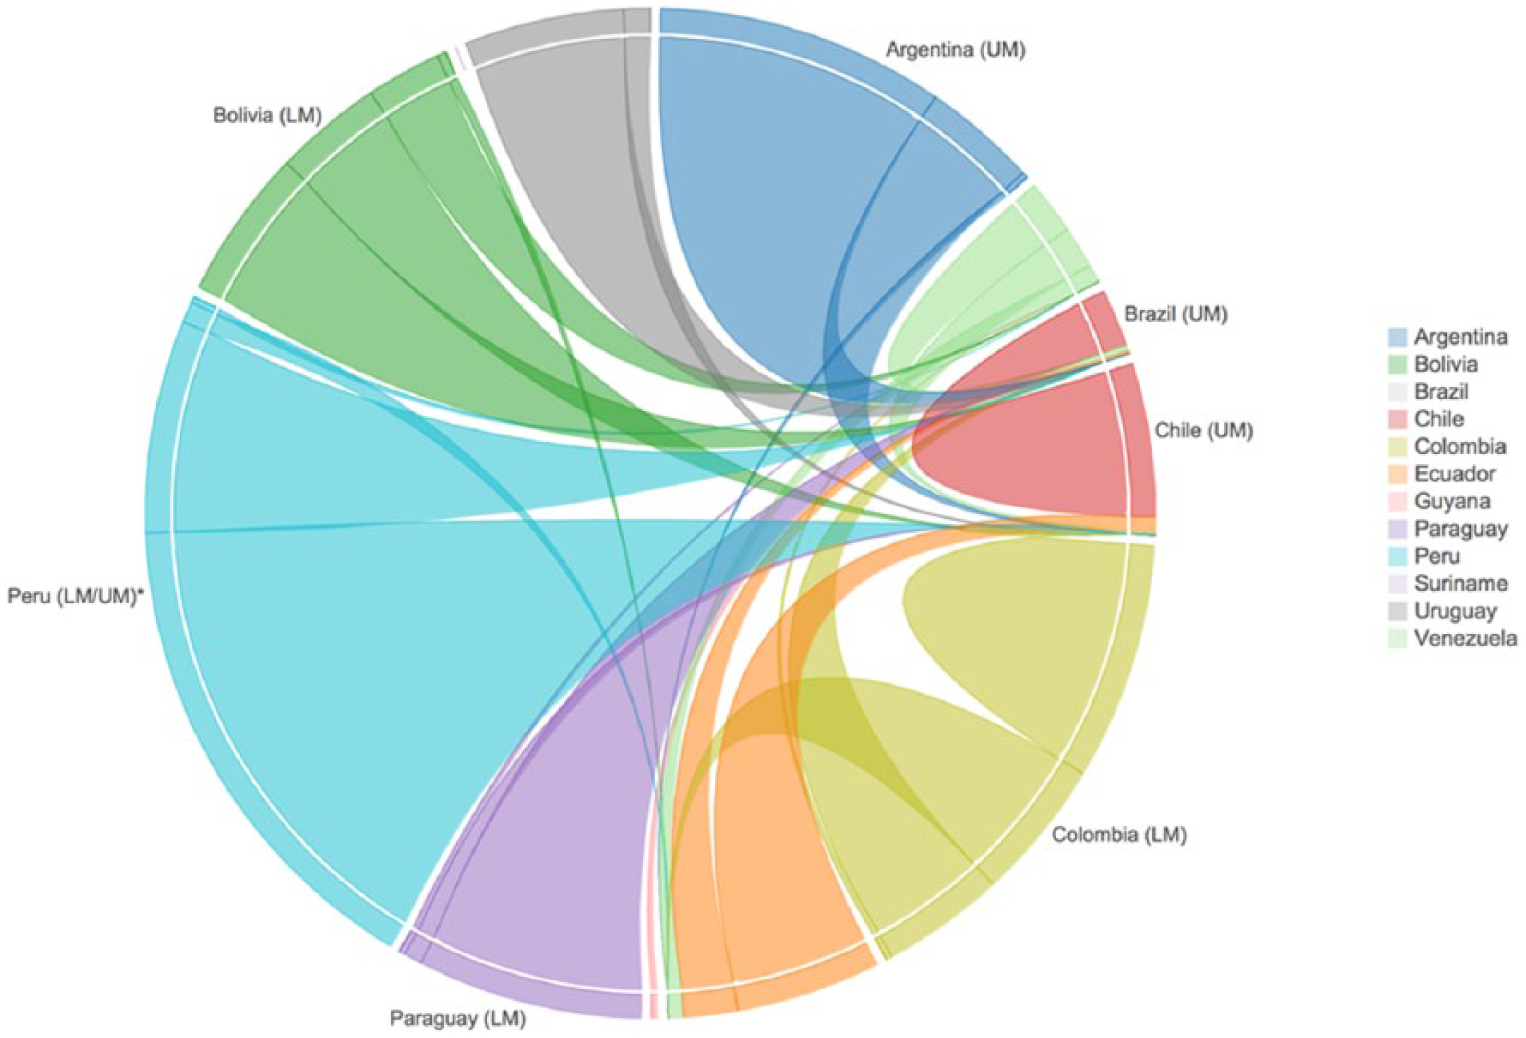
UNASUR network, 2008–2012.
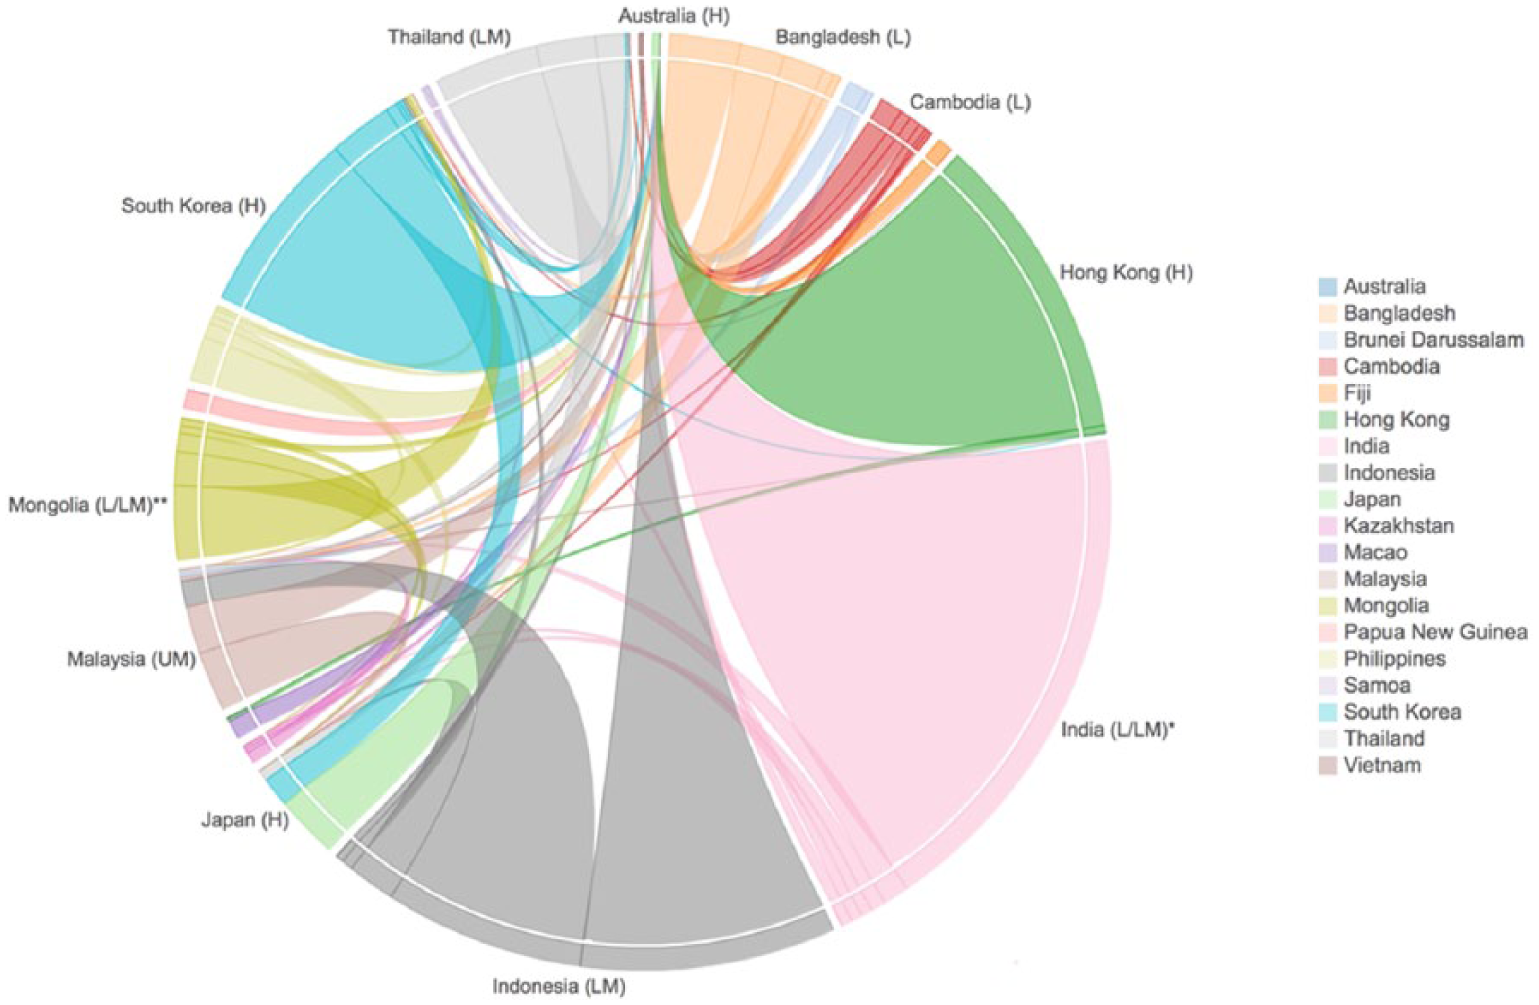
UMAP network, 2008–2012
In Figure 7, which is a visualization of ISM in the SADC, it is immediately evident that all countries in the regional network are sending the majority of their internationally mobile students to South Africa with few ties between other nations in the network. Additionally, the size of the chords at South Africa’s position in the diagram indicate that South Africa is not sending many students to other nations in the network despite its prominent destination status. The overwhelming flow toward South Africa reflects a core–periphery dynamic among the countries in the SADC network. South Africa, an upper middle income nation, is obviously the core country benefiting from ISM flows from the peripheral nations, which comprise the remainder of the regional tertiary education network. This pattern illustrates why the density and average degree for the SADC network remained low over the five-year period, because internationally mobile students were primarily directed at South Africa as opposed to a more mutual exchange between nations, and also illustrates that when there is no high-income nation, student mobility in the network will be driven toward a nation with the highest income classification.
Exhibiting ISM patterns which are vastly different from the SADC, Figure 8 depicts student flows in the EHEA tertiary education network. The EHEA comprises three times as many countries as the SADC network and almost all of them have a high-income classification. As a result, sending and receiving connections between countries in the network are far more equitable. The EHEA network had a high density and average degree from 2008–2012 and this is reflected in the chord diagram, which has such a large number of ties that patterns in the center of the graphic are difficult to decipher. A core–periphery relationship in the EHEA network is mostly nonexistent since the majority of the countries are economic peers. The only nation which receives a significant number of students but sends few is the United Kingdom, which is pictured at the top of the EHEA chord diagram.
The UNASUR tertiary education network (Figure 9) has a very similar structure to the SADC network. The UNASUR region comprises only lower middle- and upper middle-income nations, and the majority of student flows begin in lower middle-income countries and are directed toward Brazil and Chile (two upper middle-income nations). Much like South Africa, Brazil appears to be a primary destination country that sees little student output back into the network, making Brazil a core nation within the UNASUR region. The pattern of student movement illustrates why the density and average degree measures for the UNASUR regional network were low, because pathways are highly directed toward upper middle-income nations at the expense of more equitable flows among countries in the network.
University Mobility in Asia and the Pacific is the only regional network in the analysis which houses countries with each of the four income classifications. Thus, the student mobility patterns in the network (Figure 10) are a fusion of what has been depicted in each of the previous regional chord diagrams. Though student mobility is still prominently directed from low-, lower middle-, and upper middle-income nations toward the high-income countries such as Australia and Japan, the relative number of high-income nations in the network also increases the number of total connections present as opposed to the SADC or UNASUR networks. The only country which appears to hold core status is Australia, which receives many of the chords in the diagram but emits none.
The overarching regional patterns are clear. Countries, regardless of individual income classification or the number of students they are sending, see the overwhelming majority of their students flow toward developed/high-income countries or the highest income nations within the network. Lower middle- and low-income countries serve primarily as source nations for ISM within the regions; whereas, upper middle- and high-income countries dominate the networks as senders and receivers. Often, some of the highest income countries in the regional network serve only as destinations, such as South Africa, the United Kingdom, Australia, and Brazil. This pattern resonated particularly within the SADC network in which the vast majority of flows are directed at South Africa. The influence of income classification in ISM flows is also apparent in the EHEA chord diagram. This is the only regional network studied in which the primary income classification in the network is high-income and as a result the graphic representation of student flows is far more complex than in the networks with fewer or no high-income countries, which illustrate very pointed flows from lower- to higher-income classifications.
The network measures and visualizations indicate that regional networks are fractals of global ISM in that the core–periphery pattern repeats itself regardless of geographic scale. Student flows are centralizing academic talent within the high- and upper middle-income nations and perhaps constraining the ability of lower middle- and low-income countries to employ ISM as a means of bolstering economic and educational expansion. This process undercuts the purpose of the regional network itself – to enable the development of the whole region.
Discussion
This paper’s research questions asked: (1) what patterns exist among all countries participating in ISM relative to country income classification; and (2) what ISM income classification-related patterns emerge specifically among countries in the SADC, EHEA, UNASUR, and UMAP regional networks. Results of the social network analysis indicated that for 2008–2012, the global network aligned with recent literature on ISM. The number of realized ties between countries in the network were low and students primarily flowed from developing countries to developed nations to complete their tertiary education. Results for the regional networks composed chiefly of lower-income nations (SADC and UNASUR) exhibited low density and average degree; whereas, the regional networks with high-income nations (EHEA and UMAP) demonstrated greater density and average degree measures. The chord diagrams of each network also indicated that ISM patterns within the four regions mirrored global patterns. Students flowed toward high-income nations or the most developed nations in the network. World-systems perspective argues that income driven relationships between countries reflect a core–periphery dynamic in which core countries benefit from the valuable resources they extract from peripheral, developing nations (Wallerstein, 2004). In tertiary education, world-class institutions in high-income nations are benefitting from incoming streams of talented students and economic gains derived from the tuition and living expenses students from the developing world funnel into developed economies (Altbach and Knight, 2007; Lowell et al., 2004; Macready and Tucker, 2011; Siegmund, 2009). The developing world experiences this as brain and economic drain and this is a global reality that is represented fractally within regional ISM networks (Knight, 2012).
This paper sought to connect the literature on uneven student mobility flows globally to the growing body of research on regional tertiary education networks in order to identify whether patterns of inequality were nested within ISM at multiple geographic scales and to visually depict the strength of student movement toward the developed world through social network analysis. What is gained from the study of fractal inequality in ISM is a more complete picture of how the tertiary education system reifies the core–periphery positioning of the developed and developing world and how student mobility is defined by nations’ income classification simultaneously within global and regional networks. Moreover, this analysis has demonstrated how hegemonic inequality can develop through ISM even when the initial vision for a policy or program is one of equality, such as the regional tertiary education networks which were created to keep internationally mobile students in the region and to support the economic and social development of all participant nations. The findings from this paper warrant continued critical analysis to identify what structures could be enacted globally and regionally to see more equivalent exchange in the transfer of people and knowledge. Currently, developing countries such as Taiwan, Malaysia, and China are encouraging students to return after completing a degree overseas through competitive funding for research and innovation or tax exemptions to offset lower salaries, while others, including Pakistan, are offering short- and long-term appointments for overseas faculty to encourage more equitable talent mobility (Bhandari and Blumenthal, 2009). Some countries, such as Ethiopia, Ghana, and Nigeria have required students to obtain visas with return requirements (Shinn, 2008). Through repatriation these students have the opportunity to share knowledge, skills, and networks developed during their ISM experience. Initiatives such as these may result in genuine brain circulation and a reduced net brain loss for the developing world.
Though this paper presents important findings on the understudied relationship between global and regional ISM and adds to the narrow research on regional tertiary education networks, limitations to the study exist. First, there were 76 countries that did not report incoming ISM student data to UNESCO from 2008–2012 (UNESCO, 2015b). Therefore, these countries were involved in the networks based only on the data from other countries that indicated students were studying there. For example, China did not report how many students studied in the country and where they were from; yet, other countries reported receiving internationally mobile students from China. As a result, only China’s out migration is reflected in the global network as opposed to both input and output of student mobility. This was the case with a number of countries in the SADC and UNASUR regional networks as well. This is a significant limitation because the nations that did not report incoming ISM data may be more important in the global and regional network structures than the available data would suggest. Future research should continue to examine mobility relationships globally and among the countries in the SADC and UNASUR regional networks as data become available. A full list of countries that did not report incoming student data is available in the Appendix. Second, although these data are useful for understanding that there is a self-similar pattern of hegemonic inequality in ISM both globally and regionally, the data cannot be utilized to understand why individual students choose to complete their tertiary education in the developed world and whether or not they choose to remain in developed nations after degree completion.
Conclusion
The continued growth in the number of internationally mobile students and the hegemonic relationship between destination and source countries necessitate further critical research on ISM. This paper aimed to contribute to the literature by exploring patterns within multiple regional tertiary education networks comprising both developed and developing nations and by beginning to frame the fractal relationship between global and regional ISM networks. Globally and regionally tertiary education is faced with a paradox. Individual students and world-class institutions in high-income nations directly benefit from the process of ISM. Students gain access to high-quality academic resources and tertiary institutions receive monetary support and internationalize their educational environments. Yet, developing countries do not experience equivalency in ISM. Rather they experience knowledge and economic deficits that can impede development. The growth of tertiary education and the economy in the developing world should not be a burden placed on the backs of its citizens, but a cooperative effort must be made between developing and developed nations and their citizens to contribute to more equitable global and regional ISM. Studies which continue to link ISM patterns at multiple geographic scales, further explore developments within growing regional education networks, and identify what impact ISM has on internationally mobile students will be imperative in order to transform ISM into a practice that is no longer a reflection of hegemonic inequality in the world-system.
Footnotes
Appendix
Funding
This research received no specific grant from any funding agency in the public, commercial, or not-for-profit sectors.