
Abstract
The international comparative studies in 1959 were conducted by International Association for the Evaluation of Educational Achievement (IEA) researchers who recognized that differences in student achievement measures in mathematics across countries could be caused by differences in curricula. The measurements of opportunity to learn (OTL) grew from a small effort in 1959 to a much larger efforts by 1995 to explain whether countries with high achievement were more likely to teach advanced mathematics. In general, the relationship of coverage of a mathematics topic was weakly related to the level of mathematics performance, but did have some effect on growth. This paper finds that differences in measurement methods of OTL across the studies greatly affected the outcome of the relationship. Recent Program for International Student Achievement (PISA) analyses indicate that the relationship between OTL and student achievement might be described as a curvilinear relationship. Countries with lower achievement are more likely to be affected by curriculum coverage than are high-performing countries.
Keywords
Introduction to the theory of opportunity to learn and the history of its development
Writing for the National Research Council in 2002, Robert Floden said of “opportunity to learn” that, “Sometimes it seems as though, in the United States at least, the attention to student opportunity to learn (OTL) is even greater than the attention to achievement result”. He had quoted Lorraine McDonnell’s 1995 essay on the contributions to national and international research of Leigh Burstein noting that, “OTL is one of a small set of generative concepts that has changed how researchers, educators, and policy makers think”. In the 1990s the attention to OTL even led to efforts to legislate states to measure the level of opportunities their students received (Schwartz, 1995). Interest in the concept continues to stimulate research and policy debate. For example, the Organisation for Economic Co-operation and Development (OECD) Program for International Student Achievement (PISA) introduced measurement methods for OTL in the 2012 PISA survey of mathematics (Schmidt et al., 2013).
The introduction of the concept of OTL and measurement of its distribution within and between countries began as early as 1959 with the planning and execution of the first international comparative studies of educational achievement (Foshay et al., 1962). However their work on OTL did not receive significant attention until the publication of results from the Second International Mathematics Study (SIMS) in the report, The Underachieving Curriculum (McKnight, 1987).
This paper examines the theoretical development and survey results of the concept of OTL in the international assessment of mathematics since it was first introduced in 1959. It explores evidence for the claims that differences in student exposure to mathematics are a significant explanatory agent for explaining differences in student achievement. The initial stimulus for measuring student exposure to subject matter began as an effort to validate the ability of international comparative studies to accurately describe country-to-country differences in achievement levels (Husén, 1967). However, later the concept was conceptualized as a potential causal step toward student performance (Bloom, 1972; Schmidt et al., 1998). Now it is possible to use the extensive 50 years of data collection to evaluate whether the introduction of measurement methods for curricula content led to profound observations, theory development, and empirical understanding of educational practices or only to banal observations that in an organized system school instruction is required for student learning.
The OTL concept grew from efforts of researchers such as Benjamin Bloom, Robert Thorndike, John Carroll, and Torsten Husén to create measurement methods for educational practices that could help explain differences in student performances on test results within and between countries (Foshay et al., 1962; Husén, 1967). The measurement techniques applied in the earliest studies in the 1950s were carried out by the International Association for the Evaluation of Educational Achievement (IEA) through to 2011. Because of differences in study designs, a new form was introduced to international studies by the OECD in the 2012 PISA mathematics study (Schmidt et al., 2013). The following analysis is a description of results from the earliest development and application of OTL measurement and its relationship to student mathematics achievement. It will address the issues that occurred with the measurement techniques that were attempted and show how changes were made over time. This review will permit a preliminary assessment of the potential of OTL as an explanatory concept for differences in student achievement, particularly across countries.
To reduce the number of possible combinations of topics and applications, the analysis will be limited to the subject of mathematics, the development of OTL concepts as introduced in the international comparative studies, and will use the variation within the USA as a descriptive device for depicting the potential for studying the relationship between student exposure to content and their performance on designed tests. To conduct a similar analysis of relationships for many other countries would raise the level of complexity. For more detailed analyses of these relationships across countries, see the work of Schmidt, et al. 1996, 1997 and 1999 listed in the references. This paper will not include in its review many related methods developed by domestic projects such as studies of teacher content coverage through observing their presentation in classes and comparing them to teacher logs and other means of collecting information of teacher presentation or the TIMSS use of videos of classrooms to classify classroom teacher behaviors (Floden, 2002; Porter, 1991, 1995).
The analysis will be limited to four international studies of mathematics: The 1959 “Twelve Country Study”; the 1965 First International Mathematics Study (FIMS); the 1982 SIMS; and the 1995 Third International Mathematics and Science Study (TIMSS). The paper will review preliminary measurement methods created for the analysis of curriculum change in Sweden in the 1960s by Husén and Dahllöf, who were developing concepts of OTL parallel with their work on the IEA comparative studies. It will summarize the history of the theoretical and methodological development of the concept and describe the specific measurement methods that were applied in several studies, discuss the problems of measurement as they were detected at each stage, and illustrate how those problems were addressed in later studies. The paper will end with a brief summary of how OTL measures fared in later surveys and with recommendations for future research and development of the concept and its measurement. It will not discuss the use of OTL as a policy tool (McDonnell, 1995; Schwartz, 1995; Westbury, 1992, 2003).
What is opportunity to learn?
OTL has been used as an educational analytical concept in four ways. It was first considered as a “control” variable in international comparative studies to adjust for aspects of student opportunities that account for differences in curricula and prior learning between countries (Foshay et al., 1962; Husén and Dahllöf, 1965a). Secondly, OTL was applied as a determinant variable that influenced learning through the amount of time spent on a concept from none to a lot (Carroll, 1989; Dahllöf, 1966, 1973a; Lundgren, 2011; Phelps, 2005). Thirdly, it was used as a method for estimating slippage between intended, implemented, and attained curricula (Dahllöf, 1973b). Fourthly, it has been applied as a descriptive variable in the sense of describing the scope of content coverage in a school, district, state, or country (McDonnell, 1995; Westbury and Hsu, 1996).
One of the originators of the concept of OTL is John Carroll, who was conducting research on learning reading and developed a model of time use first published in 1963 that used the term “opportunity to learn” (Carroll, 1963). The model, as presented in 1963, postulated five basic classes of variables that would account for variations in school achievement. Three are assumed to be amenable to expression in terms of time.
Aptitude is the amount of time a student needs to learn a given task, unit of instruction, or curriculum to an acceptable criterion of mastery under optimal conditions of instruction and student motivation.
Ability to understand instruction is measured by the amount of time needed.
Perseverance is defined as the amount of time a student is willing to spend on learning the task or unit of instruction; in this sense, it becomes an operational definition of motivation for learning.
Opportunity is the amount of time allowed for learning, for example, by a school schedule or program. Frequently, OTL is less than that required in view of the student’s aptitude.
Quality of instruction is the degree to which instruction is presented so that repetition is not required for mastery.
The Swedish reform
The development of the IEA comparative studies of student achievement in mathematics and other topics during the 1960s was conducted parallel to research in Sweden on changes being introduced to their own curriculum (Dahllöf, 1966). The question of how to empirically measure the effects of changes introduced into classrooms on the students through the organization of the curriculum was first addressed by researchers in the 1950s and 1960s in Sweden (Dahllöf, 1966; Husén and Dahllöf, 1965b). During the 1950s, the national leaders of the Swedish educational system chose to modify the school system from a traditional stratified model in which students who showed ability in their compulsory school years were placed in academic secondary schools, whereas those students who did not perform at advanced levels were placed in schools that led to occupations that did not require advanced knowledge of mathematics, science, or language. The Minister of Education in Sweden asked education researchers Torsten Husén and his student at the time Urban Dahllöf to monitor the effect of these changes (Husén and Dahllöf, 1965b).
Working with both a theoretical vision of classroom behavior and empirical observations of classes, Dahllöf and Husén developed a theoretical model that eventually evolved into OTL (Dahllöf, 1971, 1981; Husén and Dahllöf, 1960, 1965a). Their model was a specific case of a more general model based on Carroll’s theory of time use (Carroll, 1963, 1989) and Bloom’s concept of mastery learning (Bloom, 1974). As Dahllöf said, following Carroll, “The general model simply states, that performance is a function of the initial ability status of the pupils, the curriculum objectives and the time spent on actual learning” (Dahllöf, 1971). They intended their theoretical model to identify how “the objectives of instruction, the curriculum process and the final attainments are related to each other under different frame conditions” (Dahllöf, 1971). Dahllöf defined frame factors as established conditions like grouping, the teaching process, and educational outcomes. He also includes factors such as the time limits in formal schooling and the initial ability and social background of students.
The empirical measurement of student outcomes was assumed to be cognitive achievement as measured on standardized tests and attitudes of students as self-reported in questionnaires (and not of social and personal development of the pupils). The key observation of these researchers was that the curriculum itself could become a matter of observation, since the outcome measure of student achievement had been established in the content framework of the cognitive tests (Dahllöf, 1971). Thus, in conducting the study of the Swedish school reform, the researchers learned from the ongoing international studies that students could be gauged by a test that was based on a framework of recognized topics and that the same framework could be used to describe the organization of the curriculum. These indicators could be used to measure whether there was equal access to mathematics content between schools.
At a practical level, determining the effect of curriculum differences on student performances requires that the assessments of student performance conform to some common standard among participating school systems about the content of the examination. At the curriculum level, the empirical measurement of time spent on a topic was considered probably the best single indicator of the effect on student learning. However, Dahllöf was cautious about using a general measurement method to capture all aspects of the classroom performance. For example, he outlined special conditions occurring in classrooms with students of varying ability and described how the direction of instruction in a classroom might be led by a “steering or criterion” group of students located at the lower end of the class ability levels that determines when a teacher decides to move from one topic to another (Dahllöf, 1971). Thus, even at the outset of the empirical studies of the relationship between curriculum design and student performances, complex within-classroom interactions were noted to exist even though they were not detected sufficiently by time-measurement methods of the content of instruction. However, none of the IEA studies attempted to quantify within-classroom interactions beyond measuring the total frequency of exposure to particular mathematical content.
The most complete descriptions of OTL are found in the first volume of the analysis of the SIMS by Travers and Westbury (1989). They defined stages in the processes of influencing mathematics learning through the school curriculum through a hierarchical organizational structure that placed the mathematics content of classroom instruction in a hierarchical order from macro policy to micro student learning. The OTL framework for mathematics begins with the standard definition of content areas (the intended curriculum) that is introduced to the classroom by a teacher (the implemented curricula) and eventually results in student learning of that content topic (the attained curriculum). The basis for this system was the belief that students cannot learn a content that had not been presented in class (Carroll, 1963). The logic of this system may appear obvious to educators, but the concept provides a needed theoretical justification for focusing educational research and policy on the content of classroom instruction and not limiting it to student social and economic factors that are known to be related to student performance (Coleman et al., 1966).
Measurement methods for opportunity to learn
The originators of the OTL concept experimented with different methods of measurement because of the complexity of the subject areas and classroom behavior that would be valid in different countries and subject presentations (Schmidt and Mcknight, 1995). However, during the period of the IEA studies very few changes were made in the measurement method. However, from the beginning some researchers were critical of the IEA’s measurement methods for representing a teacher’s subjective estimates of class ability and not of the introduction of new material (Freudenthal, 1975, 1978). Similarly, in a 1991 review of attempts to develop systems of indicators of the entire education system, Porter cited problems with the measures of “enacted curriculum” in which teachers were asked to respond to items on an assessment test indicating whether the item was covered in the class or not. He wrote: Although this procedure is efficient, it has two serious limitations. One limitation is that the procedure provides content descriptions only as comprehensive as the particular sample of student achievement tested. The second limitation is that the procedure relies on retrospective teacher self-report, and there may be a motivation for teachers to confuse content coverage with expected student achievement. (Porter, 1991)
In another analysis of the relationships between OTL and achievement using the subject of algebra learning among eighth-grade students, Muthén et al. (1995) report that teachers’ reports of topics covered in the classroom did not result in the expected increase in student achievement. For example, of all students at a given achievement level in overall mathematics, those who were reported by teachers to be taking algebra did not have a higher algebra score than non-algebra students. He also found that independent student and teacher reports of the content of a class in algebra or arithmetic do not agree sufficiently with each other (Muthén et al., 1995). One of the reasons for this disparity in the classification of students is that teachers differed greatly in what content areas were classified as algebra. Moreover, he was concerned that the test items themselves were not sensitive enough to the classroom instruction (Muthén et al., 1995). These concerns were addressed in later surveys that were developed for IEA studies.
Some of the problems with measuring curriculum coverage occur at different levels of measurement. The frameworks developed for the SIMS expanded the definition of OTL by separating curriculum intended by the educational system from that which is implemented by the school and classroom, and from that which was actually attained by the student (Travers and Westbury, 1989). Instruments and questionnaires were created to measure curricula as perceived separately by each level of authority: the central authority (state or nation), school authority (officials and teachers), and students (Travers and Westbury, 1989). The results of the new instrumentation resulted in the statistical analyses of the various structures of OTL and achievement in volumes of the SIMS (McKnight, 1987; Travers and Westbury, 1989).
Although discussion of the difficulties of measuring OTL continued with development of later studies, McDonnell’s (1995) review of published research on OTL noted that the amount of evidence of how OTL is related to achievement had increased during the 1980s and 1990s and that the improvements to the measurement of OTL in the data collection instruments for SIMS led to greater understanding of OTL as a policy tool. She said that the publication of statistical distributions of curriculum differences across and within countries brought greater attention of policy makers to OTL as a significant potential source of learning differences. However, she also pointed out that the measurement methods used in SIMS needed further modification and research (McDonnell, 1995).
Application of OTL measurement in early international surveys
In this section, the survey items and the distribution of responses will be examined for each of the international surveys from 1959 to 1995. None of the publications about OTL have reflected on the history of the development of the measurement methods before SIMS. In some of the reviews of the OTL measurement methods and analytic results, the authors have covered the conceptual development of OTL (Bishop et al., 2012; Brown, 1996; Dossey and Wu, 2013; Floden, 2002; Kilpatrick, 1990; Martin Mullis et al., 2008; Schwartz, 1995; Suter, 2000; Westbury, 2013), but no review of the published data and relationship to achievement has been completed since 2003.
The pilot twelve-country study: 1959
The earliest reference to OTLs come from publications related to the international comparative studies initiated in 1959 (Foshay et al., 1962). The UNESCO Institute for Education supported a survey of 13-year-olds in 1959–1961 to determine whether the cross-cultural collection of data about student performance and comparisons between countries was feasible. The persons who worked on that project eventually formed the IEA (Foshay et al., 1962; IEA, 2011).
Walker’s contribution focused on the results of Scottish students participating in the 1959 study. The “12-country survey” contained Walker’s study of the degree to which the teachers believed that the test items reflected the curriculum within the school. The teachers were asked to rate the items in the student test booklets according to three standards: (1) the degree to which the test item was used in the classroom; (2) the degree to which the knowledge and skills required by the item was covered in the class (how much they were stressed, included, or not included); and (3) the extent to which the pupils have opportunity in the home and in the community to use skills or encounter knowledge involved in the test question (was it “considerable,” “some,” or “little” exposure (Foshay et al., 1962). An analysis of the instrument in Scotland found that for the 26 mathematics items, 42% were classified as stressed in schools and 34% were included but not stressed. Only 24% were not included in instruction. The teachers reported that most (65%) of the items would not have been encountered in the home or community. Thus, the hypothesis that the test items might have been learned outside of the regular class was rejected by the Scottish teachers. After further analysis of the “opportunity” items, including regression analysis, Walker concluded: The results of this analysis may be disappointing to teachers in that so little difference seems to be made to the proportion of correct answers by their stressing or not stressing particular topics. It must be borne in mind, however, that the measures used were comparatively coarse and that the analysis has been made as simple as possible. With these reservations, it would appear that, at the age at which the tests were administered,
Foshay noted that Walker’s paper established: The extent to which in- and out-of-school learning opportunities, ability and other factors appeared from the international tests to be determinants of success. When the same test, or series of tests, is administered to pupils of different countries with different educational systems, it is unlikely that the items will be equally acceptable or equally useful in all of the countries concerned. The present inquiry was intended in the first place to assess the reactions of the teachers of the classes concerned to the items used in the tests of geography, mathematics and science, and secondly to estimate, if possible, the contributions made by stress on the topics in the curriculum and by the environment to the accuracy with which pupils answered the questions. (Foshay et al., 1962: 62)
First International Mathematics Study, 1965
In the FIMS, conducted around 1965 by the IEA, the measurement of OTL was based on the model of the 1959 12-country study in ways that would compare the fairness of the mathematics test between countries. The study included students who were in the grade normally attended by 13-year-olds and students who were in the final year of school. For this analysis, only the 13-year-old population is analyzed. All students in a class at a school were included in the survey.
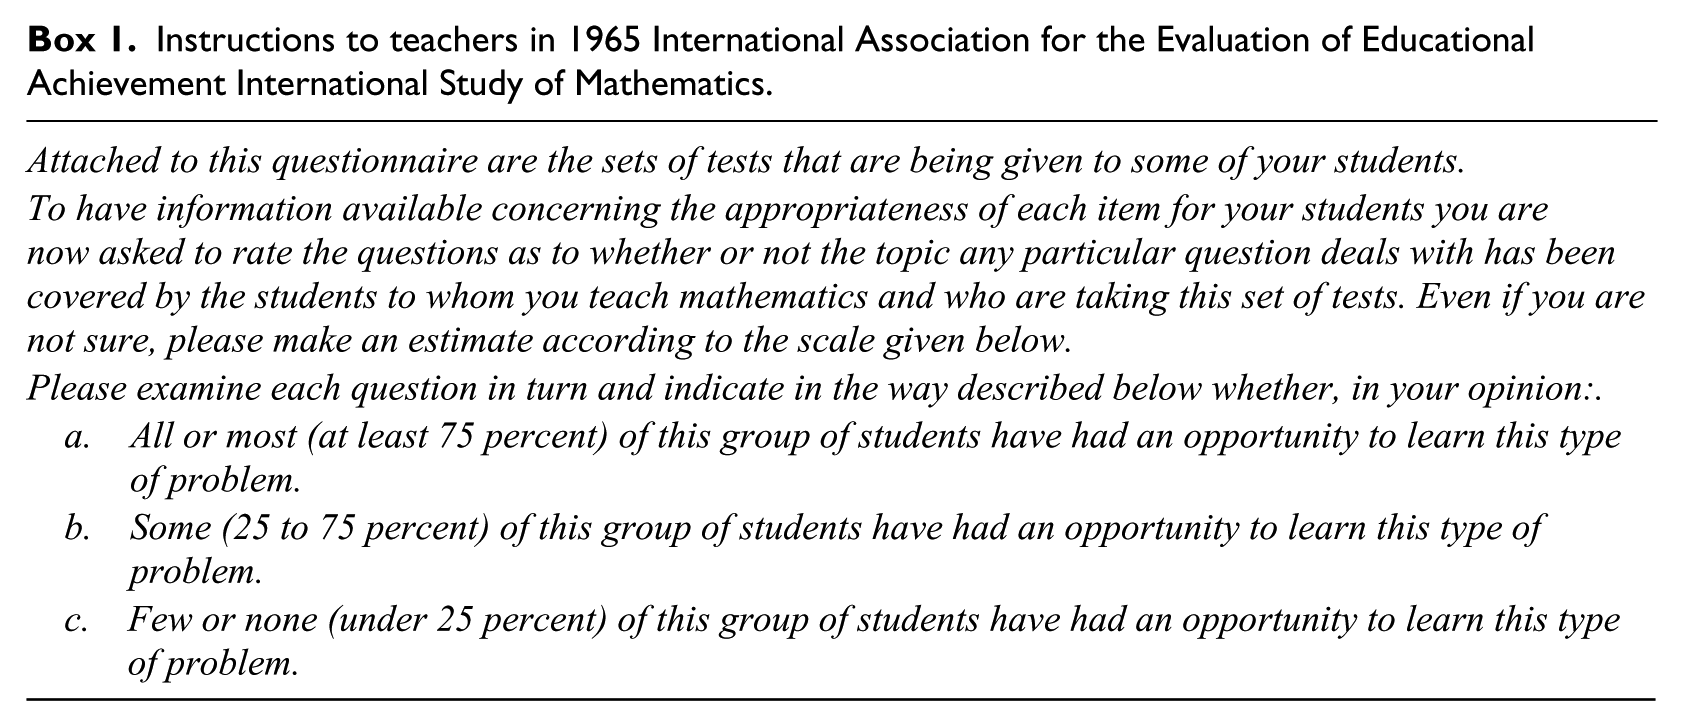
The instructions given to the teachers in Question 18 of the teacher questionnaire are shown in Box 1 (Husén and Dahllöf, 1965b). 1
Instructions to teachers in 1965 International Association for the Evaluation of Educational Achievement International Study of Mathematics.
The relationships between the OTL and achievement items from population 1 of the FIMS (13-year-olds) are shown in Figures 1 and 2. 2 The first figure shows the distribution of 70 mathematics items by percentage of students who got the item correct in the USA and the percentage of teachers who said the item was covered by at least 25% of the students in the classroom. The number of items that were not covered according to the teacher is larger than the number of items that the students correctly responded to (see the left-hand bars in the chart), but the distribution of items above that level of coverage is about the same for OTL as for percentage correct. The second chart is a scatterplot depicting the association between OTL and student percent correct for the 70 mathematics items in the survey. As shown in the regression equation, the association between OTL and achievement in this survey was high for the USA: 0.55. This association will form the base line for examination of relationships between item coverage and item percent correct in later studies.
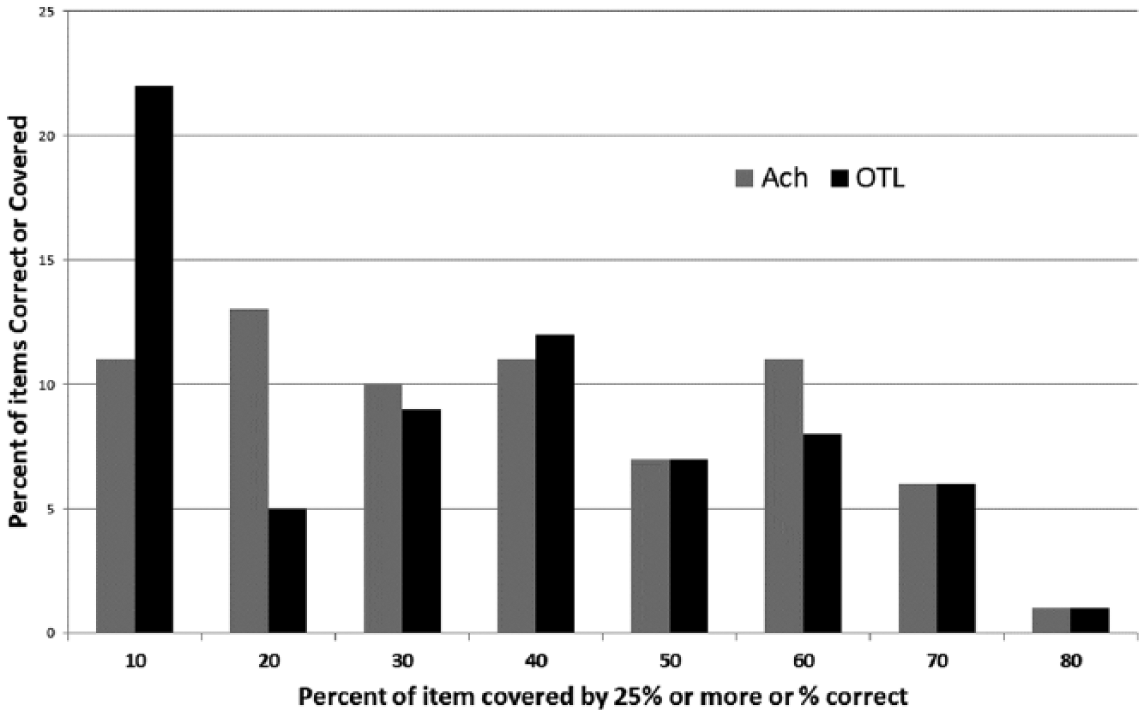
Item distribution of percent opportunity to learn (OTL) and percent correct for 70 First International Mathematics Study Mathematics items: USA 1965.
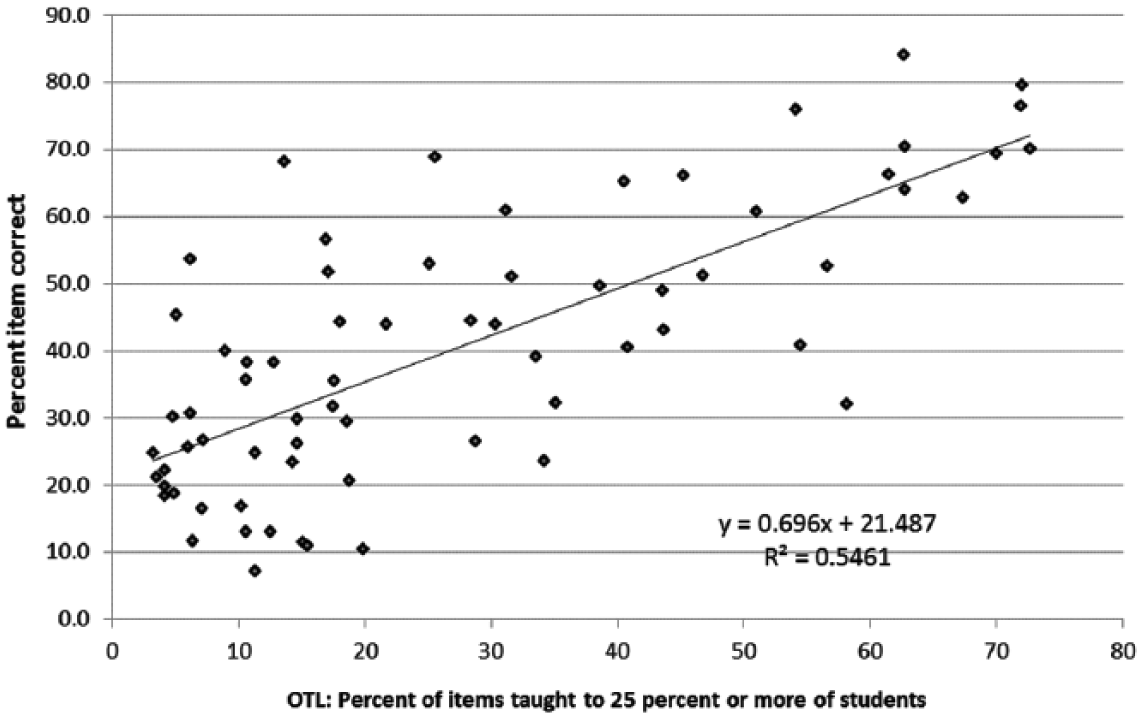
Percent items covered by 75% of students of each teacher by percent of item correct: USA First International Mathematics Study 70 items. OTL: opportunity to learn.
The original analysis reported in volume II of Husén (1967) used a different method of comparison. The author computed a correlation coefficient between OTL and percent correct by creating a continuous scale of the OTL measure by assigning midpoint percentages to each of the four categories of teacher report (75–100% = 87.5, and so on). A correlation was found between OTL and achievement level, which ranged from zero in Sweden to 0.56 in Scotland and 0.16 for the USA. Thus, the variation in relationship between OTL and achievement varied significantly between countries. Husén pointed out that the distribution of teacher responses to the items was not normally distributed and that this may have affected the level of association. It was also noted that the association across the eight participating countries was .64, indicating that OTL was a significant factor of explaining differences in mathematics performance across countries. It was concluded that OTL was a significant factor in determining the level of student performance for most but not all populations (Husén, 1967: 174). However, these conclusions are almost certainly affected by the rather broad ranges of responses used for this early analysis.
A re-computation of these relationships can be created from the basic data files of the FIMS for the USA. The distribution of mathematics items in the 1965 survey and OTL measures shown in Figure 1 demonstrate that the coverage of the test items was similar to the distribution of percent correct, except for items that were more difficult for US students (those at the lower end of the scale). A scatterplot of relationship between US teacher-reported OTL and student performance for the 70 items is shown in Figure 2. The correlation between OTL and student performance on items is high at around 0.70. The shape of the distribution is a cone, indicating that the greatest variation in coverage and performance occurs among items that are the most difficult for students and are more variably taught by US teachers.
The basic conclusion of the FIMS was that OTL was a significant component of the explanation of international differences. However, the size of the effect was variable between countries and the researchers were inconclusive about its strength. Some critics have argued that the classroom teacher report of OTL was subject to interpretation, because teacher ratings of item coverage might have been biased by the make-up of the ability level of the teacher’s class (Freudenthal, 1975).
Second International Mathematics Study (1982)
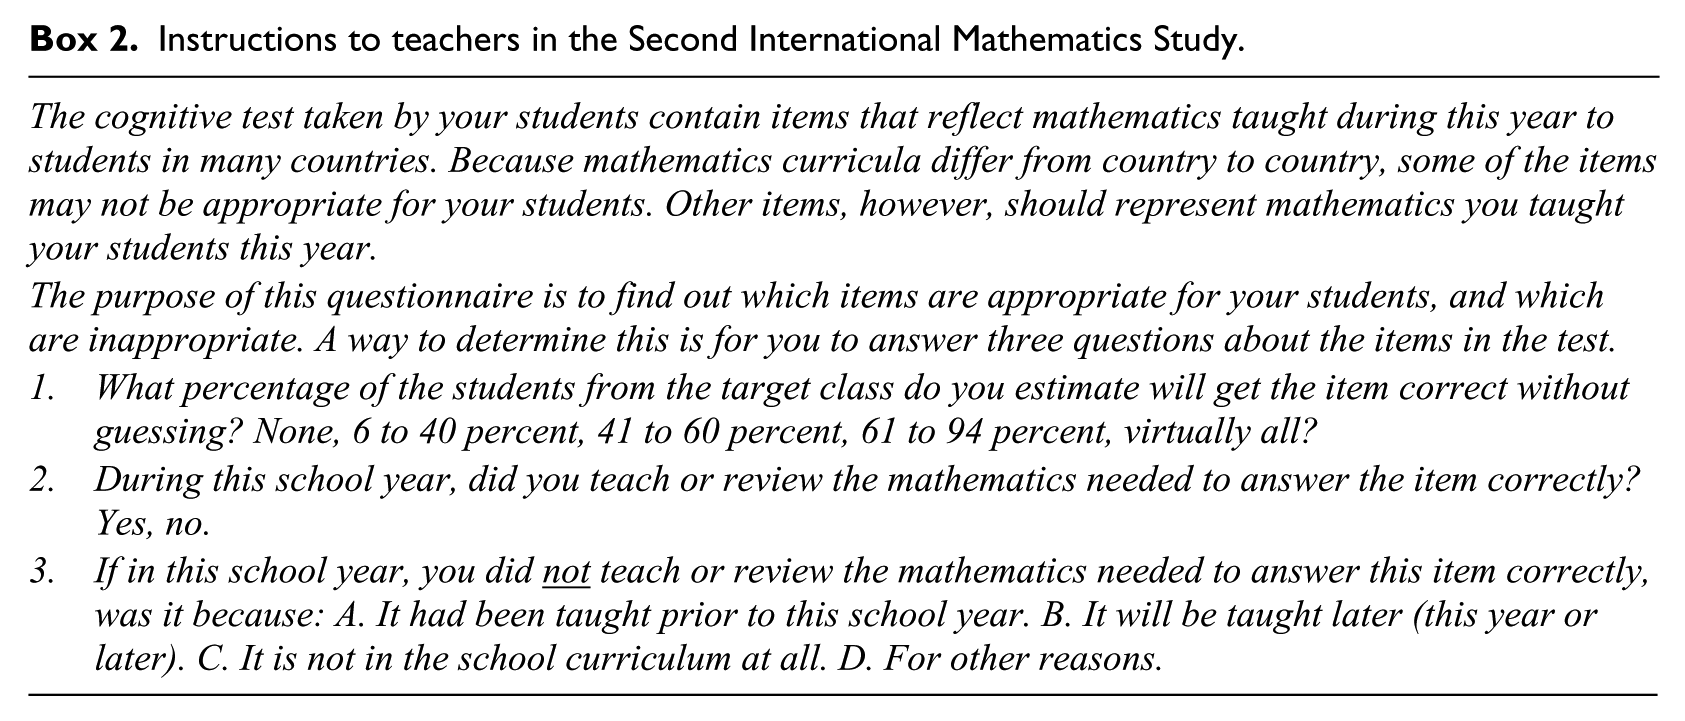
The experience of measuring OTL in the first two studies guided the design of the SIMS, conducted during 1982. However, a number of alterations were made to the OTL instructions and some significant additions to data sources were made (Box 2). The first instruction is similar to the FIMS but the SIMS added two new questions for teachers. The teachers were asked to respond directly to a question on whether the mathematics items were taught in the teacher’s class in the current year and if not, why not (taught in prior year, to be taught later, not in curriculum, or other reason). Another innovation in the SIMS was to ask students to report whether the test item was covered in the classroom. The distribution of responses by students and teachers for a set of 40 common items is shown in Figure 3.
Instructions to teachers in the Second International Mathematics Study.
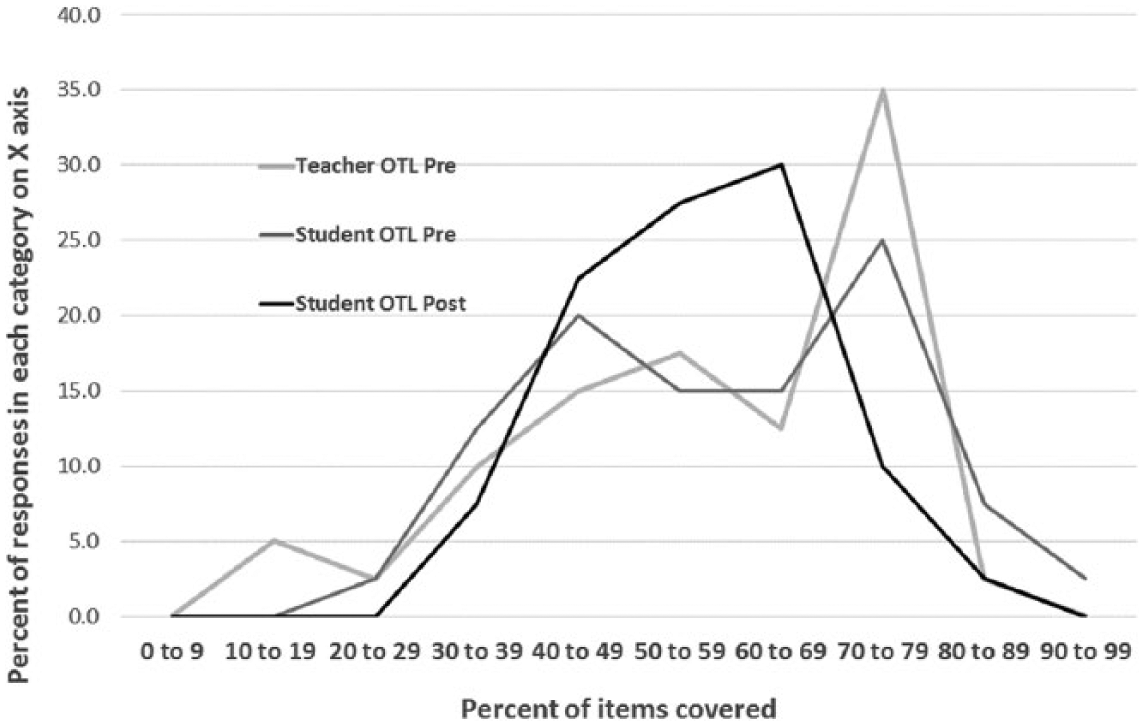
Percent of 40 core items said to be covered at pre and post periods by teachers and student: Second International Mathematics Study 1982. OTL: opportunity to learn.
Another very significant difference in the SIMS from all other IEA studies is that eight countries agreed to conduct both pre-tests and post-tests during the school year, meaning that the test items were asked twice during the school year and OTL was reported by the students twice. The study designers believed that simply reporting the status scores of countries gave a misleading estimate about the effectiveness of the intervening educational experiences. For example, OTL for a topic might be perceived to be high (that is, the agreement between student performance and teacher-reported item coverage is high) because students had already learned that topic in a prior year. To discover whether OTLs for a topic were associated with instruction during the same year, it is necessary to know a student’s pre- and post-performance. Thus, the data examined in that study, and this paper, include pre and post reports from students on their perception of whether the test item content had been covered in the classroom and what their performance was on the mathematics test at both points in time. Teachers only reported once about the coverage of items in the classroom.
The distribution of teacher-reported and student-reported coverage of 40 items is shown in Figure 3 for US teachers at the beginning and end of the school year. Also shown is the percentage of items students answered correctly at both testing periods. This comparison shows that US teachers reported that most of the items in the SIMS test were expected to be covered and only a small percentage was not in the curriculum (Figure 3). The most frequent reason given for not covering a topic “this year” was that the item had been taught previously. Students and teachers appeared to agree at the beginning of the year about the percentage of topics that were expected to be covered in class. However, at the end of the year, students reported that fewer of the items had been covered than anticipated and, thus, teachers believed that more items were covered than observed by students.
A comparison between the percent of items answered correctly and student-reported OTL for the same item could be affected by the difficulty level of an item, which is determined by the sophistication of the response distractors. However, the distributions of student- reported coverage and percentage correct are fairly close (Figure 4). The student median OTL was about 59% in the pre-test and 57% in the post-test.
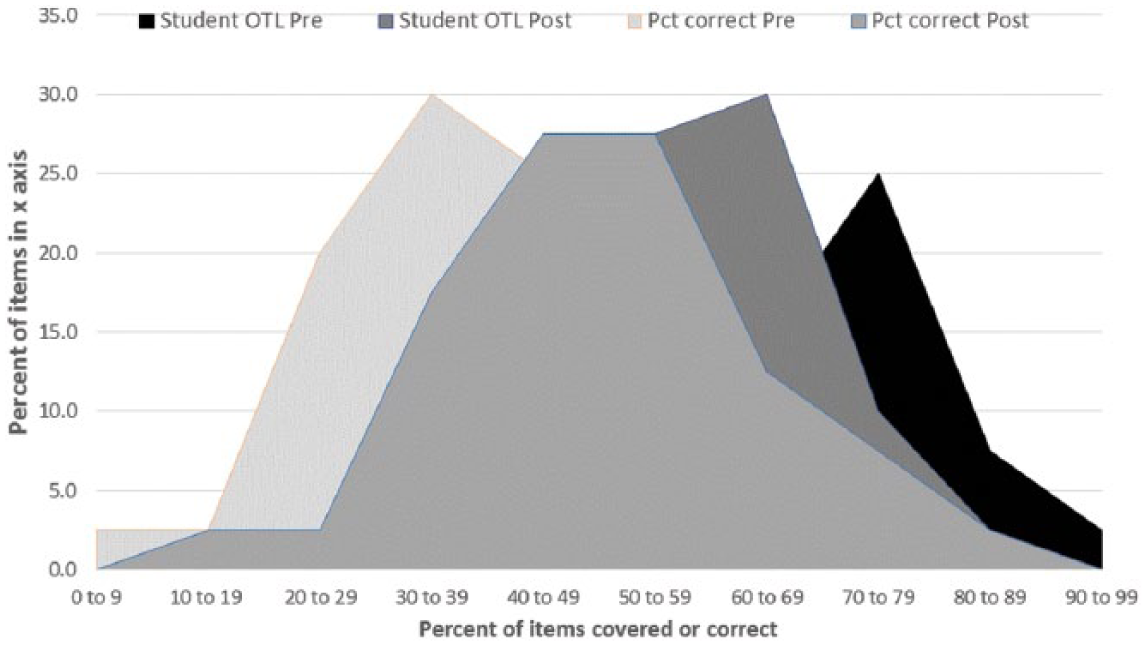
Distribution of student-reported percent of math items covered and percent correct in pre and post Second International Mathematics Study. OTL: opportunity to learn.
The distribution of percentage of the 40 SIMS core items in the SIMS that were anticipated to be covered by students and the percent actually correct shown in Figure 4 illustrates that the distribution of percentage correct at the end of the year forms a bell shape curve, whereas the distribution of the pre-test is skewed, as expected, toward the lower end. On the other hand, the distribution of item coverage, as reported by students at both pre and post, was skewed toward the upper end of the distribution. The change in the percent of items answered correctly between the pre-test and post-test (Figure 4) suggests that an increase in recognition of items occurred during the school year for items in the center of the OTL distribution. This probably signifies that more time was given in class to topics represented by items that were not recognized at the beginning of the class.
The association between the student and teacher reports of OTL and performance for all 180 SIMS test items, shown in Figure 5, shows that little change occurred for most items between the pre-test and post-test conducted in the same year, 1982. The shape of the relationship appears to be slightly curvilinear with the greatest amount of increase occurring among items below 50% correct and the least growth among the easier items. The item that was most difficult, at 20% correct at the pre-test and 55% correct at post-test, is an item that required understanding that the multiplication of negative numbers results in a positive number. The memorization of a simple rule, such as the multiplication of two negatives results in a positive, is easily detected by the test item, whereas changes in scores for other items are more difficult to explain with similar operational rules. The memorization of a simple rule illustrates that some learning in mathematics is not necessarily deep but is consequential and lasting.
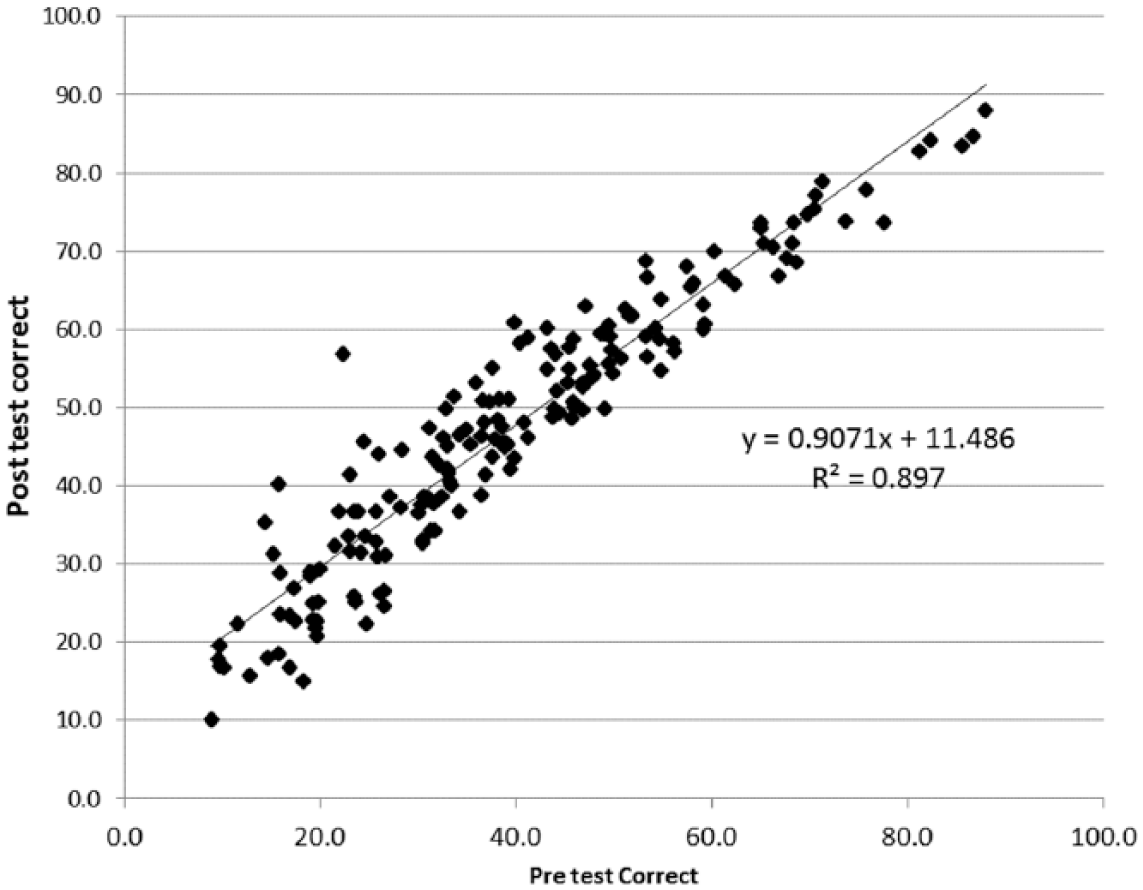
Percent items correct at pre and post-test: Second International Mathematics Study.
Figures 6 and 7 make comparisons for the 40 items that were administered to the students (they were not asked to judge the OTL for all 180 items). The agreement between students and teachers on whether an item was covered in the class during the school year was higher at the end of the year than at the beginning of the year, as indicated by a correlation of about 0.54 for the student-reported OTL at the pre-test and a 0.81 at the post-test. This movement toward a high level of agreement on items covered suggests that students were listening in class and that perhaps the teachers modified their original intentions as they became familiar with the ability levels of the students and, thus, the two distributions merged toward a common mean. The reliability of student and teacher reporting of items may also be low enough to explain a regression toward the mean at a second point of measurement.
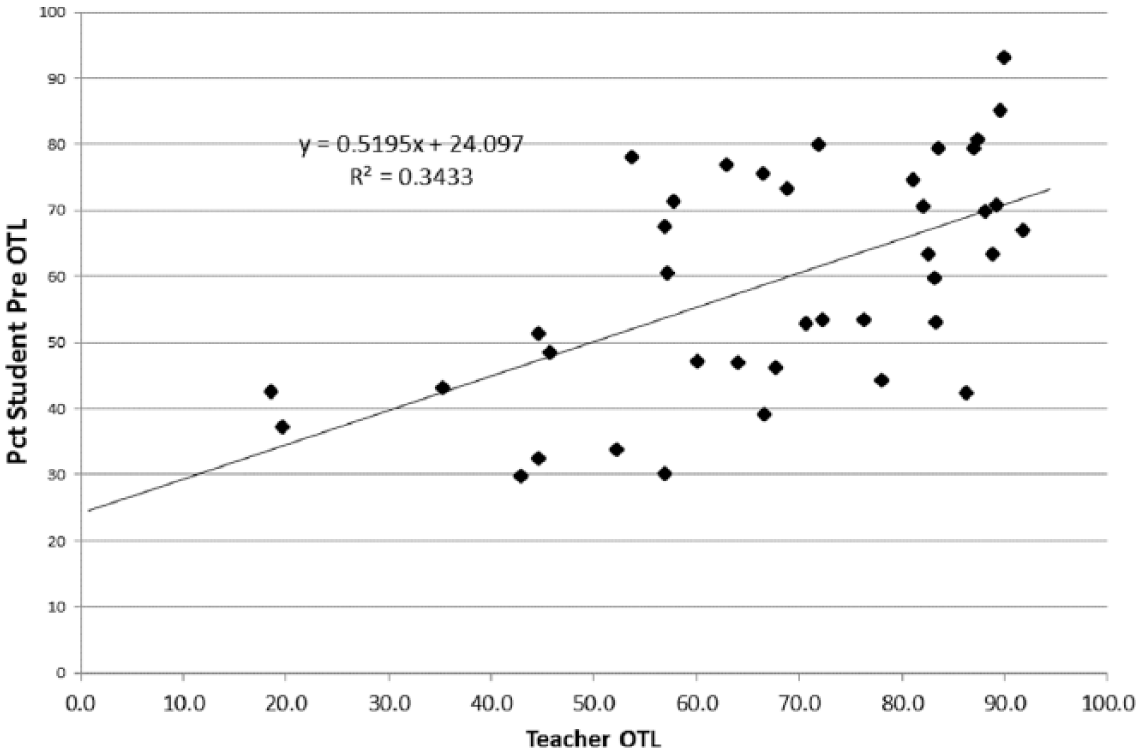
Percent of teachers and students who reported that an item was covered at pre-test: Second International Mathematics Study. OTL: opportunity to learn.
Percent of teachers and students who reported that an item was covered at post-test: Second International Mathematics Study. OTL: opportunity to learn.
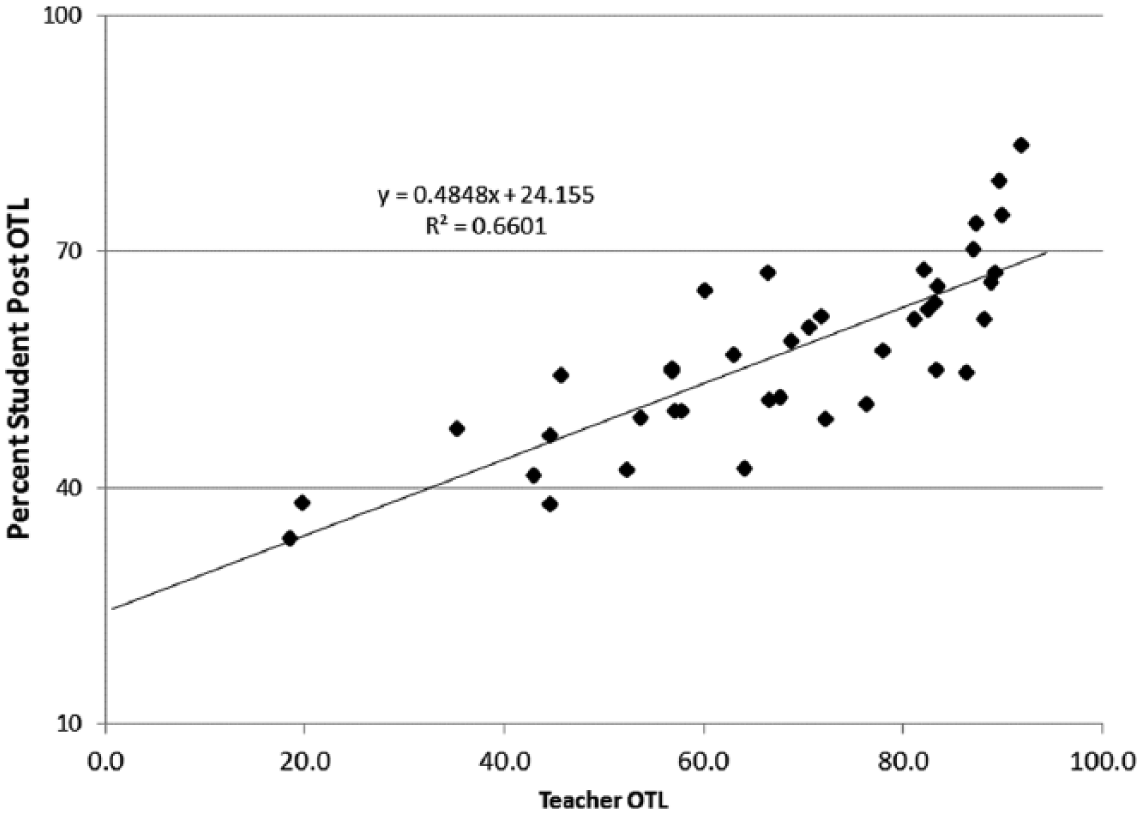
Does higher coverage of a topic convert into higher student performance when administered as a test item (with a choice of four possible answers)? Figure 8 presents a comparable scatterplot to Figure 1 for the FIMS of the relationship between teacher-reported OTL and student average percent correct on the item. The relationship between teacher-reported OTL and student post-test for the SIMS is much lower than in the FIMS. The correlation in the FIMS was 0.74 and in the SIMS it was only 0.15. As Figure 8 shows, the scatter of student coverage extends beyond the regression line at almost every point along the teacher-reported coverage. One significant difference between the two studies appears to be that the SIMS items were more concentrated toward the more difficult end of the distribution than in the FIMS. However, more of the items in the SIMS were highly covered by teachers, and the students were more likely to achieve a higher score. Even so, the items covered by teachers were not necessarily those that were most likely to be learned by students. The wide variation between OTL coverage and student performance in Figure 8 is not easily explained. However, it suggests that the single-item summary index used for OTL was not very reliable as an indicator of teacher coverage, nor a predictor of student performance on a particular item.
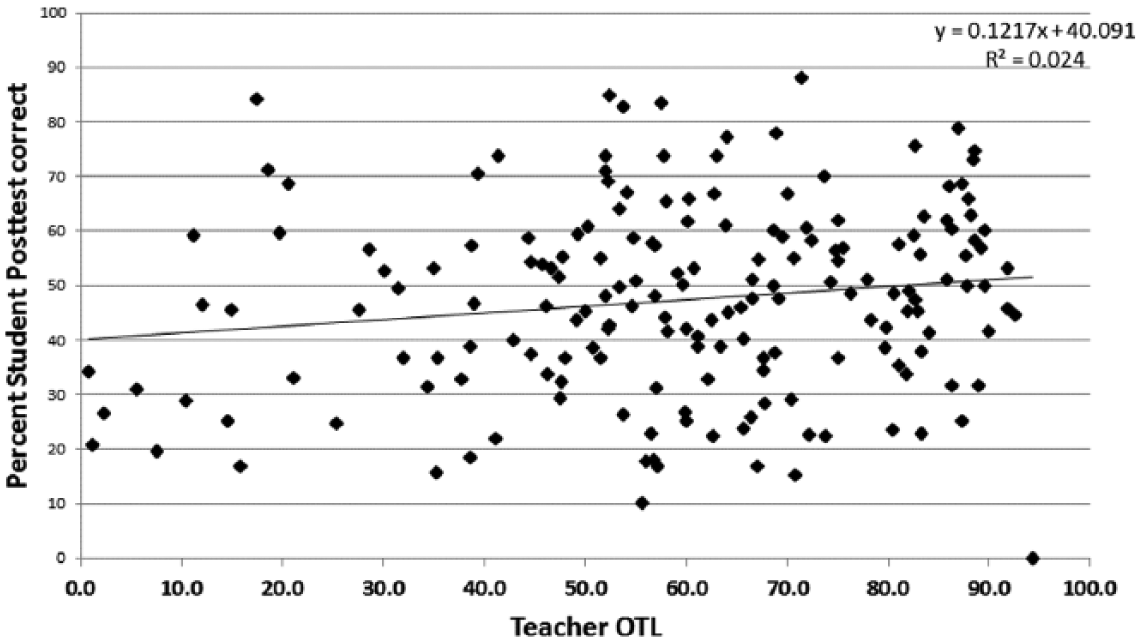
Percent of teacher opportunity to learn (OTL) and student percent correct for items at post-test: Second International Mathematics Study.
A test of whether the extent of teacher-reported coverage of an item was more likely to be associated with change in the test score during the year, rather than the status level of performance, is shown in Figure 9. This estimate of relationships between OTL and change in student performance can only be obtained from the longitudinal measures in the SIMS. While the association between change in student performance on a test item and extent of teacher coverage is low, about .36, the relationship is stronger than the status measure of 0.15 shown in Figure 8.
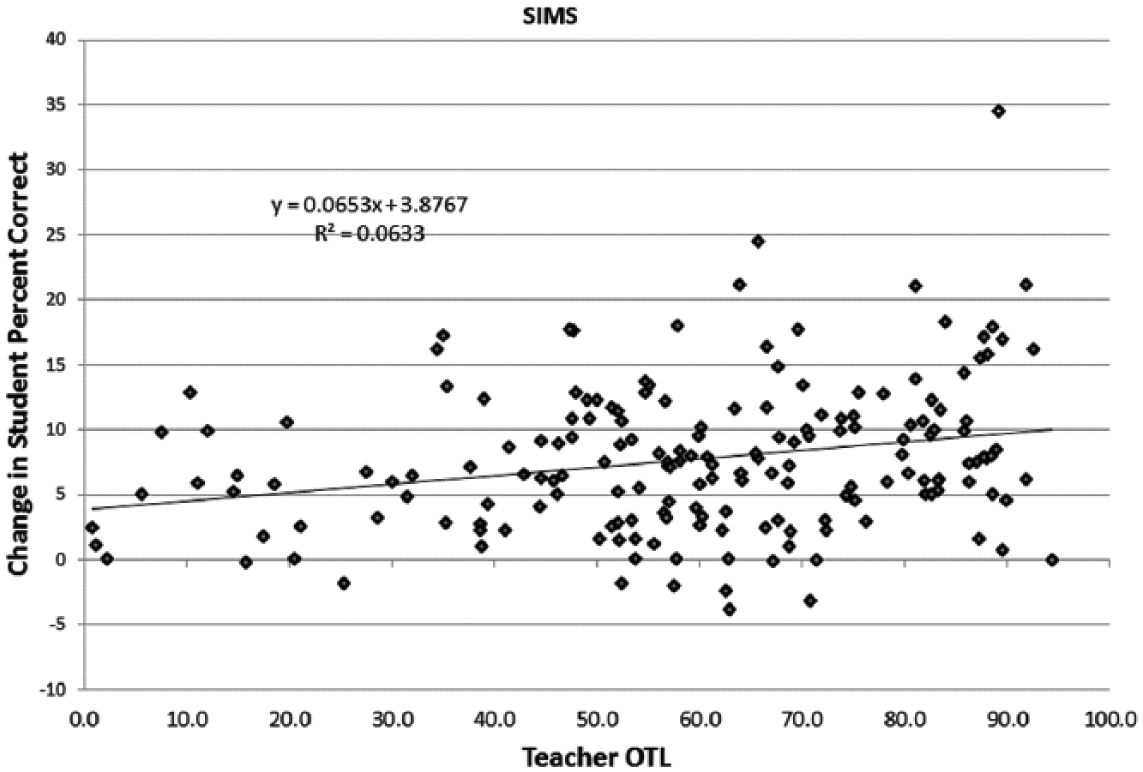
Percent of teacher opportunity to learn (OTL) and change in student percent correct at post-test: Second International Mathematics Study.
One item in Figure 9 is a clear outlier because it changed by 35 points between pre-test and post-test and was covered by almost all teachers. The item is the only item—multiplication of a negative number by a negative number— that was clearly covered by nearly all teachers in the eighth grade in the USA. As pointed out by Muthén et al. (1991),this item indicates how easily a topic may appear to be learned but may not represent a general trait of mathematics ability. Getting the item correct only indicates a specific knowledge of a definition of a rule (Muthén et al., 1991: 16).
On average, the percent correct by students is increased by 0.7 percentage points for every 10% increase in percentage of items covered by teachers (Figure 9). Considering how little change occurs between percent correct on each item between pre-test and post-test (see Figure 5), the scatterplot in Figure 9 is a reminder that teacher subject matter coverage of a topic may be necessary for students to learn a topic, but may not be sufficient for insuring an increase in performance for all students. Factors other than teacher coverage are a part of the equation of learning.
Summary and conclusion of the Second International Mathematics Study
In the set of IEA studies that measure teacher coverage of mathematics in the classroom, the longitudinal aspect of the SIMS along with its expanded exploration of the purpose of covering the item in the classroom provided the best opportunity to explore the relationships between instruction and learning. There are several important lessons from the research papers conducted with this data base.
Firstly, the close association of percent correct between items at pre-test and post-test shown in Figure 5 is a strong reminder that changes in student performance over a single year of school are incremental. Measuring change in student performance is not easily indicated by single items over a single year. The correlation between the individual items at pre-test is .95 with the post-test score. These points represent averages for all students for each item, so individual student correlations would be lower.
Secondly, by measuring OTL as reported both by students and teachers provides useful insights into how differently students and teachers noticed what was happening in the classroom. The different perceptions of students may help explain why the teacher-reported scores of OTL do not necessarily line up with student performance. The relationship between teacher-reported coverage of OTL at the beginning of the year was more closely aligned with student reports at the beginning of the year than it was with student reports at end of the year (r = .58 at pre-test and 0.19 at post-test). This occurs because students recognized that some topics that were expected to be covered during the year (as indicated by the teacher OTL report at the beginning of the year) were not actually covered (or at least not recognized among the items in the SIMS set).
Thirdly, the empirical description of the level of student’s OTL mathematics, as measured in the first three IEA studies from 1959 to 1982, helped establish how much change could be expected in a classroom over a short year and how much classroom coverage of mathematics is “normal.”
Fourthly, from a methodological point of view, the OTL measurement method that uses particular items as the representation of general mathematics ability was found to be a source of measurement errors. As Freudenthal (1975), Porter (1991), and Muthén et al. (1991) suggest, the reporting of item coverage by the teacher (or the student) is likely affected by the teacher’s observations of the ability of the class rather than how the content itself was presented. The nature of the item is sometimes independent of the theory of mathematics learning. The relationship between the percent of items covered in the FIMS and student performance was about .73, but the same relationship in the SIMS was only about 0.15 (Figure 8). The relationship of teacher-reported OTL and student change from pre-test to post-test score was only about 0.25 in the SIMS (Figure 9). The differences in the strength of relationships across the studies (even when examining that of the USA only) suggest that many methodological changes were made to the IEA OTL measurement method over time. Thus, it is not possible to estimate the amount of changes in OTL coverage over time with the IEA studies with any degree of reliability.
Fifthly, OTL and student performance were not equally distributed across the item difficulties. A higher variation is found for those items that were more difficult for the students and less likely to be reported as covered by teachers. The variation among items percent correct appears to be greatest at the middle and upper levels of highly covered items, indicating that the teacher prediction of item coverage did not assure that students would perform well on those items.
This analysis of the OTL measures in the SIMS, as compared with the FIMS, has demonstrated that much more could be learned from a survey that includes measures of change over time rather than from static measures alone. The analysis by Muthén et al. (1991) provides a good example of how the structure of the SIMS data base provides an opportunity to locate the strength of connection between teacher coverage and student performance using models that estimate the changes in mathematics ability and response to teaching. Further development of these techniques was stopped because of the expense and difficulty of conducting cross-national longitudinal studies.
From a policy or theoretical point of view, the key claim of the SIMS was stated in the title of the publication of Travers et al., The Underachieving Curriculum, which laid out the claim that US schools did not have high expectations for students when compared with other countries (McKnight, 1987). The authors found evidence that students at the eighth-grade level were less likely than similar students in other countries to be offered the OTL algebra. After the study was released, the emphasis on algebra in US late elementary grades was increased greatly. A corollary assertion to the fundamental claim of OTL is that a reformed curriculum would lead to increased student achievement. This claim has yet to be clearly empirically demonstrated; however, the evidence in the SIMS is compelling that some small change occurs over a single school year.
Third International Mathematics and Science Study 1995–2011
This section will briefly review the IEA approach to measurement of OTL in the TIMSS and later called the Trends in Mathematics and Science Study. It will identify areas where measurement techniques were adjusted and how well they succeeded in the purpose intended. The review of these surveys unexpectedly uncovered a major change in how mathematics topics themselves were defined and therefore the hoped-for analysis of an analysis of change in school coverage of mathematics and student achievement must be ruled out. The section will end with a discussion of the impact of this research.
OTL measurement 1995–2011
Problems of measurement in the first IEA studies of mathematics required the development of methods to define content areas of mathematics, on how teachers interpreted the content areas, and on how content areas of mathematics could be represented in a testing instrument. By 1995, further development in each of these topics was necessary.
Schmidt and Mcknight (1995) carried out a new cross-national study with the intent of establishing valid instruments for teachers to rate the content goals of the mathematics they covered. The study also established estimates of the age at which students were expected to study each topic, and estimated whether the teachers considered the items appropriate for assessment of their students in each country (Schmidt et al., 1996). New aspects of OTL were added, such as lesson structure, student–teacher interactions, homework activities, teacher background, subject matter beliefs, amount of teacher autonomy, teaching environment as a professional teacher, and the school context (Schmidt et al., 1996: 125–139). Unfortunately, the extensive amount of time required by teachers to complete the questionnaires prohibited the items from inclusion in an international survey of thousands of teachers. Thus, in the final documents the measurement methods and the specific operational measures were altered only slightly from the SIMS and the general concept of OTL remained basically consistent with the items first used in the IEA 1959 study.
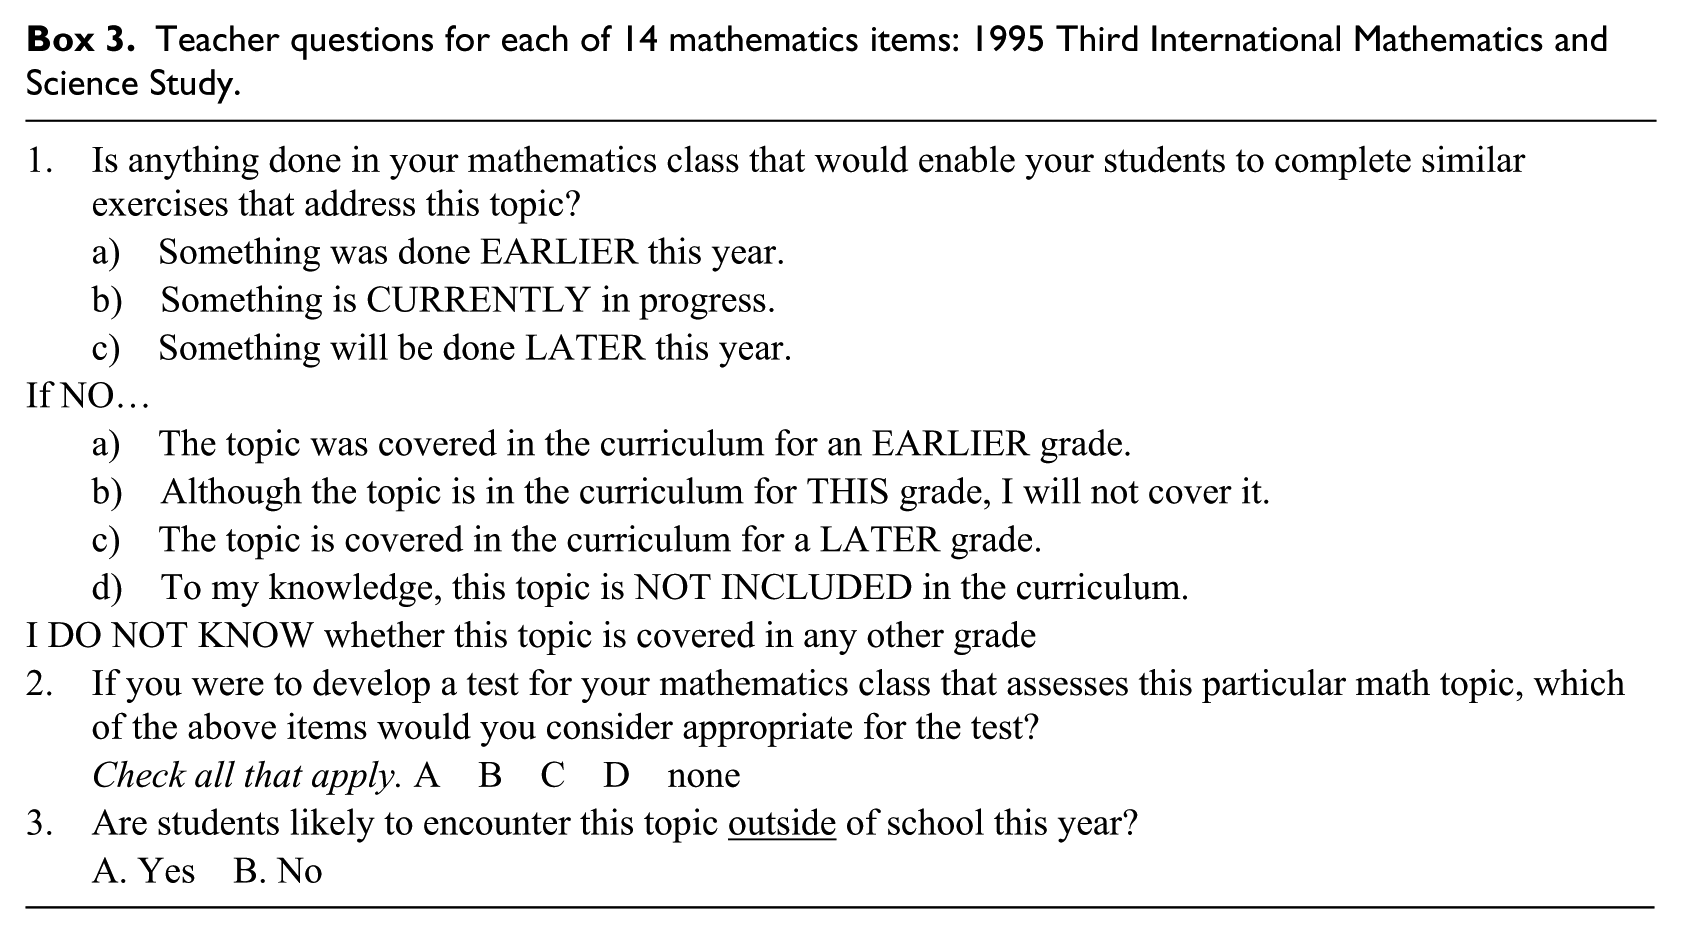
The 1995 TIMSS asked teachers the extent to which their classes covered 21 mathematics topics (Box 3). A second smaller set of topics represented by mathematics problem sets were posed to teachers who reported on whether these topics were used in classrooms. Then, the entire set of test items was reviewed by a mathematics education specialist to estimate whether the item was “matched” with the country’s “intended” curriculum. For example, the 2011 international report on the TIMSS described the following procedures for establishing whether the test item was “matched” to the country curriculum: National Research Coordinators were asked to indicate whether each of the TIMSS 2011 mathematics topics was included in their countries’ intended curriculum through the fourth or eighth grade, and if so, whether the topics were intended to be taught to “all or almost all students” or “only the more able students.” (Mullis et al., 2012)
Teacher questions for each of 14 mathematics items: 1995 Third International Mathematics and Science Study.
After 1995, the detailed analysis of OTL was reduced to a single question for teachers and a judgment made by a mathematics curriculum expert in each country about whether each test item was included in their curriculum. The main use of OTL concepts in the studies between 1999 and 2011 was to validate the content of the test items for an international comparison by item analysis. The TIMSS no longer gathered detailed OTL information as a source for causal analysis of student achievement differences by asking teachers and curriculum experts to rate the test items by whether they were appropriate for their country.
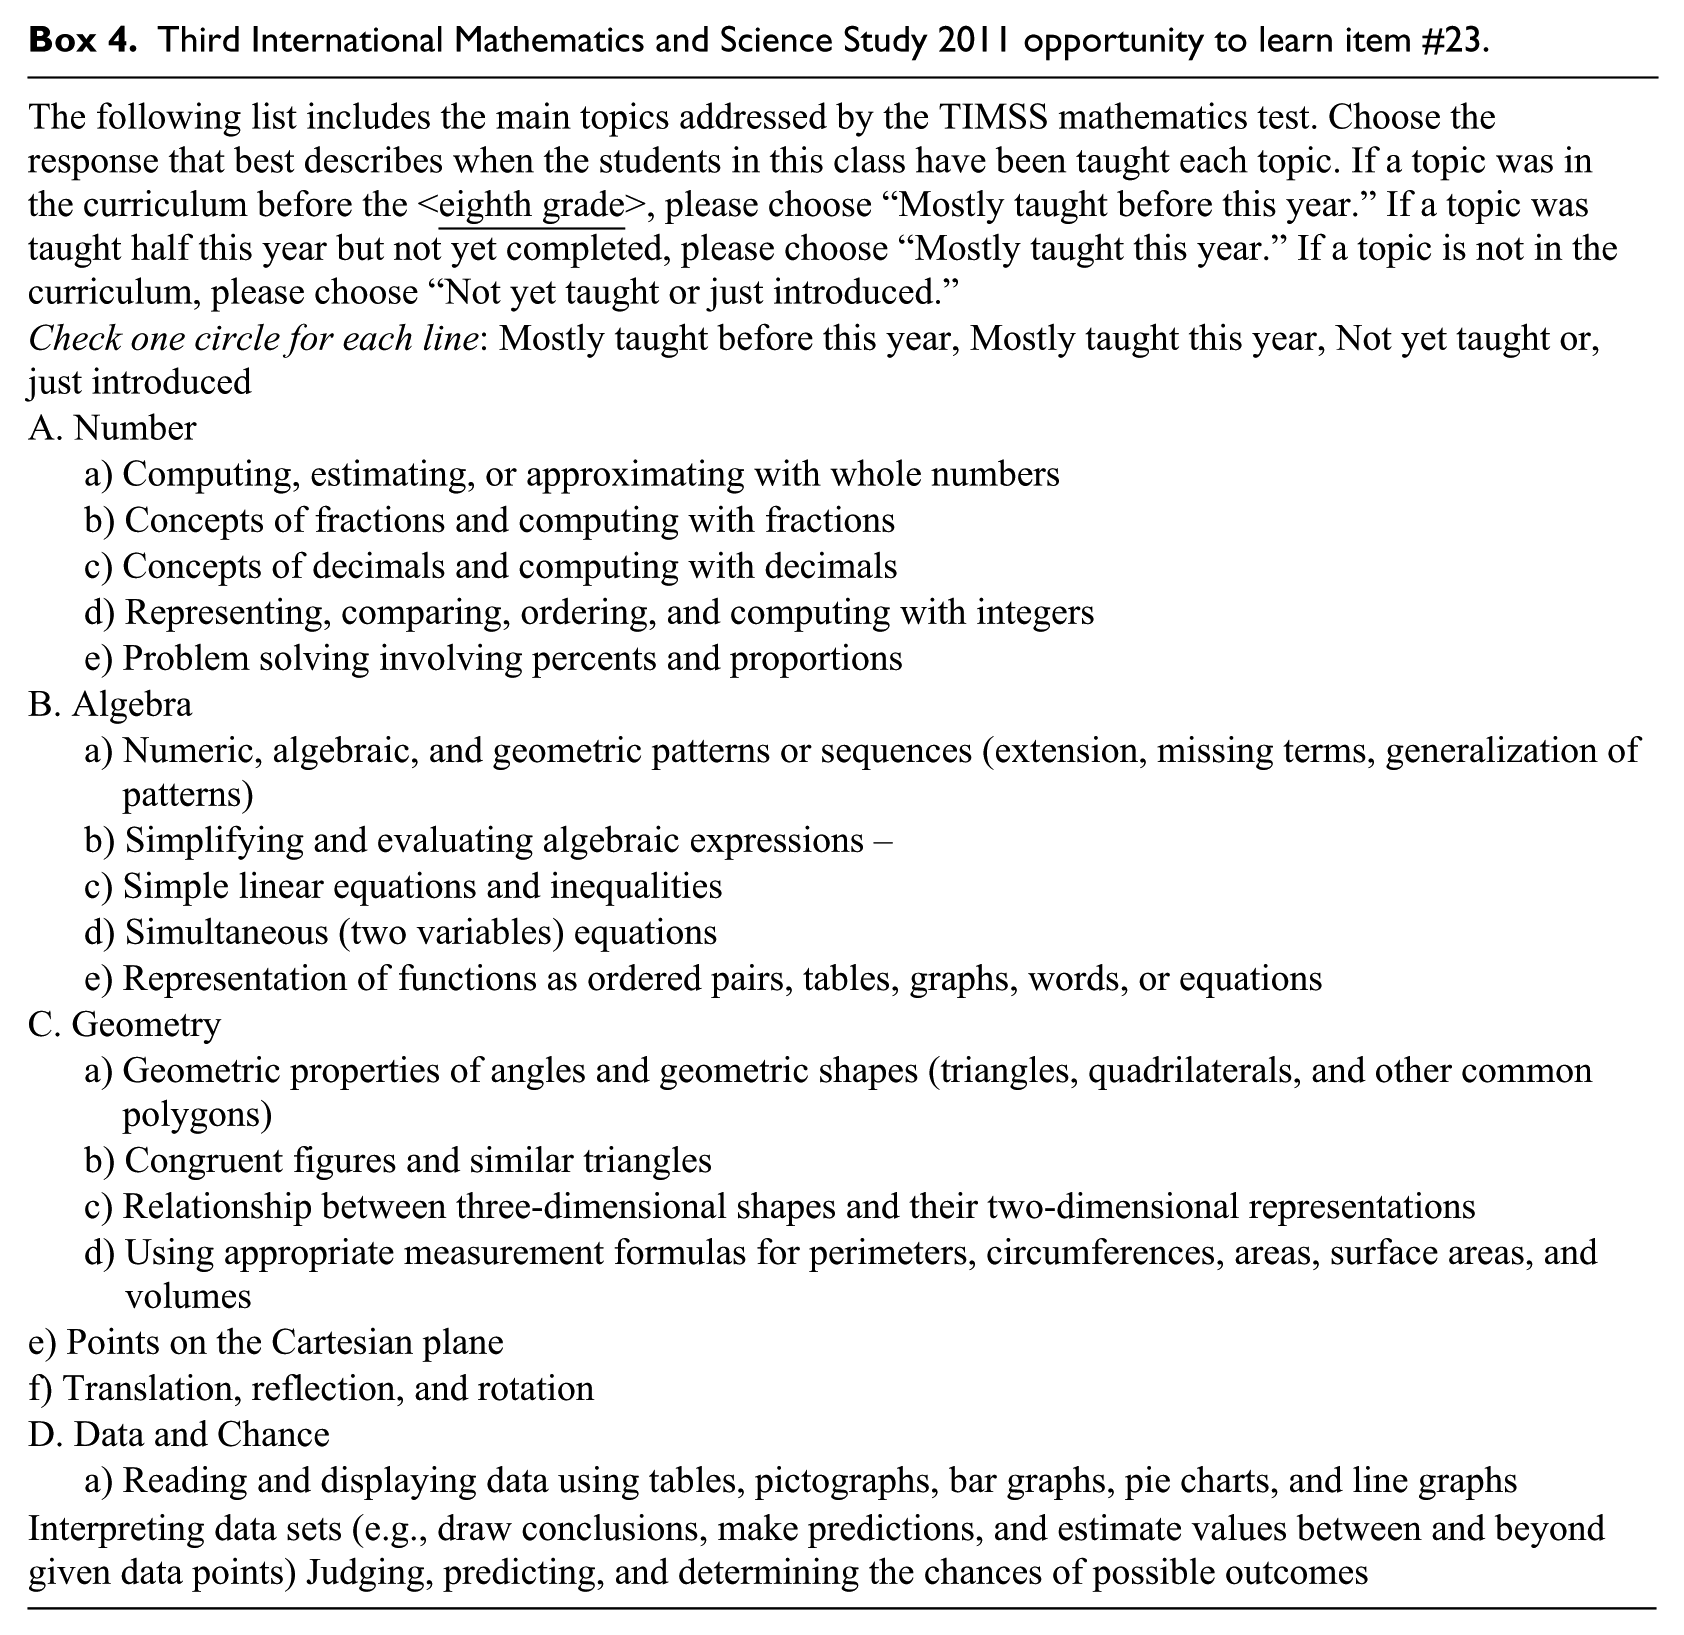
In 2011, the teachers were asked a similar question for 17 mathematics topics (see Box 4).
Third International Mathematics and Science Study 2011 opportunity to learn item #23.
The coverage of topics in the 2011 TIMSS survey (Table 1) shows that US teachers were very likely to agree that these topics were covered in US eighth-grade classrooms. The appropriateness measure in the TIMSS study indicates differences in coverage of the topics in the total test content between countries. However, this estimate of matching items with the curriculum is not a sufficient indication of curriculum coverage.
Eighth-grade mathematics coverage in the USA according to teachers’ reports of topics covered: 2011 Third International Mathematics and Science Study.
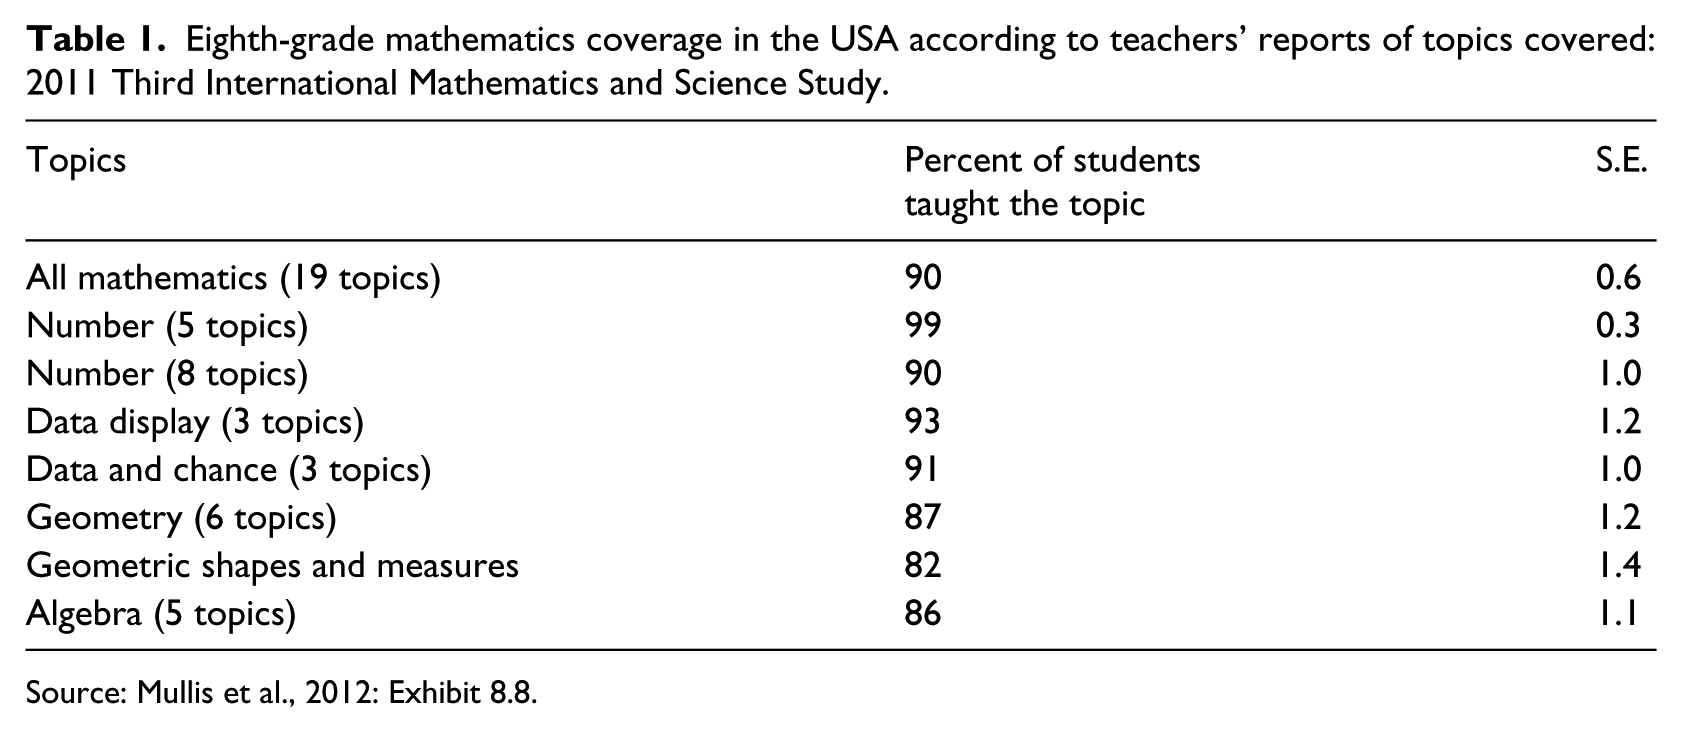
Source: Mullis et al., 2012: Exhibit 8.8.
Each TIMSS publication included a “matching item” matrix in which the percentage of items was reported by country curriculum experts as being covered in their country (and therefore was appropriate for the international comparative test) by achievement score with and without that item. Hencke et al. (2009) carried out a more detailed analysis of the items reported to be covered in the 2003 TIMSS by computing item response theory (IRT) scores for all combinations of country choices of items. Their findings support the IEA International center claim that the test scores computed on all test items correlated with only those items considered appropriate for each country would produce identical results (with an r of .999 or 1 for the 46 tested countries in 2003). In other words, student performance differences between countries do not appear to be affected by whether or not the test items were said to be covered in the classrooms.
This finding is surprising, because a high percentage of items were reported in some countries as “not covered” (Table 2). The average number of items not covered across all 46 countries varies by subject matter. The number of countries that reported TIMSS test items that did not match their curriculum varied from 19 in Measurement to 38 in Algebra. The average percent of items not covered ranged from 8% in Measurement to 28% in Data. For the USA, only 10 Geometry items and 2 Algebra items were noted as not matching the US curriculum.
Number of countries in the Third International Mathematics and Science Study, 2003, in which the test item that did not match the curriculum of the participating country.
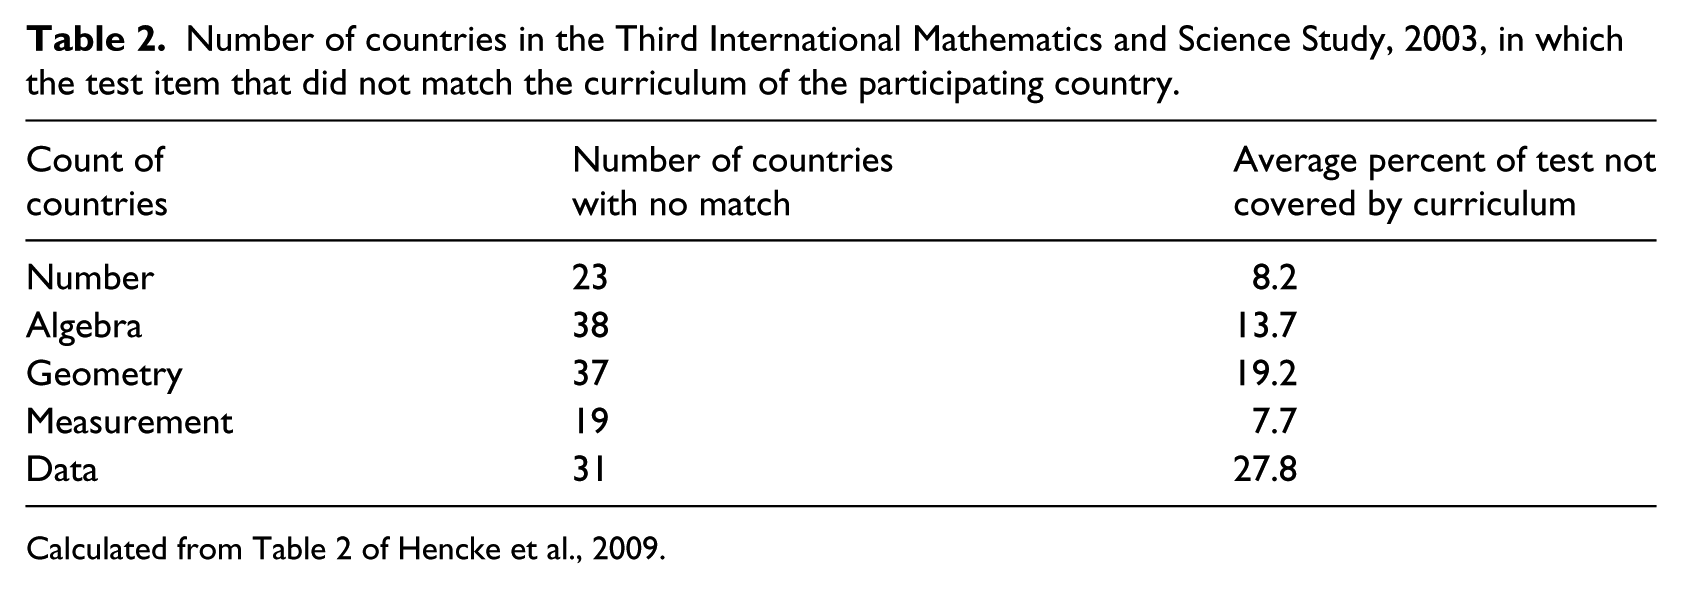
Calculated from Table 2 of Hencke et al., 2009.
Topic coverage
The 1995 survey included 40 basic topics that were divided into more detailed categories for coding purposes (Robitaille et al., 1993). This internationally agreed upon framework of mathematics was then used as a protocol to obtain responses from all participating countries about which of the topics were intended, implemented, and achieved. Figure 10 shows the US teacher-reported coverage of 21 mathematics topics typically covered at the eighth grade, providing a good description of the status of mathematics instruction in 1995. As the figure illustrates, the greatest emphasis then was in number sets and fractions, while geometric concepts received the lowest coverage.
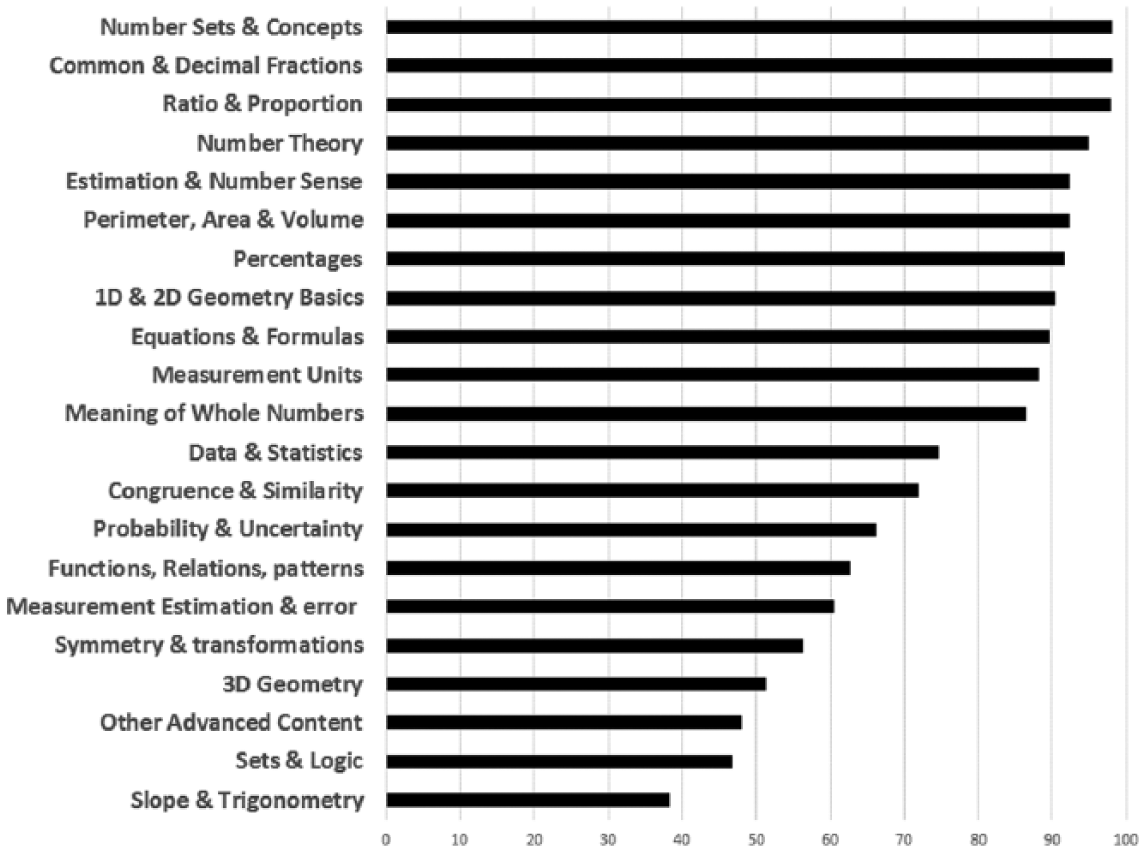
Percent of US teachers reporting that a topic was covered in an eighth grade classroom: Third International Mathematics and Science Study 1995.
An analysis of the names of mathematics topics used in each of the frameworks for survey years 1999–2011 was conducted to determine how extensive the changes were (the complete table is too extensive to include in this paper). The number of test items in each of the key topics areas—Algebra, Geometry, Measurement (data), and Number—changed, as did the names of the topics themselves. In 2011, a high proportion of the framework is represented by topics in measurement, for example. The number and characteristics of participating countries changed and the frameworks for mathematics were probably revised to fully represent the evolving nature of mathematics content in schools of the changing selection of countries participating in the TIMSS. The changes are so great that creating an index of changes in country-level OTL is not possible.
General discussion
This paper reviewed the history of the development of OTL empirical measurements through an examination of IEA international comparative studies from 1959 to 2011. OTL is an important concept because it addresses one of the most enduring education questions: how to achieve equality of learning for students. It assumes that, given equal opportunity, all students have a fair chance of higher levels of learning. Having equal access does not assure equality of outcomes, as was seen in the empirical analysis of these studies (Coleman, 1975). We learned in this investigation that researchers, policy makers, and theorists attempted to refine the concepts of curriculum during the 1960s and 1970s. The Swedish reforms from selective school systems to open schools took place during the 1950s and 1960s. The country’s leaders believed that scientific (empirical) investigation of educational performance would inform the education policy about the results and consequences of school reform (Husén and Dahllöf, 1960, 1965a). Researchers in Sweden were positioned to have access to the international studies underway as well as encouragement from national leaders for school reform. This policy interest intersected with researchers seeking to describe, for the first time, how and why different countries have different levels of learning as a consequence of schooling practices.
The IEA model of OTL and achievement was best expressed by Travers and Westbury (1989) as having three components: intended, the curriculum as developed at an institutional level; implemented, the curriculum as developed at the school, classroom, and teacher levels; and attained or experienced, the curriculum as it emerges at the student level.
Goodlad et al. (1979) suggested that these contexts are “loosely coupled.” The set of decision-making contexts it sets out represents a hierarchy of decision-making levels. While curricula are made at each of these levels, they are rarely consistent across levels. The resulting inconsistency is seen as “slippage” between, for example, the ideal or intended curriculum and the enacted and experienced curriculum.
This review of the relationship between OTL in mathematics and student achievement in five TIMSS surveys (1995–2011) and two earlier studies in mathematics (1959 and 1965) were all based on a single cross-sectional measurement. Only the 1982 SIMS included pre and post measures of OTL and student achievement to permit analysis of change of student performance for different curriculum coverage levels. Even though the amount of time between the pre and the post measurement was only a few months, the significance of teacher coverage was more apparent in that survey than in any of the others. Future studies need to consider not only the measure of time as frequency and content, but also the relationship between time for development in a stepwise fashion if any progress is to be made in describing the relationships between teaching practices and student performance.
What were the consequences of the OTL as a measurement tool for educational practices in the classroom or policy levels? Did the study lead toward a better understanding of what practices improve student performance?
The instruments that were created by the IEA studies beginning in 1959 were useful to categorize and measure the extent of mathematics coverage by the total school system and, as implemented in the classroom, were themselves a useful tool for measuring state-level adherence to the National Council of Teachers of Mathematics (NCTM) standards and also for individual school districts and classrooms. The OTL measurement was also a useful tool for interpreting the results of the national tests being used at the time. The idea of using the OTL framework as a prescriptive tool for school districts was not sufficiently carried out in the SIMS but the idea was turned into a “toolkit” in the TIMSS that was used by school districts to evaluate the coverage of their curriculum and compare it to national and international standards (WGBH Boston, 2003).
The concept of OTL lies behind the development of national standards in mathematics in the USA in 1985, which was led by several participants in the SIMS, such as Joe Crosswhite, then the president of the NCTM, and John Dossey, who became the president in the following year. The NCTM published the National Mathematics Standards in 1989, which used a framework for defining mathematics topics that were similar to the framework designed for the SIMS (Dossey and Wu, 2013). The first publication of the Mathematics standards in 1989 led the US professional associations toward a continuing effort to establish common standards for particular aspects of content areas of mathematics and science and are the precursor to the current “Common Core” set of standards (NCTM, 1989).
Future issues and practices of OTL: What is the state of OTL in 2014?
Empirical studies permit the discussion of the actual size and shape of student and school performances and, thus, may help policy makers decide how much is enough, or how large or frequent something is. For example, the recent cross-national study of OTL suggests that countries with students at different levels of performance are unlikely to have the same rate of return from higher OTL coverage (Schmidt et al., 2013). They found that the relationship between coverage of mathematics and student achievement across countries can be described as a quadratic relationship that begins with a strong relationship for countries with low levels of student performance that flattens or declines among countries at the upper levels of student performance. These analyses provide guidance for future policy and research about the relationship between what is taught and what is learned.
An important outcome of these efforts is the continual development and testing of frameworks of the content areas of mathematics. Frameworks are required to define curriculum access empirically through using the frameworks of student assessment. This method of measurement was refined in the SIMS and TIMSS (and science in TIMSS). However, research efforts to further refine the measurement techniques were not continued in later IEA studies, although some of the indicators of topic coverage were continued. Another approach was taken in the 2012 Programme for International Student Assessment (PISA) study of mathematics that has provided useful insights about the shape of the distribution of opportunities and achievement.
The review of empirical relationships between classroom coverage of mathematics topics and achievement on those topics in the IEA and PISA surveys suggests that the relationship between access to curriculum and learning is weak. This result raises important questions about both the methods of measurement and the policies of curriculum reform. Recent papers by Porter (Polikoff and Porter, 2014; Porter et al., 2011) have also pointed out how the expectation of aligning the curriculum with achievement expectations has not met with theoretical expectations. Porter’s more extensive analyses of macro curriculum reforms are supported by the simplistic relationships presented in this paper.
The only international study that provided insights into the causality of these processes was the SIMS, which included pre and post measures of both achievement and teacher and student OTL. The relationships that can be obtained from that study are the most likely to lead to new insights about how the topics of learning are categorized and reported and how the connections between coverage and learning occur. Future studies should examine the examples of the SIMS more closely to improve future studies of the role of curriculum in altering student opportunities.
Footnotes
Acknowledgements
Dr Ian Westbury of the University of Illinois provided me with substantial guidance and editorial review especially of the history of OTL in Sweden. Without his advice, the full understanding of the history of curriculum measurement as it began in Sweden, this analysis would not have been possible. This paper was initiated by discussions with Kenneth Travers and David Rutkowski as a review of the contributions of the IEA studies to understanding the measurement of curriculum. All remaining errors are mine alone.
Declaration of Conflicting Interests
The author(s) declared no potential conflicts of interest with respect to the research, authorship, and/or publication of this article.
Funding
The author(s) received no financial support for the research, authorship, and/or publication of this article.