
Abstract
Neuropathic pain affects approximately 10% of the adult population and is commonly treated with gabapentin (GBP), a repurposed anticonvulsant drug. Despite its widespread use, GBP’s effectiveness varies significantly among patients, highlighting the need to better understand its functional and molecular impacts on human nociceptors. Here we characterized the electrophysiological and transcriptomic effects of GBP on primary neurons derived from the dorsal root ganglia (DRGs) of ethically consented human donors. Using patch-clamp electrophysiology, we demonstrated that GBP treatment reduced neuronal excitability, with more pronounced effects in multi-firing vs. single-firing neurons. Notably, significant donor-specific variability was observed in electrophysiological responsiveness to GBP treatment in vitro. RNA sequencing of DRG tissue from the donor that was more responsive to GBP revealed differences in transcriptome-wide expression of genes associated with ion transport, synaptic transmission, inflammation, and immune response. Cross-transcriptomic analyses further showed that GBP treatment counteracted these alterations, rescuing aberrant gene expression at the pathway level and for several key genes. This study provides a comprehensive electrophysiological and transcriptomic profile of the effects of GBP on human DRG neurons. These findings enhance our understanding of GBP’s mechanistic actions on peripheral sensory neurons and could help optimize its use for managing neuropathic pain.
Introduction
Neuropathic pain affects approximately 10% of the adult population and arises from damage or dysfunction within the somatosensory nervous system.1–3 It manifests in conditions such as diabetic neuropathy, postherpetic neuralgia, and chemotherapy-induced peripheral neuropathy (CIPN). The management of neuropathic pain poses significant challenges due to its complex pathophysiology, which involves aberrant ion channel activity, synaptic dysfunction, and neuroinflammation.4–7
Gabapentin (GBP), originally developed as an anticonvulsant, has become one of the most widely prescribed treatments for neuropathic pain.8–10 GBP appears to exert its pain-relieving effects by binding with high affinity to the α2δ1 subunit of voltage-gated calcium channels (VGCCs) and ultimately interfering with the function of α2δ1’s binding partners: notably the α1 subunit of VGCCs (the pore protein) though possibly also N-methyl-D-aspartate receptors (NMDARs), neurexin-1α, and thrombospondin. This interference can ultimately reduce calcium influx, neurotransmitter release, and neuronal hyperexcitability, often characteristic of neuropathic pain conditions.10–13 Despite its widespread clinical use, GBP's analgesic effects vary significantly among patients.8–9 Additionally, side effects—including sedation, dizziness, and potential for misuse—raise concerns about its long-term utility.14–17 These limitations underscore the importance of understanding GBP’s mechanisms of action in human nociceptors.
Despite its well-documented role in modulating calcium channel activity, GBP’s precise functional and molecular effects on human sensory neurons remain poorly characterized. 10 Most insights into GBP’s mechanisms derive from rodent models, which do not fully capture the complexities of human sensory neuron biology. 18 Furthermore, to the best of our knowledge, the transcriptome-wide effects of GBP have not been studied in any neuronal system, leaving a significant gap in understanding its molecular actions. Dorsal root ganglion (DRG) neurons, which serve as critical mediators of nociception and are damaged in peripheral neuropathies, are an important context in which to study GBP’s mechanisms of action. 19
To bridge this knowledge gap, we examined the electrophysiological and transcriptomic effects of GBP on primary human dorsal root ganglia (hDRGs). Samples were obtained from ethically consented organ donors, and GBP’s effects were evaluated using patch-clamp electrophysiology and RNA sequencing (RNA-seq). Electrophysiological experiments revealed that in vitro GBP treatment reduces neuronal excitability, with effects more pronounced in multi-firing compared to single-firing neuronal subtypes. Transcriptomic analysis further revealed that GBP treatment modulates the expression of genes involved in ion transport, synaptic transmission, inflammation, and immune response. We also observed significant donor-specific variability in the electrophysiological responsiveness of hDRG neurons (hDRG-N) to GBP. Cross-transcriptomic analyses demonstrated that responsiveness to GBP is correlated with the rescue of altered expression of genes related to ion transport, synaptic signaling, and inflammatory and immune responses.
This study details the electrophysiological and transcriptomic effects of GBP on hDRGs and highlights donor-specific variability in both baseline properties and response to in vitro GBP treatment. Altogether, these results may be relevant to GBP’s clinical effectiveness and patient-specific effects. By providing comprehensive electrophysiological and transcriptomic data, we deepen our understanding of GBP’s mechanisms of action and offer valuable insights that can be useful in optimizing its clinical application in managing neuropathic pain.
Materials and methods
hDRG extraction, culture, and treatment
hDRG tissue was acquired from ethically consented organ donors at the University of New Mexico Hospital in coordination with New Mexico Donor Services. This study was conducted in compliance with institutional ethical guidelines and approved by the University of New Mexico Health Sciences Center Human Research Review Committee (Institutional Review Board; approval number 23-205). Research was conducted in accordance with the Declaration of the World Medical Association. Details of the donors are summarized in Table 1.
Donor demographics and characteristics.

Sex, age, ethnicity, BMI, toxicology results, and cause of death for the three donors that provided DRG tissue for the in vitro experiments and the tissue transcriptomic profiling in this study.
hDRG neuron cultures were performed as previously described.19,20 Briefly, hDRG tissues—predominantly lumbar DRGs—were mechanically and enzymatically dissociated, washed, and then cultured on poly-D-lysine (PDL)-coated coverslips or wells in Neurobasal Plus medium supplemented with fetal bovine serum (FBS), B-27, GlutaMAX, and antibiotic-antimycotic (Thermo Fisher Scientific). Cultures were maintained for up to 10 days in vitro (DIV). Electrophysiology experiments were performed on DIV 3–10 while experiments for RNA-seq were conducted on DIV 4–5.
For treatment experiments, hDRG neuron cultures were exposed to 100 µM GBP (G0318, TCI Chemicals) or vehicle control (equal volume H2O) overnight (~16 h) before downstream analyses, including electrophysiological and molecular assays. 100 µM GBP has shown effectiveness and low toxicity in studies of rat DRG cultures, including after 1 h to several days of incubation and across different DRG neuron subtypes.21–24 Additionally, 100 µM is a high yet still clinically relevant concentration, as observed in the serum and plasma of patients treated with GBP.25–26 We chose overnight treatment as GBP actions are reported to take around at least 17 h to develop in vitro and days to weeks in a clinical setting. 27
Immunohistochemistry
Immediately after extraction, hDRG tissues were embedded in optimal cutting temperature (OCT) compound. Frozen OCT-embedded hDRG tissue was sectioned at 20 µm using a cryostat then mounted onto glass slides and allowed to adhere overnight at room temperature. hDRG tissue sections were washed 5× in 1X PBS before being incubated for 1 h at room temperature in a blocking solution containing 0.3% Triton X-100 (A16046.AE, Thermo Fisher Scientific) and 10% fish gelatin (22010, Biotium) in 1X PBS. Then, the sections were incubated at room temperature overnight with the following primary antibodies and dilutions: chicken anti-peripherin (PA1-10012, Invitrogen, 1:1000) and rabbit anti-α2δ1 (ACC-015, Alomone Labs, 1:1000). Slides were rinsed 5× in 1X PBS, followed by a 2-h incubation in secondary antibodies: goat anti-chicken AF555 (ab150170, Abcam, 1:2000) and donkey anti-rabbit AF488 (A21206, Thermo Fisher Scientific, 1:2000). After secondary antibody incubation, the sections were washed 3× in 1X PBS then treated with Sudan Black B (J62268.09, Thermo Fisher Scientific) for 30 min to reduce autofluorescence. Coverslips were applied using Fluoromount-G Mounting Medium with DAPI (00-4959-52, Thermo Fisher Scientific). Immunofluorescence was visualized using a THUNDER Imaging System (Leica Microsystems) at 40X magnification and an Olympus IXplore IX83/ Yokogawa CSU-W1 Spinning Disk Confocal Microscope (Evident Microscopy) at 60X magnification.
Whole-cell patch-clamp electrophysiology
Patch-clamp electrophysiology was performed as previously described. 19 Recordings were done at room temperature, and slips were perfused with artificial cerebrospinal fluid (aCSF) bubbled with 95% O2/5% CO2. aCSF contained 113 mM NaCl, 3 mM KCl, 25 mM NaHCO3, 1 mM NaH2PO4, 2 mM CaCl2, 2 mM MgCl2, and 11 mM dextrose (MilliporeSigma), pH 7.4. Patch pipettes were pulled with a DMZ Zeitz-Puller (Werner Zeitz) from borosilicate thick glass (GC150F, Harvard Apparatus), had an electrode resistance of 7–9 MΩ, and contained an intracellular patch pipette solution with 120 mM K-gluconate, 11 mM KCl, 1 mM CaCl2, 2 mM MgCl2, 10 mM HEPES, 11 mM EGTA, and 4 mM Mg-ATP (MilliporeSigma), pH 7.4. Cells with series resistance > 20 MΩ or unstable baselines were discarded. hDRG-N were identified using an IR-2000 Infrared Monochrome Video Camera (Dage-MTI) equipped with interference contrast optics. Cell diameter was measured using the IR-Capture software (Dage-MTI). Current clamp recordings were done using a MultiClamp 700B Microelectrode Amplifier (Molecular Devices). Data was acquired using an Axon Digidata 1550B Low-Noise Data Acquisition System (Molecular Devices) and Axon Clampex 11 software (Molecular Devices). Bridge balance was applied for all recordings.
Electrophysiology data analysis
Analysis was done as previously described using the Python package pyABF (v3.12) and Easy Electrophysiology (v2.5.1).19,28 Cell capacitance was measured using the whole-cell compensation circuit from MultiClamp 700B (Molecular Devices). Current clamp recording sweeps started with 25 ms of the cell at resting membrane potential (RMP). This was followed by 500 ms current input in 10 pA increments, with 500 ms recovery between each sweep. Sweeps started at −100 pA and continued until the neuron reached inactivation or up to 4 nA. RMP was calculated for the first sweep in the 25 ms after establishing whole-cell configuration. The first −100 pA hyperpolarizing current injection was used to calculate sag ratio and input resistance. If a neuron fired an action potential (AP) during the recovery period of any hyperpolarizing current injection, the neuron was classified as rebound-firing. Rheobase was calculated as the current injection in which a neuron fired its first AP during the depolarizing 500 ms current injection; therefore, the lowest possible value for rheobase was 10 pA. The first-spike latency (FSL) was the time after the start of current injection of the rheobase AP. Neurons that had an FSL >100 ms were classified as delayed-firing. Neurons that fired more than one AP during any depolarizing current injection step were classified as multi-firing while neurons that fired only one AP were classified as single-firing.
Spontaneous and ongoing activity were measured in current clamp mode with either no applied current (at rest) or with enough current applied to hold the membrane voltage at −45 mV, respectively; cells that fired any AP during a 30-s recording were classified as having either spontaneous activity (at rest) or ongoing activity (at −45 mV). Depolarizing spontaneous fluctuations (DSFs)29–31 were analyzed using the spontaneous activity at rest trace with the program frequency-independent biological signal identification (FIBSI).32–34 AP waveform properties were calculated using the rheobase AP using Method II in Easy Electrophysiology. 35 We did not correct for liquid junction potential. Statistics comparing all electrophysiological properties were done in GraphPad Prism (v10.0.2) using a Fisher’s exact test (on percentages), Kolmogorov-Smirnov test, Mann-Whitney U test, or two-way ANOVA test with uncorrected Fisher’s Least Significant Difference (LSD) test.
RNA sequencing
Total RNA was isolated from frozen hDRG tissue (n = 3) and primary hDRG cultures (GBP-treated or vehicle-treated, n = 3 per condition) using the Monarch Total RNA Miniprep Kit (New England Biolabs), following the manufacturer’s protocol. The quantity and purity of isolated RNA were initially assessed using a NanoDrop spectrophotometer (Thermo Fisher Scientific) while the integrity of the RNA was evaluated using the 2100 Bioanalyzer (Agilent, for hDRG tissue samples) or the 5400 Fragment Analyzer System (Agilent, for hDRG culture samples).
Total RNA with rRNA removed (H16 and H17 tissue) or poly-A-captured mRNA (H22 tissue and culture) underwent library preparation, the former of which was directional. The libraries were sequenced on a NovaSeq X Plus Sequencing System (Illumina) using a 150-bp paired-end read strategy. This sequencing approach provided comprehensive coverage, generating approximately 12 Gb (H16 and H17 tissue) or 6 Gb (H22 tissue and culture) of raw data per sample, which resulted in over 45 million or 20 million raw read pairs for each sample, respectively. This depth of coverage ensured robust quantification of gene expression levels and accurate detection of differentially expressed genes (DEGs). Phred scores—Q20 > 97.5% and Q30 > 93.5% for all samples—indicated that sequencing was of high quality and that data was suitable for further analysis.
Bioinformatic analysis
Raw data underwent filtering of paired reads when either read (1) was contaminated with an adapter (1.0%–2.4%), (2) had >10% uncertain nucleotides (N) (≤0.01%), or (3) was of low quality (Q ≤ 5 for >50% of nucleotides) (<0.00%). Poly-G tails—an occasional artifact of two-color chemistry systems—were trimmed using BBDuk when ≥20 bp. Quality was ensured by several metrics using FastQC. High-quality reads were aligned to the Ensembl human reference genome (GRCh38, release 112) using HISAT2, and gene expression was quantified using StringTie. Differential gene expression analyses were conducted using edgeR.
The generalized linear model quasi-likelihood method was used to analyze differential gene expression in hDRG tissues from the donor with greater responsiveness to in vitro GBP treatment (H22) vs. the less-responsive donors (H16/H17). We harnessed our repository of sequenced hDRG tissue to improve the analysis and identification of a unique transcriptional signature characteristic of the more-responsive donor (H22). Specifically, all of our sequenced donor hDRG tissues that had complete accompanying metadata (n = 19) were included in the gene count data and design matrix. To best account for potential confounding factors, library preparation/ RNA-seq strategy as well as donor age (in 10-year bins), sex, and ethnicity (white and/or Hispanic) were included in the design matrix in addition to responsiveness to GBP (the contrast being made). This strategy provided representation of the wider experimental, demographic, and transcriptomic context of all donors to help control for covariates and improve dispersion estimation. Ultimately, this allowed a more rigorous determination of notable DEGs in the more-responsive donor vs. less-responsive donors despite having a lower number of total samples under direct comparison (n = 3).
To analyze differential gene expression between GBP-treated and vehicle-treated control hDRG cultures, the quantile-adjusted conditional maximum likelihood method was used since treatment was the only factor. For both datasets, a threshold of |log2FC| ≥ 0.4 (FC: fold change) and p ≤ 0.05 was used to define significant DEGs. This Ensembl-HISAT2-StringTie-edgeR pipeline was utilized given its ranking as the overall most accurate pipeline for identifying DEGs in a recent RNA-seq benchmarking study. 36
Gene Ontology (GO) gene set enrichment analysis (GSEA) was conducted using clusterProfiler on the differential gene expression analysis results for both datasets (hDRG tissue and treated hDRG culture), using log2FC-ranked lists of all expressed genes as input. A threshold of p ≤ 0.05 was used to define significantly enriched terms. While significantly enriched terms representing a variety of biological processes, molecular functions, and cellular components were identified, key representative terms were selected within the themes of ion transport, synaptic transmission, inflammation, and immune response given the ubiquity of these themes in the significantly enriched term sets as well as their relevance to neuronal activity and pain modulation.
Scaled principal component analysis (PCA) of hDRG tissue samples was conducted in base R using raw counts that underwent trimmed mean of M-values (TMM) normalization in edgeR. The heatmap of strong DEGs (|log2FC| ≥ 0.4, FDR ≤ 0.1) in GBP-treated vs. vehicle-treated control hDRG cultures was generated using pheatmap, with log2TPM as input and scaling by gene to generate Z-scores for each sample. Cross-species single-cell data compiled and analyzed by Bhuiyan et al. 37 was accessed, analyzed, and preliminarily visualized via the Harmonized DRG and TG reference atlas shiny app for CACNA2D1 expression 38 and DEG expression. 39 All other results were visualized using ggplot2.
Counts (raw and TPM), differential gene expression analysis results, and GSEA results for the two datasets and the cross-transcriptomic analysis comparing these datasets are available in the Supplemental Table, accessible at the following link: https://www.delapenalab.com/research
Results
α2δ1 is abundantly expressed in hDRG neurons
α2δ1 (encoded by CACNA2D1) is recognized as the target of GBP, playing a critical role in its mechanism of action. To confirm whether the expression of CACNA2D1 extends across species—including humans—and DRG neuron subtypes, we utilized a resource of integrated single-cell RNA-seq data from the DRG of several species,37,38 including three datasets from hDRG-N.40–42 DRG neurons from 23 datasets were integrated and clustered based on the expression profile of 2000 variable genes, allowing the cross-species classification of neuronal subtypes by marker gene expression (Figure 1(a)). Notably, CACNA2D1 was broadly expressed across all DRG neuron subtypes (Figure 1(b)), with varying levels of expression in specific subtypes of hDRG-N: Calca+Adra2a (100%), Calca+Oprk1 (100%), Ntrk3low+Ntrk2 (100%), Th (100%), Calca+Smr2 (96.88%), Mrgprd (96%), Sst (93.10%), Calca+Sstr2 (89.74%), Ntrk3high+S100a16 (87.50%), Trpm8 (85.71%), Calca+Bmpr1b (84%), Atf3 (76.92%), Pvalb (72.09%), and Ntrk3high+Ntrk2 (60%) (Figure 1(c)). These data demonstrate that CACNA2D1 is ubiquitously expressed in various nociceptive and mechanosensory neuronal subtypes across species, suggesting its pivotal role in sensory neuron populations.

Target of GBP, α2δ1, is highly expressed in hDRG neurons. (a) Uniform manifold approximation and projection (UMAP) plot depicting clustering of cross-species DRG neurons labeled by marker gene expression, identifying diverse neuronal subtypes.37,38 Represented species include humans, cynomolgus macaque, rhesus macaque, mouse, rat, and guinea pig. (b) UMAP overlay showing the cross-species expression (normalized and log-transformed counts) of CACNA2D1 (encoding α2δ1) across neuronal subtypes.37,38 (c) Percentage of hDRG-N expressing CACNA2D1 across neuron subtypes.37,38,40–42 (d) Immunohistochemical staining of hDRG tissue from donor H22 for α2δ1 (green), peripherin (red, peripheral neuron and nociceptor marker), and DAPI (blue, nuclear stain). Merged images confirm robust expression of α2δ1 in peripherin-positive neurons.
To confirm the expression of α2δ1 in hDRG-N, we conducted immunohistochemistry (IHC) on hDRG tissue obtained from a donor used throughout this study (H22). Peripherin—a well-established marker for peripheral neurons, including nociceptors43–45—was used for co-staining. IHC revealed robust α2δ1 expression in cells positive for peripherin, highlighting α2δ1’s presence in hDRG-N (Figure 1(d)). Together, these results confirm that CACNA2D1/α2δ1 expression spans multiple DRG neuron subtypes and is readily detectable in human nociceptors. These findings reinforce α2δ1’s potential as a key mediator of GBP's effects on neuronal excitability and pain modulation.
Electrophysiological properties of hDRG neurons treated with GBP
Effects on excitability: Firing pattern prevalence, spontaneous activity, and DSFs
To examine the effect of GBP on hDRGs, we first analyzed the actions of in vitro GBP (100 µM, overnight treatment) on hDRG-N using whole-cell patch-clamp electrophysiology. Given the limited availability of hDRG-N for recording per donor, it was only possible to perform studies using a single dose and time course. We characterized the actions of GBP on hDRG-N based on firing pattern—that is, single-, multi-, rebound-, or delayed-firing—as described previously. 19 Though the proportion of single- vs. multi-firing hDRG-N did not change after overnight GBP treatment (Figure 2(a)), several other phenotypic properties associated with neuronal excitability changed (representative trace in Figure 2(b)). Rebound firing was completely abolished in our hDRG neuron dataset after GBP treatment (0%, 0/21) compared to control cells (16%, 5/39), p < 0.0001 (Figure 2(c)). GBP treatment also reduced the prevalence of delayed firing (FSL > 100 ms; 14%, 3/21) compared to control cells (27%, 10/39), p = 0.0228 (Figure 2(d)).

GBP reduces neuronal excitability in hDRG neurons. (a) Percentage of multi- vs. single-firing hDRG-N treated with vehicle (n = 38) or GBP (n = 21). (b) Representative traces of a multi-firing vehicle- or GBP-treated cell. (c) Percentage of cells with rebound firing. (d) Percentage of cells with delayed firing: first-spike latency (FSL) > 100 ms. (e) Frequency-current (f–I) relationship in multi-firing cells. (f) Percentage of cells with ongoing activity (spontaneous activity (SA) when held at −45 mV). (g) Percentage of cells with SA at resting membrane potential (RMP). (h) Representative traces of a vehicle-treated control cell with SA (examples indicated by red arrows) and depolarizing spontaneous fluctuations (DSFs; purple arrows) and a GBP-treated cell with no SA or DSFs. (i) Percentage of cells with DSFs. (j) DSF frequency/30 s in cells with DSFs. (k) DSF amplitudes in cells with DSFs. *p < 0.05, **p < 0.01, ***p < 0.001, ****p < 0.0001 by Fisher’s exact test for (c), (d), (g), and (i) and by Kolmogorov-Smirnov test for (j).
When looking at frequency-current relationships (number of APs vs. current injection) in multi-firing hDRG-N, the slopes of the linear regression for GBP-treated vs. control hDRG-N were not significantly different; however, the offset of the lines was significantly different, p < 0.0001, indicating that multi-firing GBP-treated cells were less excitable than multi-firing control cells (Figure 2(e)). Ongoing activity—that is, spontaneous activity when enough current was applied to the cell to hold the membrane voltage at −45 mV—was reduced in GBP-treated cells (28%, 6/21) compared to control cells (41%, 14/39), but the difference was not quite statistically significant, p = 0.0531 (Figure 2(f)). However, spontaneous activity at rest was completely abolished in GBP-treated hDRG-N (0%, 0/21) when compared to control hDRG-N (14%, 4/39), p = 0.0001 (Figure 2(g); representative traces in Figure 2(h)). DSF prevalence was reduced in GBP-treated hDRG-N (47%, 8/17) compared to control cells (69%, 22/32), p = 0.0016 (representative traces in Figure 2(h); Figure 2(i)). Among cells that had DSFs, DSF frequency was reduced in GBP-treated hDRG-N (5.50
Effects on intrinsic properties in multi- vs. single-firing neurons
With fairly even prevalence of multi-firing and single-firing hDRG-N within and across both GBP-treated and control groups Figure 2(a), we next stratified our analysis to explore how GBP affects properties of these two subtypes, including potential differential effects of GBP between subtypes. We observed that overnight GBP treatment reduced neuronal excitability in multi-firing hDRG-N more so than single-firing hDRG-N. In single-firing hDRG-N (representative traces in Figure 3(a)), the only significantly different electrophysiological property was a reduction in input resistance of GBP-treated hDRG-N (42.34 ± 13.41 MΩ) compared to control hDRG-N (148.3 ± 45.41 MΩ), p = 0.0337 (Figure 3(b)). In single-firing hDRG-N, there was no significant change in other intrinsic properties, including RMP (Figure 3(c)), rheobase (Figure 3(d)), normalized rheobase (Figure 3(e)), AP peak (Figure 3(f)), AP rise time (Figure 3(g)), or AP max rise slope (Figure 3(h)).
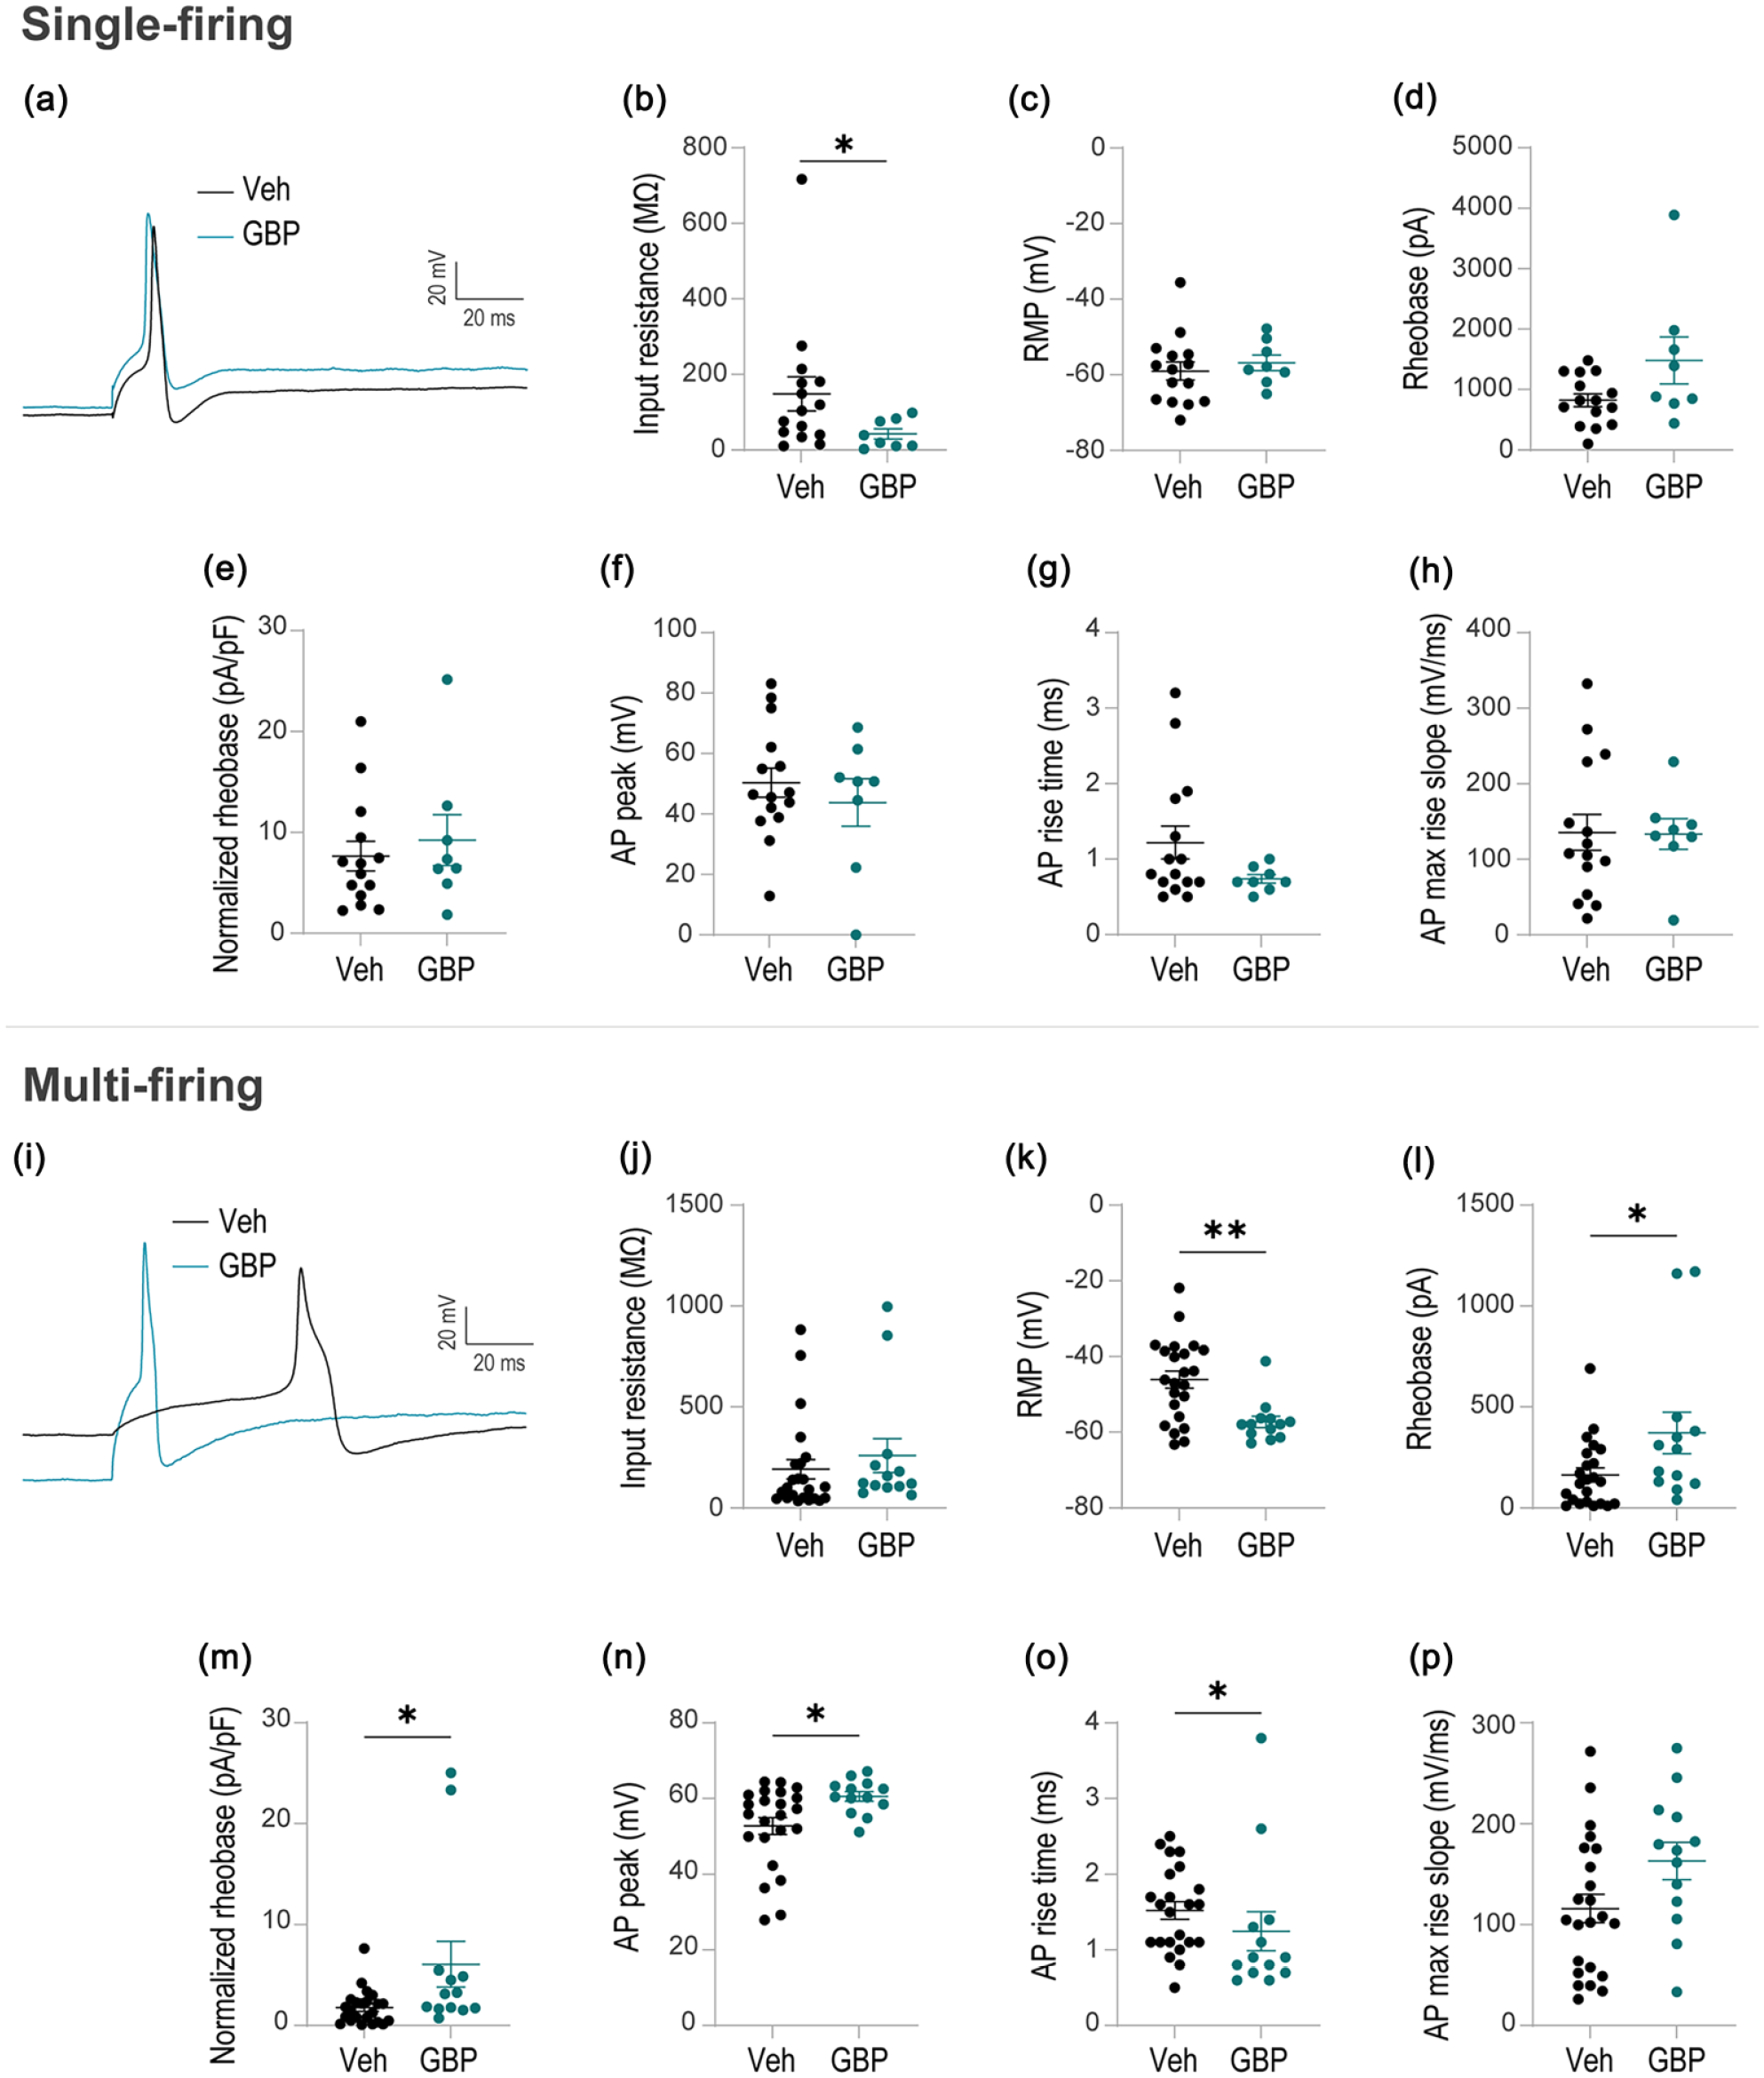
GBP reduces the excitability of multi-firing hDRG neurons but not single-firing hDRG neurons. Top half: single-firing hDRG-N treated with vehicle (n = 15) or GBP (n = 8). (a) Representative rheobase trace; black trace is vehicle-treated control while teal trace is GBP-treated. (b) Input resistance. (c) Resting membrane potential (RMP). (d) Rheobase. (e) Normalized rheobase. (f) Action potential (AP) peak. (g) AP rise time. (h) AP max rise slope. Bottom half: multi-firing hDRG-N treated with vehicle (n = 23) or GBP (n = 13). (i) Representative rheobase trace; black trace is vehicle-treated control while teal trace is GBP-treated. (j) Input resistance. (k) RMP. (l) Rheobase. (m) Normalized rheobase. (n) AP peak. (o) AP rise time. (p) AP max rise slope. *p < 0.05, **p < 0.01 by Mann–Whitney U test.
In contrast, multi-firing hDRG-N (representative traces in Figure 3(i)) did not exhibit a difference in input resistance between GBP-treated and control cells (Figure 3(j)). However, multi-firing hDRG-N had several changes in other electrophysiological properties tied to neuronal excitability. When measuring RMP, GBP-treated multi-firing hDRG-N were hyperpolarized (−57.26
Additionally, in multi-firing hDRG-N, AP peak was increased after GBP treatment (60.54
Donor-specific electrophysiological effects of GBP
Given patient-specific responses to GBP in the clinic,
9
we next examined whether GBP differentially affected hDRG-N from our donors and determined which electrophysiological properties were different at baseline and/or altered among the donors. We found that GBP treatment had a greater effect on the electrophysiological properties related to neuronal excitability in a specific donor, H22, compared to donors H16 and H17. At baseline (with vehicle treatment), H22 was more excitable than H16 and H17 by several measures. Compared to H16/H17 hDRG-N, H22 hDRG-N had a higher prevalence of multi-firing cells (75%, 9/12 hDRG-N for H22; 54%, 14/26 hDRG-N for H16/H17; p = 0.0030) (Figure 4(a)), prevalence of rebound-firing cells (25%, 3/12 for H22; 8%, 3/26 for H16/H17; p = 0.0020) (Figure 4(b)), RMP (−44.95

Donor-specific electrophysiological effects of GBP. (a) Percentage of multi-firing cells in vehicle-treated H16/H17 (n = 26), GBP treated H16/H17 (n = 10), vehicle-treated H22 (n = 12), and GBP-treated H22 (n = 11) hDRG-N. (b) Percentage of cells with rebound firing. (c) Resting membrane potential (RMP). (d) Percentage of cells with spontaneous activity (SA) at rest. (e) Percentage of cells with ongoing activity (SA at −45 mV). (f) Rheobase. (g) Normalized rheobase. (h) Input resistance. *p < 0.05, **p < 0.01, ****p < 0.0001 by Fisher’s exact test for (a), (b), (d), and (e) and by two-way ANOVA test for (c), (f), (g), and (h).
Additionally, our analysis also showed that H22 was more responsive to GBP treatment compared to H16/H17. GBP treatment reduced the prevalence of multi-firing hDRG-N only in H22 (75%, 9/12 for control; 54%, 6/11 for GBP-treated), p = 0.0047 (Figure 4(a)). Additionally, GBP treatment abolished rebound firing (Figure 4(b)) and spontaneous activity at rest (Figure 4(d)) in both H22 and H16/H17, though the effect was greater in H22 given its higher baseline prevalence. While GBP treatment increased ongoing activity relative to control hDRG-N in H16/H17 (44%, 11/25 for control; 60%, 6/10 for GBP-treated, p = 0.0335), GBP completely abolished ongoing activity in H22 (30%, 3/10 for control; 0%, 0/11 for GBP-treated, p < 0.0001) (Figure 4(e)). hDRG-N from H22 had a lower RMP after GBP-treatment (−55.36
Although GBP treatment had a moderate effect on decreasing excitability in H16/H17 when looking at rebound firing and spontaneous activity, GBP’s effect on reducing neuronal excitability was far greater in H22 hDRG-N. GBP affected more electrophysiological measurements, including increasing rheobase and normalized rheobase and decreasing the prevalence of rebound firing, spontaneous activity, ongoing activity, and multi-firing. We therefore termed H22 as the “more-responsive donor” and H16/H17 as the “less-responsive donors” throughout the rest of the analysis and discussion for simplicity and clarity. However, it is important to emphasize that these effects and, therefore, classifications were derived from in vitro GBP treatment. Ultimately, these data show a donor-specific effect of GBP treatment on hDRG-N, which corresponds with and may at least partly explain the patient-specific effectiveness of GBP. 9
Donor-specific transcriptomic profile of hDRG tissue associated with in vitro GBP responsiveness
Given electrophysiological differences in the baseline properties and response to GBP in H22 vs. H16/H17 hDRG-N, we performed RNA-seq on hDRG tissue from these three donors to elucidate unique transcriptomic signatures in H22 (the “more-responsive donor”) relative to H16 and H17 (the “less-responsive donors”). As expected, PCA of the three transcriptomes revealed that H22 had a unique profile compared to H16 and H17, the latter of which clustered together, especially along PC1 (Figure 5(a)). This finding supported the relevance of further inquiry into the transcriptomic differences in hDRG tissue of the more-responsive donor relative to the less-responsive donors.

Donor-specific transcriptomic profile of hDRG tissue associated with in vitro GBP responsiveness. (a) Principal component analysis (PCA) of gene expression in hDRG tissue from the donor that had a strong electrophysiological response to in vitro GBP treatment (H22, the “more-responsive donor”) and the donors that did not respond very strongly (H16/H17, the “less-responsive donors”). (b) Volcano plot representing the differential gene expression analysis of hDRG tissue from H22 vs. H16/H17. Significant differentially expressed genes (DEGs) (|log2FC| ≥ 0.4, p ≤ 0.05) in H22 vs. H16/H17 are colored red (upregulated) or blue (downregulated). DEGs that are core genes contributing to the enrichment of the gene set enrichment analysis (GSEA) terms shown in (c) are labeled. Labeled upregulated genes contribute to at least three of the positively enriched GSEA terms in (c) while downregulated genes contribute to at least one negatively enriched term in (c). The thicker central portions of the axes are expanded relative to the peripheral thinner portions. (c) GSEA of Gene Ontology (GO) terms comparing gene expression in hDRG tissue from H22 vs. H16/H17. Significant GO terms (p ≤ 0.05) related to ion transport, synaptic transmission, inflammation, and immune response are shown. The x-axis represents the set size (number of expressed genes in the term). The dot color represents the normalized enrichment score while the dot size represents -log10(p-value). (d) GSEA of GO terms related to ions (their transport, voltage-gated channels, and regulation), specifically focusing on calcium, sodium, and potassium. The dot plot on the left represents the statistics associated with the terms; the dot color represents the normalized enrichment score while the dot size represents -log10(p-value). The heatmap on the right represents the DEGs that constitute part of the core enrichment of the terms, with tile color indicative of log2FC of the DEGs.
Differential gene expression analysis of hDRG tissue from the more-responsive donor vs. less-responsive donors identified 548 upregulated DEGs (log2FC ≥ 0.4, p ≤ 0.05) and 495 downregulated DEGs (log2FC ≤ −0.4, p ≤ 0.05) (Figure 5(b)). Additionally, GSEA using GO terms revealed that genes associated with key neuronal processes—ion transport, membrane polarization, and synaptic signaling—were upregulated in H22 vs. H16/H17 hDRG tissue whereas genes associated with inflammation and immune response were downregulated (Figure 5(c)). For example, H22 exhibited positive enrichment of genes involved in ion flux, including ion transmembrane transporter activity (e.g., DEGs including KCNV1, ATP2A2, NIPAL3), regulation of membrane potential (e.g., ABAT, ATP2A2, SLC24A4), voltage-gated cation channel activity (e.g., KCNV1, KCNB2, KCNAB1), membrane depolarization (e.g., SLMAP, SCN4B, KCNH2), and membrane repolarization (e.g., SLC24A4, NOS1AP, KCNA1) (Figure 5(b) and (c)). The more-responsive donor also demonstrated positive enrichment of genes involved in synaptic activity, including regulation of neurotransmitter levels (e.g., PTPRN2, SYT12, ATP2A2), vesicle-mediated synaptic transport (e.g., SYT12, ATP2A2, RPH3A), neurotransmitter receptor activity (e.g., GRIN1, GPR158, CHRNB3), regulation of synaptic plasticity (e.g., SYT12, STXBP1, ADCY8), and amino acid transport (e.g., ABAT, PRKG1, STXBP1) (Figure 5(b) and (c)). Genes specifically associated with cholinergic (e.g., CHRNB3), GABAergic (e.g., SLC6A17, IQSEC3, SST), and glutamatergic (e.g., PLXNA4, NPTX2, CDH8) synapses were positively enriched (Figure 5(b) and (c)). Together, these gene set differences suggest a unique molecular landscape associated with ion transport, membrane polarization changes, and synaptic transmission, which may directly relate to the observed donor-specific electrophysiological baseline properties and GBP response (Figure 4).
Given the central importance of ion transport and voltage-gated ion channels in electrophysiological activity, we further examined transcriptomic changes related to these features. In hDRG tissue from the more-responsive donor (H22), there was positive enrichment of genes related to ligand-gated ion channel activity (e.g., DEGs including HCN1, GRIN1, KCNJ4) and voltage-gated ion channels involved in regulating presynaptic membrane potential (e.g., KCNC1, KCNA1, KCNC2) (Figure 5(d)). Gene expression specifically related to the transmembrane transport and voltage-gated channels of calcium (e.g., ATP2A2, SLC24A4, SLC24A2, CACNB3, CACNB1, CACNG2, TRPV1), sodium (e.g., SLC24A4, SLC24A2, HCN1, CHP1, SCN4B, SCN8A), and potassium (e.g., KCNV1, SLC24A4, KCNB2, KCNIP3, KCNAB1, HCN1) was strongly upregulated (Figure 5(d)). Notably, there was also positive enrichment of genes involved in regulating cytosolic calcium concentration (e.g., ADCY8, TRPC5, GRID2IP) and calcium-regulated neurotransmitter exocytosis (e.g., ATP2A2, STXBP1, SYT7) (Figure 5(d)). Ultimately, over 40 upregulated DEGs contributed to these ion-related terms (Figure 5(d)). These results indicate widespread upregulation of genes related to ion channels—especially of calcium, sodium, and potassium—and their related functions in hDRG tissue from the more-responsive donor.
On the other hand, the hDRG tissue gene set from the more-responsive donor was relatively deficient in the expression of genes associated with inflammatory and immune responses (Figure 5(c)). For example, H22 exhibited negative enrichment of genes associated with inflammatory mediator production, including tumor necrosis factor (TNF) (e.g., AKAP8), interleukin-6 (IL-6), and interleukin-1 beta (IL-1β) (Figure 5(b) and (c)). Additionally, genes involved in cytokine (e.g., TRIP6, TNFSF10, TYK2) and chemokine receptor binding, immune response activation (e.g., PLD2, TRAC, RAB29), leukocyte cell-cell adhesion (e.g., TYK2, CD83, ETS1), and lymphocyte migration were collectively downregulated (Figure 5(b) and (c)). Altogether, hDRG tissue from the more-responsive donor exhibited dampened gene expression related to inflammation and immune system activity, which may translate to functional differences in these responses.
Transcriptomic response of cultured hDRG to GBP treatment
Considering the baseline transcriptomic differences in hDRG tissue between the more-responsive donor and less-responsive donors, we hypothesized that GBP-induced electrophysiological changes in hDRG-N from the more-responsive donor may be coupled with and potentially driven by transcriptomic alterations. Therefore, we performed RNA-seq on cultured hDRG from the more-responsive donor (H22) to characterize the transcriptomic changes induced by GBP concomitant with the electrophysiological response. Overnight GBP treatment induced the upregulation (log2FC ≥ 0.4, p ≤ 0.05) of 144 genes and downregulation (log2FC ≤ −0.4, p ≤ 0.05) of 47 genes (Figure 6(a)). GSEA revealed perturbations in gene expression associated with the same overarching processes that were altered in hDRG tissue from the more-responsive donor vs. less-responsive donors: ion transport, synaptic transmission, inflammation, and immune response (Figure 6(b)).

Transcriptomic response of cultured hDRG to GBP treatment. (a) Volcano plot representing the differential gene expression analysis of hDRG from the more-responsive donor cultured and treated with GBP vs. vehicle. Significant differentially expressed genes (DEGs) (|log2FC| ≥ 0.4, p ≤ 0.05) in GBP-treated vs. vehicle-treated control hDRG are colored red (upregulated) or blue (downregulated). DEGs that are core genes contributing to the enrichment of at least one gene set enrichment analysis (GSEA) term shown in (b) are labeled. The thicker central portions of the axes are expanded relative to the peripheral thinner portions. (b) GSEA of Gene Ontology (GO) terms comparing GBP-treated vs. control hDRG culture. Significant GO terms (p ≤ 0.05) related to ion transport, synaptic transmission, inflammation, and immune response are shown. The x-axis represents the set size (number of expressed genes in the term). The dot color represents the normalized enrichment score while the dot size represents -log10(p-value). (c) Heatmap depicting the relative expression of strong DEGs (|log2FC| ≥ 0.4, FDR ≤ 0.1) among the three control and three GBP-treated hDRG samples. The color represents relative expression within each gene (Z-score). Gene biotype and treatment are annotated by color, and hierarchical clustering of samples and genes is shown in their respective dendrograms. (d) Expression of strong DEGs (|log2FC| ≥ 0.4, FDR ≤ 0.1) in hDRG neuron subtypes as quantified and characterized by previous studies.37,39–42 The dot color represents average gene expression (normalized and log-transformed counts) while the dot size represents the percentage of cells expressing the gene. The text color of hDRG neuron subtype labels indicates their fiber type.
Compared to control hDRG cultures, GBP-treated cultures were deficient in the expression of genes involved in anion transmembrane transport, including the activity of chloride channels and specifically intracellular calcium-activated chloride channels (Figure 6(b)). Meanwhile, GBP treatment resulted in the positive enrichment of genes involved in inhibiting cation flux, including sodium channel inhibitor activity, G-protein beta subunit binding, and catecholamine transport (Figure 6(b)). GBP also tended to enhance the expression of genes involved in aspects of synaptic signaling, such as dense core granules (e.g., SST), spontaneous synaptic transmission, and neurotransmitter reuptake (e.g., PER2) (Figure 6(a) and (b)). This particularly included genes found in cholinergic and dopaminergic synapses (Figure 6(b)). Together, these gene set differences suggest that GBP may have suppressive actions on ion transport but enhance certain synaptic activities.
Meanwhile, GBP treatment upregulated genes involved in inflammatory and immune processes (Figure 6(b)). The hDRG culture treated with GBP exhibited positive enrichment of genes involved in an acute inflammatory response to antigenic stimulus (e.g., DEGs including BTK, FCGR3A), inflammation-related signaling pathways—canonical Wnt (e.g., LGR5, SFRP4) and STAT (e.g., JAK3, IL15RA)—and interleukin production (e.g., JAK3, BTK) and response (Figure 6(a) and (b)). GBP also induced the upregulation of genes associated with the activation and function of several immune cell types, such as leukocytes (e.g., HLA-A, TREM1, FCGR3A), T cells, natural killer cells, natural killer T cells, and T helper 17 cells (Figure 6(a) and (b)).
Strong GBP-induced DEGs (|log2FC| ≥ 0.4, FDR ≤ 0.1) contributing to these enriched terms included HLA-A (log2FC = 0.54, FDR = 1.50e-27; leukocyte mediated cytotoxicity), LGR5 (log2FC = 8.49, FDR = 1.74e-5; positive regulation of canonical Wnt signaling pathway), and ECE2 (log2FC = −7.59, FDR = 2.85e-5; signaling receptor ligand precursor processing) (Figure 6(b) and (c)). Other genes that were strongly upregulated by GBP treatment (log2FC ≥ 0.4, FDR ≤ 0.1)—all protein-coding unless otherwise indicated—included FOLH1B (transcribed unprocessed pseudogene), TLN2, PPWD1, KIAA1549, CTBP1-DT (lncRNA), UBE3A, KAT7, and PPIEL (Figure 6(c)). Meanwhile, strongly downregulated genes (log2FC ≤ −0.4, FDR ≤ 0.1) included MS4A14, RAB4B-EGLN2, and CDC42EP2 (Figure 6(c)). Based on the expression of these strong DEGs, the GBP-treated and control hDRG samples each hierarchically clustered together, highlighting the defining nature of these DEGs in the response to GBP (Figure 6(c)).
To better grasp the physiological relevance of these strong DEGs in hDRG, we examined their expression in different hDRG neuron cell types using a publicly available reference combining data from three single-cell hDRG studies (Figure 6(d)).37,39–42 By both average gene expression across single cells and percentage of cells expressing the gene, TLN2 and UBE3A exhibit the most robust expression across neuron subtypes in hDRG and hierarchically cluster closely together (Figure 6(d)). LGR5 is also widely expressed throughout hDRG neuron subtypes, though to a lesser degree (Figure 6(d)). Meanwhile, ECE2 is highly expressed in MRGPRA3-defined subtypes (Mrgpra3+Mrgprb4 and Mrgpra3+Trpv1) while KAT7 is highly expressed in Calca+Dcn neurons (Figure 6(d)). Ultimately, given the overall wide expression of these strong DEGs across hDRG neuron subtypes, GBP has the potential to affect a variety of sensory neurons perturbed in neuropathic pain conditions.
Cross-transcriptomic analysis comparing GBP-responsive and GBP-treatment signatures in hDRG
At baseline, hDRG-N from the more-responsive donor had a more excitable phenotype than hDRG-N from the less-responsive donors by several measures, which was subsequently rescued by GBP treatment (Figure 4(a)–(d)). Also notable, the transcriptome-wide alterations in gene expression related to ion flux, synaptic transmission, and immunoinflammatory processes similarly appeared in both RNA-seq datasets. Thus, we next cross-analyzed the baseline transcriptomic profile specific to the more-responsive donor and the GBP-treatment profile of cultured hDRG derived from this same donor. This enabled us to understand which cellular processes and genes were perturbed in hDRG tissue from the more-responsive donor relative to the less-responsive donors but rescued by in vitro GBP treatment. This pattern of gene expression correlates with the enhanced baseline excitability of the hDRG-N from the more-responsive donor that was rescued by GBP treatment.
We observed that a positive enrichment of genes associated with ion transport and synaptic signaling in hDRG tissue from the more-responsive donor was subsequently downregulated by GBP treatment of the hDRG culture from this donor (Figure 7(a)). Ion transport-related rescue of gene expression included genes involved in the behavioral response to chemical pain, anion channel activity, and chloride transmembrane transport (Figure 7(a)). Select synapse-related genes also exhibited the same “up-down” rescue pattern, including genes involved in protein localization to the presynapse or in D-amino acid, L-glutamate, or L-aspartate transport (Figure 7(a)).

Cross-transcriptomic analysis comparing GBP-responsive and GBP-treatment signatures in hDRG. (a) Gene Ontology (GO) terms enriched by gene set enrichment analysis (GSEA) in opposite directions in the dataset of hDRG tissue from the more-responsive donor vs. less-responsive donors and the dataset of cultured hDRG from the more-responsive donor treated with GBP vs. vehicle. Significant GO terms (p ≤ 0.05) related to ion transport, synaptic transmission, inflammation, and immune response are shown. The x-axis represents −log10(p-value) bidirectionally, and the bar color represents the normalized enrichment score. (b) Common DEGs (|log2FC| ≥ 0.4, p ≤ 0.05) among the two datasets (hDRG tissue and hDRG treated in vitro). The dot color represents log2FC while the dot size represents -log10(p-value). (c) Expression of these common DEGs (|log2FC| ≥ 0.4, p ≤ 0.05) in hDRG neuron subtypes as quantified and characterized by previous studies.37,39–42 The dot color represents average gene expression (normalized and log-transformed counts) while the dot size represents the percentage of cells expressing the gene. The text color of hDRG neuron subtype labels indicates their fiber type.
Meanwhile, genes set-wide expression related to inflammation and immune response demonstrated a rescue in the opposite direction: deficient in hDRG from the more-responsive donor but upregulated by in vitro GBP treatment (Figure 7(a)). This included the overall expression of genes involved in positively regulating inflammatory response and cytokine production as well as genes involved in type II interferon response and leukocyte-mediated immunity (Figure 7(a)). Additionally, transcriptome-wide deficiency of genes involved in adaptive and innate immune responses—for example, T helper cells and phosphatidylinositol-5-phosphate binding, respectively—was rescued by GBP treatment (Figure 7(a)). Together, these results suggest a GBP-induced rescue of select neuronal processes and inflammatory and immune responses.
Several genes exhibited a rescue pattern as significant DEGs (|log2FC| ≥ 0.4, p ≤ 0.05) in both datasets. MATR3, RUBCNL, ZNF407-AS1, and RSPH9 were deficient in hDRG tissue from the more-responsive donor and then upregulated by in vitro GBP treatment of hDRG from this donor (Figure 7(b)), following the rescue trend of the immunoinflammatory terms (Figure 7(a)). Notably, MATR3 was a core gene contributing to the opposing enrichment of the innate immune response term while RUBCNL contributed to the enrichment of phosphatidylinositol-5-phosphate binding (Figure 7(a) and (b)). Conversely, AFF2 was more highly expressed in hDRG tissue from the more-responsive donor but then downregulated by in vitro GBP treatment (Figure 7(b)). Additionally, SAMD14, SST, PEG3, and TRPV1 were more abundantly expressed in hDRG tissue from the more-responsive donor and then further upregulated by in vitro GBP treatment (Figure 7(b)).
Eight of the nine DEGs that appeared in both the more-responsive-donor and GBP-treatment profiles were detected in the single-cell hDRG neuron public dataset previously described.37,39–42 All eight genes tend to be expressed to a greater degree—by average expression and percentage of cells expressing the gene—in C-fiber hDRG neuron subtypes than A-fiber subtypes (Figure 7(c)). For example, Mrgpra3+Trpv1, Mrgprd, and Sst are key hDRG neuron subtypes expressing these genes and are C-fiber subtypes (Figure 7(c)). TRPV1 and SST hierarchically cluster closely together based on the similarity of their expression pattern across hDRG neuron subtypes (Figure 7(c)). Notably, they are also key genes used to define subtypes: SST is very strongly expressed in Sst hDRG-N while TRPV1 is highly expressed in Mrgpra3+Trpv1 hDRG-N as well as several others, such as Calca+Oprk1, Calca+Adra2a, and Mrgprd (Figure 7(c)). SAMD14 and AFF2 also clustered together and were generally expressed across most cell types (Figure 7(c)). Meanwhile, MATR3 and PEG3 were predominantly expressed by MRGPRA3-defined cell types (Mrgpra3+Mrgprb4 and Mrgpra3+Trpv1) (Figure 7(c)). By upregulating these genes (except AFF2), GBP might target the expression of already perturbed genes in several C-fiber subtypes of hDRG-N in responsive patients.
Discussion
To the best of our knowledge, this study is the first to produce transcriptomic and electrophysiological datasets in GBP-treated human sensory neurons. While several of our findings align with previous observations in rodent models, we contribute additional data and nuance in a translational model: primary hDRG. Based on rodent studies, the prevailing accepted mechanism of action of GBP in sensory neurons is binding to α2δ1, which reduces trafficking and membrane expression of the α1 subunit of VGCCs, causing a reduction in neurotransmitter release.46–47 Cultured DRG neurons from α2δ1-knockout mice previously showed a decrease in FSL when recorded from −70 mV, 48 which correlates with our observation that GBP reduces the proportion of hDRG-N with delayed firing (FSL > 100 ms) (Figure 2(d)). Notably, our results indicated that the effects of GBP are more pronounced in multi-firing DRG neurons (Figure 3), suggesting that the influence of GBP on α2δ1 and neuronal excitability may depend on neuronal subtype. Indeed, single-cell RNA-seq data from mouse DRG neurons have shown that Cacna2d1 expression (encoding α2δ1) is higher in DRG neuron subtypes that are more likely to exhibit multi-firing and have longer FSLs, such as nociceptors and C-fiber low-threshold mechanoreceptors (C-LTMRs). 49 These cells may therefore be more susceptible to GBP treatment.
Increased DSF frequency in DRG neurons is associated with increased levels of spontaneous activity and neuropathic pain.34,50,51 Our data show that GBP treatment reduced spontaneous activity, DSF prevalence, and DSF frequency in hDRG-N (Figure 2). This is similar to findings in a rodent spinal cord injury model where another gabapentinoid, pregabalin, reduced spontaneous activity and DSF prevalence. 52 Previous studies have shown that DSFs are dependent on calcium and sodium influx 50 and that patients with a history of pain have a higher prevalence of DSFs. 34 Given these previous findings and our data showing GBP-induced reduction in DSF prevalence and frequency (Figure 2(i) and (j)), it is likely that repressing DSFs is an electrophysiological mechanism in GBP’s treatment of neuropathic pain.
Despite GBP’s widespread use in treating neuropathic pain, clinical observations show suboptimal effectiveness, with a number needed to treat (NNT) of 6–8, meaning 6–8 patients must be treated for one to experience significant pain relief.8,17,53 Similarly, our data revealed donor-specific variability in the electrophysiological response to GBP, with 1 of the 3 donors showing a more substantial effect (Figure 4). hDRG-N collected from donor H22 were more responsive, by multiple measures, to GBP compared to neurons derived from H16 and H17 (Figure 4). At baseline, hDRG-N from the more-responsive donor (H22) were more excitable than hDRG-N from the less-responsive donors (H16/H17) or even several other donors (data previously published19,54) when examining measures of neuronal excitability, such as a RMP, prevalence of rebound firing, and prevalence of spontaneous activity (Figure 4). Several factors—including genetic background, clinical history, exposures, and cause of death—may have contributed to the increased baseline neuronal excitability of hDRG-N from H22.
One probable explanation for varying baseline properties and GBP responsiveness between donors is differences in basal ion channel function, which might be because the more-responsive donor (H22) uniquely experienced a traumatic head injury (Table 1). For instance, it has previously been shown that Cacna2d1/α2δ1 is upregulated in DRGs and spinal cord following nerve injury in rat models.55,56 While we did not observe a significant upregulation of overall CACNA2D1 in hDRG tissue from H22 compared to H16/H17, the transcript variant CACN2D1-203 (ENST00000443883) exhibited an upward trend of expression in H22 (log2FC = 5.93, p-value = 0.10). For future studies, it would be interesting to examine α2δ1 protein levels and neuron subtype-specific levels of CACNA2D1/α2δ1 as well as explore the potential significance of the comparatively abundant CACNA2D1-203.
The more pronounced responsiveness of H22 to GBP may also be influenced by donor-specific drug exposure (Table 1). H22’s history of amphetamine exposure may have primed their hDRG-N through mechanisms such as neuroinflammation57,58 and altered ion channel activity, including that of transient receptor potential (TRP) channels.59,60 Conversely, the diminished GBP responsiveness in H16/H17 might be partially attributed to their opioid exposure, which is known to affect DRG neuronal excitability, though these effects depend on history of injury, dose, and duration of exposure.61,62 These findings highlight potential drug-drug interactions that may influence the activity and responsiveness of hDRG-N.
Providing key insights into potential molecular mechanisms of GBP responsiveness, RNA-seq analysis of hDRG tissue from H22 vs. H16/H17 identified several DEGs and enriched pathways. GSEA revealed perturbations in gene expression associated with ion transport, synaptic signaling, inflammation, and immune response in H22 (Figure 5), all of which have been implicated in the pathophysiology of neuropathic pain. Although neuropathic pain was not a diagnosis in H22’s medical records, the baseline hyperexcitability of H22 hDRG-N aligns with features generally associated with neuropathic pain and may reflect underlying sensitization of nociceptive pathways. 3 The positive enrichment of genes involved in calcium, sodium, and potassium transport—including their voltage-gated channels—in H22 hDRG tissue (Figure 5) likely influenced baseline ion transport and excitability as well as electrophysiological responsiveness to GBP. For example, the relatively elevated expression of VGCC subunits (CACNB1, CACNB3, and CACNG2) in H22 hDRG (Figure 5(b) and (d)) may have influenced calcium flux and primed H22 hDRG-N for a more potent response to GBP. Thus, GBP’s effects on neuronal excitability may depend on its ability to modulate underlying alterations in these processes. Accordingly, GBP treatment of cultured hDRG from H22 rescued certain aberrant gene expression patterns associated with ion transport and synaptic signaling (Figure 7) in parallel with the unique electrophysiological response of H22 hDRG-N (Figure 4).
A notable DEG that was both associated with GBP responsiveness and responsive to GBP treatment was TRPV1 (Figure 7(b) and (c)). Transient receptor potential cation channel subfamily V member 1 (TRPV1) is critical in nociceptive signaling and pain perception.37,63 Interestingly, TRPV1 was upregulated in both datasets (Figure 7(b) and (c)), raising the possibility that TRPV1 facilitates GBP’s effects in a positive feedback loop. Supporting this hypothesis, a previous study demonstrated that TRPV1 can serve as a conduit for GBP entry into nociceptors, enhancing its antinociceptive efficacy. 64 Future studies should validate whether TRPV1 directly mediates GBP uptake and its subsequent effects on human nociceptors as well as whether GBP, in turn, modulates TRPV1 expression and activity.
Another DEG of interest upregulated in both hDRG datasets was SST (Figure 7(b) and (c)), which encodes the neuropeptide somatostatin. Somatostatin signaling has been shown to attenuate cation influx in DRG neurons in vitro65,66 as well as reduce nociceptive responses to a variety of stimuli in vivo.65,67 Additionally, a mouse study in which somatostatin deficiency in DRG neurons increased sensitivity to thermal and mechanical stimuli suggested that somatostatin release from DRG neurons also reduces pain signaling. 68 The positive association of SST expression with GBP responsiveness and the observed increase in SST expression after GBP treatment (Figure 7(b) and (c)) suggest that GBP may synergize with endogenous inhibitory pathways to attenuate nociceptive signaling. This hypothesis presents an exciting avenue for future research to explore the potential synergy between GBP and somatostatin, including possible regulatory mechanisms by which GBP enhances SST expression and the potential of intracellular calcium as a mediator of their crosstalk.
Adding further complexity, interactions between somatostatin and TRPV1 may play a role in GBP’s effect. Previous evidence has demonstrated that somatostatin receptor activation reduces capsaicin-induced (TRPV1-mediated) calcium and sodium influx in DRG neurons, dampens nociceptor activity, and alleviates pain behavior.66,69 Synthesizing our findings and previous work, we propose that GBP’s pain-relieving effect may involve modulation of and complex interactions with and between TRPV1 and somatostatin.64,66,69
Limitations and future directions
This study provides a detailed characterization of the electrophysiological and transcriptomic impacts of GBP on hDRG sensory neurons and highlights individual variability in response that parallels its clinical performance. While our findings provide valuable insights, they also raise several questions that warrant further investigation. Expanding the currently small sample size to include a larger, more diverse cohort of donors—for example, sufficient male and female donors to examine sex-based differences—will be critical for identifying patterns of GBP responsiveness and responses across different populations and for strengthening the applicability of our findings to a broader patient population. Studies exploring different clinically relevant doses, different treatment time courses, and the sustained impacts of GBP treatment on hDRG gene expression and neuronal excitability could provide insights into potential dose-dependent responses, long-term efficacy, and mechanisms of tolerance. Additionally, employing single-cell RNA-seq or Patch-seq would allow for a more granular understanding of how GBP affects specific neuronal subtypes. Moreover, integrating proteomic and metabolomic analyses with transcriptomic data could uncover additional molecular targets and pathways that modulate and mediate GBP’s effects.
Conclusion
In conclusion, this study provides a comprehensive electrophysiological and transcriptomic profile of GBP’s effects on hDRG-N. These findings enhance our understanding of GBP’s mechanistic actions on primary sensory neurons and offer valuable insights toward optimizing its use in managing neuropathic pain. Future research focusing on single-cell analyses, patient-specific factors, and combinatory therapies holds promise for improving the effectiveness and precision of GBP-based treatments for neuropathic pain.
Supplemental Material
sj-pdf-1-mpx-10.1177_17448069251361712 – Supplemental material for Gabapentin’s effect on human dorsal root ganglia: Donor-specific electrophysiological and transcriptomic profiles
Supplemental material, sj-pdf-1-mpx-10.1177_17448069251361712 for Gabapentin’s effect on human dorsal root ganglia: Donor-specific electrophysiological and transcriptomic profiles by Jenna B Demeter, Nesia A Zurek, Maddy R Koch, Aleyah E Goins, Cristian O Holguin, Mark W Shilling, Michael S Davis, Reza Ehsanian, Sascha RA Alles and June Bryan I de la Peña in Molecular Pain
Footnotes
Acknowledgements
We would like to thank New Mexico Donor Services and further extend our deepest gratitude to the organ donors and their families, whose generous contributions made this study possible. We would also like to thank the UNM Center for Advanced Research Computing, supported in part by the National Science Foundation, for providing the high-performance computing resources used in this work. This research was partially supported by UNM Comprehensive Cancer Center Support Grant NCI P30CA118100 and made use of the Fluorescence Microscopy and Cell Imaging shared resource.
Author contributions
Jenna B. Demeter: Conceptualization, Methodology, Software, Formal Analysis, Investigation, Resources, Data Curation, Writing - Original Draft, Writing - Review & Editing, Visualization. Nesia A. Zurek: Conceptualization, Methodology, Software, Formal Analysis, Investigation, Resources, Data Curation, Writing - Original Draft, Writing - Review & Editing, Visualization. Maddy R. Koch: Methodology, Investigation, Writing - Original Draft, Writing - Review & Editing. Aleyah E. Goins: Methodology, Investigation, Writing - Original Draft, Writing - Review & Editing. Cristian O. Holguin: Methodology, Investigation, Writing - Original Draft. Mark W. Shilling: Investigation, Resources, Data Curation, Writing – Review & Editing. Michael S. Davis: Resources, Supervision, Methodology, Writing – Review & Editing. Reza Ehsanian: Investigation, Resources, Data Curation, Supervision, Writing – Review & Editing. Sascha R.A. Alles: Conceptualization, Methodology, Software, Formal Analysis, Investigation, Resources, Data Curation, Writing – Original Draft, Writing – Review & Editing, Visualization, Supervision, Project Administration, Funding Acquisition. June Bryan I. de la Peña: Conceptualization, Methodology, Software, Formal Analysis, Investigation, Resources, Data Curation, Writing – Original Draft, Writing – Review & Editing, Visualization, Supervision, Project Administration, Funding Acquisition.
Declaration of conflicting interests
The author(s) declared no potential conflicts of interest with respect to the research, authorship, and/or publication of this article.
Funding
The author(s) disclosed receipt of the following financial support for the research, authorship, and/or publication of this article: This work was supported by the UNM Rainforest Innovations 2024 GAP funding (SRAA) and the Research Endowment Fund of the Department of Anesthesiology & Critical Care Medicine, University of New Mexico Health Sciences Center. These funding sources were not involved in the design or execution of the study nor the manuscript submission.
Ethical considerations
This study was conducted in compliance with institutional ethical guidelines and approved by the University of New Mexico Health Sciences Center Human Research Review Committee (Institutional Review Board; approval number 23-205). Research was conducted in accordance with the Declaration of the World Medical Association.
Consent to participate
Donors are either known to have expressed wishes to donate organs/tissues during life, or the authorization to collect and use these tissues is provided by next-of-kin as permitted under New Mexico state law.
Consent for publication
Not applicable.
Data availability
Electrophysiological and transcriptomic data and code generated during this study will be made available to qualified researchers upon request. Data access will require a data transfer agreement to ensure proper usage and attribution.
ORCID iDs
References
Supplementary Material
Please find the following supplemental material available below.
For Open Access articles published under a Creative Commons License, all supplemental material carries the same license as the article it is associated with.
For non-Open Access articles published, all supplemental material carries a non-exclusive license, and permission requests for re-use of supplemental material or any part of supplemental material shall be sent directly to the copyright owner as specified in the copyright notice associated with the article.