
Abstract
The primary and secondary somatosensory cortices (S1 and S2) play crucial roles in processing sensory inputs from various body regions, encompassing tactile, pressure, thermal, and nociceptive stimuli. These cortices are anatomically distinct, with S1 primarily involved in mechanical and cold stimulus discrimination and S2 in the interpretation of mechanical and thermal inputs, particularly in pain perception. However, the upstream innervation patterns of the somatosensory system remain less explored. In this study, we employed a modified rabies virus (RV)-mediated transsynaptic retrograde tracing system to map and compare the whole-brain input patterns of S1 and S2 in mice. Our results revealed that both S1 and S2 receive inputs from diverse brain regions, including the cortical plate, thalamus, cortical subplate, striatum, and pallidum. Notably, the cortical plate emerged as the primary source of input neurons for both S1 and S2, while the thalamus demonstrated preferential projections to S1. Through quantitative analysis, we identified distinct input distribution patterns across 64 brain subregions, revealing that S1 and S2 exhibit complex internal circuitry, including abundant local projections. Furthermore, we observed notable variations in the proportional contributions of inputs from diverse subregions to S1 and S2. This comprehensive anatomical framework provides new insights into the neural circuits underlying somatosensory perception and modulation, with potential implications for the development of targeted therapeutic strategies for pain and other somatosensory disorders.
Introduction
The somatosensory cortex (SS), located in the parietal lobe of the brain, is essential for processing sensory input from various body regions. Beyond its primary role, the SS plays a crucial part in tactile attention, 1 sensorimotor integration, 2 and the modulation of nociceptive stimuli. 3 Recent studies have also emphasized its pivotal role in pain processing,4,5 highlighting its diverse contributions to sensory and integrative functions. The SS is anatomically divided into two principal regions, primary and secondary somatosensory cortices (S1 and S2). Both regions play crucial roles in processing a broad spectrum of sensory modalities, including tactile, 6 pressure, 7 thermal, 8 and nociceptive stimuli. 3 Notably, these regions exhibit distinct encoding mechanisms. S1 predominantly modulates mechanical and cooling stimuli, while S2 is an essential region that governs mechanical and thermal sensitivity. 8
The distinct roles of S1 and S2 in acute versus chronic pain processing are increasingly delineated. In acute pain, S1 encodes sensory-discriminative features through intensity-dependent neuronal responses that mirror perceptual pain ratings, as demonstrated by its exponential activation profile correlating with stimulus intensity. In contrast, S2 displays an S-shaped activation threshold, selectively engaging at suprathreshold noxious stimuli, implicating its role in salience detection and attentional allocation. 3 S1 and other cortical regions exhibit divergent temporal processing characteristics in pain modulation: S1 initiates mechanical pain processing earlier than the anterior cingulate area (ACA), whereas thermal pain concurrently activates S1 and ACA. 9 Mechanistically, S2 glutamatergic neurons bidirectionally modulate bilateral nociception via thalamic projections, with unilateral activation or inhibition enhancing or suppressing nociceptive sensitivity, respectively, independent of affective states. 10 S1 develops hyper-synchronized microcircuits with increased neuronal connectivity that sustain pathological pain. 11 This plasticity manifests as layer-specific dysregulation: while L5 activation alleviates inflammatory allodynia, 5 chronic pain attenuates S1 calcium signaling to sensory inputs. 12 Notably, S1 oxytocinergic signaling selectively modulates mechanical allodynia without altering affective components, 13 while spinal injury-induced S1 hyperactivity correlates with mechanical and thermal hypersensitivity. 14 Strikingly, chronic pain hyperactivates S2 glutamatergic neurons, whose optogenetic inhibition alleviates both sensory hypersensitivity and negative affect. Critically, silencing S2-derived glutamatergic terminals in the ventral posterolateral nucleus (VPL) and posterior complex (PO) of the thalamus reverses neuropathic pain, underscoring S2 corticothalamic circuits as key components of endogenous pain modulation. 10 Additionally, chronic pain amplifies S1-ACA connectivity, wherein S1 axon terminal activation potentiates ACA nociceptive responses, and modulation of this pathway bidirectionally regulates pain aversion. 15 These findings collectively highlight the divergent yet complementary roles of S1 and S2 across pain states, advocating therapeutic strategies that selectively target S1 microcircuit synchronization 16 or S2 corticothalamic projections 10 to address sensory and affective dimensions of chronic pain.
The neural networks of S1 and S2 are integral to understanding the mechanisms governing sensory perception and processing. Recent studies have significantly advanced our understanding of the downstream projections of the SS, highlighting its extensive connections with multiple brain regions, including the cerebrum, interbrain, midbrain, and hindbrain.17,18 In contrast, knowledge regarding the upstream innervation patterns of the SS remains comparatively underexplored. Previous research has identified that the SS integrates input from a variety of brain regions, such as the VPL, the ventral posteromedial nucleus of the thalamus (VPM), and posteromedial nucleus of the thalamus (POm), as well as the motor cortex (MC). 19 Moreover, reciprocal projections between SS subregions contribute to a complex local connectivity network. 20 Despite these findings, earlier investigations into upstream innervation have been limited in their scope, particularly concerning the quantitative analysis needed to compare input patterns across different SS subregions.
Traditional tracers, such as cholera toxin B subunit (CTB) and horseradish peroxidase, have historically provided critical insights into the input patterns of the SS.21–23 While these tracers effectively label upstream regions that innervate SS neurons, they lack the specificity and comprehensiveness required to map monosynaptic input networks exclusively. As a result, these methods are insufficient for systematic and quantitative comparisons of presynaptic circuits across different SS subregions. Recent advancements in monosynaptic retrograde transsynaptic tracing, employing modified rabies virus (RV), have overcome these limitations.24,25 This cutting-edge technique enables precise, whole-brain mapping of input networks, allowing for detailed and comparative analysis of presynaptic connectivity.
This study employed the RV-mediated transsynaptic retrograde tracing system to identify the monosynaptic inputs to the S1 and S2 neurons across the entire brain. The RV-CVS-N2C(ΔG) strain was selected due to its superior efficacy in labeling more upstream neurons and tracing long-distance inputs compared to the RV-SAD-B19(ΔG) strain. 24 The results revealed that both S1 and S2 received inputs from diverse brain regions, including the cortical plate (CTXpl), thalamus (TH), cortical subplate (CTXsp), striatum (STR), and pallidum (PAL). Among these five brain regions, we identified 64 subregions that contributed inputs to SS, allowing for a detailed comparison of the input distribution patterns between S1 and S2. Although input distributions across most subregions exhibited notable similarities, significant differences were observed in the dominance patterns of S1 and S2 within key brain areas involved in motor control, pain perception, and emotional processing, such as the MC, SS, ACA, agranular insular area (AI), VPL, VPM, and PO. These findings established a comprehensive anatomical framework to deepen our understanding of how sensory information is encoded within the S1 and S2 regions of the brain.
Materials and methods
Animals
All surgery and experimental procedures were performed in accordance with the guidelines of the Committee on the Ethics of Laboratory Animal Center, Fudan University, China. The C57BL/6J mice were purchased from Shanghai Jihui Laboratory Animal Care Co., Ltd. All mice used in the experiments were adult males, aged 8–12 weeks, with body weight ranging from 25 to 30 g. Mice were grouphoused in a quiet room with a 12/12-h light/dark cycle, and a thermostatically controlled environment with the temperature of 22–25°C. Food and water were provided ad libitum.
Virus information
All viral tools utilized in this study were packaged and provided by BrainVTA (BrainVTA Co., Ltd., Wuhan, China). The adeno-associated (AAV) helper viruses, comprising rAAV-hsyn-His-EGFP-2a-TVA-WPRE-pA and rAAV-hsyn-RG-WPRE-hGB-polyA, were packaged into 2/9 serotypes with final titers of 3.21 × 10¹² and 5.47 × 10¹² genomic copies per milliliter, respectively. The RV-CVS-EnvA-N2C(ΔG)-tdTomato was titered at 2 × 10⁸ infecting units per milliliter.
Stereotaxic injections
For all stereotaxic viral injections, C57BL/6J mice were anesthetized with chloral hydrate (100 mg/kg) and positioned in a stereotaxic apparatus (RWD Life Science, Shenzhen, China). A small incision was made to expose the skull, and a small hole was drilled on skull above the injection site (S1: AP: −1.46 mm, ML: −3.00 mm, DV: −1.75 mm; S2: AP: −1.34 mm, ML: −3.95 mm, DV: −2.90 mm). Two helper viruses, rAAV-EGFP-TVA and rAAV-RG, were mixed a ratio of 1:1 prior to viral injections and 10 nL AAV mixtures were unilaterally injected (10 nL/min) into the target site. To allow diffusion of the virus, the micropipette was not retracted until 10 min after the end of injection. Two weeks later, 180 nL of RV-CVS-EnvA-N2C(ΔG)-tdTomato was injected into the same site. Following injections, the scalp incision was closed using surgical sutures, and each mouse was placed in a warm environment until it resumed normal activity.
Perfusion and slicing
One week after the injection of RV, mice were perfused with phosphate buffer saline (PBS) and paraformaldehyde (PFA). Mouse brains were removed and embedded in agarose. The procedures for agarose embedding were generally performed as reported previously. 26 The brain orientation was adjusted during embedding. After solidification, brains were stored in PBS at 4°C until sectioned. Transverse coronal brain slices (50 µm) were prepared using a vibratome (Leica VT1200s, Leica Microsystems). Every second section was selected and visualized with a slide scanning microscope for whole brain mapping (Ni-E, Nikon, Japan).
Imaging
Before initiating the scanning process, we fine-tuned the exposure time and gain settings according to the brightness of the fluorescent signals to guarantee the acquisition of high-quality images. From each mouse brain, we selected ten coronal slices near the injection site and captured them at a magnification of 20× using a confocal microscope (Olympus FV3000, Japan) to conduct dual-channel scanning imaging. The excitation wavelengths used were 575 nm for tdTomato and 488 nm for enhanced green fluorescent protein (EGFP), respectively. For the remaining collected brain slices, we utilized an upright microscope (Ni-E, Nikon, Japan) equipped with a 10× objective lens to conduct single-channel scanning imaging. The imaging was carried out using excitation light with a wavelength of 575 nm.
Data analysis
The mouse brain regions were divided according to the Allen Brain Atlas. For cell counting, the number of the starter cells (coexpressing TVA-EGFP and EnvA-tdTomato) and RV-labeled input neurons (only expressing EnvA-tdTomato) within each brain region or subregion were quantified respectively in whole-brain slices by manual counting in ImageJ. To exclude potential leakage of the avian tumor virus receptor A (TVA) near the injection site, the RV-labeled neurons within the injection site were excluded from the count. Then, the number of the input neurons within the whole brain or a certain brain region was quantified by adding up the numbers of the input neurons within all related brain subregions. The number of input neurons of each brain subregion was normalized by the total number of input neurons counted in the same brain.
For statistical analyses, two-tailed unpaired Student’s t-tests followed by Bonferroni corrections was performed to determine statistical differences using Prism (version 10.0). The significance level was set at *p < 0.05, **p < 0.01, and ***p < 0.001. All data values were presented as mean ± SEM.
Result
Strategies for tracing monosynaptic inputs to S1 and S2
Using the RV-mediated transsynaptic retrograde tracing system, we set up experimental groups for S1 and S2 to investigate the whole-brain input patterns in the S1 and S2. For the S1 experimental group, due to the extensive area of S1, we selected the representative the barrel field of the primary somatosensory area (S1-bfd) for labeling. In the first step, AAV helper viruses were injected into either S1 or S2 to selectively express TVA and rabies glycoprotein G (RG) in the targeted cells. After a 2-week incubation period, RV-CVS-EnvA-N2C(ΔG)-tdTomato was administered into the same site (Figure 1(a) and (b)). This engineered RV variant selectively infected TVA-expressing cells and retrogradely spreaded to presynaptic neurons via RG expression. Following a 7-day expression period, starter cells were identified by the co-expression of tdTomato and EGFP (Figure 1(c)). Furthermore, tdTomato-labeled cells were observed in several other brain regions, confirming the presence of monosynaptic inputs to S1 or S2.
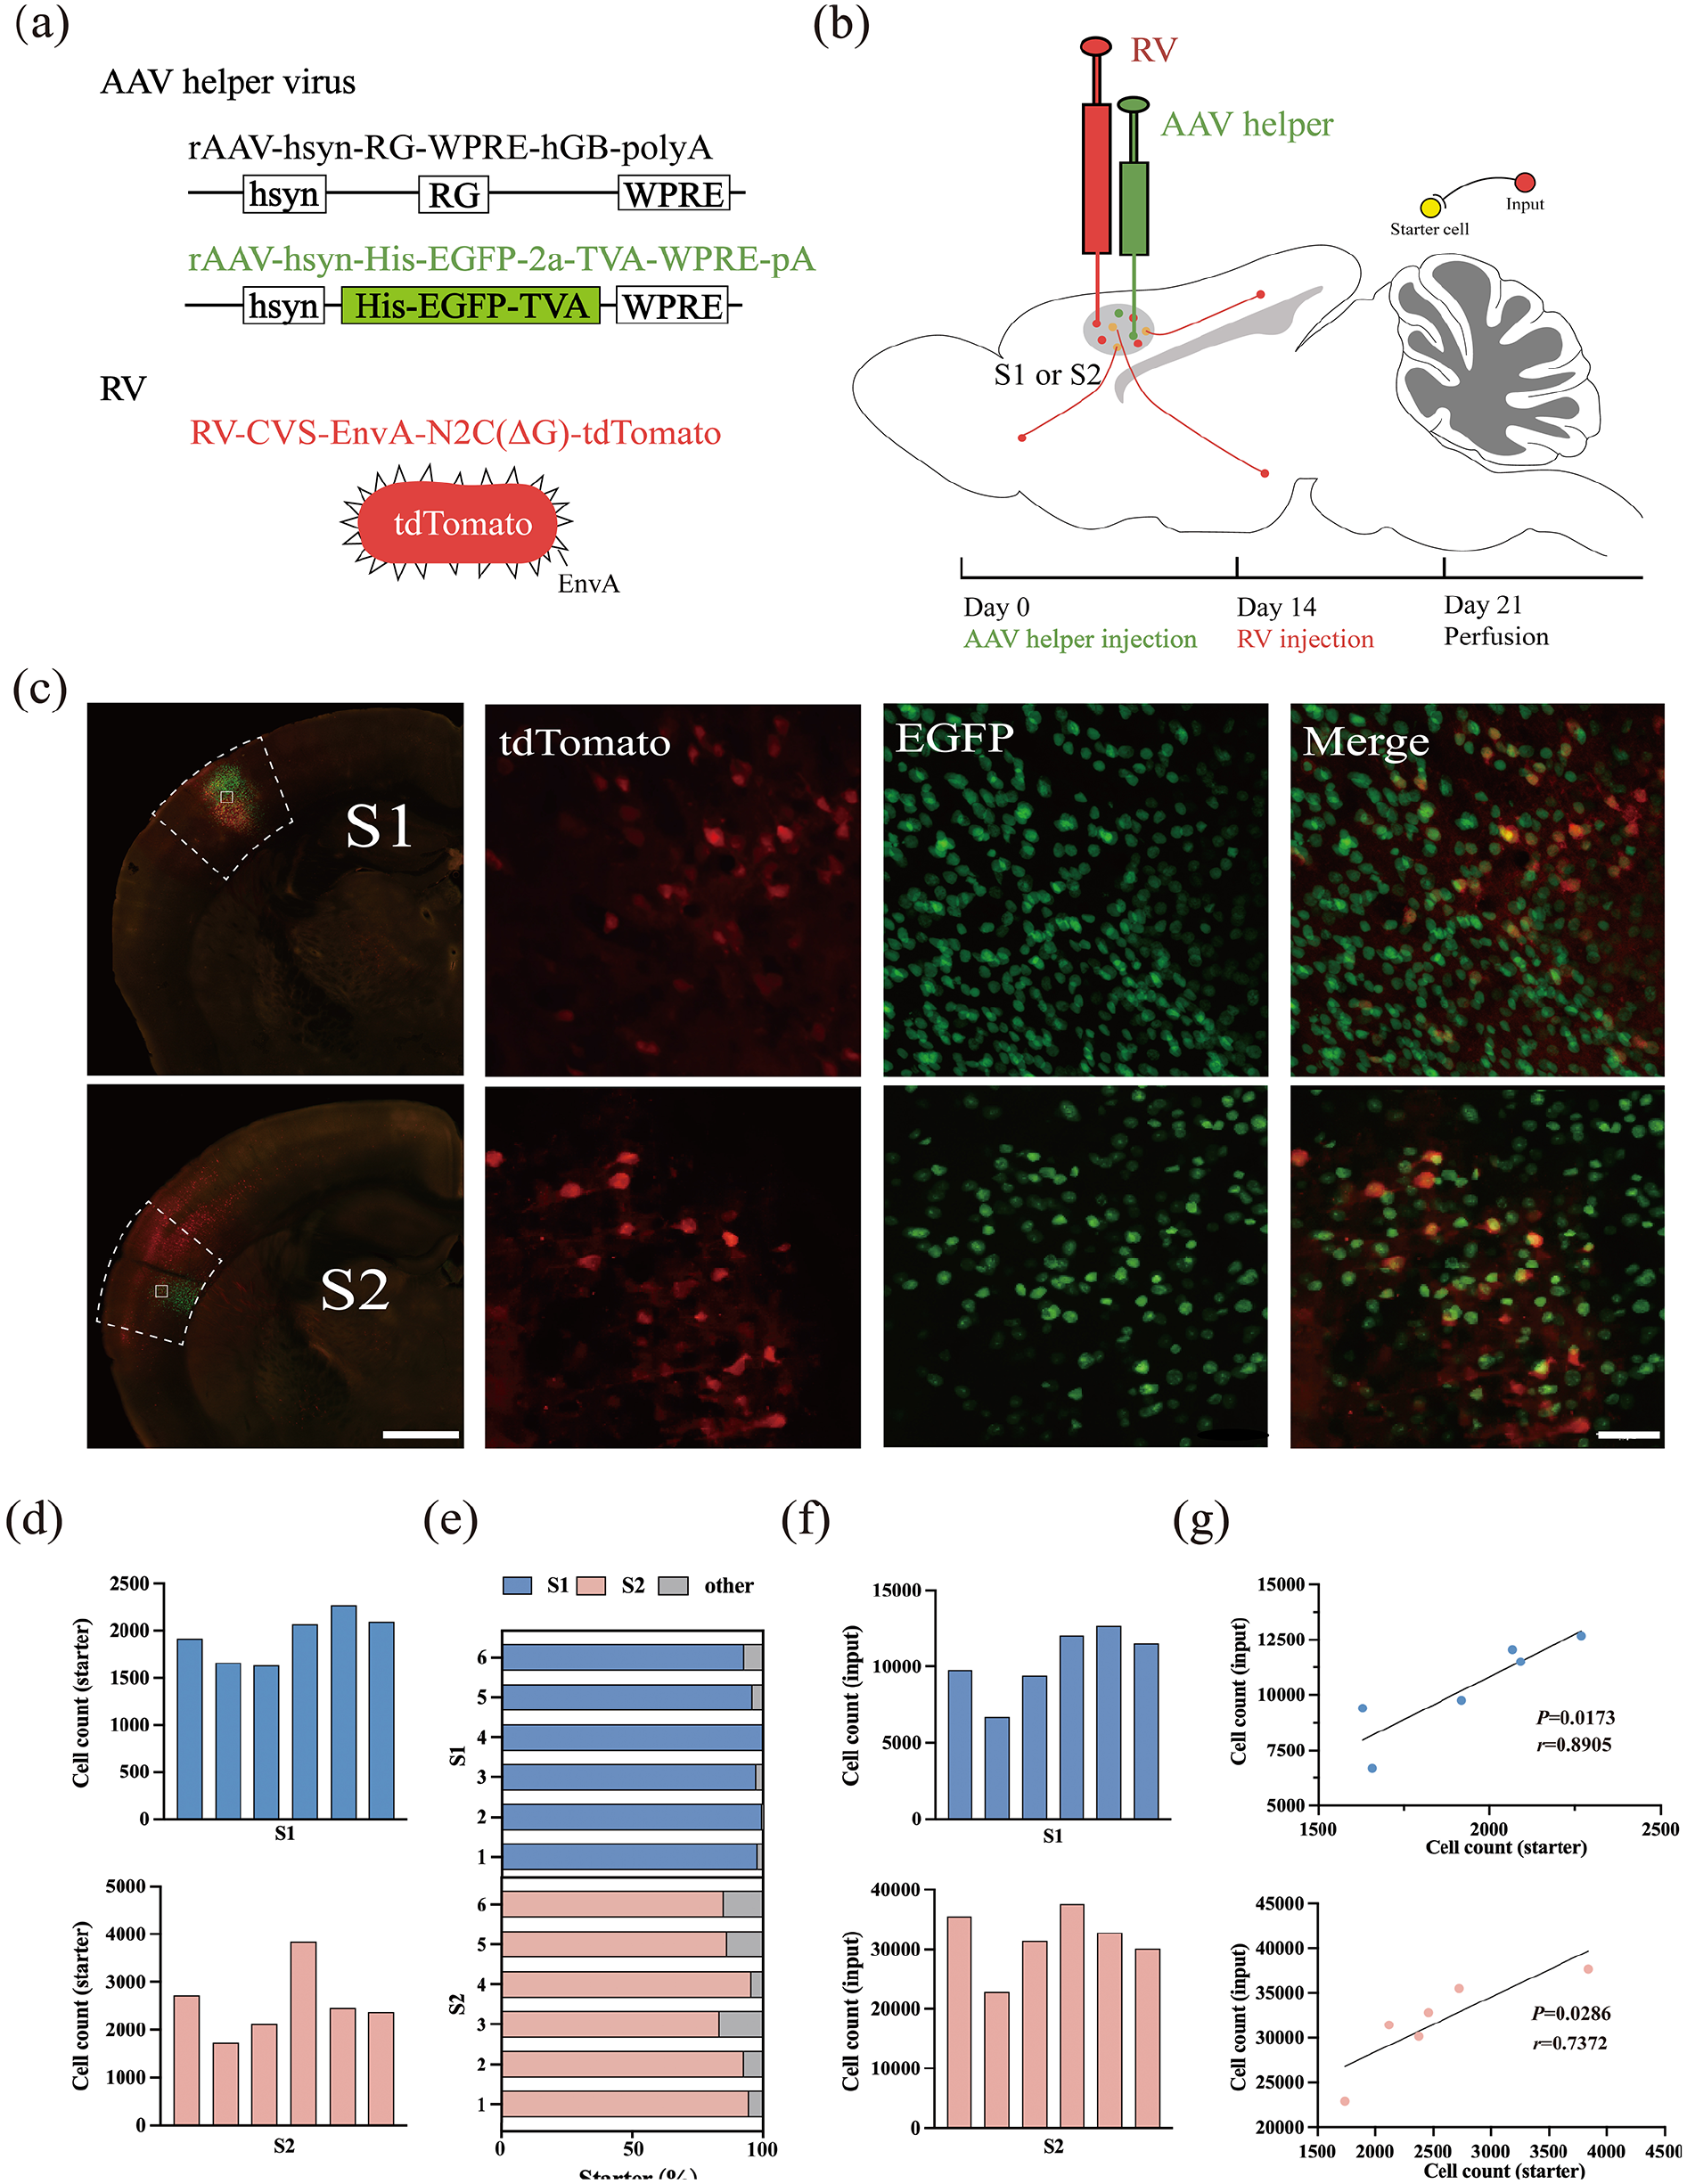
Experimental strategy for identification of monosynaptic inputs to different SS regions. (a) Recombinant AAV strains and RV. (b) Experimental design showing the timeline for the S1 or S2 tracing group. (c) Representative images of coronal brain sections containing the injection sites and the magnifications of the starter cells (upper: the S1 tracing group, down: the S2 tracing group). Scale bar: 500 µm. The starter cells were indicated by co-expressing TVA-EGFP and EnvA-tdTomato. Scale bar: 50 µm. (d) Numbers of the starter cells in each mouse (upper: the S1 tracing group, down: the S2 tracing group). (e) Proportions of labeled starter cells in injection regions. (f) Numbers of the input neurons in each mouse (upper: the S1 tracing group, down: the S2 tracing group). (g) Relationship between numbers of starter and input neurons (upper: the S1 tracing group, down: the S2 tracing group).
Starter cells within the injected regions of S1 and S2 were identified and quantified (Figure 1(d)). Quantitative analysis revealed that the majority of starter cells were localized to the respective injection sites, with 97.35 ± 0.34% in S1 and 89.65 ± 1.44% in S2, demonstrating the precision of the virus injection and the efficiency of the labeling system (Figure 1(e)).
A systematic enumeration of input neurons across all nuclear regions of the brain in each mouse was conducted. In the S1 group, the total number of input neurons ranged from 6000 to 13,000 across six samples, while in the S2 group, the range was considerably broader, from 22,000 to 38,000 (Figure 1(f)). Despite these inter-sample variations, a strong correlation was observed between the number of input neurons and the corresponding starter cells in both the S1 and S2 groups, validating the robustness and reliability of the RV-based labeling methodology (Figure 1(g)).
Overview of whole-brain inputs to the S1 and S2
To achieve a comprehensive mapping of monosynaptic input regions to S1 and S2 neurons across the entire brain, a detailed examination of serial coronal whole-brain sections was conducted (Figure 2(a) and (b)). The analysis revealed that both S1 and S2 neurons received inputs from a diverse range of brain regions, including the CTXpl, TH, CTXsp, STR, and PAL. To enable a meaningful comparison of input strengths from upstream brain regions to S1 and S2, the input neuron count in each brain region was normalized by the total count within the same mouse’s brain. This normalization mitigated the influence of inter-sample variations in total input neuron numbers.
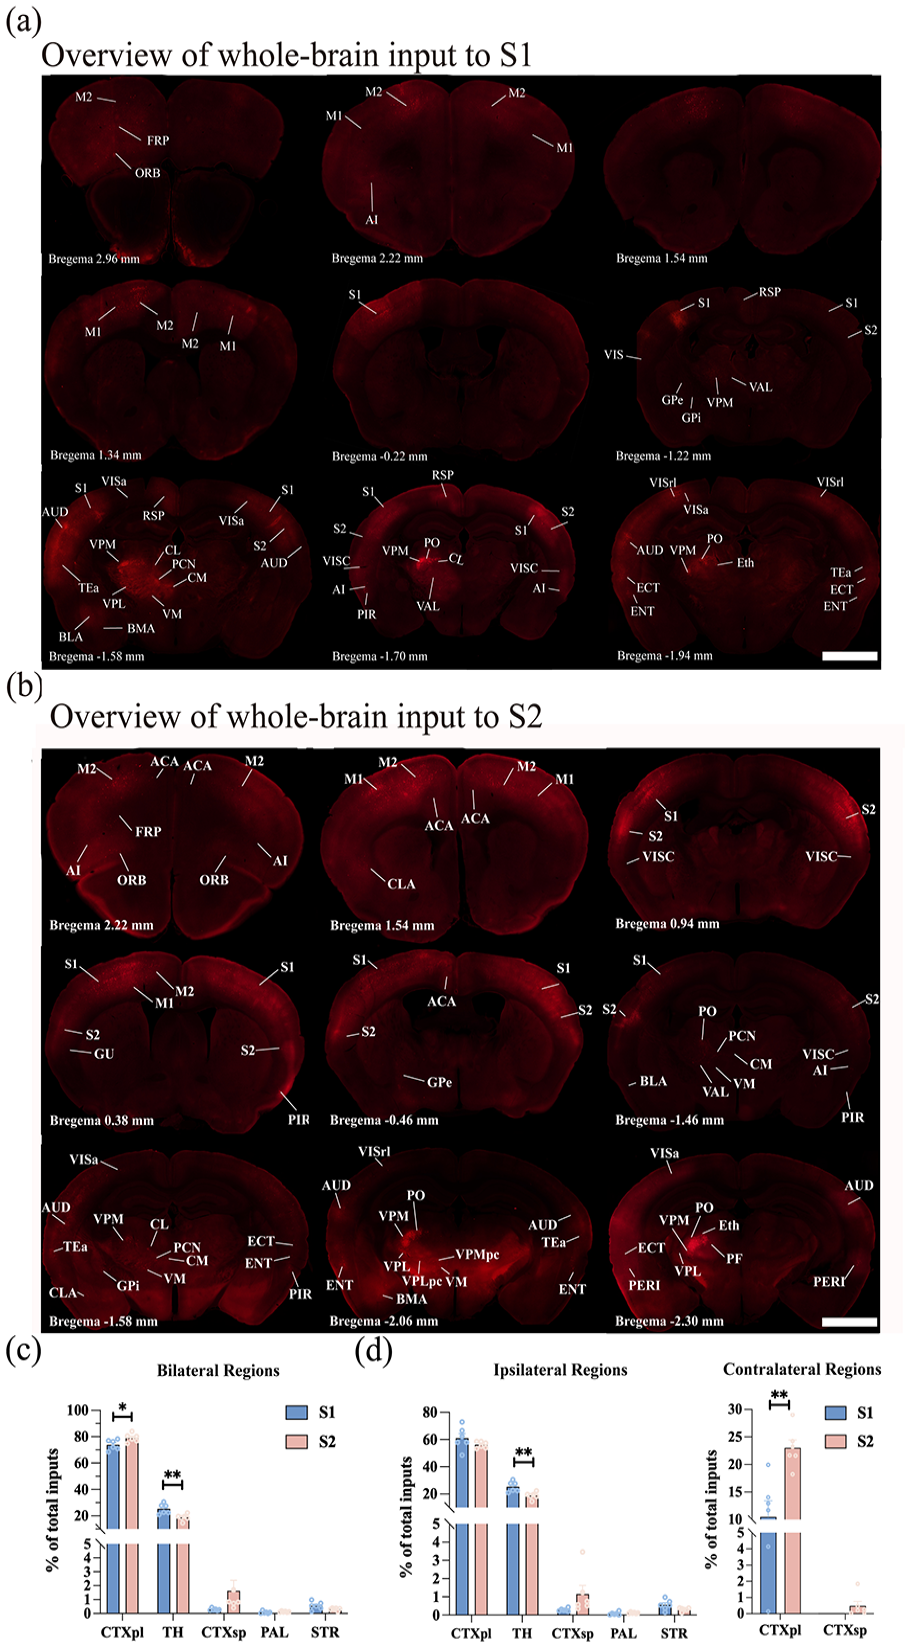
Overview of whole-brain input to S1 and S2. (a and b) Representative coronal slices showing labeling of monosynaptic inputs to the S1 (a) and S2 (b) neurons. In all coronal slices, the left side of the brain represents the same side as the injection site. Scale bar: 1 mm. (c) Whole-brain distribution of the input neurons within five brain regions from bilateral hemispheres. (d) Whole-brain distribution of the total input neurons in the ipsi-regions and contra-regions. While S1 received inputs from the ipsi-CTXpl, ipsi-TH, ipsi-CTXsp, ipsi-PAL, ipsi-STR, and contra-CTXpl, S2 received inputs from the ipsi-CTXpl, ipsi-TH, ipsi-CTXsp, ipsi-PAL, ipsi-STR, contra-CTXpl, and contra-CTXsp. Mean ± SEM (n = 6 mice for each group). **p < 0.01 and *p < 0.05, two-tailed unpaired t-test. For abbreviations, see Appendix.
By integrating input neurons across five key brain regions (Figure 2(c)), it was observed that the CTXpl provided the predominant inputs to the SS (S1: 73.80 ± 1.60%, S2: 79.13 ± 1.31%). The TH emerged as the second major source of input neurons (S1: 25.29 ± 1.56%, S2: 18.82 ± 1.03%). Additionally, a limited number of discrete nuclei within the PAL, CTXsp, and STR contributed the remaining inputs to both S1 and S2 neurons. The input proportion from the TH to the S1 was higher than that to the S2 (p < 0.01); while the S2 received higher proportions of inputs from the CTXpl than the S1 did (p < 0.05).
In this study, mice were subjected to unilateral viral injections, which revealed that most labeled input neurons were concentrated ipsilaterally to the injection site, with sparse labeling observed in the contralateral regions. To distinguish these areas clearly, specific prefixes were adopted: “ipsi-” for the ipsilateral brain region (the site of virus injection) and “contra-” for the contralateral brain region. Notably, the CTXpl exhibited dense bilateral innervation to both S1 and S2 neurons. In contrast, the TH, PAL, and STR innervated S1 and S2 neurons ipsilaterally. Furthermore, S1 exclusively received innervation from the contra-CTXpl, while S2 was innervated not only by the contra-CTXpl but also sparsely by the contra-CTXsp (Figure 2(d)).
Quantified whole-brain inputs to S1 and S2
A more refined segmentation of the five brain regions was performed, subdividing them into smaller subregions, which allowed us to identify that SS input neurons were present in 64 of these subregions (Figure 3). These input neurons were traced back to the following sources: 27 subregions within the CTXpl, 26 subregions in the TH, 5 subregions in the CTXsp, 4 subregions in the PAL, and 2 subregions in the STR. Our analysis revealed that the majority of these subregions projected to both S1 and S2. Notably, certain subregions, particularly those within the TH, displayed selective projections to either S1 or S2 rather than a random distribution. For example, the lateral dorsal nucleus of the thalamus (LD) exclusively innervated S1, while other thalamic nuclei, including the posterior intralaminar thalamic nucleus (PIL), suprageniculate nucleus (SGN), posterior limiting nucleus of the thalamus (POL), medial geniculate complex (MG), and the parvicellular part of the subparafascicular nucleus (SPFp), selectively innervated S2.
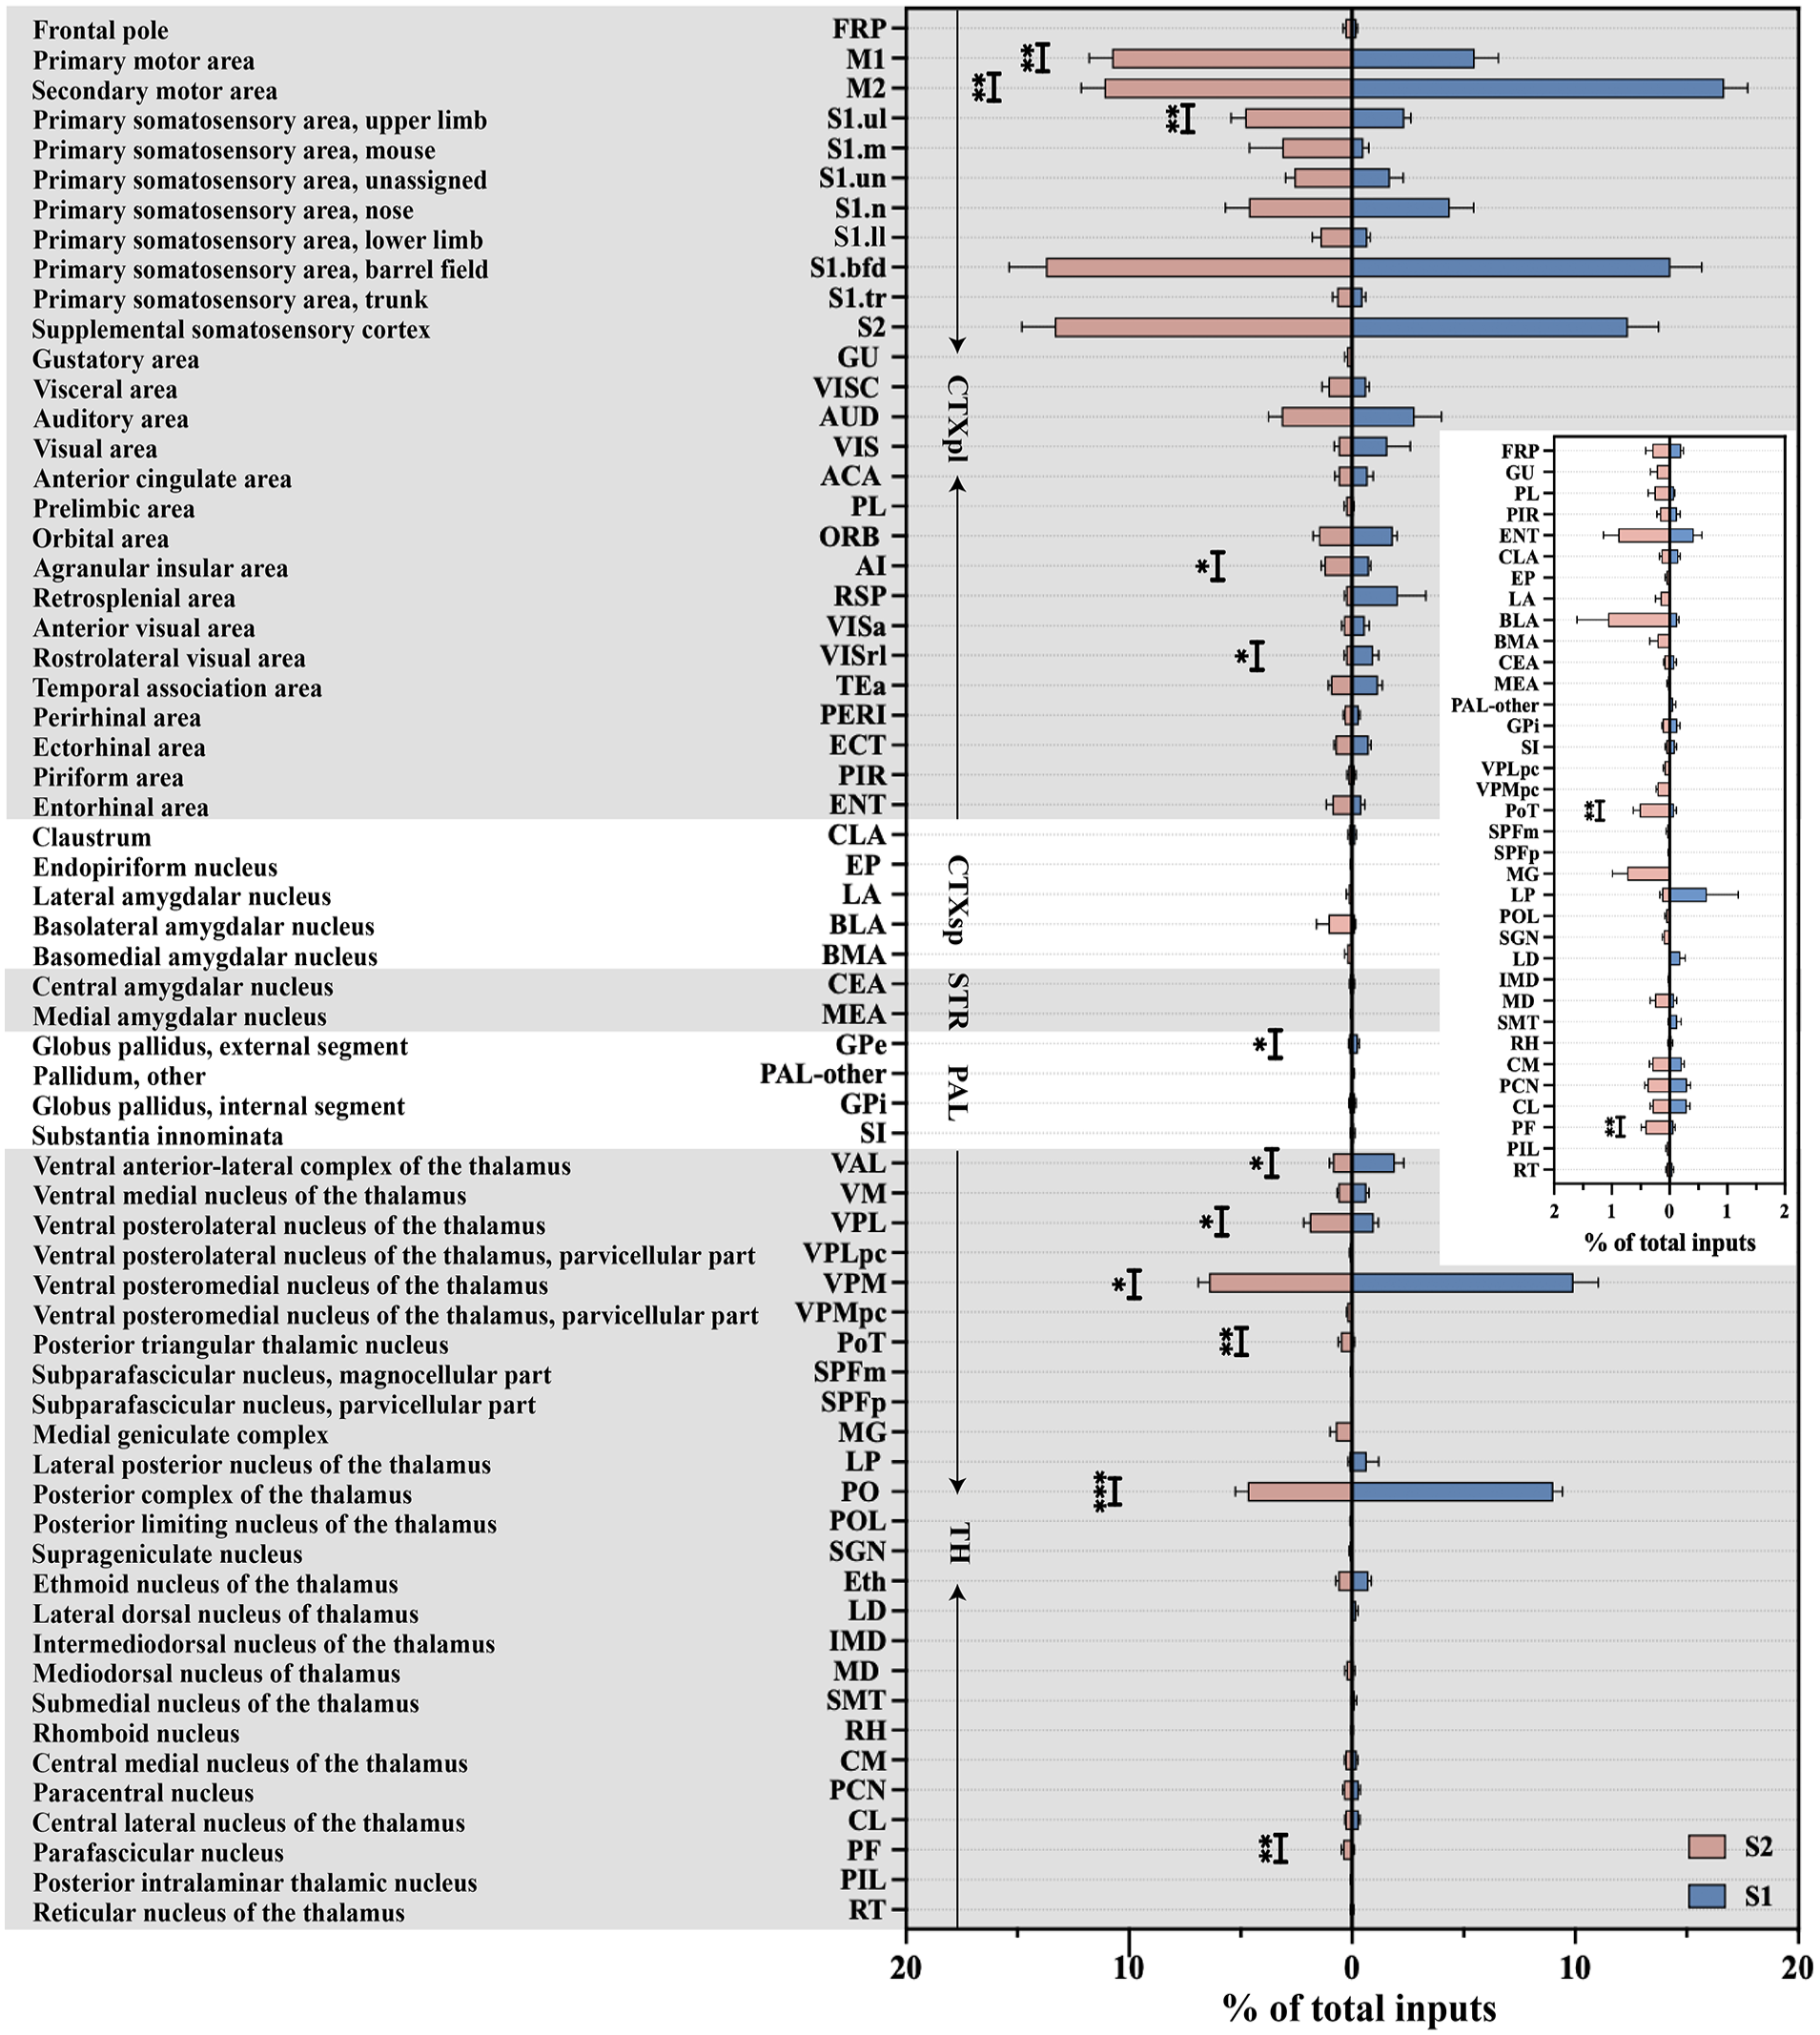
Quantitative analysis of the proportions of whole-brain input to S1 and S2 in the 64 bilateral brain subregions. Monosynaptic inputs to S1 (blue) and S2 (red). Mean ± SEM (n = 6 mice for each group). ***p < 0.001, **p < 0.01, and *p < 0.05, two-tailed unpaired t-test.
Next, a quantitative analysis was conducted to evaluate the input strength from commonly shared upstream subregions to both S1 and S2. Our findings revealed that more than 60% of the total inputs to both S1 and S2 originated from six common subregions: the secondary motor area (M2; S1: 16.67 ± 1.06%, S2: 11.11 ± 1.04%), S1-bfd (S1: 14.27 ± 1.41%, S2: 13.73 ± 1.66%), S2 (S1: 12.37 ± 1.37%, S2: 13.34 ± 1.46%), VPM (S1: 9.91 ± 1.12%, S2: 6.41 ± 0.48%), PO (S1: 9.03 ± 0.41%, S2: 4.67 ± 0.57%), and the primary motor area (M1; S1: 5.51 ± 1.05%, S2: 10.76 ± 1.04%). Importantly, M1 and M2 belong to the MC, S1-bfd, and S2 belong to SS, and PO and VPM are part of TH. This classification highlighted that both S1 and S2 received substantial projections from the MC, SS, and TH regions. Upon closer examination of input contributions from these anatomical categories, SS emerged as the largest contributor, accounting for over 30% of the total inputs to S1 (36.72 ± 3.06%) and S2 (44.28 ± 2.13%). Following SS, MC contributed approximately 20% of the total inputs to S1 (22.18 ± 1.32%) and S2 (21.87 ± 1.72%). A more detailed analysis of the inputs from SS, MC, and TH to S1 and S2 was then carried out.
In addition to these major input sources, we also examined the inputs from the ACA and AI, two cortical regions intimately linked with pain processing (Figure 3). Our whole-brain mapping revealed modest but functionally significant monosynaptic inputs to S1 and S2 from the ACA and AI, both of which are critically implicated in pain generation and modulation. Quantitative analysis demonstrated that ACA contributed approximately 0.70 ± 0.26% of total inputs to S1 and 0.62 ± 0.16% to S2, while AI accounted for 0.75 ± 0.09% of inputs to S1 and 1.25 ± 0.13% to S2, showing preferentially targeted S2 (AI: p < 0.01). Despite their relatively small proportions, these inputs exhibited distinct spatial and directional organization. ACA inputs to SS were characterized by bilateral connectivity, with 81.78 ± 3.66% and 15.86 ± 3.81% of total ACA-derived inputs originating from ipsi- and contra-ACA, respectively. Similarly, AI inputs displayed bilateral connectivity, with 84.01 ± 3.40% of AI projections to SS arising from ipsi-AI and 14.25 ± 3.60% from contra-AI. While ACA and AI collectively constituted a minor fraction of total SS inputs, their connectivity patterns – particularly the bilateral ACA-S1/S2 pathways and the preferential AI-S2 projections – may play pivotal roles in encoding and modulating distinct pain modalities.
SS inputs to S1 and S2
Both S1 and S2 received dense, bilateral innervation from multiple regions of SS, specifically including ipsi-S1, ipsi-S2, contra-S1, and contra-S2 (Figure 4(a)). The proportions of these projections within the overall SS inputs to S1 and S2 were calculated. Notably, the ipsi-S1 provided the predominant inputs to the SS (S1: 44.57 ± 5.97%, S2: 57.53 ± 2.60%), emerging as the largest contributor among the SS regions to both S1 and S2 (Figure 4(b)).

Monosynaptic inputs to S1 and S2 from the SS. (a) Example images showing inputs from the bilateral SS to the S1 (left) and S2 (right). Scale bar: 800 μm (left), 400 μm (right). (b) Pie chart illustrating the distribution patterns of the input neurons within the bilateral SS between the S1 (left) and S2 (right) tracing groups. The bilateral SS was divided into the ipsi-S1, ipsi-S2, contra-S1, and contra-S2. (c) Heatmap showing the proportion of the total inputs to S1 and S2 in the ipsi-SS (left) and contra-SS (right) subregions. Mean ± SEM (n = 6 mice for each group). ***p < 0.001, **p < 0.01, and *p < 0.05, two-tailed unpaired t-test.
The S1 region is morphologically heterogeneous, comprising several distinct subregions, including the upper limb (S1-ul), mouth (S1-m), trunk (S1-tr), S1-bfd, nose (S1-n), unassigned (S1-un), and lower limb (S1-ll). The relative contributions of these ipsi-S1 subregions to the total inputs received by S1 and S2 were analyzed. Among the ipsi-S1 subregions, ipsi-S1-bfd contributed the most to S1, accounting for 8.71 ± 2.09% of the total inputs, followed by ipsi-S1-n (3.28 ± 0.95%) and ipsi-S1-ul (2.12 ± 0.28%). Similarly, ipsi-S1-bfd remained the largest contributor to S2, accounting for 10.53 ± 1.45% of the total inputs, followed by ipsi-S1-ul (4.42 ± 0.64%) and ipsi-S1-n (3.39 ± 0.50%). Notably, ipsi-S1-ul contributed higher proportions of the total inputs to the S2 than to the S1 (p < 0.01), while no statistically significant differences were observed in the contributions of the other ipsi-S1 subregions to S1 and S2 (Figure 4(c)).
Within the contra-S1 subregions, contra-S1-bfd emerged as the primary source of inputs to S1, contributing 4.71 ± 1.46% of the total inputs, followed by contra-S1-n (0.81 ± 0.43%). For inputs to S2, contra-S1-bfd again accounted for the largest proportion (3.20 ± 0.51%), followed by contra-S1-n (1.24 ± 0.66%). Among the seven contra-S1 subregions, contra-S1-ll and contra-S1-ul contributed higher proportions of inputs to the S2 than to the S1 (contra-S1-ll: S1: 0.05 ± 0.02% vs S2: 0.20 ± 0.05%, p < 0.05, contra-S1-ul: S1: 0.16 ± 0.05% vs S2: 0.37 ± 0.06%, p < 0.05, Figure 4(c)).
Additionally, both ipsi-S2 and contra-S2 demonstrated strong projections to both S1 and S2 neurons. Interestingly, ipsi-S2 contributed higher proportions of the total inputs to the S1 than to the S2 (S1: 10.67 ± 1.48% vs S2: 5.31 ± 0.85%, p < 0.05). By contrast, the S2 received higher proportions of the total inputs from the contra-S2 than the S1 did (S1: 1.47 ± 0.43% vs S2: 8.03 ± 0.67%, p < 0.001, Figure 4(c)).
MC inputs to the S1 and S2
Both S1 and S2 received extensive projections from multiple subregions of the bilateral MC, with a higher density of input neurons originating from ipsi-MC (Figure 5(a)). The proportions of these projections relative to the total MC inputs were subsequently calculated. Analysis revealed that the ipsi-M2 contributed the largest proportion to S1 (68.82 ± 4.78%), followed by ipsi-M1 (22.28 ± 3.25%), contra-M2 (6.87 ± 1.12%), and contra-M1 (2.03 ± 0.74%). For inputs to S2, ipsi-M1 accounted for the largest proportion (38.76 ± 1.37%), followed by ipsi-M2 (36.33 ± 3.56%), contra-M2 (14.47 ± 2.23%) and contra-M1 (10.44 ± 2.16%, Figure 5(b)).
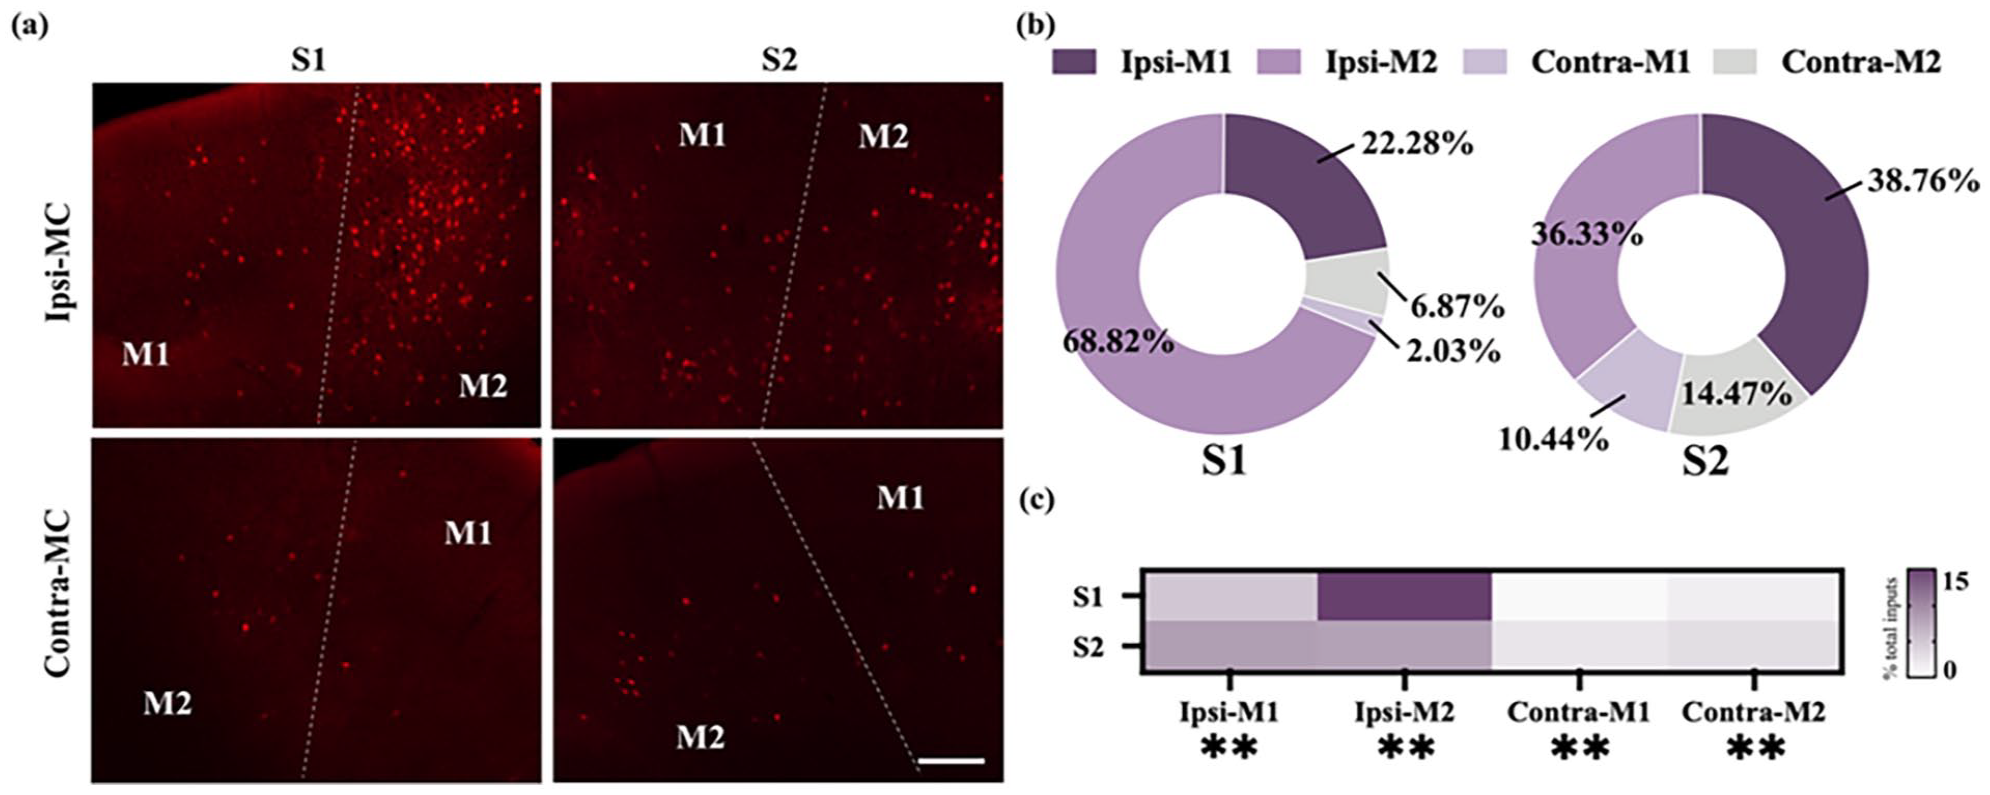
Monosynaptic inputs to S1 and S2 from the MC. (a) Example images showing inputs from the bilateral MC to the S1 (left) and S2 (right). Scale bar: 200 μm. (b) Pie chart illustrating the distribution of the input neurons within the bilateral MC between the S1 (left) and S2 (right) tracing groups. The bilateral MC was divided into the ipsi-M1, ipsi-M2, contra-M1, and contra-M2. (c) Heatmap showing the distribution of the total input neurons in the ipsi-MC and contra-MC subregions. Mean ± SEM (n = 6 mice for each group). **p < 0.01, two-tailed unpaired t-test.
To investigate these projections in greater detail, the relative contributions of individual MC subregions to the total inputs were examined. Specific MC subregions demonstrated preferential projections to either S1 or S2. Notably, ipsi-M2 exhibited a stronger innervation of S1 compared to S2 (p < 0.01). Similarly, the input proportion from the contra-M1 and contra-M2 to the S2 were higher than that to the S1 (contra-M1: p < 0.01; contra-M2: p < 0.01). Conversely, the S2 received higher proportions of the total inputs from the ipsi-M1 than the S1 did (p < 0.01, Figure 5(c)). These findings emphasize the distinct, subregion-specific patterns of MC projections to S1 and S2, reflecting the specialized roles of these subregions in somatosensory processing and motor integration.
TH inputs to S1 and S2
SS, consisting of S1 and S2, exclusively received projections from ipsi-TH (Figure 6(a)), with no inputs detected from the contra-TH (Supplemental Figure 1). Within ipsi-TH, neuronal inputs were traced to distinct regions, including the ventral group of the dorsal thalamus (VENT), the lateral group of the dorsal thalamus (LAT), the intralaminar nuclei of the dorsal thalamus (ILM), the medial group of the dorsal thalamus (MED), the subparafascicular nucleus (SPF), the geniculate group of the dorsal thalamus (GENd), the anterior group of the dorsal thalamus (ATN), and the reticular nucleus of the thalamus (RT; Figure 6(b) and (c)). The proportion of projections from thalamic nuclei to S1 and S2 was calculated relative to the total TH inputs. VENT emerged as the primary contributor, providing the highest TH input to both S1 (53.00 ± 2.35%) and S2 (56.64 ± 1.34%), followed by LAT, which contributed 41.52 ± 2.25% of the total TH inputs to S1 and 29.30 ± 1.68% to S2. ILM accounted for 3.73 ± 0.52% of the total TH inputs to S1 and 8.03 ± 1.12% to S2 (Figure 6(b)). ILM provided a significantly greater proportion of the TH inputs to S2 compared to S1 (p < 0.01). In contrast, LAT contributed a markedly higher proportion of the TH inputs to S1 than S2 (p < 0.01). These findings underscored region-specific differences in TH input patterns, with VENT identified as the dominant nucleus for both S1 and S2, while ILM and LAT exhibited preferential connectivity, potentially reflecting their specialized roles in sensory processing.

Monosynaptic inputs to S1 and S2 from the ipsi-TH. (a) Example images showing inputs from the ipsi-TH to the S1 (left) and S2 (right). Scale bar, 200 µm (b) Pie chart illustrating the distribution of the input neurons within the ipsi-TH between the S1 (left) and S2 (right) tracing groups. The TH was mainly divided into the VENT, LAT, ILM, and other parts. (c) Heatmap showing the distribution of the total input neurons in the ipsi-TH. The gray cross signifies the absence of input from the corresponding TH subregion. Mean ± SEM (n = 6 mice for each group). ***p < 0.001, **p < 0.01, and *p < 0.05, two-tailed unpaired t-test.
Furthermore, within eight TH regions, we identified 26 distinct subregions that contributed inputs to SS (Figure 6(c)). Among these, VPM emerged as the dominant contributor, providing the densest input to both S1 (9.91 ± 1.12%) and S2 (6.41 ± 0.48%). This was closely followed by PO (S1: 9.03 ± 0.41%, S2: 4.67 ± 0.57%). Of particular interest, 6 of the 26 subregions exhibited preferential input patterns, highlighting subregional specialization. The ventral anterior-lateral complex of the thalamus (VAL; S1: 1.91 ± 0.41% vs S2: 0.87 ± 0.15%, p < 0.05), VPM (p < 0.05), and PO (p < 0.001) contributed higher proportions of the total inputs to the S1 than to the S2. Conversely, S2 received higher proportion of the total inputs from VPL (S1: 0.98 ± 0.19% vs S2: 1.91 ± 0.26%, p < 0.05), the posterior triangular thalamic nucleus (PoT; S1: 0.08 ± 0.04% vs S2: 0.52 ± 0.11%, p < 0.01), and the parafascicular nucleus (PF; S1: 0.07 ± 0.03% vs S2: 0.42 ± 0.07%, p < 0.01) than the S1 did.
Among the 26 identified thalamic subregions, a subset demonstrates specificity in their projections, exclusively targeting either S1 or S2. S1 received inputs from 17 subregions, while 25 subregions innervated S2. Notably, certain subregions such as PIL, SGN, POL, MG, and the magnocellular part of the subparafascicular nucleus (SPFm) exhibited exclusive connectivity to S2, whereas LD was the only subregion providing specific projections solely to S1.
Despite S1 received denser overall TH innervation compared to S2 (Figure 2(c)), S2 was characterized by a more diverse array of inputs from various TH subregions. This diversity likely reflects the distinct roles of S1 and S2 in sensory processing, with S2 integrating a broader range of thalamic signals to support complex sensory functions.
Discussion
Using the RV-mediated transsynaptic retrograde tracing approach, this study provided a comprehensive mapping of monosynaptic inputs to the S1 and S2 neurons across the entire mouse brain. Quantitative analyses elucidated brain-wide input patterns to these regions, enabling a detailed comparison of their convergent and divergent characteristics (Figures 7 and 8). Both S1 and S2 were found to receive substantial inputs from five key regions, including CTXpl, TH, CTXsp, STR, and PAL. The region distribution patterns of the input neurons within the CTXpl and TH were distinct between the S1 and S2 tracing groups. The TH contributed higher proportions of the total inputs to the S1 than to the S2. By contrast, the S2 received higher proportions of the total inputs from the CTXpl than the S1 did. These findings highlighted the functional specialization and hierarchical organization of S1 and S2 within somatosensory processing networks. Further dissection of input patterns across 64 brain subregions revealed a complex and extensive distribution of projections, advancing the understanding of connectivity in these cortices. The results aligned with previous evidence of widespread connectivity while offering novel insights into the specificity of these inputs to S1 and S2. By identifying these distinctions, the findings provide a deeper understanding of the neural circuits that underlie somatosensory perception and modulation. Moreover, this enhanced understanding has potential implications for developing targeted therapeutic strategies to address pain and other somatosensory disorders.

Schemes of whole-brain input patterns of S1 and S2. (a) Schematic of the ipsi-subregions inputs to different SS regions. (b) Schematic of the contra-subregions inputs to different SS regions. Every pie chart indicates the relative amount of input neurons to S1 and S2. If the circle was exclusively blue, it signified that the subregion exclusively projected to S1; if the circle was solely pink, it indicated that the subregion exclusively projected to S2; and when the circle contained both pink and blue, it demonstrated that the subregion had projections to both S1 and S2.

Quantitative analysis of contralateral to ipsilateral inputs to the S1 and S2 in each brain subregion analyzed. Whole-brain distribution of the input neurons in the ipsi- subregions (left) and contra-subregions (right). Mean ± SEM (n = 6 mice for each group). ***p < 0.001, **p < 0.01, and *p < 0.05, two-tailed unpaired t-test. For abbreviations, see Appendix.
Our research revealed that SS, MC, and TH were the main input sources to SS in the whole brain. Among these three brain regions, SS provided the highest input to both S1 and S2. The results demonstrated significant local projections within the SS, aligning with earlier findings that have established the presence of complex local connectivity within SS regions. 20 This study extended these findings by uncovering novel insights into these local projections, revealing that distinct SS subregions projected with varying intensities to both S1 and S2. In several bilateral SS subregions, including S1-bfd, S1-un, S1-n, and S1-tr, the distribution patterns of input neurons to S1 and S2 exhibited notable similarity. However, specific subregions displayed pronounced differences in their input patterns: S2 received higher proportions of the total inputs from the ipsi-S1-ul, contra-S1-ll, contra-S1-ul, and contra-S2 than the S1 did, while S1 received higher proportions of the total inputs from the ipsi-S2 than the S2 did. These distinct input patterns, combined with previously characterized pathways, underscore the intricate architecture of the local neural networks within SS.
Earlier studies have highlighted the critical role of internal SS circuits in diverse neural functions. For instance, within S1, pyramidal neurons received innervation from GABAergic interneurons, forming local circuits that are essential for sensory input encoding. 27 Additionally, these circuits contributed to pain modulation. Electroacupuncture, for example, has been shown to activate inhibitory neural circuits within SS, offering potential relief from neuropathic pain. 16 The findings presented here further enhance this understanding by elucidating the unique projection patterns between S1 and S2, potentially reflecting their distinct contributions to sensory processing and pain modulation. The intricate local projection patterns within SS not only facilitate sensory encoding but also present promising therapeutic implications for chronic pain alleviation. Continued exploration of the specific mechanisms underlying these projections is crucial to fully elucidate the functional significance of these complex neural connections.
In addition to SS, MC was also a major input source to both S1 and S2. Previous studies have established the presence of dense projections from the MC to SS.28,29 The connection between MC and S1 was crucial for precise perceptual processing, enabling the integration of sensory information with motor activity. This interaction allowed S1 to predict motor outcomes based on motor output data. 30 In contrast, S2 was primarily involved in integrating prior motor experiences and memories, which were critical for motor learning and the retention of motor memory. 31
Further analysis compared the projection intensities from various MC subregions to S1 and S2, revealing distinct innervation patterns. Specifically, the input proportion from the ipsi-M2 to the S1 was higher than that to the S2; while the S2 received higher proportions of inputs from the ipsi-M1, contra-M1, and contra-M2 than the S1 did. These findings suggested that S2 relied on a diverse array of motor-related inputs to integrate and consolidate information, facilitating the formation of coherent motor memories. This result is consistent with prior functional studies that have highlighted differences in motor-related roles between S1 and S2.
The input neurons of S1 and S2 exhibited dense distribution within the TH, a critical region involved in the modulation of sensory functions, including pain perception. The VPM has been implicated in neuropathic facial pain, with targeted deep-brain stimulation of the left VPM demonstrating efficacy in treating right-sided trigeminal neuralgia. 32 Additionally, aberrant activity within the PO was associated with the modulation of pathological pain. Therapeutic approaches such as selective inhibition of the ventral zona incerta (ZIv)-PO circuit or the administration of cannabinoids into the PO have shown potential in alleviating symptoms of pathological pain. 33 Electrical stimulation of the VPL has demonstrated significant efficacy in reducing mechanical allodynia in rat models of neuropathic pain. 34
Notably, both S1 and S2 received substantial innervation from three thalamic subregions: VPM, PO, and VPL. This extensive innervation suggested a strong association between these thalamic inputs and the manifestation of pathological and neuropathic facial pain. Distinct innervation patterns among these thalamic subregions were observed, revealing functional specialization. Specifically, the input proportion from the VPM and PO to the S1 were higher than that to the S2; while the S2 received higher proportions of inputs from the VPL than the S1 did. These differential projections imply that S1 and S2 might fulfill distinct roles in mediating pathological and neuropathic facial pain. Previous studies have shown that projections from glutamatergic neurons in the PO to glutamatergic neurons in the S1 mediated allodynia associated with tissue injury. 35 Further investigation into the roles of the VPM-S1, VPM-S2, and PO-S2 pathways in pain modulation holds the potential to enhance understanding of their functional significance. Additionally, the PF projected to both S1 and S2, and the proportion of input from the PF to S2 was higher than that to S1. The PF has been implicated in abnormal pain linked to depressive-like states. Activation of glutamatergic neurons in the PF has been shown to alleviate both pain and depressive-like behaviors. Recent research highlighted the critical role of the PF-S2 pathway in modulating comorbid pain associated with depression. 36 However, whether the PF-S1 pathway similarly contributes to pain modulation remains an open question and warrants further exploration.
The ACA and AI are two key cortical regions prominently activated during pain processing.37,38 Human neuroimaging studies demonstrate that the AI is selectively engaged by noxious stimuli, and direct electrical stimulation of this region evokes pain-like sensations, underscoring its essential role in pain perception.39,40 Concurrently, a substantial body of evidence demonstrates significant changes in neuronal activity within ACA in both chronic pain patients and corresponding rodent models of these conditions, underscoring the ACA’s crucial role in the experience of pain.37,41,42 Recent advances have established comprehensive whole-brain connectivity maps of the mouse AI and ACA. Notably, a study mapping insular connectivity revealed that while AI-subcortical interactions are predominantly unidirectional, AI-cortical connections – including those with S1 and S2 – exhibit robust bidirectionality, 43 aligning with our findings. The posterior-medial AI shared conserved connectivity profiles, whereas the anterior AI displayed divergent network architecture, defining two major functional compartments. This work further demonstrated subregional specificity in AI outputs: anterior and medial AI preferentially innervate S1, whereas posterior AI strongly targets S2. Our data corroborate and extend these observations, revealing a global bias of insular inputs toward S2, suggesting S2 serves as a key node for integrating nociceptive information from AI. On the other hand, the ACA exhibited widespread ipsilateral projections to subcortical regions involved in motor, sensory, and autonomic integration such as caudate putamen (CPu), ventral thalamic nucleus, zona incerta (ZI), periaqueductal gray (PAG), superior colliculus (SC), with additional contralateral connectivity to homologous and functionally linked nuclei including the ACA, reuniens thalamic nucleus (Re), PAG, interpolar spinal trigeminal nucleus (Sp5I), and dorsal medullary reticular nucleus (MdD). In addition, the ACA integrates direct monosynaptic inputs from key brain regions – including the cerebral cortex, amygdala, STR, TH, and brainstem – with cortical ACA neurons primarily receiving ipsilateral projections. 44 It was also demonstrated that anterograde AAV2/9 tracing identified ACA projections to ipsi-S1. 45 However, our monosynaptic rabies virus (RV)-ΔG retrograde tracing uncovered bilateral ACA inputs to both S1 and S2.
These discrepancies likely arise from inherent methodological differences: (1) Viral tropism: Retrograde tracers (e.g. RV-ΔG) and anterograde vectors (e.g. AAV2/9) exhibit divergent neurotropism, as demonstrated by Cao’s lab, 46 who found when they were applied to trace the inputs of lateral hypothalamic area and medial preoptic nucleus, rAAV2-retro demonstrated preference in cerebral cortex, whereas RV-ΔG prefers to label basal ganglia and hypothalamus. (2) Layer specificity: the results showed a distinct preference for specific cortical layer of rAAV2-retro in layer 5 and RV-ΔG in layer 6 when they were injected into dorsal lateral geniculate nucleus to label corticothalamic neurons in primary visual cortex. 46 (3) Technical variability: Luo’s lab identified ACA inputs to dorsal STR using RV-ΔG, 47 whereas Kreitzer’s lab did not, 48 likely due to differences in viral titer or Cre-driver specificity. Crucially, anterograde tracers map axonal terminals (e.g. ACA→S1/S2 synapses), while retrograde approaches label presynaptic somata (e.g. ACA neurons projecting to S1/S2). These strategies may capture non-overlapping circuits if axons and somata reside in distinct layers. To resolve such ambiguities, multimodal validation – integrating intersectional genetic tools (e.g. Cre-dependent AAV/RV systems) with functional assays (optogenetics, pharmacogenetics) – is essential. Ultimately, neuroanatomical conclusions must account for tracer-specific biases, and convergence across methodologies remains critical for robust circuit validation.
Phantom limb pain (PLP), a refractory neuropathic pain syndrome following limb amputation, is mechanistically associated with maladaptive cortical reorganization within SS. 49 Clinical evidence demonstrates that tactile stimulation of the face or lower jaw in amputees evokes phantom limb sensations or pain, 50 a phenomenon attributed to invasion of deafferented S1 territories by adjacent cortical representations. Neuromagnetic imaging corroborates that such cortical remapping – where inputs from the lower jaw encroach upon the former hand representation in S1 – correlates with PLP intensity.51–54 Specifically, noninvasive brain stimulation studies reveal that PLP relief and concomitant reductions in S1/M1 activity are temporally linked to preceding modulations in AI and S2 activity, 55 underscoring the pivotal role of interconnected SS-M1-AI circuitry in PLP pathogenesis. After amputation, bilateral M1 inputs to S1/S2 may disrupt interhemispheric inhibitory balance, fostering hyperexcitability that couples S1/S2 reorganization to PLP onset. Concurrently, post-amputation maladaptive plasticity within AI-S2 circuits could amplify aberrant nociceptive signaling, transforming residual limb inputs into phantom pain percepts. Furthermore, the thalamocortical pathways delineated here – particularly dominant VPM/PO→S1 and VPL→S2 projections – may act as conduits for non-nociceptive facial/jaw mechanosensory inputs to invade deafferented S1, a potential substrate for cortical territory usurpation observed in PLP. Future studies should investigate whether disinhibition in these circuits post-amputation permits the integration of aberrant inputs and whether modulating the connectivity between M1/AI/TH and S1/S2 normalizes cortical maps. Targeting these pathways through neuromodulation of M1/AI/TH outputs or thalamocortical oscillations could disrupt maladaptive plasticity while preserving physiological sensory processing.
Considering the extensive nature of S1, this study specifically focused on elucidating the upstream regulatory patterns of the S1-bfd subregion. This subregion serves as a representative model to infer broader upstream regulatory mechanisms of S1 due to its distinct structural attributes and its pivotal role in tactile information processing.56,57 S1-bfd is an essential site for validating S1 functions; however, it offers a limited perspective on the overarching upstream regulatory mechanisms of S1 as a whole. Achieving a comprehensive understanding of S1’s dominant upstream patterns across the brain necessitates the inclusion and analysis of additional subregions in future investigations.
Moreover, this study did not distinguish between the diverse neuronal subtypes within the SS. The SS encompasses excitatory and inhibitory neurons, each serving specialized roles in sensory information encoding and integration. For instance, GABAergic interneurons within S1 differentiate sensory inputs from various long-range projections, whereas excitatory neurons primarily facilitate the transmission and amplification of sensory signals. 19 To refine the understanding of upstream regulatory patterns in distinct neuronal subtypes within the SS, future research should employ specific Cre mouse lines to enable targeted analysis.
Regarding viral tracing methodologies, while significant advancements have been achieved using single retrograde labeling strategies, the monosynaptic RV tracing technique may capture only a subset of inputs. Furthermore, labeling may exhibit biases toward specific neuronal types and be influenced by experimental variables.24,58,59 To overcome these limitations and achieve a more comprehensive mapping of the intricate input networks within the SS, future studies should integrate multiple retrograde tracers, such as rAAV2-retro and CTB. This multimodal approach will provide a more accurate and detailed representation of the upstream regulatory mechanisms governing S1 and its subregions.
Supplemental Material
sj-pdf-1-mpx-10.1177_17448069251341882 – Supplemental material for Whole-brain input architecture of primary and secondary somatosensory cortices in mice
Supplemental material, sj-pdf-1-mpx-10.1177_17448069251341882 for Whole-brain input architecture of primary and secondary somatosensory cortices in mice by Hailing Yang, Mei Yang and Tonghui Xu in Molecular Pain
Footnotes
Appendix
Acknowledgements
We would like to thank the Natural Science Foundation of Shanghai (22ZR1414500 and 21ZR1407700) for funding support to T.H.X.
Authors’ contributions
H.L.Y. and T.H.X. designed the experiments. H.L.Y. performed experiments and analyzed data. H.L.Y., M.Y., and T.H.X. drafted and revised the manuscript until the final version was completed. All authors read and approved the final manuscript.
Declaration of conflicting interests
The author(s) declared no potential conflicts of interest with respect to the research, authorship, and/or publication of this article.
Funding
The author(s) disclosed receipt of the following financial support for the research, authorship, and/or publication of this article: This work was supported by the Natural Science Foundation of Shanghai (22ZR1414500 and 21ZR1407700).
Supplemental material
Supplemental material for this article is available online.
References
Supplementary Material
Please find the following supplemental material available below.
For Open Access articles published under a Creative Commons License, all supplemental material carries the same license as the article it is associated with.
For non-Open Access articles published, all supplemental material carries a non-exclusive license, and permission requests for re-use of supplemental material or any part of supplemental material shall be sent directly to the copyright owner as specified in the copyright notice associated with the article.