
Abstract
The transmission of nociceptive and pruriceptive signals in the spinal cord is greatly influenced by descending modulation from brain areas such as the rostral ventromedial medulla (RVM). Within the RVM three classes of neurons have been discovered which are relevant to spinal pain modulation, the On, Off, and Neutral cells. These neurons were discovered due to their functional response to nociceptive stimulation. On cells are excited, Off cells are inhibited, and Neutral cells have no response to noxious stimulation. Since these neurons are identified by functional response characteristics it has been difficult to molecularly identify them. In the present study, we leverage our ability to perform optotagging within the RVM to determine whether RVM On, Off, and Neutral cells are GABAergic. We found that 27.27% of RVM On cells, 47.37% of RVM Off cells, and 42.6% of RVM Neutral cells were GABAergic. These results demonstrate that RVM On, Off, and Neutral cells represent a heterogeneous population of neurons and provide a reliable technique for the molecular identification of these neurons.
Introduction
The transmission of nociceptive and pruriceptive signals in the spinal cord is greatly influenced by top-down modulation. Descending circuits from brain areas like the rostral ventromedial medulla (RVM), periaqueductal gray (PAG), locus coeruleus (LC), ventrolateral pons and somatosensory cortex all exert some control over the transmission of these pathways to modulate nociception and itch.1–7 These cortical and brainstem areas are highly interconnected and are thought to underly expectation (nocebo/placebo), diffuse noxious inhibitory control (DNIC) and conditioned pain modulation (CPM).8–11 Descending modulation also underlies stress induced changes in nociceptive threshold.12–14 A major site of descending modulation is the RVM, which contains a significant population of neurons which project to the dorsal spinal cord.15–20
The RVM can bidirectionally influence spinal nociceptive transmission through two functionally characterized classes of cells: RVM On and Off cells. RVM On cells are excited by nociceptive and pruriceptive stimulation with an increase in firing that precedes stimulus-evoked withdrawal responses21–23 and are pronociceptive. RVM On cells express Tacr1,3,24 have been shown to inhibit spinal pruritogen-evoked scratching 3 and are directly inhibited by local administration of opioids. 25 Off cells typically have a higher tonic firing rate and exhibit a pause in firing just prior to withdrawal responses elicited by pruritic or nociceptive stimuli. 21 Off cells provide a tonic suppression of spinal nociception, so the acute pause in Off cell firing during a pinch response is pronociceptive via disinhibition. The pause in Off cell firing is mediated by GABAergic input and these neurons are potently disinhibited following opioid administration.25,26 Previous studies have shown that 1/3 of RVM Off cells express the kappa opioid receptor in the rat 27 and activation of kappa opioid receptor-expressing neurons in the RVM inhibited pruriceptive spinal transmission while nociceptive threshold was increased. 4 A third class of RVM neurons, Neutral cells, do not respond to noxious stimulation. 28
RVM On and Off cells are functionally characterized. Thus, when trying to use traditional methods to molecularly identify these neurons, such as immunostaining or patch-clamp electrophysiology, it is difficult to determine which neurons were On and Off cells. This has greatly hampered the utilization of modern techniques to selectively manipulate these neurons to determine the effects on somatosensory processing.
In the present paper, we leverage our ability to perform optotagging within the RVM to determine whether RVM On and Off cells are GABAergic. We surveyed RVM On, Off and Neutral cells in GABA-cre Channel rhodopsin-2 (ChR2) reporter mice to determine whether they were inhibitory, GABA-expressing, neurons.
Methods
All procedures were approved by Johns Hopkins University and by the University of California, Davis Animal Care and Use Committee. Experiments were performed using F1 mice from characterized homozygous GABA-cre knock-in mice29–31 (Jackson Labs: 028,862) crossed with Channel Rhodopsin (ChR2) knock-in mice (024,109). Adult mice (8–12 weeks) were anesthetized with pentobarbital sodium (60 mg/kg, i.p.). An incision was made from the skull to the cervical vertebrae and the ventral occipital bone was removed to allow microelectrode access to the RVM. The head was then fixed to a stereotaxic frame. The animal’s body temperature was recorded and maintained at 37°C by an external heating pad. Two Teflon coated silver wires were inserted into the biceps femoris to allow measurement of the withdrawal reflex via electromyographic (EMG) activity. A tungsten microelectrode (FHC, ∼5-10 MOhm) was affixed to an optic fiber (200 micron diameter, Thorlabs), with the microelectrode tip extending ∼100 uM from the optic fiber terminal. The optrode was positioned into the RVM and extracellular action potentials were recorded. We looked for RVM On, Off and Neutral cells based upon their firing characteristics to a nociceptive pinch stimulus, delivered to the hind paw via a pair of forceps. RVM On cells exhibit an increase in firing rate following the pinch stimulus which precedes the withdrawal reflex. RVM Off cells exhibit a decrease in firing rate following the pinch stimulus and preceding the withdrawal reflex. Lastly, Neutral cells do not exhibit any change in firing rate in response to the pinch stimulus. During recording, the plane of anesthesia was lightened to allow a light withdrawal reflex to be measured following the pinch stimulus. Spontaneous activity was recorded for at least 1 min prior to stimulation to acquire a baseline firing rate of activity. Following identification of RVM neurons as On, Off, or Neutral optic stimulation was applied through a laser to produce a light output of ∼0.1 mW/mm2. At higher intensity optic stimulation, light induced artifacts were produced, so we titrated the light stimulation for each neuron to ensure the artifact did not conceal the recorded action potential. Following the final recording for each mouse, we produced an electrolytic lesion for histological verification.
Voltages were recorded, amplified, and then digitized with a CED 1401 device. Voltages were analyzed using CED Spike2 software and single unit activity was validated using template matching. Action potentials were reported as firing rate (spikes/s) and peristimulus time histograms were generated with Spike2 software.
To determine if a neuron was light-excited, we used several objective measurements. Firstly, we compared firing rates to see if the neuronal firing rate increased with light stimulation frequency. Next, we checked whether there was a normal distribution of light evoked action potentials in a peristimulus time histogram (PSTH) of latency. For each light pulse in a train (10 ms pulse, 2-10 hz, 10 s train), we calculated the number of action potentials to occur within a 50 ms (1 ms binning) window following the light stimulus onset. Action potentials were summed by their latency bin and plotted as the total number of action potentials elicited for each 1 ms bin. For neurons which were ligh-excited, we expected to see a normal distribution centered around the mean response latency. We determined the efficiency index, which was the number of action potentials elicited in a 20 ms window by an optic stimulus train. Neurons with an efficiency index above 30% were considered entrained and light-excited.
Statistical significance of firing rate and efficiency index were reported using a one-way ANOVA or mixed effects analysis (REML) with Dunnet multi-comparisons test in Prism (version 10.2.3). Differences in efficiency index were calculated using a two way- ANOVA with tukey’s multiple comparisons. For clarity of reporting, we only showed significance in the efficiency index at 2 hz. To compare the population composition of On, Off, and Neutral cells we used a Fishers exact test, corrected for multiple comparisons.
Results
A total of 66 recordings were made (33 On cells, 19 Off cells, and 14 Neutral cells) in GABA-cre+/− ChR2+/− mice. We fixed an optic fiber to our recording electrode so that after we identified a neuron as On, Off, or Neutral we could deliver a blue light (473 nm) stimulus to determine if the recorded neuron was light-excited, and thus a presumptive GABAergic neuron (Figure 1). Experimental Setup. We performed optotagging experiments in male and female vgat cre x Chr2 mice. An optic fiber was coupled with a recording electrode to allow for localized optic stimulation of identified RVM On, Off, and Neutral cells. On, Off, and Neutral cells were identified based upon the response to noxious pinch stimulation delivered to the hindpaw. Withdrawal reflex was measured via electromyogram (EMG) recordings of the biceps femoris.
Following electrophysiological characterization of RVM neurons, a lesion was produced and histologically verified to be located in the RVM (Figure 2), as previously described.3,21 In many experiments, we recorded from >1 RVM neuron, and lesions were produced only at the final recording so as not to disrupt the local RVM activity for subsequent recordings. We did not observe any differences in the distribution of RVM On, Off, and Neutral cells. Histologically recorded On, Off, and Neutral cell recording sites in the rostral ventromedial medulla.
On cells
A total of 33 RVM On cells were identified. Out of those, 27.27% were considered light sensitive and thus GABAergic (Figure 3(a) and (e)). RVM On cells had a baseline firing rate of 3.810 +/− 3.762 spikes/s which increased to 9.124 +/− 9.171 spikes/s following a nociceptive pinch stimulus to the hind paw (averaged from Figure 3(b)). Optotagging RVM On cells. RVM On cells were identified by an increase in firing in response to a noxious pinch stimulus, which preceded the withdrawal reflex (A, left). Then optic stimulation was applied (A, right). Firing rate (spikes/s) were measured for baseline, pinch response, and optic stimulation at: 2 hz, 5 hz, 10 hz for On cells classified as excited, inhibited, and non-responsive (b). The efficiency index was calculated for each class of response and plotted by optic stimulation frequency (c). Peristimulus time histograms (PSTH, bin width = 1 ms, 50 ms post optic stimulation event at 2 hz) were generated for excited, inhibited and nonresponsive On cells (d). The population of excited, inhibited, and nonresponsive RVM On cells (e). Firing rate data analyzed with a one-way ANOVA or mixed effects analysis (REML). Efficiency index was analyzed with two-way ANOVA and Tukey’s posthoc test. *p < 0.05, **p < 0.01, ***p < 0.001, ****p < 0.0001.
An individual example of a light-excited RVM On cell is shown in Figure 3(a). RVM On cells classified as light -excited had a baseline firing rate of 1.476 +/− 2.100 which increased to 3.514 +/− 3.210 spikes/s during pinch stimulation (p = 0.0174, Figure 3(b)). The firing rate of these neurons increased with light stimulation frequency, responding maximally with a firing rate of 3.478 spikes/s at 2 hz optic stimulation (p < 0.001, Figure 3(c)). The efficiency index at 2 hz optic stimulation was 0.744 +/− 0.214. In a peristimulus-time histogram (PSTH) showing the latency of On cell responses stratified by the response category to optic stimulation (Figure 3(d)), the mean peak latency was 9.386 ms after the onset of optic stimulation. This latency is consistent with our previous report of RVM ON cells. 3
Of the recorded RVM On cells, 18.18% were inhibited by optic stimulation. These neurons typically had a higher baseline firing rate, 8.150 +/−5.433 spikes/s (p = 0.0013 compared to excited baseline) which increased to 19.707 +/− 12.099 spikes/s during pinch stimulation (p = 0.0425). During optic stimulation at 2 hz these neurons fired at a rate of 2.8 spikes/second, and during 5 hz stimulation fired at 1.395 spikes/second (Figure 3(b)). The efficiency index of these neurons was 0.108 +/− 0.092 spikes/s at 2 hz optic stimulation, significantly lower than excited cells (p = 0.025, Figure 3(c)).
Most RVM On cells did not display any observable response to optic stimulation (54.6%). These neurons had a baseline firing rate of 1.805 +/− 2.748 spikes/s and increased to 4.104 +/− 4.103 spikes/s during pinch stimulation (p = 0.0004, Figure 3(b)). The efficiency index of these neurons was 0.036 +/− 0.064 at 2 hz optic stimulation, significantly lower than excited cells (p < 0.0001, Figure 3(c)).
Off cells
A total of 19 RVM Off cells was identified. An example is shown in Figure 4(a). 47.37% were classified as excited by optic stimulation, while the remainder, 52.63% were classified as inhibited (Figure 4(a) and (e)). Interestingly, we did not find any RVM Off cells that were unresponsive to light stimulation. RVM Off cells had a relatively high baseline firing rate (7.329 +/− 0.708 spikes/s), which decreased to 2.541 +/− 0.819 spikes/s following a pinch stimulus. Optotagging RVM Off cells. RVM Off cells were identified by a decrease in firing in response to a noxious pinch stimulus, which preceded the withdrawal reflex (A, left). Then optic stimulation was applied (A, right). Firing rate (spikes/s) were measured for baseline, pinch response, and optic stimulation at: 2 hz, 5 hz, 10 hz for Off cells classified as excited, inhibited, and non-responsive (b). The efficiency index was calculated for each class of response and plotted by optic stimulation frequency (c). Peristimulus time histograms (PSTH, bin width = 1 ms, 50 ms post optic stimulation event at 2 hz) were generated for excited, inhibited, and nonresponsive Off cells (d). Firing rate data analyzed with a one-way ANOVA or mixed effects analysis (REML). Efficiency index was analyzed with two-way ANOVA and Tukey’s posthoc test. *p < 0.05, **p < 0.01, ***p < 0.001, ****p < 0.0001.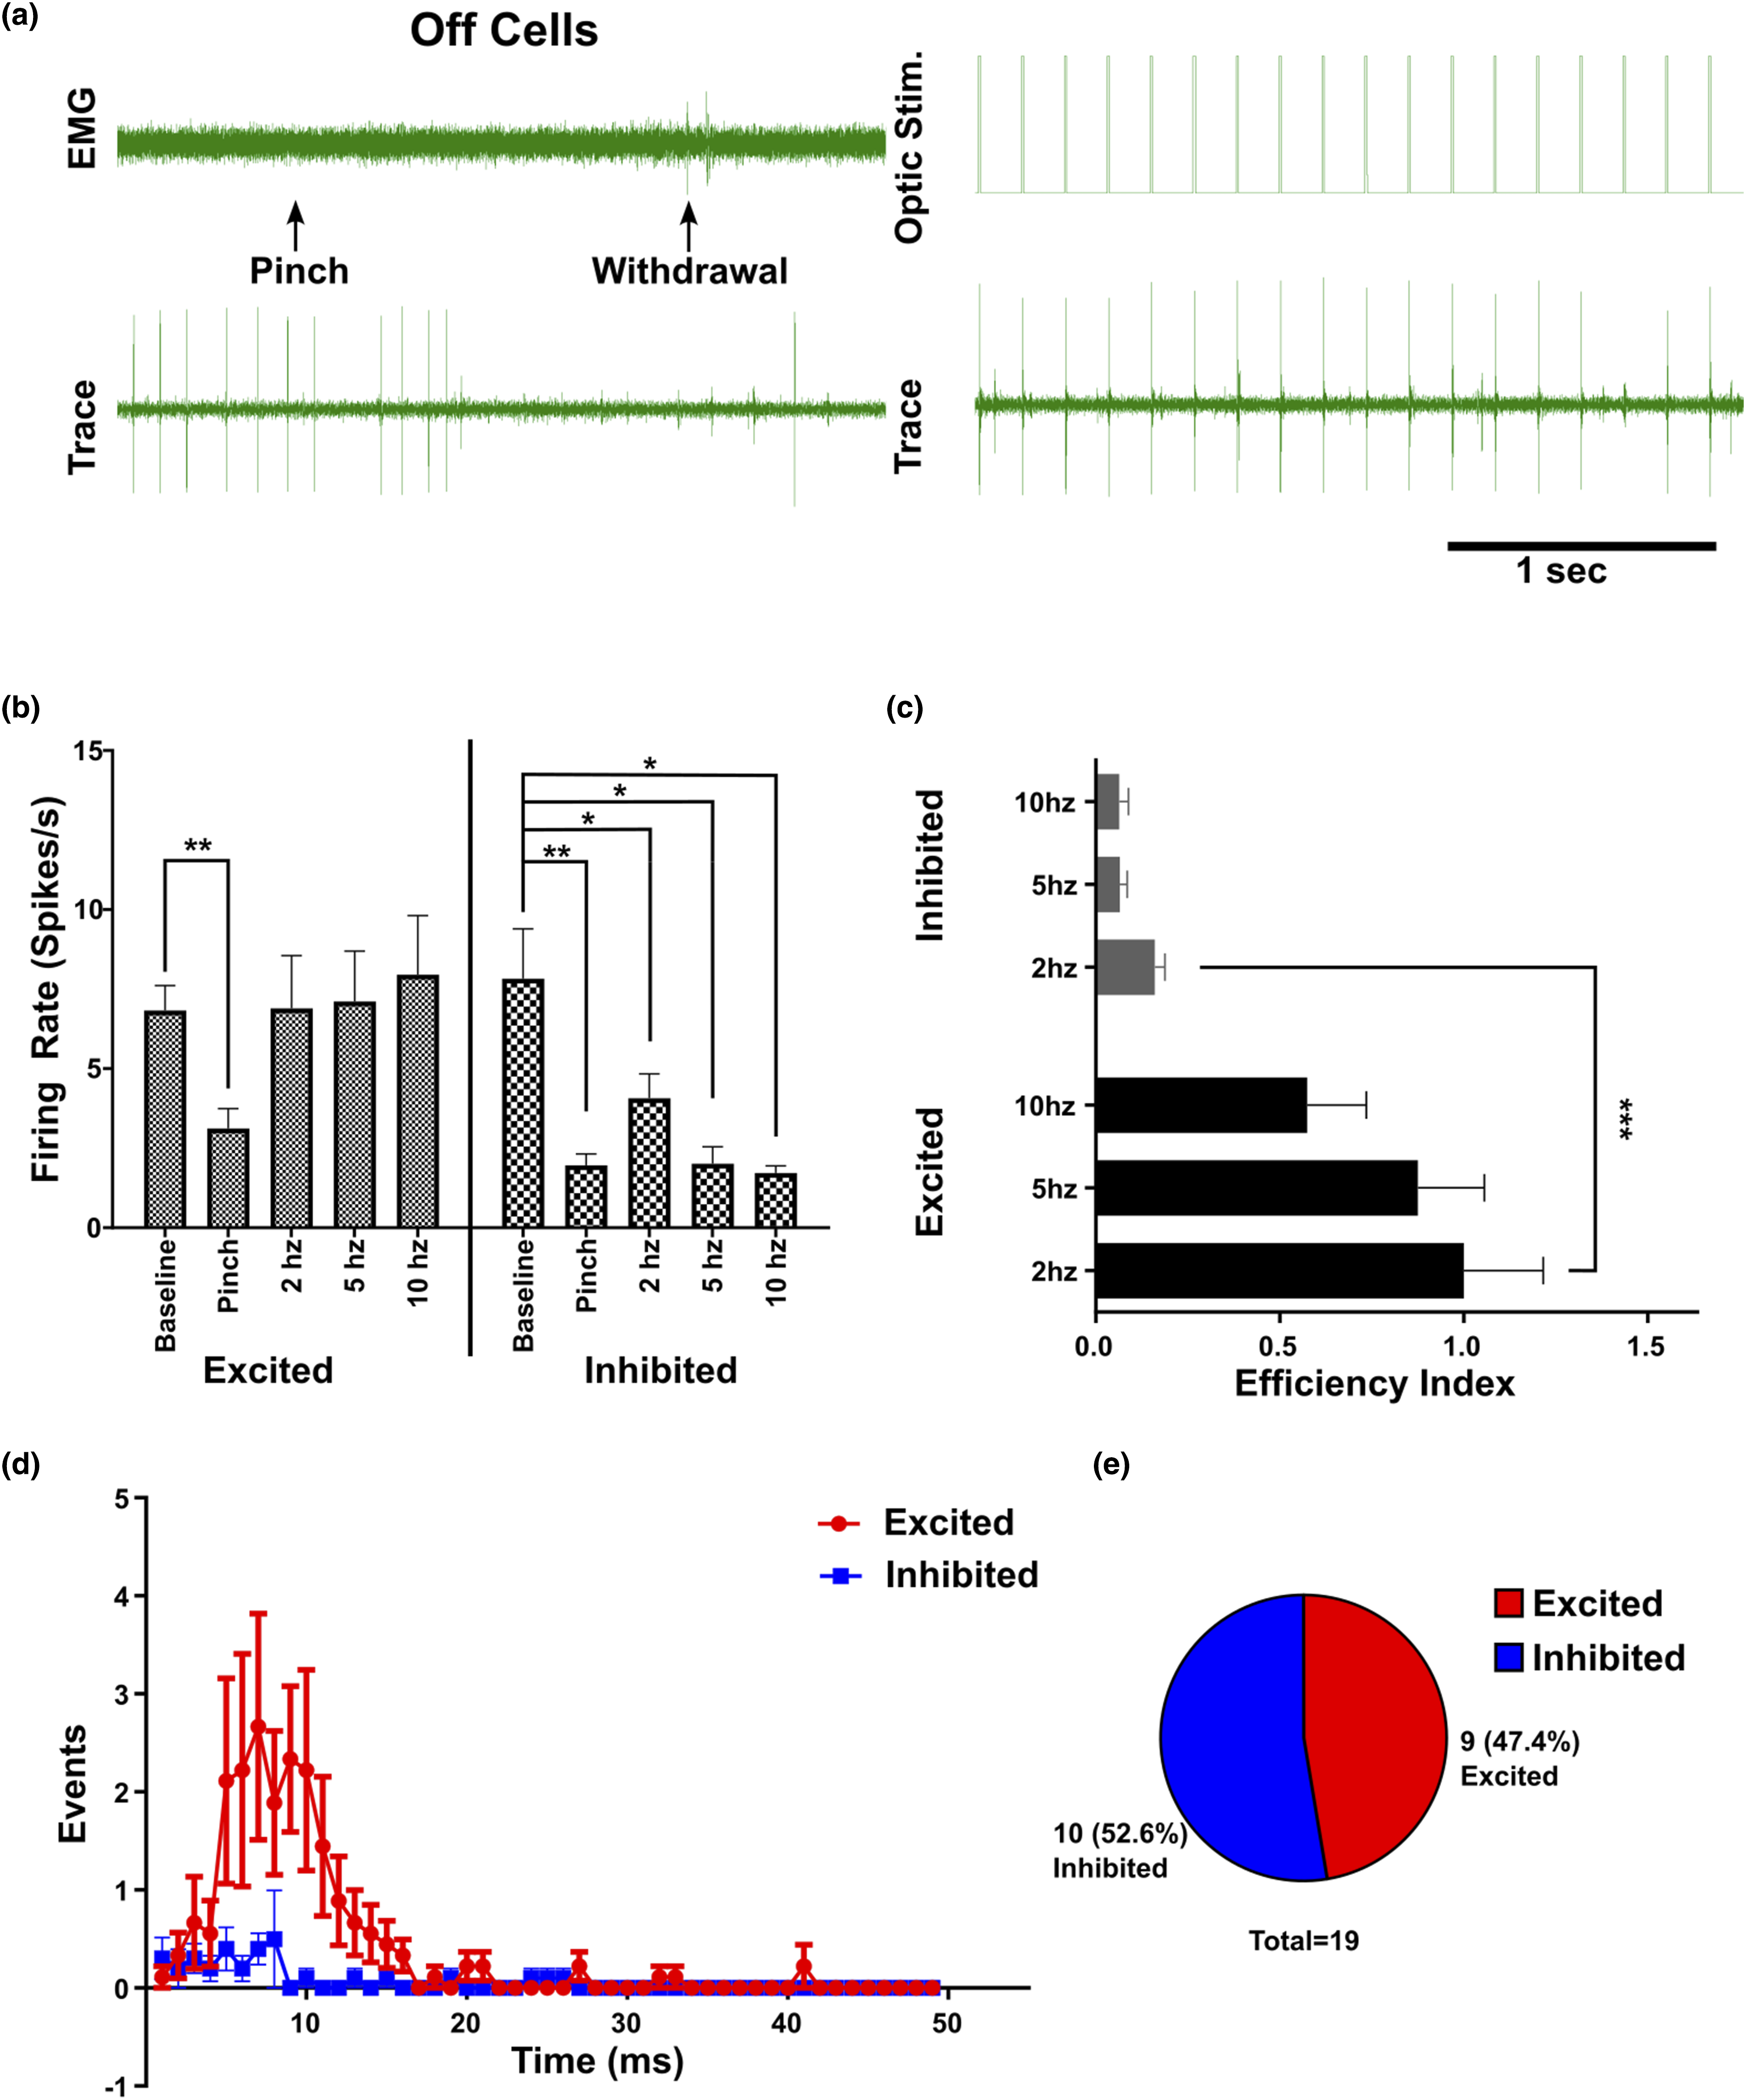
Off cells which were categorized as light-excited exhibited a significant decrease in firing rate following pinch stimulation (p = 0.001) and a slight non-significant increase in firing rate during optic stimulation (6.899 +/− 4.973 spikes/s at 2 hz, 7.113 +/− 4.755 spikes/s at 5 hz, and 7.955 +/− 4.919 spikes/s at 10 hz). These neurons exhibited a peak efficiency index of 1 +/− 0.649, at 2 hz optic stimulation (Figure 4(c)). The average action potential latency following light onset was 7.925 ms (Figure 4(d)).
For Off cells that were categorized as inhibited, the average baseline was 7.829 +/− 4.951 spikes/s, which decreased to 1.962 +/− 1.143 spikes/s following the noxious pinch stimulus (p = 0.0065). During optic stimulation the firing rate of these neurons decreased relative to stimulus frequency, with the lowest firing rate 1.724 +/− 0.542 spikes/s at 10 hz stimulation (p = 0.0219). As expected, these neurons had a low efficiency index (0.160 +/− 0.088 at 2 hz, p = 0.0001), which decreased as stimulation frequency increased (Figure 4(c)).
Neutral cells
A total of 14 RVM Neutral cells were identified (Figure 5(e)). RVM Neutral cells had a baseline firing rate of 6.228 +/− 2.069 spikes/s and an average of 6.505 +/− 2.454 spikes/s following a nociceptive pinch stimulus to the hind paw (Figure 5(b)). Optotagging RVM Neutral cells. RVM Neutral cells were identified by the observation that there was no significant change in firing in response to a noxious pinch stimulus, which preceded the withdrawal reflex (A, left). Then optic stimulation was applied (A, right). Firing rate (spikes/s) were measured for baseline, pinch response, and optic stimulation at: 2 hz, 5 hz, 10 hz for Neutral cells classified as excited, inhibited and non-responsive (b). The efficiency index was calculated for each class of response and plotted by optic stimulation frequency (c). Peristimulus time histograms (PSTH, bin width = 1 ms, 50 ms post optic stimulation event at 2 hz) were generated for excited, inhibited, and nonresponsive Neutral cells (d). Firing rate data analyzed with a one-way ANOVA or mixed effects analysis (REML). Efficiency index was analyzed with two-way ANOVA and Tukey’s posthoc test. *p < 0.05, **p < 0.01, ***p < 0.001, ****p < 0.0001.
Of the recorded RVM Neutral cells, 42.6% were classified as light-excited. An example is shown in Figure 5(a). RVM Neutral cells had a baseline firing rate of 7.799 +/− 6.215 spikes/s. During the pinch stimulus the firing rate was 7.662 +/− 6.348 spikes/s (p > 0.9932). The peak firing rate during optic stimulation was 9.764 +/− 2.572 spikes/s at 10 hz optic stimulation (non-significant: p = 0.8201, Figure 5(b)). These neurons had a peak efficiency index of 0.875 +/− 0.436 at 2 hz optic stimulation (Figure 5(c)), consistent with our previous data (not shown), showing peak efficiency at 2 hz. Light -excited RVM Neutral cells had a response latency of 7.301 ms following onset of optic stimulation (Figure 5(d)).
RVM Neutral cells classified as inhibited (21.43%) had a baseline firing rate of 7+/− 6.215 spikes/s and during pinch stimulation the firing rate was 8.167 +/− 6.311 spikes/s. These neurons were only tested at 2 hz optic stimulation and had a mean firing rate of 0.9 +/− 0.608 spikes/s (non-significant: p = 0.341, Figure 5(b)). These neurons had an efficiency index of 0.017 +/− 0.029 at 2 hz topic stimulation, significantly lower than excited Neutral cells (p = 0.0064, Figure 5(c)).
Neutral cells which were classified as having no response to optic stimulation (34.71%) had a baseline firing rate of 3.883 +/− 5.057 spikes/s and a firing rate of 3.686 +/− 4.842 spikes/s during pinch stimulation. These neurons had a firing rate of 4.180 +/− 4.901 spikes/s and 4.925 +/− 5.679 spikes/s at 2 and 5 hz optic stimulation, respectively (Figure 5(b)). These neurons had a efficiency index of 0.12 +/− 0.168 at 2 hz optic stimulation (p = 0.005, compared with excited cells) and 0.098 +/− 0.114 at 5 hz optic stimulation (Figure 5(c)).
Overall, the population of excited (GABAergic), inhibited (GABAergic input), and nonresponsive cells were significantly different between: Off cells and On cells (p = 0.003), Off cells and Neutral cells (p = 0.029), but not On and Neutral cells (p = 0.169). The population of Off cells did not include any cells that were unresponsive to light, indicating a stronger GABAergic input. Off cells also had the highest proportion of GABAergic neurons (47.3%), compared to On cells (27.3%) and Neutral cells (42.9%).
Discussion
Whether On and Off cells are GABAergic or glutamatergic has been a long-standing question in the field. Several studies have shown that GABA is expressed in RVM neurons, including those which project to the spinal cord.15,32–35 Through use of optotagging, we were able to definitively survey RVM On, Off and Neutral cells to determine whether these neuronal populations are comprised of GABAergic neurons.
The lowest proportion of RVM neurons excited by optic stimulation, and thus presumably GABAergic, were On cells (27.3%). We have previously shown that On cells may have inhibitory input onto Off cells, 3 so the GABAergic population of On cells may include those which functionally inhibit Off cells. We also observed that a somewhat smaller population of On cells was inhibited by optic stimulation. This inhibitory response is likely mediated by local stimulation of GABAergic neurons, including axonal terminals onto On cells. We noticed that the baseline firing rate of the inhibited On cells was much higher than those that were excited or unresponsive. Given the higher baseline activity of these neurons overall, it follows that perhaps they have stronger GABAergic inhibitory input governing overactivity. The mu opioid receptor (MOR) is expressed in RVM On cells. 25 Recently a report showed that G-protein coupled estrogen receptor (GPER) coexpressed with MOR, and that 20% of all MOR neurons expressed GPER. 7 The RVM GPER positive neurons were GABAergic. Speculatively, the 27% GABAergic population of RVM On cells we observe here may represent the GPER positive population.
We observed a much higher percentage of light sensitive (presumably GABAergic) Off cells (47.4%) compared with On cells (27.27%). Interestingly, for all Off cells which were not excited by optic stimulation, they were always inhibited by optic stimulation. This is consistent with previous reports demonstrating clear GABAergic input onto RVM Off cells. 26 In our conditions, it is likely that the ChR2 activation by optic stimulation had to overcome GABAergic inhibition from presynaptic neurons to drive firing of RVM Off cells. This might explain the dip immediately following the peak in our PSTH for light sensitive Off cells, occurring at ∼10 ms post onset of optic stimulation (Figure 4(d)). Furthermore, the optogenetic inhibition of Off cells implies that there may have been RVM Off cells which were not considered light-excited due to presynaptic GABAergic inhibition which may mask light-evoked excitation and thus the population of RVM GABAergic Off cells may be higher than what we observed in this study.
Of the recorded Neutral cells, 42.9% responded to optic stimulation and were presumably GABAergic, 21.4% were inhibited, and 35.7% were unresponsive. This indicates that the majority of Neutral cells are non- GABAergic, with a smaller population (21.4%) receiving inhibitory input. Neutral cells likely comprise a diverse population of neurons within the RVM (anything which doesn’t respond acutely to nociceptive stimuli).
The average latencies for the GABAergic On, Off, and Neutral cells were measured by fitting the gaussian distribution of the PSTH. We found that the response latencies for On, Off, and Neutral cells ranged from 7.301 ms to 9.386 ms. This is consistent with our previous findings that optogenetic activation of Tacr1-expressing RVM On cells evoked action potentials with a latency of 8.14 ms. Another study found that optogenetic activation of hippocampal neurons evoked action potentials with a similar latency. 36
Measurement of efficiency index was the strongest indicator of light sensitivity. When we tested for changes in firing rate, often there is not an overall significant increase due to variability in baseline firing rate. However, more precisely calculating the frequency of action potential occurrence immediately following the optic stimulation led to a much stronger outcome in the analysis of light entrainment by RVM neurons.
In another study, optogenetic activation of spinally projecting RVM GABAergic neurons resulted in a slight nociceptive facilitation, indicative of RVM On cell activation. 19 Given our results, it is possible that there were opposing effects from RVM On and Off cell activation.
Previously, the best evidence of GABA expression in RVM On and Off cells came from labeling experiments, wherein RVM On and Off cells were identified by extracellular in vivo electrophysiology recordings and labeled with biotinamide through juxta-cellular electrode. 37 Labeled neurons were counterstained for GAD67, a marker for GABA synthesis. They found that 13% of On, 93% of Off, and 80% of Neutral cells labeled positively. However, it is difficult to verify whether only the juxta-cellularly recorded neuron was labeled. Our results using optotagging demonstrate a slightly more balanced population of Gaba expression in RVM On and Off cells.
Footnotes
Declaration of conflicting interests
The author(s) declared no potential conflicts of interest with respect to the research, authorship, and/or publication of this article.
Funding
The author(s) disclosed receipt of the following financial support for the research, authorship, and/or publication of this article: This work was supported by the Howard Hughes Medical Institute (X. Dong) and the NIH R01ARO76434-04 (E. Carstens) T32NS070201 (T. Follansbee).