
Abstract
Methylglyoxal (MGO), a highly reactive dicarbonyl metabolite of glucose primarily formed during the glycolytic pathway, is a precursor of advanced glycation end-products (AGEs). Recently, numerous studies have shown that MGO accumulation can cause pain and hyperalgesia. However, the mechanism through which MGO induces pain in the spinal dorsal horn remains unclear. The present study investigated the effect of MGO on spontaneous excitatory postsynaptic currents (sEPSC) in rat spinal dorsal horn neurons using blind whole-cell patch-clamp recording. Perfusion of MGO increased the frequency and amplitude of sEPSC in spinal horn neurons in a concentration-dependent manner. Additionally, MGO administration increased the number of miniature EPSC (mEPSC) in the presence of tetrodotoxin, a sodium channel blocker. However, 6-cyano-7-nitroqiunocaline-2,3-dione (CNQX), an AMPA/kainate receptor antagonist, blocked the enhancement of sEPSC by MGO. HC-030031, a TRP ankyrin-1 (TRPA1) antagonist, and capsazepine, a TRP vanilloid-1 (TRPV1) antagonist, inhibited the action of MGO. Notably, the effects of MGO were completely inhibited by HC-030031 and capsazepine. MGO generates reactive oxygen species (ROS) via AGEs. ROS also potentially induce pain via TRPA1 and TRPV1 in the spinal dorsal horn. Furthermore, we examined the effect of MGO in the presence of N-tert-butyl-α-phenylnitrone (PBN), a non-selective ROS scavenger, and found that the effect of MGO was completely inhibited. These results suggest that MGO increases spontaneous glutamate release from the presynaptic terminal to spinal dorsal horn neurons through TRPA1, TRPV1, and ROS and could enhance excitatory synaptic transmission.
Keywords
Introduction
Glycation is the non-enzymatic reaction of reducing sugars and associated metabolites with proteins and amino acids to form harmful compounds called advanced glycation end-products (AGEs). 1 The durations of hyperglycemia and protein turnover dictate the rate of AGE formation. 2 AGEs accumulate in various tissues and are involved in the development of various diseases associated with aging and diabetes mellitus.3,4 Recently, methylglyoxal (MGO), a byproduct of glycation, has been found to be associated with various diseases. Plasma MGO in patients with type 1 diabetes is five to six times higher than that in healthy individuals, and in patients with type 2 diabetes, it is two to three times higher.5,6 There was a correlation between serum MGO levels and cognitive decline. 7 MGO is also associated with the development of uremic sarcopenia in patients with chronic kidney disease. In addition, MGO alters metabolic flow in myoblast cells, generates reactive oxygen species (ROS), damages mitochondria, and produces inflammatory cytokines such as IL-6, leading to uremic sarcopenia development. 8 Furthermore, MGO reportedly induces pain.9–11
MGO is involved in the development of painful diabetic neuropathy. The plasma concentration of MGO is significantly higher in patients with type 2 diabetes with pain than in patients with type 2 diabetes without pain or healthy controls. 10 Elevated concentrations of MGO in the cerebrospinal fluid excite spinal dorsal horn neurons, in turn causing allodynia and central sensitization. 12 Thermal hyperalgesia and mechanical hyperalgesia reportedly occurred when an inhibitor of Glyoxalase-1 (GLO-1) that degrades MGO was administered for 2 weeks. 9 Transient receptor potential (TRP) channels and specific voltage-gated sodium channels participate in the mechanism by which MGO induces pain and hyperalgesia. In neurons, TRP channels contribute to the generation of action potentials by inducing depolarization. 13 TRP ankyrin-1 (TRPA1), TRP vanilloid-1 (TRPV1), and TRP melastatin-8 (TRPM8) are expressed at the central terminal of the dorsal root ganglion (DRG) and are involved in nociceptive transmission. 14 These TRP channels are produced in the cell body of DRG neurons and then transported to the central and peripheral terminals of neurons. 14 MGO is thought to enhance pain via TRPA1.9,15 Conversely, MGO has been reported to mediate diabetic neuropathy by activating Nav1.8, a voltage-gated sodium channel located on primary afferent sensory neurons. 16
However, the pain mechanism of MGO in spinal dorsal horn neurons remains unclear. Therefore, we investigated the mechanism of action of MGO in spinal dorsal horn neurons using whole-cell patch-clamp recordings. The findings of the present study could facilitate the development of novel therapeutic agents for pain.
Materials and methods
All experimental protocols, including animal care, were approved by the Ethics Committee on Animal Experiments of Wakayama Medical University prior to animal use (permit no. 1087).
Spinal cord preparation
Male adult Sprague-Dawley rats (5−6 weeks of age, 170−200 g) were deeply anesthetized with urethane (1.2 g/kg, IP), and then the lumbosacral spinal cord from L1 to S3 was removed and preserved in preoxygenated Krebs solution at 1–3°C. Shortly thereafter, the rats were sacrificed using a lethal dose of urethane. After removing the pia and arachnoid membranes, the spinal cord was sliced using a micro slicer to a thickness of 650 μm. The slice was placed in a recording chamber and perfused with a Krebs solution containing 95% O2 and 5% CO2 at a rate of 5−7 mL/min. The temperature of the Krebs solution was maintained at 36 ± 1°C. The composition of the Krebs solution was as follows: 117 mM NaCl, 3.6 mM KCl, 2.5 mM CaCl2, 1.2 mM MgCl2, 1.2 mM NaH2PO4, 25 mM NaHCO3, and 11 mM glucose at a pH of 7.4.
Patch clamp recording
Blind whole-cell patch-clamp recordings were performed as described previously. 17 Recordings were made from substantia gelatinosa (SG) neurons using patch-pipette electrodes with a resistance of 5−10 MΩ. The composition of the patch pipette solution used to record spontaneous excitatory postsynaptic currents (sEPSC) was as follows: 135 mM K-gluconate, 5 mM KCl, 0.5 mM CaCl2, 2 mM MgCl2, 5 mM EGTA, 5 mM HEPES, and 5 mM ATP-Mg at pH-7.2. Membrane potentials were maintained at −70 mV in the voltage-clamp mode. Signals were acquired using a patch-clamp amplifier (Axopatch 200 B; Molecular Devices). The data were digitized using an analog-to-digital converter (Digidata 1440A; Molecular Devices) and stored on a personal computer using the pCLAMP 10 data acquisition program (Molecular Devices). The data were analyzed using the Mini Analysis software (version 6.0; Synaptosoft, Fort Lee, NJ, USA) and the pCLAMP 10 data acquisition program.
Application of drugs
Drugs dissolved in Krebs solution were perfused at a consistent flow rate (5−7 mL/min) and temperature (36 ± 1°C). It took about 30 s for the solution to perfuse and reach the slice surface. The drugs used in the present study were MGO (Sigma-Aldrich), TTX (FUJIFILM Wako Pure Chemical Corporation), CNQX (FUJIFILM Wako Pure Chemical Corporation), ruthenium red (Sigma-Aldrich), HC-030031 (Sigma-Aldrich), capsazepine (FUJIFILM Wako Pure Chemical Corporation), AMTB (Sigma-Aldrich), PBN (Sigma-Aldrich). In the experiment, MGO was perfused for 5 min and changes in the frequency and amplitude of sEPSC/miniature EPSC (mEPSC) were observed; the frequency and amplitude of sEPSC/mEPSC for 60 s before the start of MGO administration were used as controls and compared with the frequency and amplitude of sEPSC/mEPSC after MGO administration. Perfusion of the antagonists was initiated 5 min before MGO administration and was terminated simultaneously with MGO administration termination.
Statistical analysis
All numerical data are expressed as the mean ± standard error of the mean (SEM). The paired Student’s test was used to determine the statistically significant differences between means, and the Kolmogorov-Smirnov test was used to compare cumulative distributions of EPSC parameters in the absence and presence of the test drugs. p < .05 was considered significant. In electrophysiological data, n refers to the number of neurons studied. Based on a previous study, 18 cells were deemed responsive to the testing compounds when there was a >20% increase in EPSC frequency.
Results
MGO administration enhances excitatory synaptic transmission in spinal dorsal horn neurons
We examined the effects of MGO on spinal dorsal horn neurons. Perfusion with MGO 10 mM for 5 min increased the frequency and amplitude of sEPSC and resulted in an inward current (Figure 1(a)). MGO shifted the cumulative probability of the interevent interval to the left, indicating that MGO increased the frequency of sEPSC. In addition, MGO shifted the cumulative probability of the amplitude to the right, consistent with an increase in sEPSC amplitude (Figure 1(b)). The mean frequency and amplitude of sEPSC before application of MGO were 4.4 ± 0.8 Hz (range; 2.1−7.6 Hz) and 6.9 ± 0.4 pA (range; 4.8−8.6 pA), respectively, whereas the mean frequency and amplitude of sEPSC after application of MGO were 21.2 ± 3.5 Hz (range; 4.1−35.4 Hz) and 7.7 ± 0.5 pA (range; 6.4−10.9 pA) (n = 10), respectively (Figure 1(c)). Nine neurons responded to MGO administration (90% positivity ratio). The increase rates of the frequency and amplitude after administration of MGO were 551.5 % and 112.9 %, respectively. Subsequently, we examined the concentration dependence of MGO. Three concentrations of MGO (1 mM, 5 mM, and 10 mM) were perfused to examine the increased rates of the frequency and amplitude of sEPSC (all groups; n = 10) (Figure 2(a)). The increased rates of frequency of the 1 mM, 5 mM, and 10 mM groups were 206.5 ± 36.9%, 204.3 ± 48.5%, and 551.5 ± 150.7%, respectively, which were all significant (Figure 2(b)); conversely, the mean increase rates of amplitude were 100.5 ± 9.0, 106.2 ± 4.5%, and 112.9 ± 4.7%, respectively, with significant differences observed only at 10 mM (Figure 2(b)). The concentration of MGO was fixed at 10 mM in subsequent experiments. Subsequently, repeated doses of MGO were administered, and desensitization was examined (Figure 2(c)). The relative frequency and relative amplitude associated with MGO administration were compared between the first and second doses. The relative frequency was 240.0 ± 65.1% for the first dose and 310.4 ± 48.4% for the second dose, and no significant difference was observed. For relative amplitude, the first dose was 111.9 ± 6.5% and the second dose was 115.7 ± 6.2%; no significant difference was observed between the treatments (Figure 2(d)). Effect of MGO on excitatory synaptic transmission in spinal dorsal horn neurons. (a) A typical trace showing glutamatergic sEPSC before and during the application of MGO (10 mM). Black bar above the trace showing perfusion time of MGO (5 min). Three consecutive traces of sEPSC shown in the end of arrow are showing an expanded scale in time, before (lower left) and during the application of MGO (lower right). In the voltage clamp mode (V = −70 mV), MGO increased the frequency and amplitude of sEPSC markedly. (b) Cumulative probability of the inter-event interval (left) and amplitude (right) of glutamatergic sEPSC before (dotted line) and during (continuous line) application of MGO. MG shortened the inter-event interval and made the amplitude larger. A and B data were obtained from the same neuron. (c) MGO (10 mM)-induced changes in frequency (left) and amplitude (right) of sEPSC. Each column presents the mean and SEM from 10 experiments. Statistically significant differences between data are shown by bars and indicated by an asterisk; *p < .05; NS: not significant. The dots on the mean bar graph are plots of individual data. Concentration dependence of the effect of MGO on the spinal dorsal horn. (1 mM; n = 10, 5 mM; n = 10, 10 mM; n = 10) (a) Typical trace of each concentration of MGO is shown. Left side shows the results obtained before MGO administration, and right side shows the results obtained after MGO administration. (b) Summary of the increase in frequency (left) and amplitude (right) of sEPSC at each MGO concentration when compared with before MGO administration. Statistically significant differences between data are shown by bars are indicated by an asterisk; *p < .05; NS: not significant. (c) A typical trace of repeated administration of MGO is shown (n = 5). Black bar above the trace showing perfusion time of MGO (5 min). (d) Comparison of changes in sEPSC between the first and second MGO administration. Relative frequency and amplitude of sEPSC compared to those before MGO administration. Each column presents the mean and SEM from five experiments. The dots on the mean bar graph are plots of individual data.

Analysis of presynaptic effect of MGO in spinal dorsal horn neurons
The effects of MGO on the synapses between SG neurons and primary afferent sensory neurons were examined. TTX, a voltage-gated Na+ channel blocker, inhibits axonal conduction and allows the observation of mEPSC. In the presence of 1 μM TTX, the mean frequency and amplitude of mEPSC were 8.4 ± 1.5 Hz (range; 5.5−16.4 Hz) and 7.4 ± 0.2 pA (range; 6.4−8.5 pA), respectively, before MGO administration; these were significantly increased to 28.5 ± 5.5 Hz (range; 6.7−56.1 Hz) and 8.8 ± 0.6 pA, respectively, (range; 6.6−12.9 pA) (p < .05) after MGO administration (n = 9) (Figure 3(a) and (b)). The increase in frequency and amplitude rates after MGO administration in the presence of TTX was 352.6% and 118.3%, respectively. Subsequently, the effects of MGO under the inhibition of AMPA/kainate receptors, which primarily act as glutamate receptors at VH = −70 mV, were examined to determine whether MGO-induced excitability was a glutamate-dependent response. In the presence of CNQX 20 μM (as an AMPA/kainate receptor antagonist), no sEPSC were observed during MGO application (n = 5) (Figure 3(c)). Therefore, the action of MGO is glutamate dependent. The results indicate that MGO increases the excitability of SG neurons by acting on pre-synapses and increasing glutamate release, which enhances excitatory synaptic transmission. MGO acts on presynaptic terminals of synapses formed by primary afferents and SG neurons in the spinal dorsal horn and promotes glutamate release. (a) Effect of MGO (10 mM) on miniature EPSC (mEPSC) in the presence of tetrodotoxin (TTX; 1 μM), voltage-gated Na+ channel blocker. A continuous chart recording glutamatergic mEPSC before and after perfusion of TTX and MGO. Black bars above the chart showing perfusion time for TTX (top; 10 min) and MGO (bottom; 5 min). Three consecutive traces of mEPSC shown at the end of arrow are showing an expanded scale in time, before (lower left) and during the application of MGO (lower right). (b) Summary of the effect of MGO on mEPSC frequency (left) and amplitude (right) in the presence of TTX. Each column presents the mean and SEM from nine experiments. Statistically significant differences between data are shown by bars and indicated by an asterisk; *p < .05; NS: not significant. The dots on the mean bar graph are plots of individual data. (c) Typical trace representing the effect of MGO (10 mM) in the presence of 6-cyano-7-nitroquinoxaline-2,3-dione (CNQX; n = 5). Black bars above the chart showing perfusion time for CNQX (top; 10 min) and MGO (bottom; 5 min).
TRPA1 and TRPV1 responsible for the MGO-induced increase in spontaneous glutamate release
We investigated whether TRP channels were associated with MGO reactivity in the spinal dorsal horn. In the presence of 300 μM ruthenium red, a non-selective antagonist of TRP channels, the increase in the frequency and amplitude of sEPSC associated with MGO was suppressed completely (n = 10) (Figure 4(a)). The mean frequency and amplitude of sEPSC before perfusion of MGO were 3.7 ± 0.6 Hz (range; 1.0−6.5 Hz) and 6.6 ± 0.4 pA (range; 5.6−9.4 pA), respectively, while those after perfusion of MGO were 3.2 ± 0.6 Hz (range; 1.1−6.0 Hz) and 6.6 ± 0.3 pA (range; 5.5–8.9 pA), respectively, with no significant differences (Figure 4(b)). The rates of increase in frequency and amplitude after MGO administration in the presence of ruthenium red were 92.2 % and 99.4 %, respectively. Effect of MGO on excitatory synaptic transmission in the presence of ruthenium red, non-selective antagonist of TRP channels. (a) A typical trace showing glutamatergic sEPSC before and during the application of MGO (10 mM) in the presence of ruthenium red (300 μM). Black bars above the chart showing perfusion time for ruthenium red (top; 10 min) and MGO (bottom; 5 min). Three consecutive traces of sEPSC shown in the end of the arrow are showing an expanded scale in time, before (lower left) and during the application of MGO (lower right) in the presence of ruthenium red. (b) Summary of the effect of MGO on sEPSC frequency (left) and amplitude (right) in the presence of ruthenium red. Each column presents the mean and SEM from 10 experiments. Statistically significant differences between data are shown by bars and indicated by an asterisk; *p < .05; NS: not significant. The dots on the mean bar graph are plots of individual data.
Subsequently, the effects of MGO in the presence of HC030031 50 μM, a selective TRPA1 antagonist, were examined (Figure 5(a)). The mean frequency and amplitude of sEPSC before MGO administration were 9.5 ± 2.8 Hz (range; 2.2−29.1 Hz) and 7.0 ± 0.3 pA (range; 5.7−8.2 pA), respectively, and 14.9 ± 4.9 Hz (range; 2.5−49.3 Hz) and 7.0 ± 0.2 pA (range; 5.8−7.8 pA), respectively, after MGO administration (n = 9) (Figure 5(b)). There were no significant differences in the frequency or amplitude of sEPSC before and after perfusion with MGO. The rates of increase in frequency and amplitude after MGO administration in the presence of HC030031 were 180.6 % and 102.5 %, respectively. The results suggest that TRPA1 participates in MGO reactivity in the spinal dorsal horn. However, the increased frequency was not suppressed completely in the presence of HC030031. Effect of MGO on excitatory synaptic transmission in the presence of HC030031, selective antagonist of TRPA1. (a) A typical trace showing glutamatergic sEPSC before and during the application of MGO (10 mM) in the presence of HC030031 (50 μM). Black bars above the chart showing perfusion time for HC030031 (top; 10 min) and MGO (bottom; 5 min). Three consecutive traces of sEPSC shown at the end of the arrow are showing an expanded scale in time, before (lower left) and during the application of MGO (lower right) in the presence of HC030031. (b) Summary of the effect of MGO on sEPSC frequency (left) and amplitude (right) in the presence of HC030031. Each column presents the mean and SEM from nine experiments. Statistically significant differences between data are shown by bars and indicated by an asterisk; *p < .05; NS: not significant. The dots on the mean bar graph are plots of individual data.
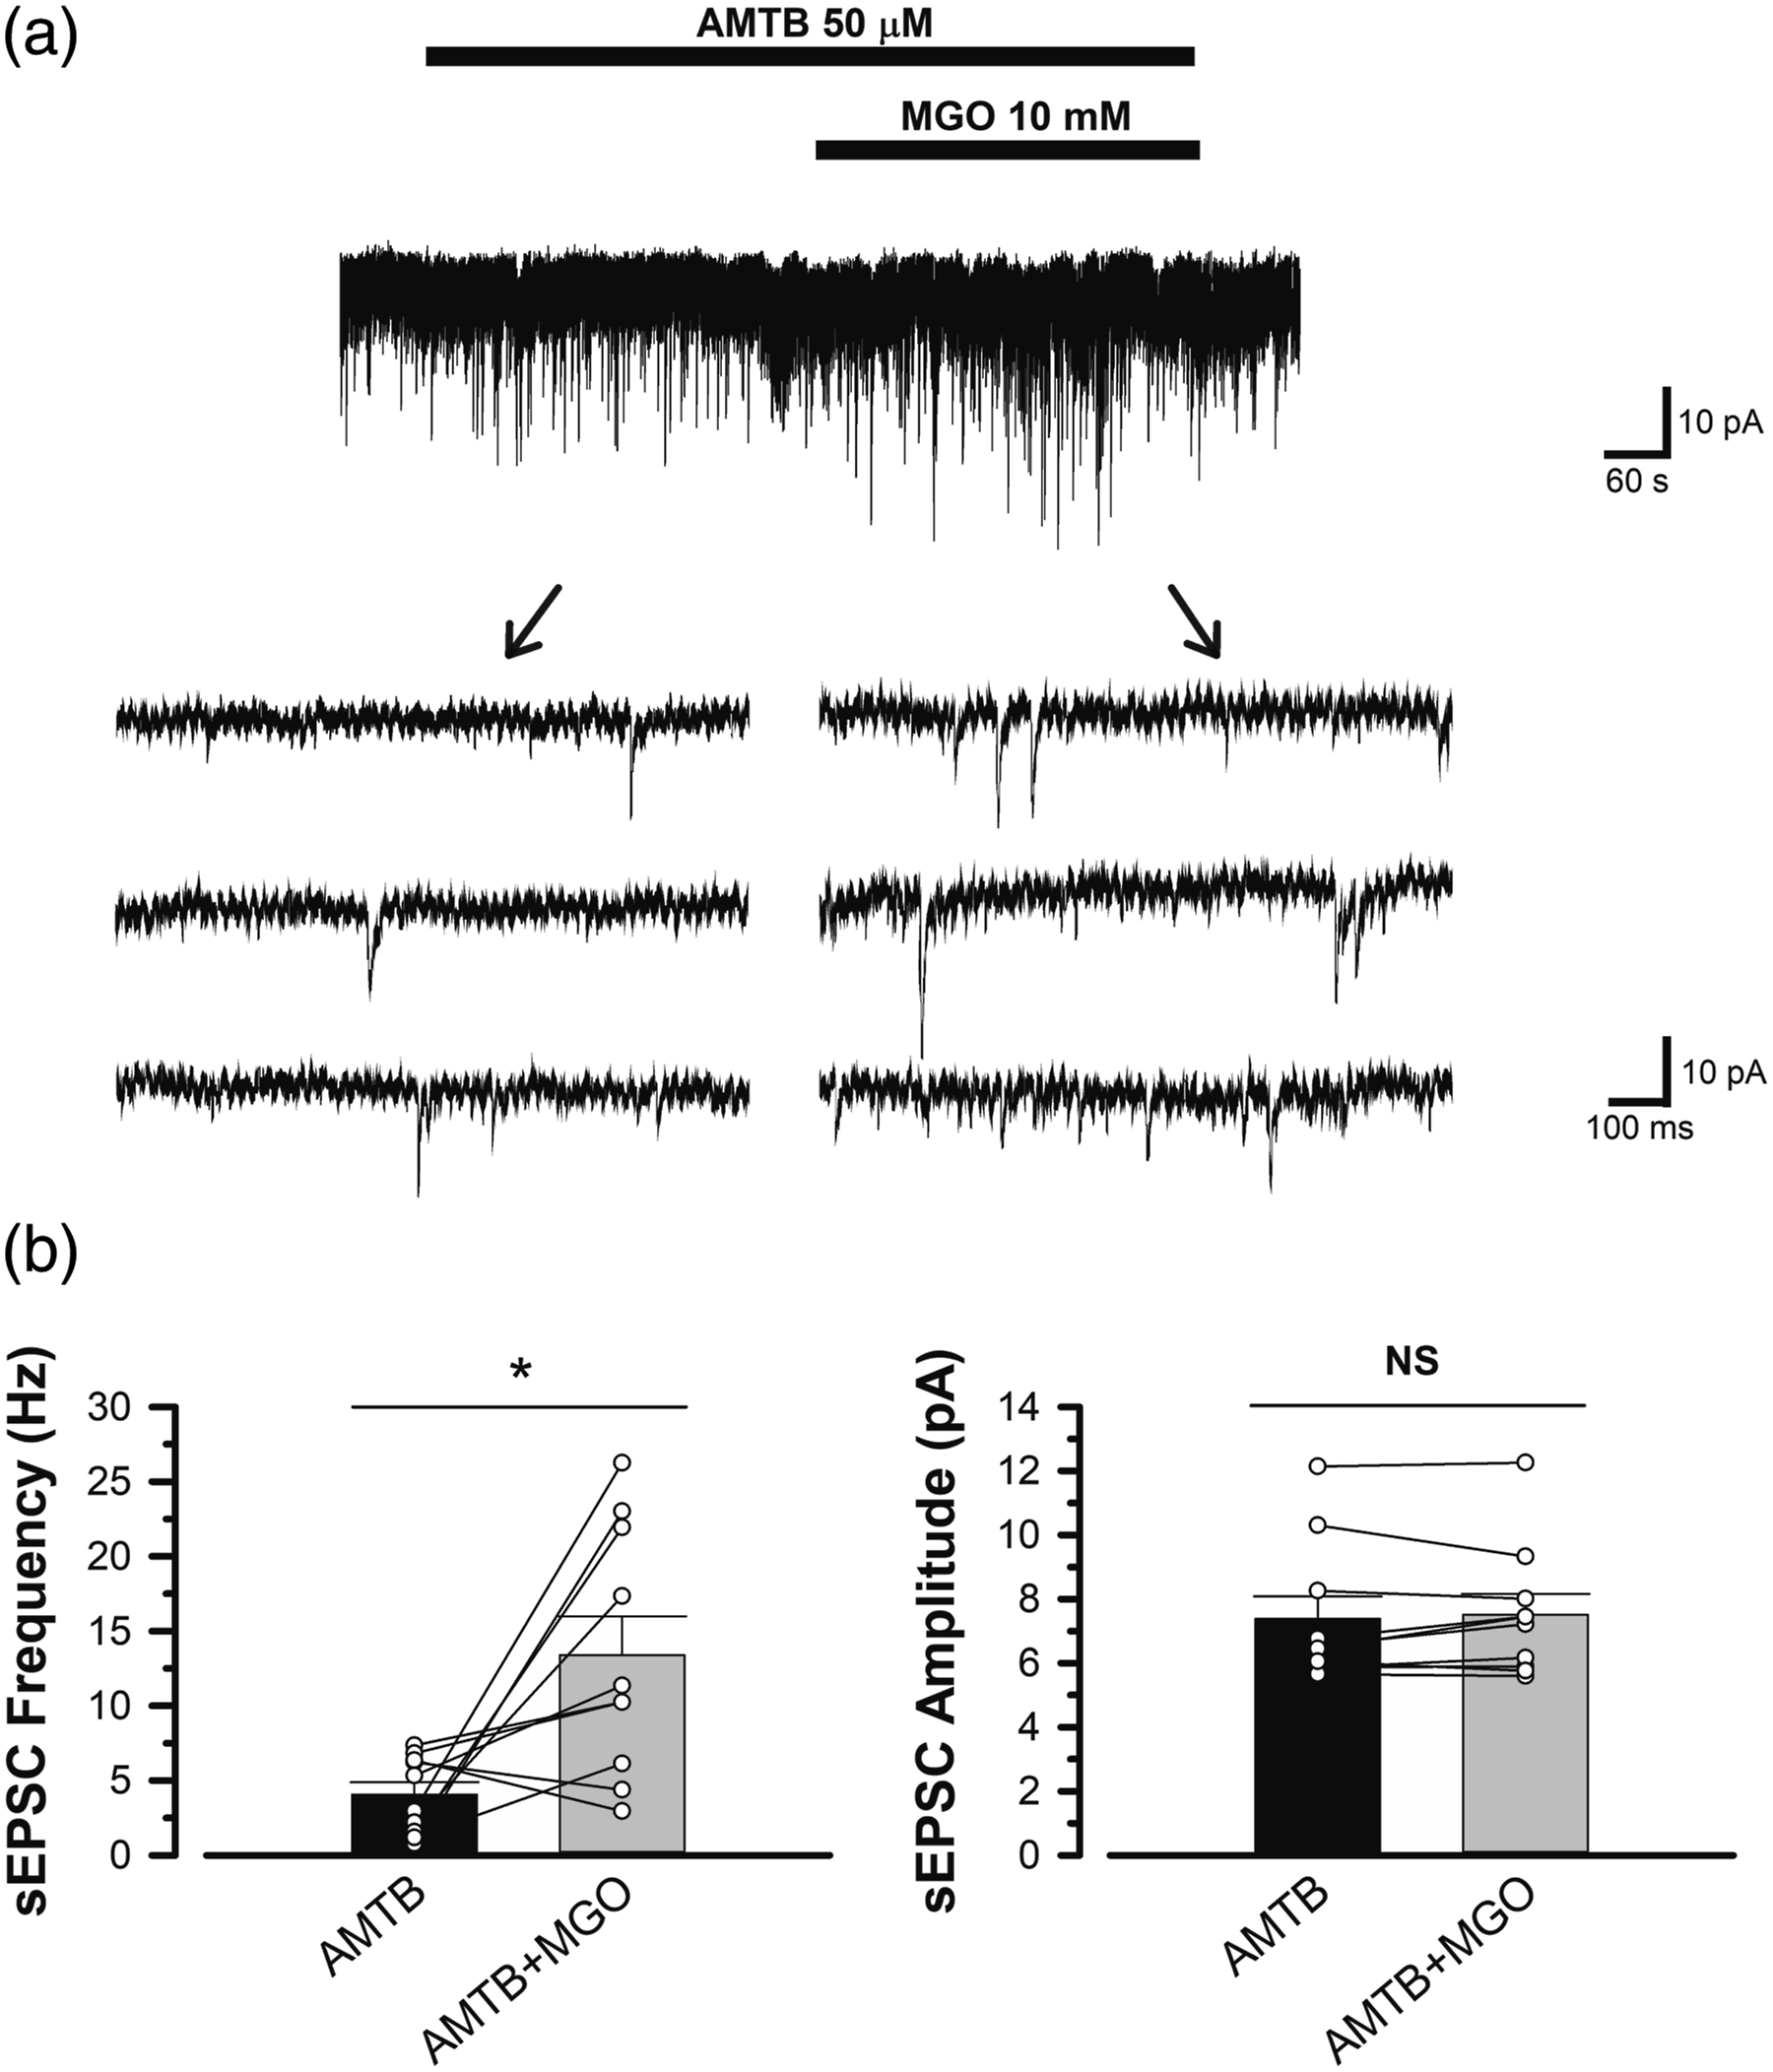
Afterward, the association between TRPV1 and MGO-induced excitability of SG neurons was examined. In the presence of capsazepine, a TRPV1 antagonist, the mean frequency of sEPSC increased significantly (p < .05), whereas the amplitude of sEPSC did not increase significantly (n = 8) (Figure 6(a)). The mean frequency and amplitude of sEPSC before perfusion of MGO were 3.8 ± 0.7 Hz (range; 1.3−6.8 Hz) and 7.1 ± 0.3 pA (range; 5.9−8.6 pA) respectively, and the mean frequency and amplitude of sEPSC after perfusion of MGO were 8.2 ± 1.6 Hz (range; 1.9−16.1 Hz) and 7.3 ± 0.4 pA (range; 6.0−9.3 pA), respectively (Figure 6(b)). The rates of increase in frequency and amplitude after MGO administration in the presence of capsazepine were 234.9% and 103.3%, respectively. In the presence of TRPV1 antagonists, MGO increased the frequency of sEPSC, but its potentiating effect tended to be suppressed when compared with that of MGO alone. Subsequently, the reactivity of MGO in the presence of HC030031 and capsazepine was examined (n = 8) (Figure 7(a)). The mean frequency and amplitude of sEPSC before MGO administration were 4.0 ± 1.1 Hz (range; 0.4−9.2 Hz) and 7.1 ± 0.3 pA (range; 5.5−8.5 pA), and the mean frequency and amplitude of sEPSC after MGO administration were 4.1 ± 1.1 Hz (range; 0.5−8.2 Hz) and 7.0 ± 0.3 pA (range; 5.4−8.0 pA), respectively (Figure 7(b)). The rates of increase in frequency and amplitude after MGO administration in the presence of HC030031 and capsazepine were 107.5 % and 100.1 %, respectively. In the presence of HC030031 and capsazepine, the activity induced by MGO was suppressed completely in the dorsal horn of the spine. Subsequently, whether TRPM8 is associated with the action of MGO in the spinal dorsal horn was investigated. In the presence of 50 μM AMTB, a selective TRPM8 antagonist, the mean frequency and amplitude were 4.1 ± 0.8 Hz (0.8−7.4 Ηz) and 7.4 ± 0.7 pA (5.7−12.1 pA), respectively, before MGO perfusion, and the mean frequency and amplitude of sEPSC after MGO perfusion were 13.4 ± 2.6 Hz (3.0−26.3 Ηz) and 7.5 ± 0.6 pA (5.6−12.2 pA), respectively (n = 10) (Figure 8(a) and (b)). The rates of increase in frequency and amplitude after MGO administration in the presence of AMTB were 721.6 % and 102.4 %, respectively. The frequency of sEPSC increased significantly, indicating that TRPM8 was not responsible for the MGO-induced excitability of SG neurons. Effect of MGO on excitatory synaptic transmission in the presence of capsazepine, antagonist of TRPV1. (a) A typical trace showing glutamatergic sEPSC before and during the application of MGO (10 mM) in the presence of capsazepine (10 μM). Black bars above the chart showing perfusion time for capsazepine (top; 10 min) and MGO (bottom; 5 min). Three consecutive traces of sEPSC shown at the end of the arrow are showing an expanded scale in time, before (lower left) and during the application of MGO (lower right) in the presence of capsazepine. (b) Summary of the effect of MGO on sEPSC frequency (left) and amplitude (right) in the presence of capsazepine. Each column presents the mean and SEM from eight experiments. Statistically significant difference between data are shown by bars and indicated by an asterisk; *p < .05; NS: not significant. The dots on the mean bar graph are plots of individual data. Effect of MGO on excitatory synaptic transmission in the presence of HC030031 and capsazepine. (a) A typical trace showing glutamatergic sEPSC before and during the application of MGO (10 mM) in the presence of HC030031(50 μM) and capsazepine (10 μM). Black bars above the chart showing perfusion time for HC030031 and capsazepine (top; 10 min) and MGO (bottom; 5 min). Three consecutive traces of sEPSCs shown at the end of the arrow are showing an expanded scale in time, before (lower left) and during the application of MGO (lower right) in the presence of HC030031 and capsazepine. (b) Summary of the effect of MGO on sEPSC frequency (left) and amplitude (right) in the presence of HC030031 and capsazepine. Each column presents the mean and SEM from eight experiments. Statistically significant difference between data are shown by bars and indicated by an asterisk; *p < .05; NS: not significant. The dots on the mean bar graph are plots of individual data. Effect of MGO on excitatory synaptic transmission in the presence of AMTB, selective antagonist of TRPM8. (a) A typical trace showing glutamatergic sEPSC before and during the application of MGO (10 mM) in the presence of AMTB (50 μM). Black bars above the chart showing perfusion time for AMTB (top; 10 min) and MGO (bottom; 5 min). Three consecutive traces of sEPSC shown at the end of the arrow are showing an expanded scale in time, before (lower left) and during the application of MGO (lower right) in the presence of AMTB. (b) Summary of the effect of MGO on sEPSC frequency (left) and amplitude (right) in the presence of AMTB. Each column presents the mean and SEM from 10 experiments. Statistically significant difference between data are shown by bars and indicated by an asterisk; *p < .05; NS: not significant. The dots on the mean bar graph are plots of individual data.

ROS associated with MGO-induced excitability of SG neurons
Our results suggest that MGO acts primarily on TRPA1 in presynaptic terminals and partially on TRPV1; however, it is unclear whether MGO acts directly as a ligand for TRP channels. MGO is metabolized to hydroimidazolone (MGO-H1), which binds to receptor for AGE (RAGE).19,20 This interaction between AGE and RAGE results in ROS production.
21
ROS has also been reported to act on TRPA1 and TRPV1 to promote excitatory synaptic transmission in spinal dorsal horn neurons.
22
Consequently, we hypothesized that MGO-induced ROS activates TRPA1 and TRPV1 in presynaptic terminals. To test the hypothesis, we investigated the effect of MGO in the presence of PBN, a non-selective ROS scavenger (n = 10) (Figure 9(a)). PBN 1 mM was perfused for 5 min, followed by simultaneous perfusion of PBN and MGO for 5 min to observe the effects on sEPSC frequency and amplitude. The mean frequency and amplitude of sEPSC before MGO perfusion were 5.0 ± 1.3 Hz (range; 0.7−10.0 Hz) and 7.4 pA ± 0.4 (range; 5.6−9.6 pA), while the mean frequency and amplitude of sEPSC after MGO perfusion were 5.0 ± 1.3 Hz (range; 1.0−11.2 Hz) and 6.9 ± 0.3 pA (range; 5.5−8.3 pA), respectively (Figure 9(b)). There were no significant differences between before and after perfusion with MGO in the presence of PBN (p > .05), indicating that MGO-induced excitability in the spinal dorsal horn was ROS-mediated. Effect of MGO on excitatory synaptic transmission in the presence of N-Tert-Butyl-α-Phenylnitrone (PBN), non-selective scavenger of ROS. (a) A typical trace showing glutamatergic sEPSC before and during the application of MGO (10 mM) in the presence of PBN (1 mM). Black bars above the chart showing perfusion time for PBN (top; 10 min) and MGO (bottom; 5 min). Three consecutive traces of sEPSC shown at the end of the arrow are showing an expanded scale in time, before (lower left) and during the application of MGO (lower right) in the presence of PBN. (b) Summary of the effect of MGO on sEPSC frequency (left) and amplitude (right) in the presence of PBN. Each column presents the mean and SEM from 10 experiments. Statistically significant difference between data are shown by bars and indicated by an asterisk; *p < .05; NS: not significant. The dots on the mean bar graph are plots of individual data.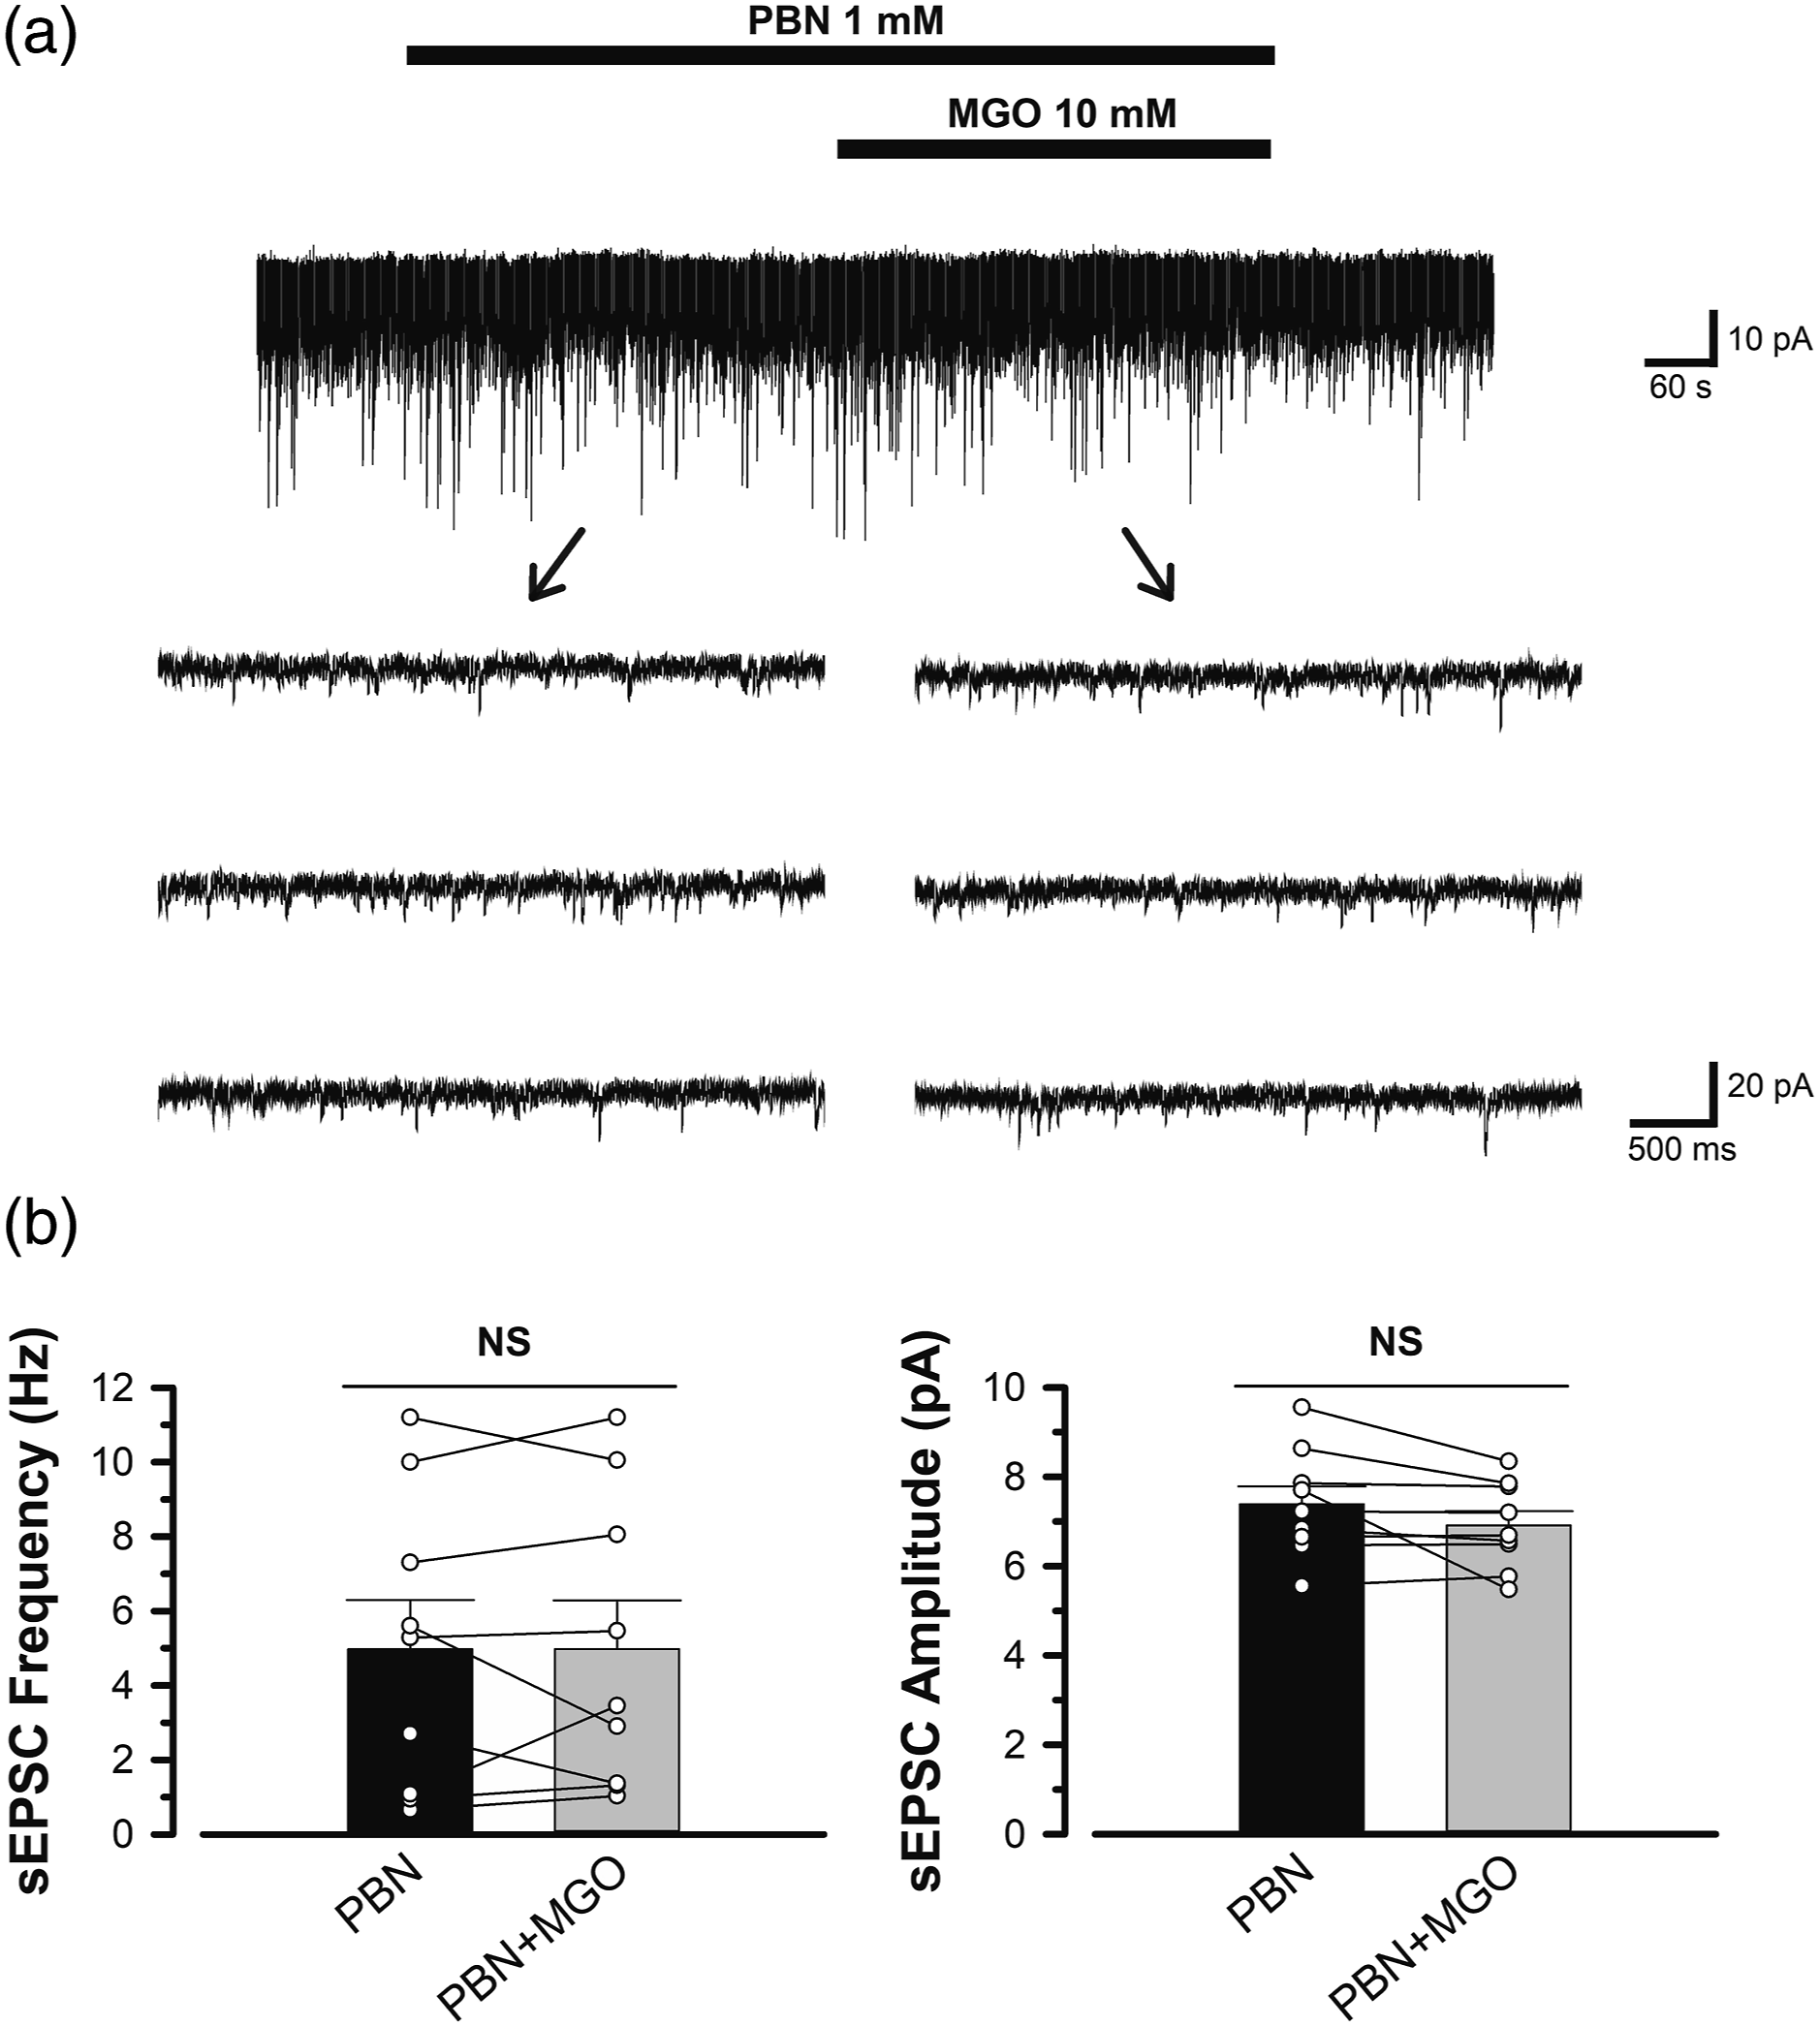
Discussion
The present study investigated MGO involvement in pain enhancement in the spinal dorsal horn. Perfusion with MGO increased the frequency and amplitude of sEPSC and was involved in pain enhancement in the dorsal horn of the spinal cord. The effect of MGO on the dorsal horn was not inhibited in the presence of TTX and disappeared in the presence of CNQX. The observations indicate that MGO excites SG neurons by increasing glutamate release rather than by mediating responses through interneurons. The effect of MGO on postsynaptic neurons was also considered, since a significant increase in amplitude was observed when MGO was administered alone and in the TTX study. However, no significant increase in amplitude was observed in the presence of ruthenium red, a non-selective TRP channel antagonist, suggesting that MGO acts on the presynaptic terminal rather than postsynaptic neurons. The inward current observed when MGO was administered alone was not observed in the presence of CNQX or ruthenium red, which suggested that it was due to an increase in glutamate release and was associated with sEPSC. The increase in the frequency and amplitude of sEPSC was suppressed significantly in the presence of HC-030031; additionally a trend toward suppression was also observed in the presence of capsazepine, indicating that MGO administration increases glutamate release by acting primarily on TRPA1 in the presynaptic terminals and partially on TRPV1. In the presence of PBN, the frequency and amplitude of sEPSC were not increased by MGO administration, suggesting that ROS may be involved in the mechanism through which MGO excites TRPA1 and TRPV1. To the best of our knowledge, this is the first study to demonstrate that MGO is involved in enhancing excitatory synaptic transmission via ROS in the spinal dorsal horn.
TRP channels in presynaptic terminals contribute to MGO-induced excitability in the spinal dorsal horn
TRP channels are activated by chemical substances and temperature. TRPA1, TRPV1, and TRPM8 are responsible for nociceptive transmission through TRP channels. 14 TRPA1 is activated by noxious cold temperatures and pungent substances, including isothiocyanates, such as mustard oil, cinnamon, and garlic. 23 TRPV1 is activated by capsaicin, low pH, and moderate heat (>43°C). 24 TRPM8 is activated by cold compound, low temperature (<26°C), and menthol.25–27 TRPA1 and TRPV1, but not TRPM8, were coexpressed in DRG. 28 In the SG, glutamate is spontaneously released from the central terminal region of DRG neurons by the activation of TRPA1,29,30 TRPV1,31,32 and TRPM8. 33 The association between TRPA1 and the mechanism by which MGO causes pain has been reported in numerous studies. For example, pharmacological and genetic disruption of TRPA1 attenuates MGO-induced spinal sensitization and pain-like behavior in rodents.9,11,15 In humans, the intracutaneous injection of MGO induces pain and hyperalgesia through C fiber activation via TRPA1. 11
Consistent with previous reports, 15 in the present study, the effect of MGO was significantly suppressed in the presence of HC030031. However, the increase rate of the frequency of sEPSC in the presence of HC030031 was 180 %, and unlike in the presence of ruthenium red (92 %), the reactivity of MGO could not be suppressed completely. In contrast, the frequency of sEPSC increased significantly following MGO administration in the presence of capsazepine. However, the rate of increase was 551% with MGO alone and 234% in the presence of capsazepine when compared with the frequency of sEPSC in MGO alone. In the presence of both HC030031 and capsazepine, the increase rate of the frequency of sEPSC was 107%, and the reactivity of MGO was inhibited to a greater extent than that in the presence of HC030031 alone. The results suggest that the effects of MGO on the spinal dorsal horn are mainly related to TRPA1 and partially to TRPV1 and that TRPM8 is not responsible for MGO-induced excitability of SG neurons.
ROS involved in MGO-derived pain enhancing effect in the spinal dorsal horn
MGO is a highly reactive dicarbonyl compound and an important precursor of AGE. 34 The major glycation adduct derived from MGO is hydroimidazolone (MGO-H1), which acts as a ligand for RAGE.19,20 RAGE is a multiligand receptor belonging to the immunoglobulin superfamily. 35 Behavioral and electrophysiological experiments have shown that MGO induces central spinal sensitization via RAGE. 12 AGE−RAGE interactions result in the production of ROS via the activation of NADPH oxidase. 21 ROS include oxygen radicals, such as superoxide, hydroxyl, peroxyl, and alkoxyl, which are generated in all cells. 36 Typically, various enzymatic and non-enzymatic molecules strictly regulate the physiological concentrations of ROS in cells.37,38 ROS have beneficial functions, such as pathogen invasion resistance; however, excess ROS cause cellular damage. ROS are involved in various types of pain. In a previous study, mitochondrial ROS in the spinal dorsal horn were increased in a neuropathic pain model of rodents, and most of their sources were neurons. 39 In addition, systemic administration of ROS scavengers relieved mechanical allodynia in a spinal nerve ligation model of neuropathic pain. 40 Furthermore, previous experiments using patch-clamp recordings have shown that ROS enhances excitatory synaptic transmission by acting on TRPA1 and TRPV1 in the spinal dorsal horn. 22 In the present study, MGO-induced excitability of SG neurons was suppressed completely by PBN. Integration of previous findings with our experimental results suggests that MGO produces ROS, which act on TRPA1 and TRPV1 at the central terminal of primary afferent neurons, to enhance excitatory synaptic transmission by stimulating glutamate release.
Limitations
There are three limitations of our study. First, our results suggested that ROS are involved in the mechanism by which MGO enhances sEPSC in the spinal dorsal horn, but we could not determine where in the spinal dorsal horn ROS were generated. We are skeptical that MGO is metabolized to AGE and binds to RAGE in a short time. Second, we could not reveal whether ROS act as a direct ligand for TRPA1/V1 or are indirectly involved. Third, as we only examined sEPSC and did not conduct experiments on spontaneous inhibitory postsynaptic currents, it is difficult to assert that MGO enhances pain.
Conclusion
The present study demonstrated that MGO affects the central terminals of primary afferent neurons and increases the release of glutamate, resulting in the excitability of SG neurons. As reported in a previous study, TRPA1 plays a key role in such processes. However, not only TRPA1 but also TRPV1 potentially act partially in glutamate release in response to MGO. To the best of our knowledge, this is the first study to demonstrate that MGO may enhance excitatory synaptic transmission through ROS production in the spinal dorsal horn. MGO, TRPA1, TRPV1, and ROS are potential therapeutic targets for glycation-related pain.
Footnotes
Acknowledgements
Author contributions
T.U. performed electrophysiological experiments and drafted the manuscript. T.U. and M.Y. designed the project and finished the final vision of the manuscript. All authors read and approved the final manuscript.
Declaration of conflicting interests
The author(s) declared no potential conflicts of interest with respect to the research, authorship, and/or publication of this article.
Funding
The author(s) disclosed receipt of the following financial support for the research, authorship, and/or publication of this article: This work was supported by the Japan Society for the Promotion of Science Grants-in-Aid for Scientific Research (KAKENHI) (grant number 20K18072).