
Abstract
Chronic pain is the most common symptom for people who suffer from rheumatoid arthritis and it affects approximately 1% of the global population. Neuroinflammation in the spinal cord induces chronic arthritis pain. In this study, a collagen-induced arthritis (CIA) mice model was established through intradermally injection of type II collagen in complete Freund’s adjuvant solution. Following CIA inducement, the paws and ankles of mice were found to swell, mechanical pain and spontaneous pain were induced, and their motor coordination was impaired. The spinal inflammatory reaction was triggered, which presented as severe infiltration of inflammatory cells, and the expression levels of GFAP, IL-1β, NLRP3, and cleaved caspase-1 increased. Oxidative stress in the spinal cord of CIA mice was manifested as reduced Nrf2 and NDUFB11 expression and SOD activity, and increased levels of DHODH and Cyto-C. At the same time, spinal AMPK activity was decreased. In order to explore the potential therapeutic options for arthritic pain, Xanthohumol (Xn) was intraperitoneally injected into mice for three consecutive days. Xn treatment was found to reduce the number of spontaneous flinches, in addition to elevating mechanical pain thresholds and increasing latency time. At the same time, Xn treatment in the spinal cord reduced NLRP3 inflammasome-mediated inflammation, increased the Nrf2-mediated antioxidant response, and decreased mitochondrial ROS level. In addition, Xn was found to bind with AMPK via two electrovalent bonds and increased AMPK phosphorylation at Thr174. In summary, the findings indicate that Xn treatment activates AMPK, increases Nrf2-mediated antioxidant response, reduces Drp1-mediated mitochondrial dysfunction, suppresses neuroinflammation, and can serve to relieve arthritis pain.
Introduction
Chronic pain is the most common symptom for those who suffer from rheumatoid arthritis (RA), which is a chronic autoimmune and inflammatory disease that affects approximately 1% of the population of the world. 1 RA pain arises from several mechanisms and involves inflammation, joint structural change, and peripheral and central pain processing. 2 During joint inflammation, the resident cells and infiltrating immune cells in the joint activate and/or sensitize the primary afferents. The activated primary afferents transmit the nociceptive response to the spinal cord and supraspinal center, which results in changes to various nociceptive players. 3 On the basis of the understanding of the mechanism of RA pain, primary pain treatment options include biological disease-modifying anti-rheumatic drugs and pain management medications including acetaminophen, non-steroidal anti-inflammatory drugs, opioids, and adjuvant drugs. 4 However, a significant number of patients continue to suffer with pain. Therefore, researching the pathogenesis of RA pain and developing appropriate treatment for arthritis pain management are both essential.
Neuroinflammation in the spinal cord is a contributing factor to chronic pain conditions, and is characterized by the activation of central glia. 5 Activation of spinal glia causes the secretion of inflammatory mediators such as tumor necrosis factor (TNF)-α and Interleukin (IL)-1β, which modulate neurotransmitter receptors, sensitize the surrounding synapse, and enhance pain signaling. 6 Patients who have fibromyalgia as a chronic musculoskeletal pain generally exhibit chronic neuroinflammation and small fiber neuropathy, 7 and permanent neuroinflammation in the spinal cord is observed in patients with HIV-infected neuropathic pain. 8 In chronic pain model rats, the cytokines are elevated and circulate in the cerebrospinal fluid. 9 In naive animals, the intrathecal injection of TNF-α and IL-1β elicits rapid pain hypersensitivity while the inhibition of TNF-α or IL-1β decreases neuropathic pain and inflammatory pain hypersensitivity in model animals. 10 NLRP3 inflammasome controls the maturation and secretion of IL-1β and is linked to chronic pain. 11 The inflammasome complex is assembled by NLRP3 and apoptosis-associated speck-like protein that contains a CARD ASC, subsequently activating por-caspase-1 with autocatalytic activity. Cleaved caspase-1 ultimately causes the maturation and release of IL-1β with proinflammatory activities. 12 It has been reported that NLRP3 is activated and upregulated in RA pain, while the inhibition of NLRP3 function or expression mediates analgesia. 13 Targeting NLRP3 inflammasome-mediated inflammation is a potential therapeutic treatment for chronic arthritis pain.
Xanthohumol (Xn) is a prenylated chalcone that is found in hops and beer and is a powerful antioxidant that can affect inflammatory processes. 14 Xn treatment hinders TNF-α and IL-6 expression and has an inhibitory impact on osteoarthritis development in osteoarthritis model mice. 15 During orthodontic therapy and treatment of periodontitis, Xn administration serves to modulate inflammation by reducing compression-related IL-6 protein and gene expression. 16 Inflammation and oxidative stress are decreased and diabetic wound healing is improved in type 1 diabetes animals by Xn consumption. 17 However, the effect and mechanism of Xn on arthritis pain remains unclear. Therefore, an arthritis pain animal model was constructed in this study. Xn was intraperitoneally injected and changes in behaviors spinal inflammation, and related protein expression levels were detected. The aim of this study is to clarify the mechanisms of chronic arthritis pain while also providing theoretical support for Xn application in relation to chronic pain.
Materials and methods
Animals and groups
30 male C57BL/6J mice weighing 18–20 g (6–8 weeks old) were purchased from Hubei Province Experimental Animal Center (Wuhan, China). All animals were acclimated to the environment for 5 days, housed in a 12 h light/dark circumstance with food and water ad libitum. All experimental procedures were performed according to local and international guidelines pertaining to the ethical use of animals, and every effort was made to minimize the number of animals that were used and any suffering to them. Ethical approval was obtained from the Laboratory Animal Ethics Committee of Hubei University of Science and Technology (2020-01-900). All experimental procedures in this study were conducted in accordance with the Chinese guidelines for laboratory animal welfare (GB/T 35,823-2018). Animals were divided at random into three groups (n = 10 for each group): control group, CIA group, and CIA + Xn group.
Antibodies and reagents
Anti-GFAP rabbit polyclonal antibody (DF6040), cleaved caspase-1 rabbit antibody (AF4022), caspase-1 rabbit antibody (AF5418), IL-1β rabbit antibody (AF5103), AMPK rabbit antibody (AF6423), p-AMPK rabbit antibody (AF3423), Drp1 rabbit polyclonal antibody (DF7037), Phospho-Drp1 (Ser616) rabbit polyclonal antibody (AF8470), Phospho-Drp1 (Ser637) rabbit polyclonal antibody (DF2980), Cytochrome c Oxidase two rabbit polyclonal antibody (DF7867), NLRP3 rabbit antibody (DF15549), and β-actin rabbit antibody (AF7018) were all obtained from Affinity (Shanghai, China). NDUFB11 rabbit polyclonal antibody (A15617), DHODH rabbit polyclonal antibody (A6899), and Nrf2 rabbit polyclonal antibody (A0674), HRP Goat Anti-Rabbit IgG (H + L) (AS014), H&E staining solution (BL700 A)were all purchased from ABclonal (Wuhan, China). Tartrate-Resistant Acid Phosphatase (TRAP) Staining Kit (BB-4421) was purchased from Biosharp (Chongqing, China). Xanthohumolol (B20557) was purchased from Shanghai Yuanye (Shanghai, China). Antigen retrieval solution (P0083), immunofluorescence blocking solution (P0102), RIPA lysis buffer (P0013B), QuickBlockTM Blocking Buffer (P0260),CFA (P2036), Mito-Tracker Red CMXRos (C1049B), JC-1 mitochondrial membrane potential assay kit (C2003S) was purchased from Beyotime (Shanghai, China). Goat Anti-Rabbit IgG H&L (FITC) (ab6717) was purchased from Abcam (Cambridge, UK).
Model construction and drug administration
2 mg/mL bovine type II collagen (CII) solution (Chondrex, USA) was homogenized and emulsified with an equal volume of complete Freund’s adjuvant (CFA). A mouse model of collagen-induced arthritis (CIA) was established through the intradermal injection of 20 µl CII mixture on days 0 and 7. 18 Xn was dissolved into DMSO at the stocking concentration of 100 mg/mL, before being further diluted in corn oil to the final concentration of 10 mg/m before use. A mixture of corn oil and DMSO (1:10) was used as a vehicle. Mice from the CIA and CIA + Xn groups were intraperitoneally injected with vehicle and Xn (10 mg/kg), respectivel15, 16, and 17 after CIA injection. 19
Behavioral tests
Behavioral tests were performed at baseline, 7, and 14 days following CIA inducement, and 4 h after Xn administration on days 15–17. All tests were conducted by an investigator who was blind to the treatment groups. Mechanical threshold values were detected as a means of presenting mechanical pain sensitivity. The mice were placed in a 30 × 30 × 30 cm plexiglass chamber and habituated for a minimum of 30 minutes before the behavioral experiments were conducted. von Frey filaments (Stoelting, USA, ranging from 0.008 g to 6.0 g) were used by stimulating the left hind paw. Filaments were pressed vertically against the plantar surfaces until they bent and were held for 3–5 s. In this situation, a brisk withdrawal and paw flinching were considered to be a positive response. When a positive response occurred, the filament with the next lower force was applied, and if a negative response occurred, the filament with the next higher force was applied. The pattern of positive and negative withdrawal response was then converted to mechanical threshold. 20 The number of flinches was recorded for presenting spontaneous pain. The mice were placed in a 30 × 30 × 30 cm plexiglass chamber and habituated for a minimum of 30 min. The number of flinches was counted for a period of 5 min three times and the average of the total number of flinches was taken. 21 Latency to fall on rotarod was tested as a means of presenting motor coordination. 3 days prior to the experiment, all animals accepted acclimatization training at a fixed speed of 4 r/min for 10 min, which was repeated three times at 10-min intervals. At the start of the experiment, the rotation speed was set at a fixed value of 10 r/min for 10 s before being accelerated for 10 s. The rod then worked at a speed of 20 r/min for 30 s and then accelerated for 10 s. The movement was performed continuously for 10 min and was repeated three times at 10-min intervals. The latency to fall of the mice was recorded. 22
Tartrate-resistant acid phosphatase staining
Following the behavioral tests, another five mice from each group were sacrificed with an overdose of pentobarbital sodium (150 mg/kg). The left tibias were collected and preserved in 10% neutral buffered formalin, before being decalcified using 10% EDTA for 21 days, and then embedded in paraffin, and sectioned to 5-micron-thick (Leica RM 2165). In accordance with the TRAP protocol, the tibia sections were stained with TRAP staining reagent for 1 h at 37°C, and then methyl green at room temperature for 5–10 min until the color reaction was complete. The stained sections were observed using a fluorescence microscope (Olympus IX73; Olympus Corporation).
Histology and immunofluorescence of the spinal cord
Following the behavioral tests, the mice were deeply anesthetized with 60 mg/kg sodium pentobarbital, transcranial perfused with heparinized 0.9% saline solution, followed by perfusing to 4% paraformaldehyde 0.1 M phosphate buffer (pH 7.4) until their bodies were stiff and rigid. The lumbar portions of the spinal cords were removed and post-fixed overnight at 4°C, embedded in paraffin, and then cut into 4-μm sections. The sections were stained with the standard Hematoxylin and Eosin (H & E) staining for observing histological changes. H & E images were analyzed using ImageJ 1.51j8 software (National Institutes of Health, USA). The scoring criteria of inflammation cell infiltration are as follows: 0 (normal); 1 (lymphocyte infiltration around meninges and blood vessels); 2 (1–10 lymphocytes in a field); 3 (11–100 lymphocytes in a field); and 4 (>100 lymphocytes in a field). 23
Immunofluorescence analysis was used for the detection of the expression intensity of protein. The sections were dewaxed and antigen retrieval was conducted. They were then treated with 3% hydrogen peroxide for 10 min, blocked with immunofluorescence blocking solution at room temperature for 1 h, and incubated with primary antibody overnight at 4°C, before being incubated with fluorescent secondary antibody (1:000) at room temperature for 1 h and observed using a fluorescence microscope (Olympus IX73, Tokyo, Japan). The fluorescence intensities were analyzed using ImageJ 1.53. The following primary antibodies were used at the dilution of 1:100: anti-IL-1β, anti-Nrf2, anti-GFAP, anti-Drp1, anti-NDUFB11, anti-DHODH, anti-AMPK, anti-NLRP3, and anti-Caspase-1.
Transmission electron microscopy
Mitochondria in the spinal cord were confirmed by electron microscopy of negatively stained samples. The spinal cord was isolated, cut into ∼1 mm3 cubes, fixed in 2.5% glutaraldehyde, and post-fixed with 1% osmium tetroxide. Ultrathin sections were then post-stained with uranyl acetate and lead citrate, before being examined using an HC-1 transmission electron microscope (Hitachi, Tokyo, Japan) which operated at 120 kV.
Western blotting assays
Following the behavioral tests, the mice were sacrificed with an overdose of pentobarbital sodium (150 mg/kg). Lumbar spinal cord samples were obtained and were then homogenized in RIPA lysis buffer that contained 1% protease inhibitors (Sigma-Aldrich, USA), and centrifugated at 12,000g, 4°C for 20 min for supernatant collection. The protein concentration in each sample was quantified using a BCA analysis kit (Beyotime, Shanghai, China). 24 Proteins were then collected, separated on SDS-PAGE gel, and transferred to a PVDF membrane. Membranes were blocked with QuickBlockTM Blocking Buffer for 1 h, incubated with the appropriate primary antibodies overnight at 4°C, and then incubated with HRP-conjugated secondary antibodies (1:5000) at room temperature for 1 h. Protein bands were probed using an ECL detection reagent, visualized using an iBright 1500 instrument (Invitrogen, USA), and analyzed using ImageJ. β-actin (1:5000) was used as a loading control. The following primary antibodies were used at the dilution as 1:1000: anti-IL-1β, anti-GFAP, anti-Nrf2, anti-AMPK, anti-phospho-AMPK, anti-Drp1, Anti-phospho-DRPp1 (Ser616), anti-phospho-Drp1 (Ser637), anti-NDUFB11, anti-DHODH, anti-Cyt-C, anti-NLRP3, anti-cleaved-Caspase-1.
Molecular docking
The X-ray crystal structure of AMPK was obtained from the Protein Data Bank (PDB ID: 4EAI https://www.rcsb.org/). Xn structure was downloaded from the PubChem database (https://www.pubchem.ncbi.nlm.nih.gov/compound) and optimized using ChemBio3D Ultra 14.0 software (PerkinElmer Informatics). Auto Dock Vina 1.2.0 software (Center for Computational Structural Biology) was used for docking conformation between Xn and AMPK. PyMOL 2.2.3 was used for visualizing the conformation. 25
Measurement of SOD activity
SOD assay kit with WST-8 (Beyotime, Shanghai, China) was prepared to determine superoxide dismutase (SOD) enzyme activity. The spinal cords were homogenized in ice-cold Phosphate Buffered Saline (PBS) buffer and centrifuged at 12,000g for 15 min. The supernatant was then collected and mixed with WST-8 enzyme working solution for 20 min at 37°C, and the OD450 nm absorbance value of each pore was measured. SOD activity is expressed as units per milligram of total protein (U/mg protein).
Cell preparation and treatment
C6 rat glioma cells (Jennio Biotech) were seeded in DMEM with 10% FBS, 50 U/mL penicillin, and 50 μg/mL streptomycin. C6 cells were induced with 5 ng/μL IL-1β for 4 h and combined with 0 or 1 μM Xn treatment for 24 h.
Mitochondrial membrane potential measurement
JC-1 mitochondrial membrane potential assay kit and Mito-Tracker Red CMXRos were used for evaluating the mitochondrial membrane potential. In accordance with the instructions, following IL-1β inducement and XN treatment, cells were washed with PBS and then cultured with 200 μL JC-1/Mito-Tracker Red CMXRos for 20 min at 37°C in the dark. Fluorescence intensity was detected by fluorescence microscopy (IX73, Olympus, Tokyo, Japan) and analyzed using ImageJ software (NIH).
Mitochondrial lipid peroxidation assessment
3-[4-(perylenylphenylphosphino)phenoxy] propyltriphenylphosphonium iodide (MitoPeDPP) (M466, Dojindo Molecular Technologies, Inc.) is a cell-membrane-permeable probe that penetrates the cell membrane and aggregates in mitochondria that can be used for assessing lipid peroxidation in mitochondria. In accordance with the instructions, following IL-1β inducement and XN treatment, the cells were washed with PBS, stained with 0.3 μmol/L MitoPeDPP and 10 μmol/L DAPI in the dark at 37°C for 15 min, and detected using a fluorescence microscope (Olympus IX73, Olympus). Fluorescence intensity was analyzed using ImageJ software (NIH).
Cytosolic reactive oxygen species assessment
Dihydroethidium (DHE) probe was used for investigating cytosolic ROS levels in cells. DHE produce red fluorescence through interaction with ROS. The cells were induced by IL-1β, treated with XN, washed three times with PBS, stained with 10 μmol/L DHE solution for 30 min in the dark, and detected using a fluorescence microscope (Olympus IX73, Olympus). Fluorescence intensity was analyzed using ImageJ software (NIH).
Statistical analysis
All statistical analyses were performed using SPSS 26.0 statistics software (IBM Corp., Armonk, NY, USA). Data relating to paw thickness and ankle width in the two groups was analyzed using student’s t-test. Data from three or fix groups was analyzed using one-way analysis of variance followed by Tukey’s test. Data for H & E staining, immunofluorescence and western blotting were presented as mean ± SD. Data for the behavioral tests was expressed as mean ± SEM. Statistical significance was set at p < 0.05.
Results
Xn relieves pain hypersensitivity in collagen-induced arthritis mice
Behavioral tests were performed following the protocol shown in Figure 1(a). As can be seen in Figure 1(b), on day 14 after CIA inducement, the paws of the mice had swollen from 2.42 ± 0.09 to 3.81 ± 0.25 (p < 0.05 vs control group, Figure 1(c)). The ankle width of mice had increased from 2.71 ± 0.05 to 4.32 ± 0.18 (p < 0.05 vs control group, Figure 1(d)). At the same time, paraffin histology of the tibia revealed that in comparison to the control group, the TRAP-positive cells that presented osteoclast-like cells were clearly visible in the bone matrix in CIA group (Figure 1(e)). Compared to the control group, the mechanical threshold values were found to be significantly decreased from 1.38 ± 0.08 (day 0) to 0.52 ± 0.07 (day 7, p < 0.05) and 0.43 ± 0.06 (day 14, p < 0.05). The number of flinches had dramatically increased from 3.33 ± 0.37 (day 0) to 8.67 ± 0.71 (day 7, p < 0.05) and 12.11 ± 0.61 (day 14, p < 0.05). Latency to fall was reduced from 499.30 ± 24.77 (day 0) to 228.75 ± 17.62 (day 7, p < 0 .05) and 197.97 ± 18.86 (day 14, p < 0.05). This data shows that CIA inducement induced pain hypersensitivity and motor disability in mice, which indicates the establishment of arthritis pain. Compared to the CIA group, Xn treatment statistically raised mechanical threshold values to 0.74 ± 0.05, 0.79 ± 0.06, and 0.83 ± 0.06 on days 15, 16, and 17 respectively (p < 0.05) (Figure 1(f)). The number of flinches decreased on day 15, 16, and 17 to 9.22 ± 0.52, 8.89 ± 0.35, and 8.56 ± 0.50, respectively (p < 0.05) (Figure 1(g)), and latency to fall increased to 279.10 ± 17.26, 309.15±11.80 and 319.01 ± 19.56 on the same days (p < 0.05) (Figure 1(h)). All these results provide evidence that Xn treatment elevated pain hypersensitivity and recovered motor coordination in CIA mice. Effect of Xn treatment on pain response in the CIA induced mice. (a) Schematic diagram of the experimental procedures. CIA was intraarticularly injected into the left knee joint of the mice on day 0. Behavioral tests were performed on days 0, 7 and 14. Xn was intraperitoneally injected in mice on days 15–17. Behavioral tests were performed after 4 h of Xn treatment. And then, mice were scarified, and the spinal cord tissues were collected for morphological and expression analyses. (b) Representative images of the left hind paw from control and CIA mice. (c) and (d) Changes of paw thickness (c) and ankle width (d) from control and CIA mice. (e) Representative tibia areas stained with TRAP and methyl green. Scale bar = 20 μm. (f)-(h) Changes of PWT values (f), spontaneous flinches (g) and latency to fall (h) of control, CIA and CIA + Xn groups. Histogram analysis for PWT values (f1–f3), spontaneous flinches (g1–g3) and latency to fall (h1–h3) at 0, 14 and 17 days. Data are expressed as the mean ± SEM (n = 10 mice/group). *p < 0.05 versus control group, #p < 0.05 versus CIA group. 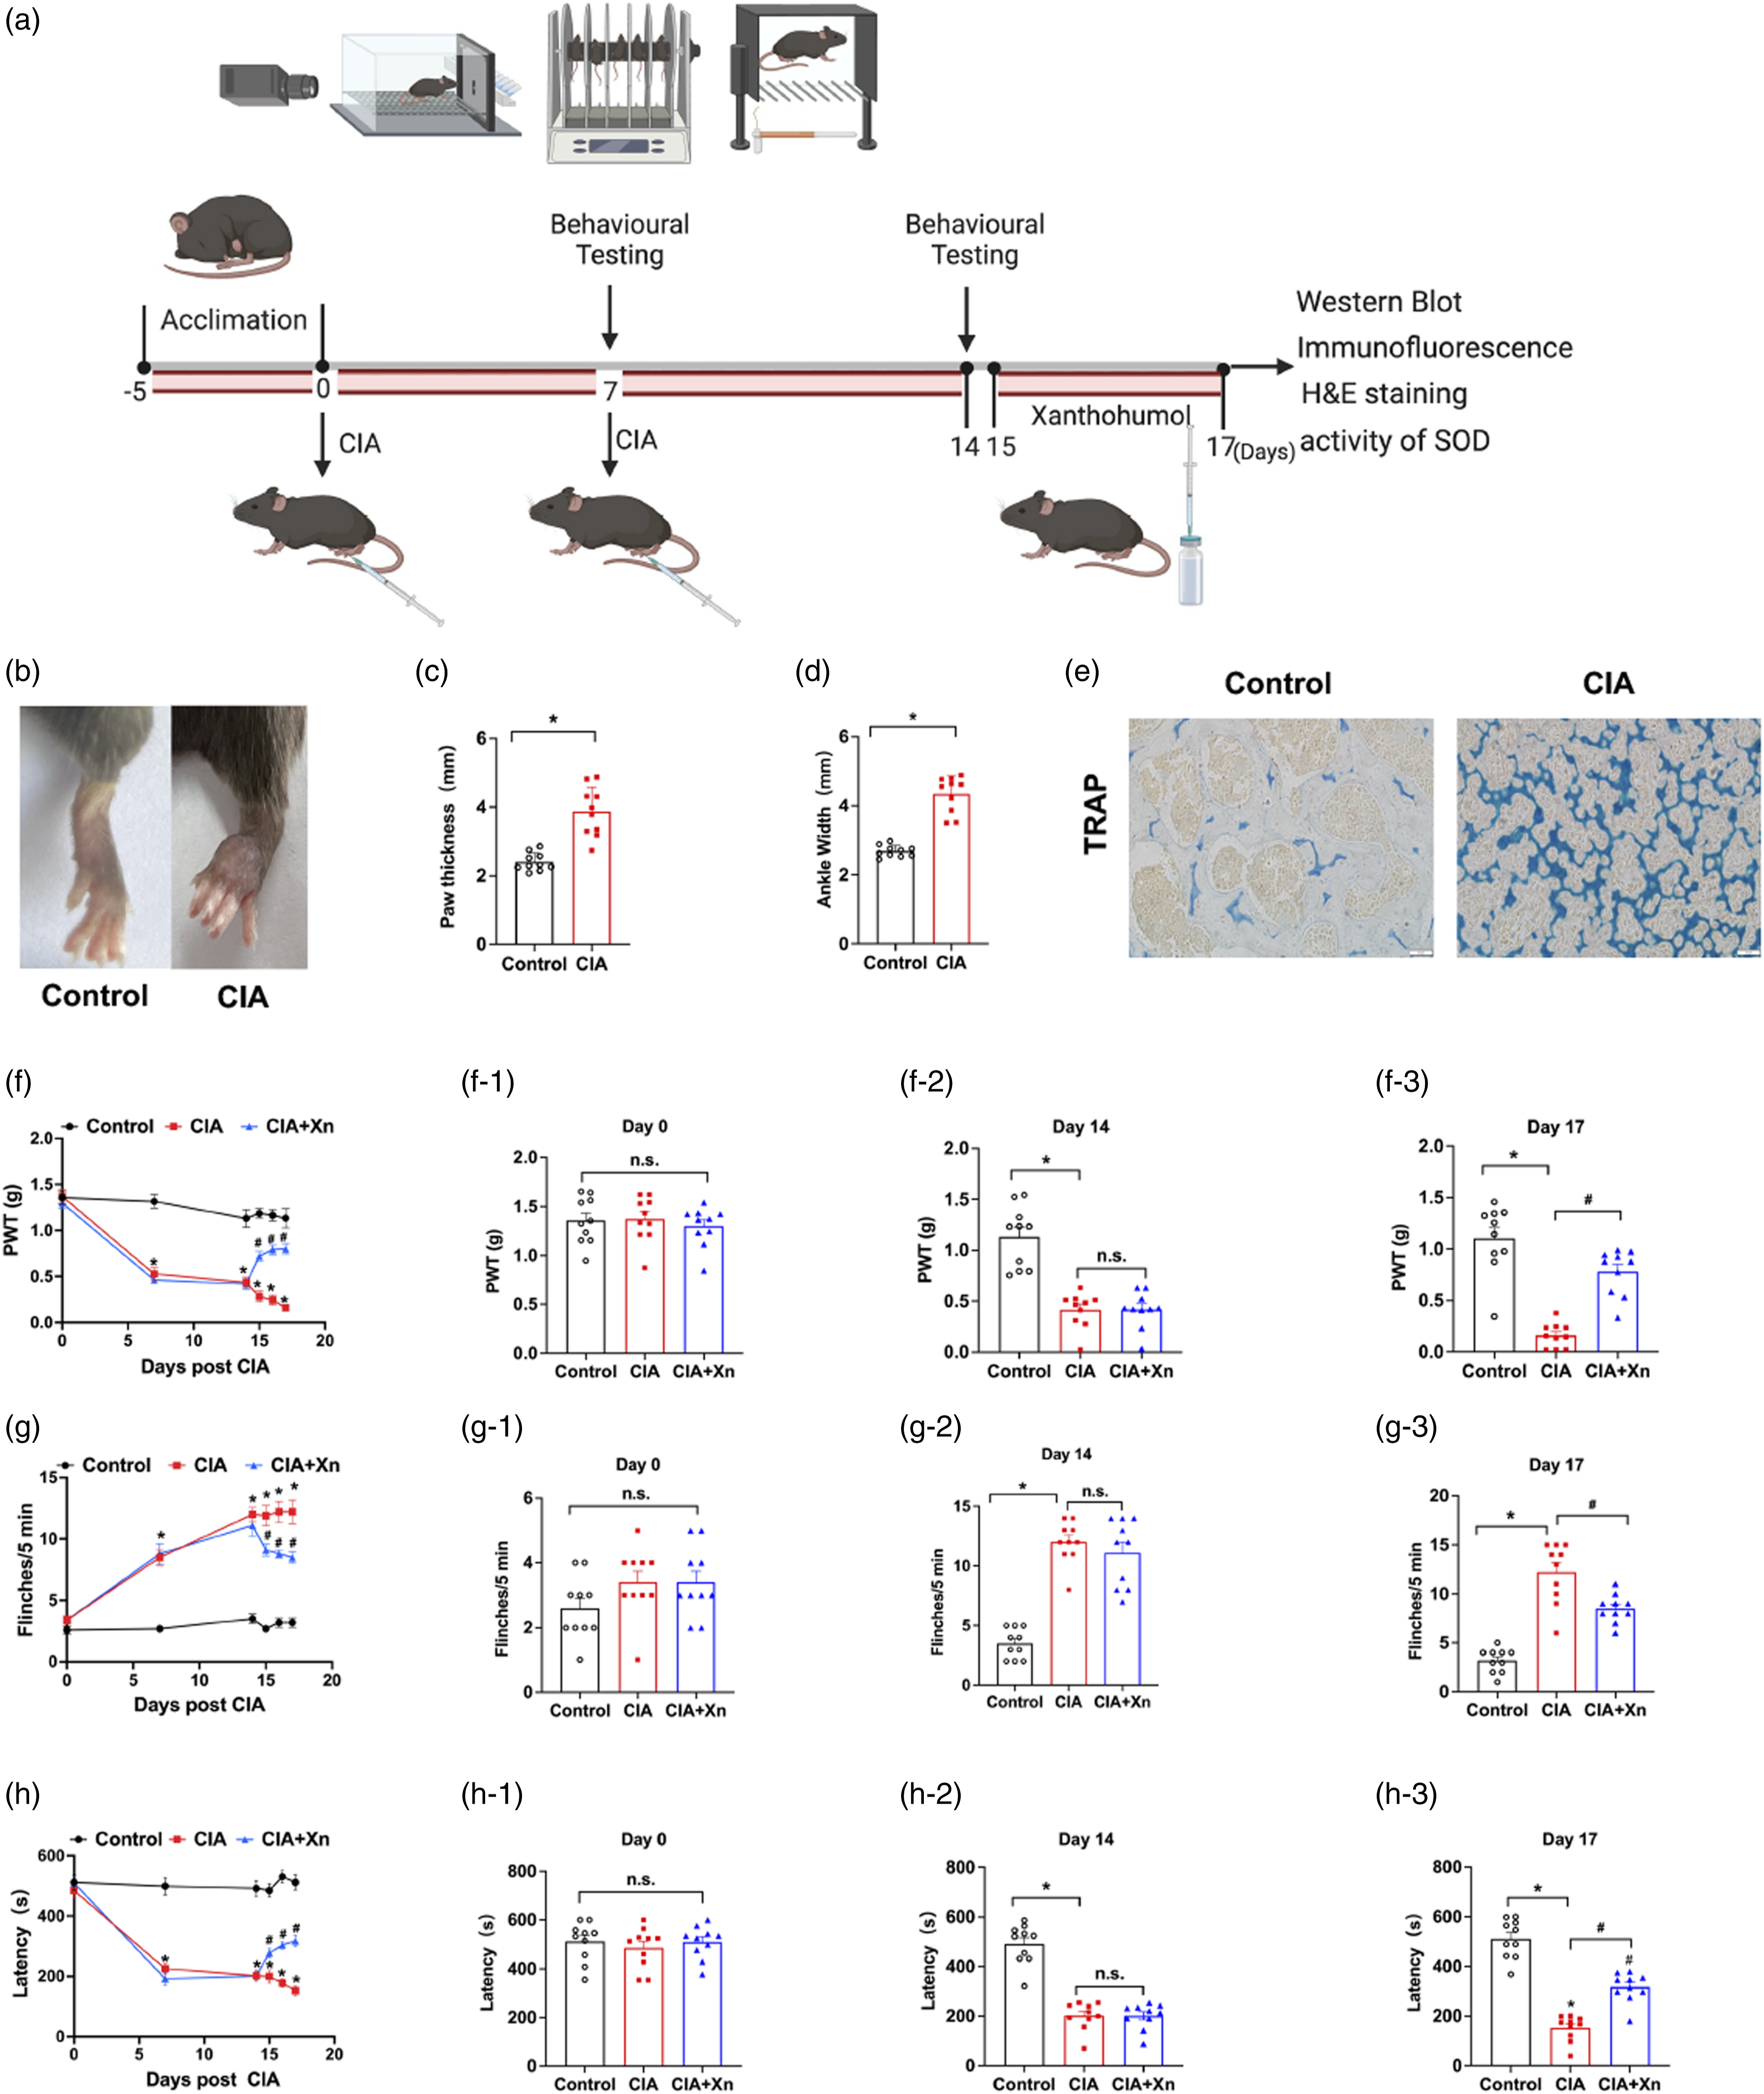
Xn decreases spinal inflammation
Severe infiltration of inflammatory cells was observed in the spinal dorsal horn of CIA mice (Figure 2(a)) with a relative inflammation score of 2.18 ± 0.12 (p < 0.05 vs control group, Figure 2(b)), while Xn treatment was found to decrease the inflammatory response to 1.46 ± 0.15 (p < 0.05 vs CIA group, Figure 2(b)). At the same time, the fluorescence intensity of cytokine IL-1β in the spinal dorsal horn of the CIA group (Figure 2(e)) was significantly enhanced with relative intensity at 2.37 ± 0.05 (p < 0.05 vs control group, Figure 2(f)), and Xn application down-regulated IL-1β intensity to 1.31 ± 0.05 (p < 0.05 vs CIA group, Figure 2(f)). The spinal IL-1β expression level also showed a similar trend (Figure 2(g)) with the relative gray value at 1.82 ± 0.05 in the CIA group (p < 0.05 vs control group, Figure 2(h)) and 1.56 ± 0.05 in the CIA + Xn group (p < 0.05 vs CIA group, Figure 2(h)). Astrocytic activation is an important inflammation cytokine source and was detected with the marker glial fibrillary acidic protein (GFAP). GFAP intensity in the spinal dorsal horn of the CIA group (Figure 2(c)) was found to dramatically increase to 1.94 ± 0.05 (p < 0.05 vs control group, Figure 2(d)), while Xn treatment decreased the intensity to 1.28 ± 0.05 (p < 0.05 vs CIA group) (Figure 2(d)). Spinal GFAP expression in the CIA group (Figure 2(g)) was consistently up-regulated to 1.73 ± 0.03 (p < 0.05 vs control group, Figure 2(h)), and in the CIA + Xn group, it was reduced to 1.21 ± 0.03 (p < 0.05 vs CIA group) (Figure 2(h)). Therefore, this data illustrates that CIA inducement triggered spinal inflammation in mice and Xn application suppressed inflammatory responses. Effects of Xn treatment on inflammatory infiltration and protein levels of GFAP and IL-1β. (a) and (b) Representative H & E staining images (a) and quantitative analysis (b) of spinal cord sections. Scale bar = 20 μm. (c) and (d) Representative immunofluorescence staining images (c) and quantitative intensity analysis (d) of GFAP in spinal dorsal horn. Scale bar = 20 μm. (e) and (f) Representative immunofluorescence staining images (e) and quantitative intensity analysis (f) of IL-1β in spinal dorsal horn. Scale bar = 20 μm. (g) and (h) Western blot analysis (g) and quantitative grey value analysis (h) of GFAP and IL-1β levels in spinal cord of control, CIA and CIA + Xn groups. Data are presented as mean ± SD (n = 5 mice/group). *p < 0.05 versus control group, #p < 0.05 versus CIA group. 
Xn reduces NLRP3 inflammatory activation
NLRP3 inflammasome has been found to mediate caspase-1 activation and IL-1β secretion.
26
The fluorescence intensity of NLRP3 and caspase-1 in the spinal dorsal horn increased in the CIA group (Figure 3(a) and (c)) with respective relative intensities of 1.64 ± 0.06 and 1.88 ± 0.05 (p < 0.05 vs control group, Figure 3(b) and (d)). Xn treatment reduced NLRP3 and caspase-1 intensities to 1.20 ± 0.07 and 1.33 ± 0.06, respectively (p < 0.05 vs CIA group, Figure 3(b) and (d)), while Western blotting analysis showed the spinal expressions of NLRP3 and activated caspase-1 to be up-regulated in CIA group, (Figure 3(e)) and the relative gray values were 1.87 ± 0.09 and 1.49 ± 0.07, respectively (p < 0.05 vs control group, Figure 3(f)). Xn treatment down-regulated NLRP3 expression levels and activated caspase-1 to 1.04 ± 0.05 and 1.19 ± 0.07, respectively (p < 0.05 vs CIA group) (Figure 3(f)). Effects of Xn treatment on NLRP3 inflammasome activation. (a) and (b) Representative immunofluorescence staining images (a) and quantitative intensity analysis (b) of NLRP3 in spinal dorsal horn. Scale bar = 20 μm. (c) and (d) Representative immunofluorescence staining images (c) and quantitative intensity analysis (d) of caspase-1 in spinal dorsal horn. Scale bar = 20 μm. (e) and (f) Western blot analysis (e) and quantitative grey value analysis (f) of NLRP3 and cleaved caspase-1 levels in spinal cord of control, CIA and CIA + Xn groups. Data are presented as mean ± SD (n = 5 mice/group). *p < 0.05 versus control group, #p < 0.05 versus CIA group.
Xn stimulates spinal antioxidative reaction
The antioxidant response element Nrf2 level was detected. Nrf2 fluorescence intensity in the spinal dorsal horn was found to be decreased in the CIA group (Figure 4(a)), with a relative intensity of 0.46 ± 0.05 (p < 0.05 vs control group, Figure 4(b)). Xn treatment increased Nrf2 intensity to 0.77 ± 0.05 (p < 0 .05 vs CIA group) (Figure 4(b)), while Western blotting analysis showed spinal Nrf2 expression to be down-regulated in the CIA group (Figure 4(c)) with relative a gray value of 0.44 ± 0.05 (p < 0.05 vs control group, Figure 4(d)). Xn treatment up-regulated Nrf2 expression level to 0.96 ± 0.06 (p < 0.05 vs CIA group) (Figure 4(d)). At the same time, SOD is an important enzyme that controls ROS and SOD activity in the control group was 13.95 ± 0.41 U/mg. However, it was suppressed to 10.50 ± 0.37 U/mg (p < 0.05 vs control group) in the CIA group. Xn treatment increased activity to 13.52 ± 0.23 U/mg (p < 0.05 vs CIA group) (Figure 4(e)). Effect of Xn treatment on Nrf2 expression and SOD activity in the spinal cord of mice. (a) and (b) Representative immunofluorescence staining images (a) and quantitative intensity analysis (b) of Nrf2 in spinal dorsal horn. Scale bar = 20 μm. (c) and (d) Western blot analysis (c) and quantitative grey value analysis (d) of Nrf2 levels in spinal cord. (e) SOD activity in spinal cord of control, CIA and CIA + Xn groups. Data are presented as mean ± SD (n = 5 mice/group). *p < 0.05 versus control group, #p < 0.05 versus CIA group. 
Xn increases spinal AMPK expression and activity
Molecular docking assay was performed on the X-ray crystal structures of AMPK and the ligand Xn (Figure 5(a)–(c)), and it was found that Xn formed two electrovalent bonds with AMPK at Lys-141 residue at the bond distances of 2.5 Å. At the same time, the effect of Xn on AMPK expression and activity was detected by immunofluorescence assay and Western blotting analysis. The fluorescence intensity of AMPK in the spinal dorsal horn was decreased in the CIA group (Figure 5(d)) with a relative intensity of 0.58 ± 0.06 (p < 0.05 vs control group, Figure 5(e)). Xn administration increased AMPK intensity to 0.80 ± 0.06 (p < 0.05 vs CIA group) (Figure 5(e)), while AMPK activity presented as the phosphorylation of Thr172 residue in AMPKα subunit (pAMPK-Thr172).
27
Western blotting analysis demonstrated that pAMPK-Thr172 level was down-regulated in the CIA group (Figure 5(f)) with a relative gray value of 0.30 ± 0.06 (p < 0 .05 vs control group, Figure 5(g)). The pAMPK-Thr172 expression was enhanced after Xn treatment in the CIA + Xn group, and the relative gray value increased to 0.98 ± 0.05 (p < 0.05 vs CIA group) (Figure 5(g)). Effect of Xn treatment on AMPK expression and activity in the spinal cord of mice. (a)–(c) Molecular docking of Xn with AMPK. The modelled 3D structure of AMPK docked with Xn (a). The enlarged view of binding site in box (b). The interaction bonds of AMPK with Xn (c). Bonds showed as yellow dotted lines, and bond lengths were presented as numbers. (d)-(e) Representative immunofluorescence staining images (d) and quantitative intensity analysis (e) of AMPK in spinal dorsal horn. Scale bar = 20 μm. (f)-(g) Western blot analysis (f) and quantitative grey value analysis (g) of phosphorylated AMPK at Thr172 (pAMPK-Thr172) level in spinal cord of control, CIA and CIA + Xn groups. Data are presented as mean ± SD (n = 5 mice/group). *p < 0.05 versus control group, #p < 0.05 versus CIA group.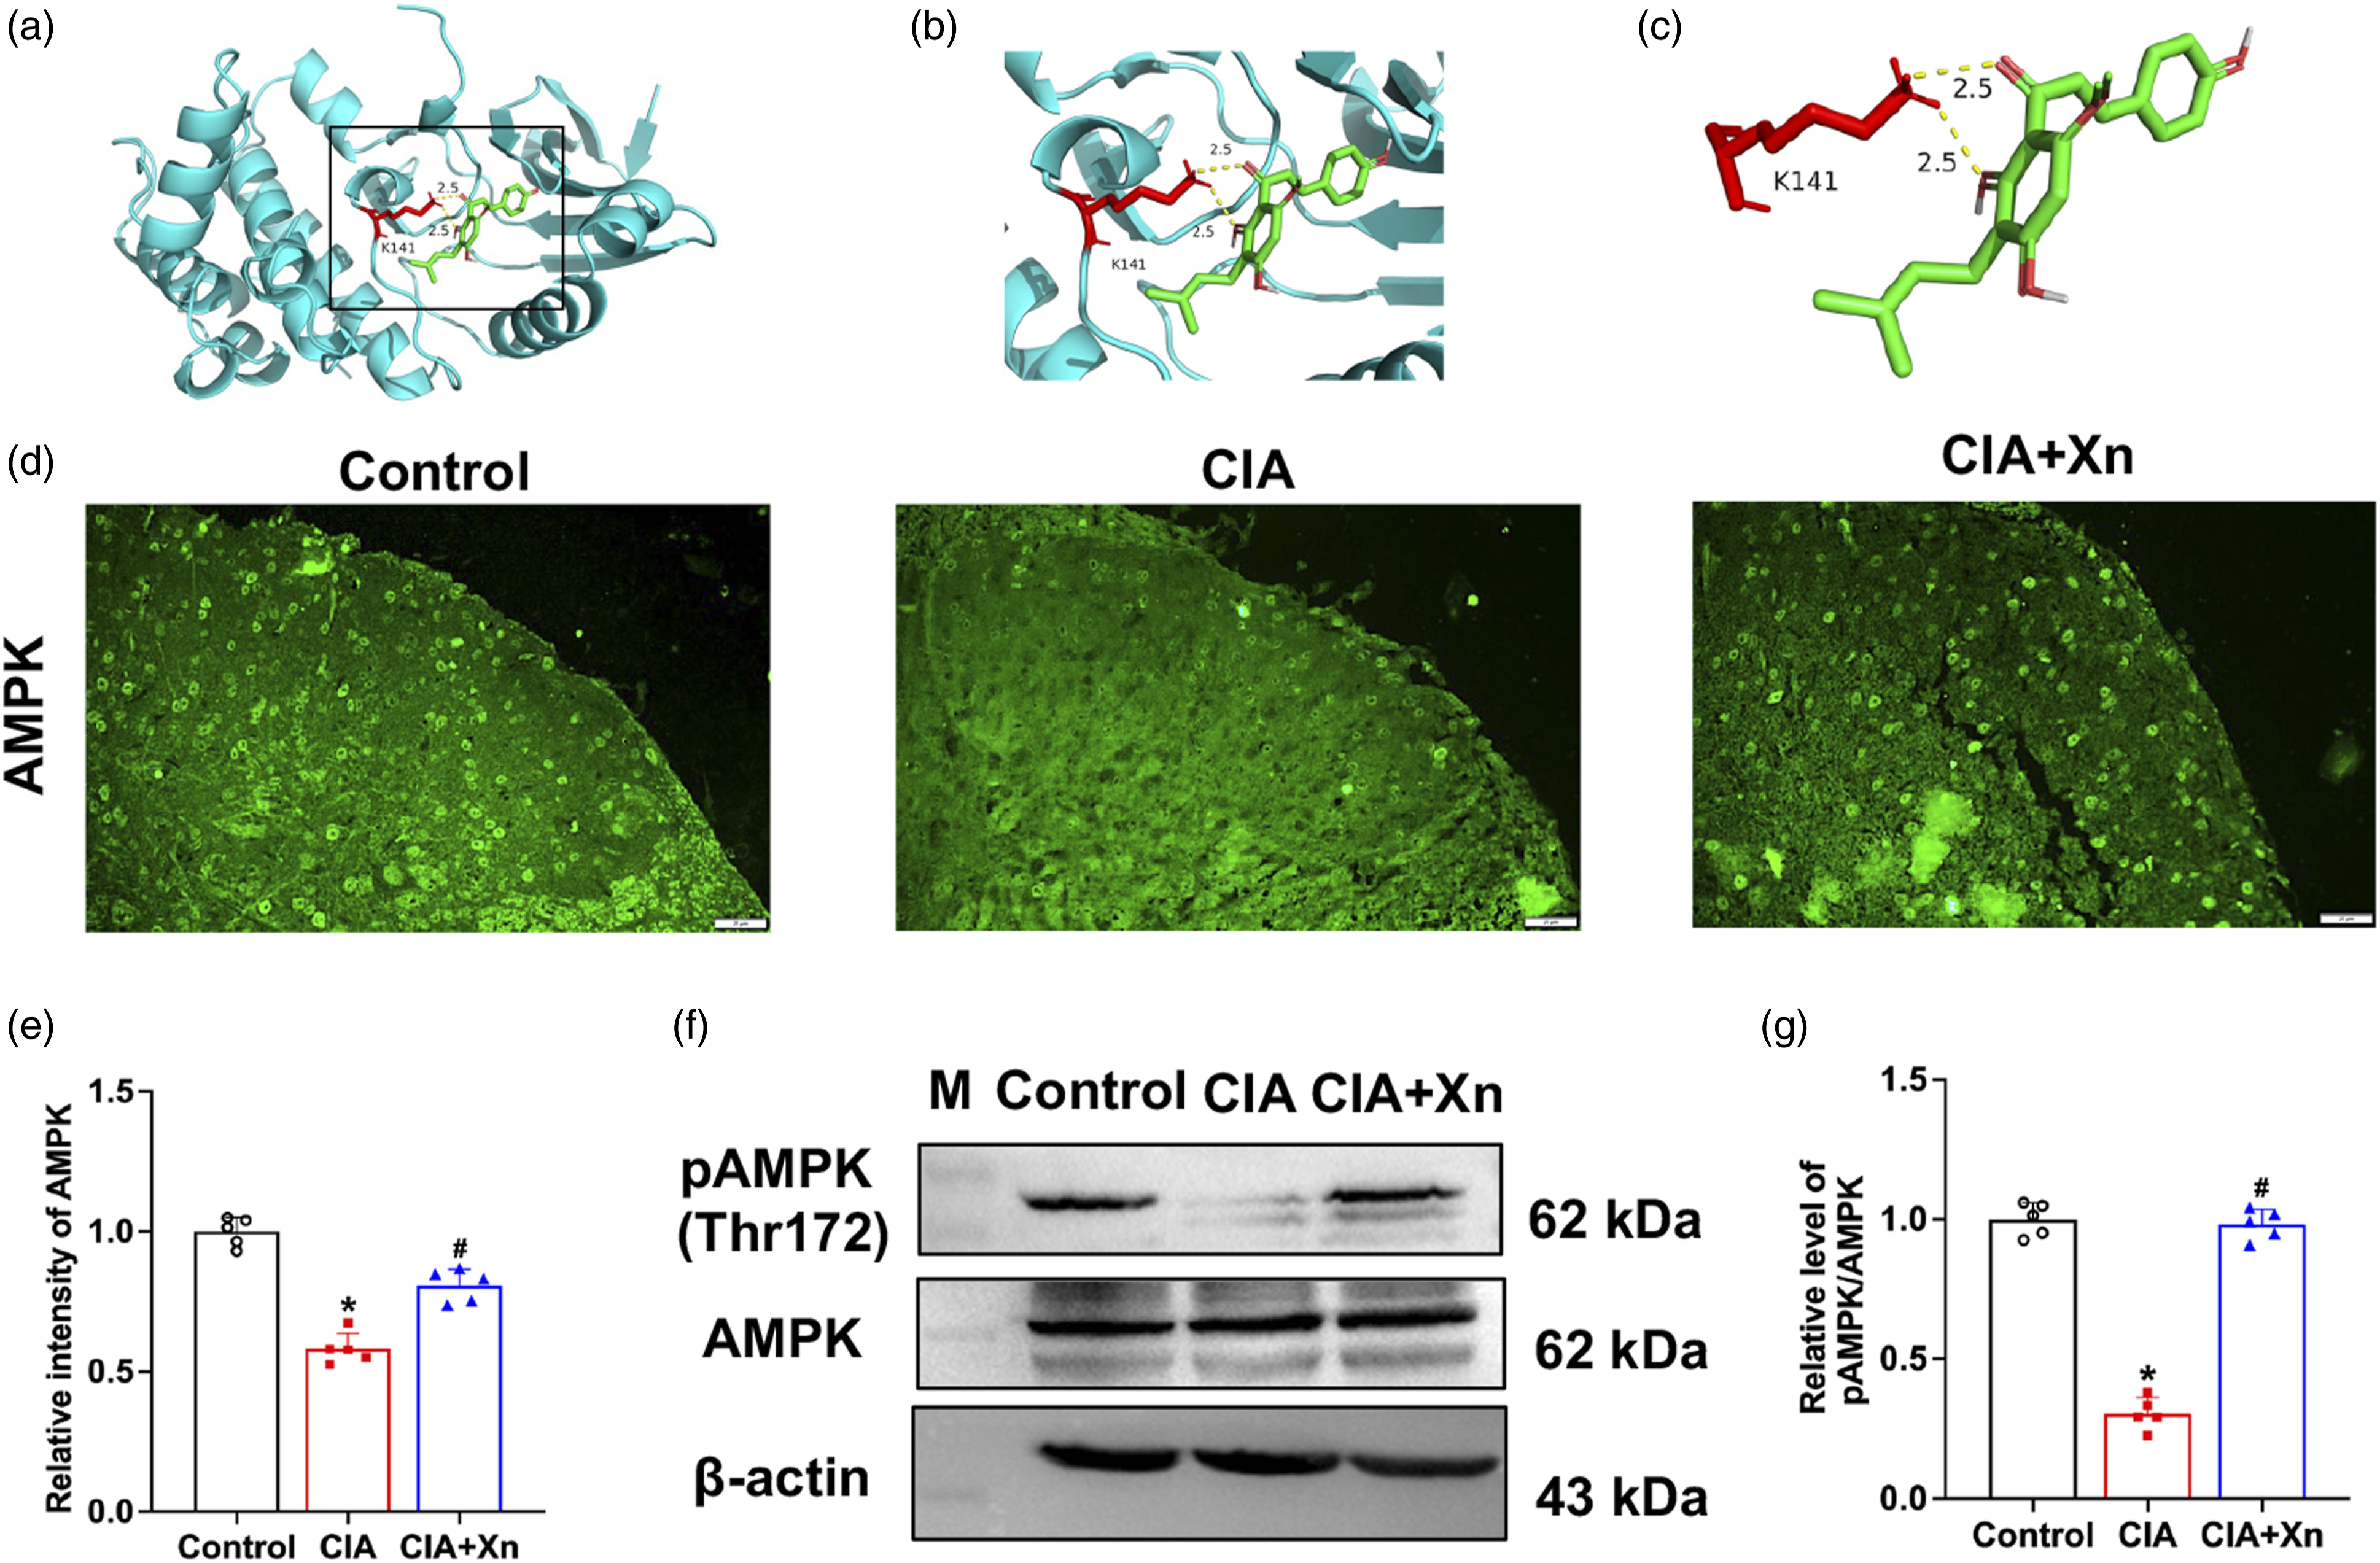
Xn recovers mitochondrial dysfunction in the spinal cords of collagen-induced arthritis mice
AMPK regulates mitochondrial function and dynamics through the regulation of Drp1 translocation from the cytoplasm to the mitochondria. Phosphorylation of Drp1 at Ser616 site activates Drp1 GTPase activity while promoting Drp1-mediated mitochondria fission, and phosphorylation at Ser616 site prevents Drp1 GTPase activity while also reducing mitochondria fission.
28
In comparison to the control group, CIA inducement increased Drp1 intensity at the spinal dorsal horn (p < 0.05 vs control group, Figure 6(a)), up-regulated the phosphorylation of Drp1 at Ser616 in the spinal cord (p < 0.05 vs control group, Figure 6(c)), and up-regulated phosphorylation of Drp1 at Ser637 in the spinal cord (p < 0.05 vs control group, Figure 6(c)). Following Xn treatment, the relative intensity of Drp1 and the expression levels of phosphorylated Drp1 were recovered (p < 0.05 vs CIA group, Figure 6(a) and (c)). The CIA group and CIA + Xn group of Drp1 intensity were 2.02 ± 0.09 and 1.31 ± 0.08, respectively (Figure 6(b)). The CIA group and CIA + Xn group of Drp1 (Ser637)/Drp1 ratio were 0.52 ± 0.05 and 0.85 ± 0.04, respectively (Figure 6(d)); Drp1 (Ser616)/Drp1 ratio were 1.35 ± 0.08 and 1.12 ± 0.12, respectively (Figure 6(d)). Mitochondrial morphology was detected by TEM. The mitochondrial structure exhibited normal outer membrane and cristae in the spinal cords of the control group. Conversely, it exhibited an increased outer membrane density and a disappearing and disrupted cristae in the CIA group (Figure 6(e)). Subsequently, the expression levels of the mitochondrial protein, NDUFB11 (a component of mitochondrial complex I) and DHODH (an antioxidant that inhibits lipid peroxidation in the mitochondria) were examined using immunofluorescence and Western blotting analysis. The fluorescence intensity and expression level of NDUFB11 in the spinal cord were found to be markedly decreased in the CIA group (p < 0.05 vs control group, Figure 7(a) and (e)) and Xn treatment was found to increase the intensity and level (p < 0.05 vs CIA group) (Figure 7(a) and (e)). At the same time, the fluorescence intensity and expression level of DHODH in the spinal cord increased in the CIA group (p < 0.05 vs control group, Figure 7(c) and (e)) and Xn treatment decreased both the intensity and level (p < 0.05 vs CIA group) (Figure 7(c) and (e)). The NDUFB11 intensities of the CIA and CIA + Xn groups were 0.42 ± 0.04 and 0.86 ± 0.06, respectively (Figure 7(b)). The NDUFB11 gray values of the CIA and CIA + Xn groups were 0.37 ± 0.07 and 0.81 ± 0.07, respectively (Figure 7(f)). The DHODH intensities of the CIA and CIA + Xn groups were 1.59 ± 0.07 and 1.26 ± 0.09, respectively. (Figure 7(d)) The CIA group and CIA + Xn group of DHODH grey values were 1.65 ± 0.09 and 1.27 ± 0.08, respectively (Figure 7(f)). In addition, Cyto C expression was up-regulated in the CIA group (Figure 7(e)) with a gray value of 1.76 ± 0.10 (p < 0.05 vs control group, Figure 7(f)) and Xn treatment down-regulated the Cyto C expression level to 1.22 ± 0.13 (p < 0.05 vs CIA group) (Figure 7(f)). Effect of Xn treatment on the activity of Drp1 in the spinal cord of mice. (a), (b) Representative immunofluorescence staining images of Drp1 expressions in spinal dorsal horn (a) and quantitative fluorescence intensity analysis (b) of Drp1 in spinal dorsal horn. Scale bar = 20 μm. (c), (d) Western blot analysis (c) and quantification of the relative grey value (d) Drp1 and phosphorylated Drp1 at Ser616 and Ser637 level in spinal cord of control, CIA and CIA + Xn groups. (e) Representative TEM images of spinal mitochondria from control and CIA Mice. Scale bar = 200 nm. Data are presented as mean ± SD (n = 5 mice/group). *p < 0.05 versus control group, #p < 0.05 versus CIA group. Effect of Xn treatment on the changes of mitochondrial related proteins in the spinal cord of mice. (a), (b) Representative immunofluorescence staining images (a) and quantitative intensity analysis (b) of NDUFB11 in spinal dorsal horn. Scale bar = 20 μm. (c), (d) Representative immunofluorescence staining images (c) and quantitative intensity analysis (d) of DHODH in spinal dorsal horn. Scale bar = 20 μm. (e), (f) Western blot analysis (e) and quantitative grey value analysis (f) of NDUFB11, DHODH and Cyto c expression level in spinal cord of control, CIA and CIA + Xn groups. Data are presented as mean ± SD (n = 5 mice/group). *p < 0.05 versus control group, #p < 0.05 versus CIA group.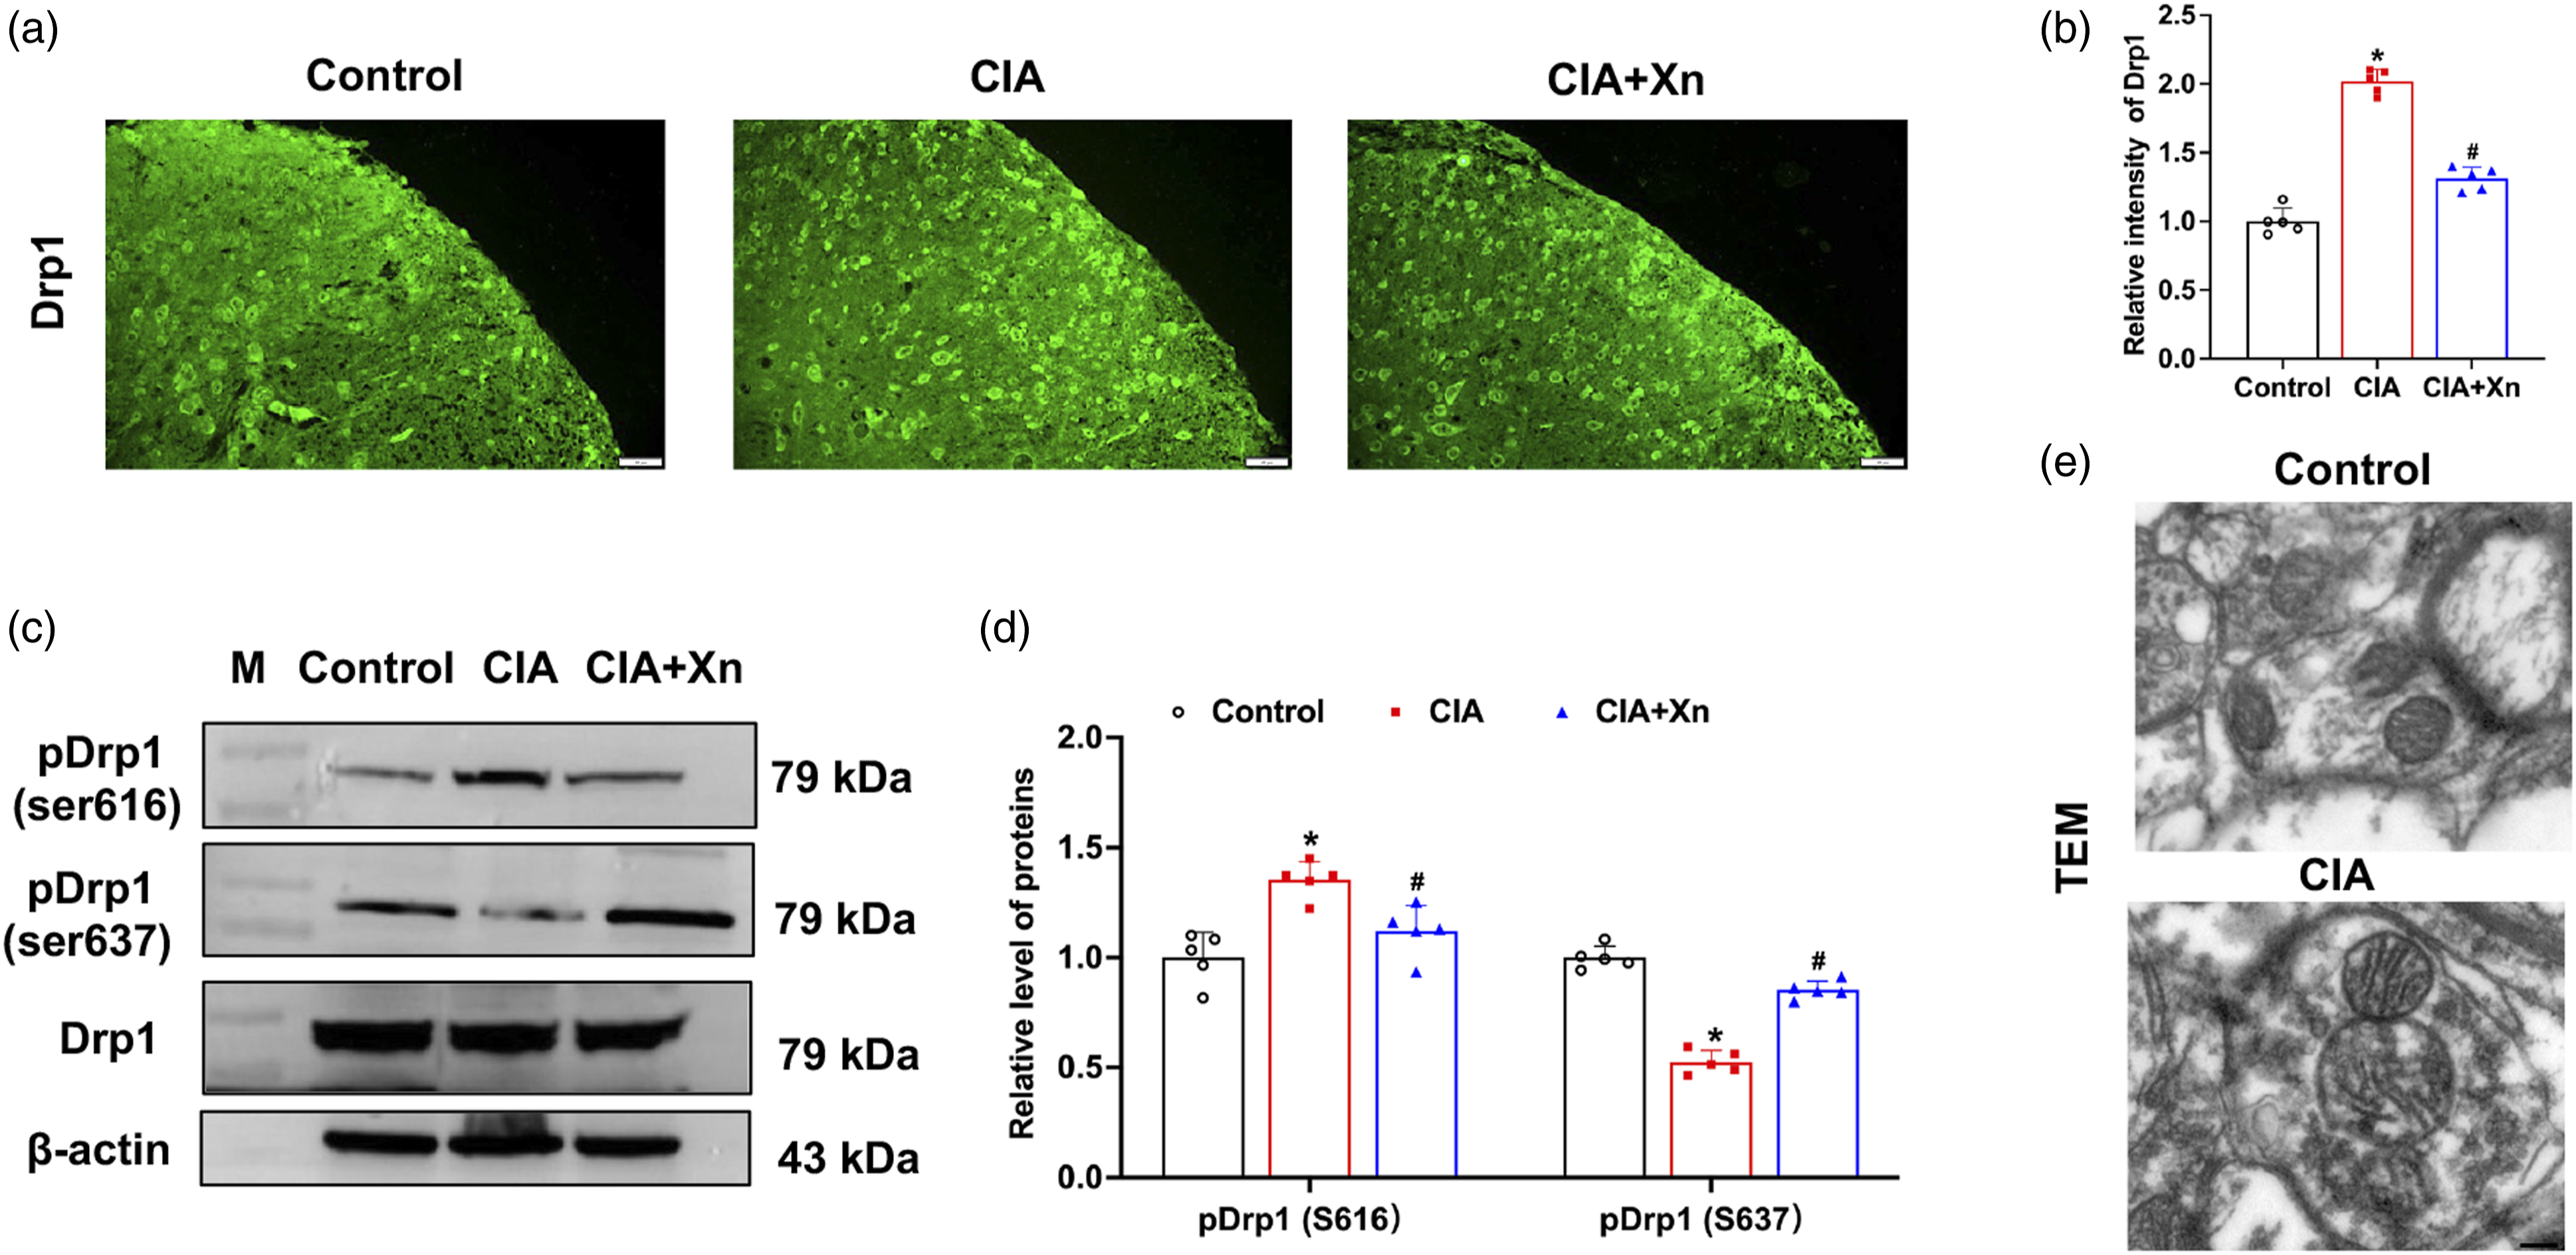

Xn suppresses mitochondrial and cytosolic reactive oxygen species levels in C6 cells
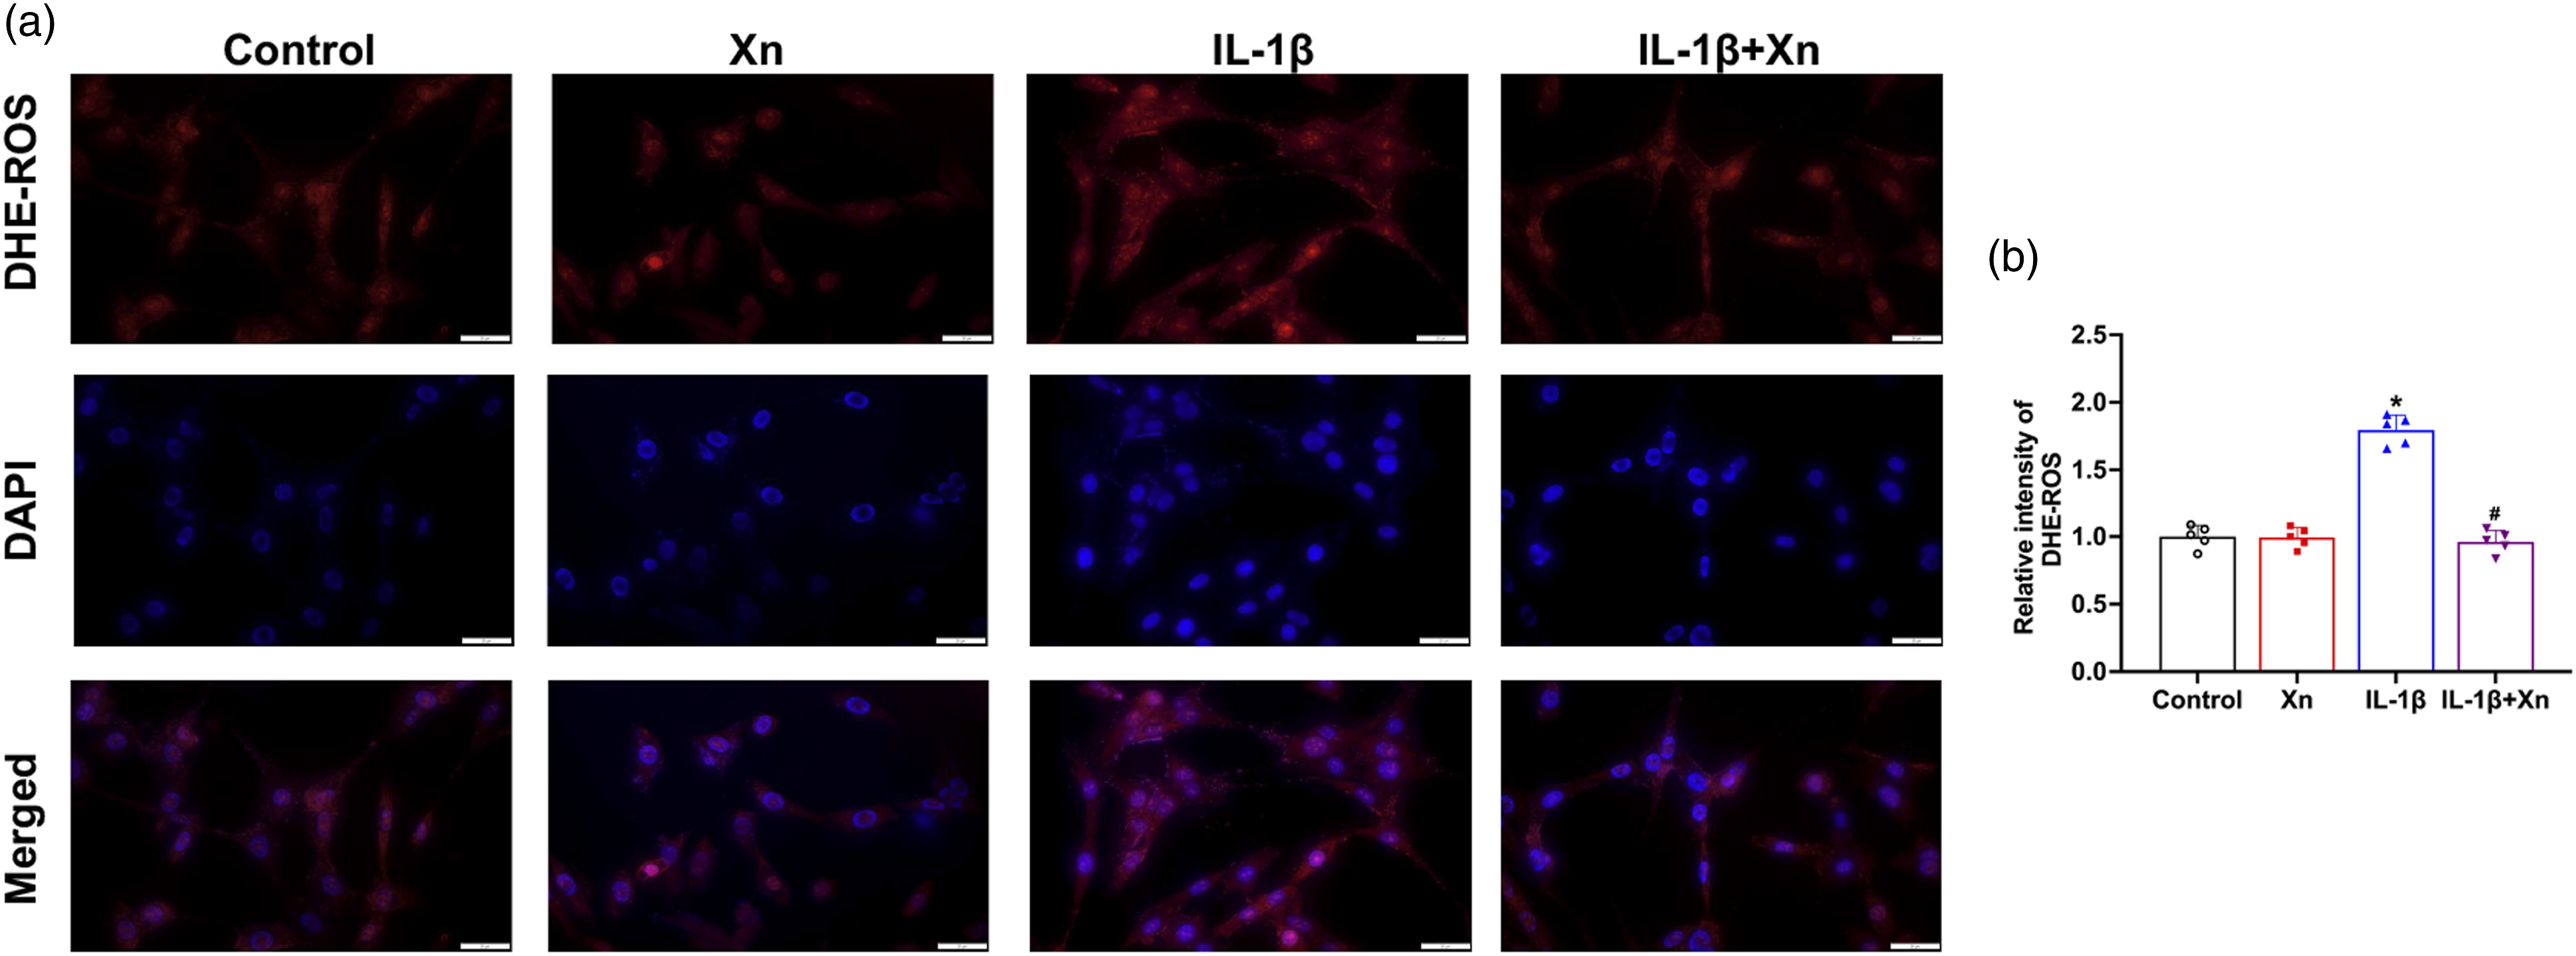
MMP changes were detected using a JC-1 indicator. J-aggregates report higher MMP and emits red fluorescence, while J-monomer reports lower MMP and emits green fluorescence. As can be seen in Figure 8(a), the IL-1β stimulation in C6 cells decreased the relative ratio of red to green fluorescence to 0.76 ± 0.08 (p < 0.05 vs Control group, Figure 8(b)), while Xn treatment increased the ratio of red to green fluorescence to 1.11 ± 0.07 (p < 0.05 vs IL-1β group, Figure 8(b)). MMP represents mitochondrial activity, which is detected by Mito-Tracker Red assay. As can be seen in Figure 8(c), IL-1β inducement resulted in significantly lower intensity, meaning MMP was damaged, while Xn treatment recovered fluorescence intensity. The relative fluorescence intensities of Mito-Tracker Red in IL-1β and IL-1β + Xn were 0.35 ± 0.07 (p < 0.05 vs control group) and 0.88 ± 0.07 (p < 0.05 vs IL-1β group, Figure 8(d)). Mitochondrial lipid peroxide changes were detected by MitoPeDPP, which presents as green fluorescence and binds with lipid peroxide in the mitochondrial inner membrane Figure 8(e). The mitochondrial lipid peroxide level was found to be significantly increased following IL-1β stimulation, with fluorescence intensity at 2.14 ± 0.09 (p < 0.05 vs Control group, Figure 8(f)), and Xn treatment decreased the level of mitochondrial lipid peroxide to 1.25 ± 0.10 (p < 0.05 vs IL-1β group, Figure 8(f)). In addition, cellular ROS level was detected using DHE dying, as can be seen in Figure 9(a),.The level of cellular ROS was significantly increased following IL-1β stimulation, with fluorescence intensity at 1.80 ± 0.11 (p < 0.05 vs Control group, Figure 9(b)), and Xn treatment decreased the ROS level to 0.96 ± 0.08 (p < 0.05 vs IL-1β group, Figure 9(b)). However, Xn was found to have no effect on the control cells. Effect of Xn treatment on the changes of mitochondrial ROS levels in C6 cells. (a)-(b) Representative fluorescence images (a) and quantitative analysis (b) of JC-1 in the control, Xn, IL-1β, IL-1β + Xn groups. (c)-(d) Representative fluorescence images (c) and quantitative analysis (d) of mito-tracker in the control, Xn, IL-1β, IL-1β + Xn groups. (e)-(f) Representative fluorescence images (e) and quantitative analysis (f) of MitoPeDPP in the control, Xn, IL-1β, IL-1β + Xn groups. Scale bar = 20 μm. Data are expressed as the mean ± SD (n = 5 mice/group). *p < 0.05 versus control group, #p < 0.05 versus IL-1β group. Effect of Xn treatment on the cellular ROS changes in C6 cells. (a)-(b) Representative fluorescence images (a) and quantitative analysis (b) of DHE in the control, Xn, IL-1β, IL-1β + Xn groups. Scale bar = 20 μm. Data are expressed as the mean ± SD (n = 5 mice/group). *p < 0.05 versus control group, #p < 0.05 versus IL-1β group.
Discussion
In this study, spinal AMPK expression and activity were both found to be reduced in CIA-induced mice. It has been reported that AMPK has emerged as a target for chronic pain treatment. 29 AMPK and its downstream kinases are responsible for the regulation of neuron excitability, neuroinflammation, and axonal and myelin regeneration. 30 Several AMPK activators, including AICAR, metformin, and resveratrol, have been found to reduce pain behavior in animal models. 31 At the same time, AMPK inhibitor Compound C and AMPKα shRNA treatment can reverse the analgesic effect of AICAR, the inhibition of IL-1β, and NF-κB activation. 32 It has also been demonstrated that Xn induces AMPK activation and its downstream signals as a means of protecting acute lung injury. 33 Xn activates the AMPK signaling pathway, increases mitochondrial biogenesis, and has potential therapeutic implications for obesity. 34 In this study, CIA inducement reduced AMPK activity in the spinal cords of mice, and Xn treatment was found to bind and activate AMPK. Xn has antinociception effect as a potential therapy for chronic arthritis pain through the activation of AMPK in the spinal cord.
Chronic arthritis pain is triggered by inflammatory signaling, and AMPK modulates spinal inflammation via several pathways. Evidence has shown that NLRP3 inflammasome activation is regulated by AMPK signal. AMPK inhibitors (compound C or sunitinib) activate NLRP3 inflammasome protein, increase the serum levels of interleukin-1β and IL-18, and provoke hyperalgesia in mice. 35 AMPK activator metformin inhibits NLRP3 inflammasome through the activation of the mTOR pathway, in addition to mediating autophagy and alleviating pyroptosis in type 2 diabetes. 36 Ulinastatin activates the AMPK signaling pathway, inhibits NLRP3 inflammatory activation, relieves inflammatory responses, and improves neurological function. 37 This study found that Xn treatment activates AMPK and reduces NLRP3 inflammasome activation. At the same time, AMPK performs an anti-inflammatory function through the regulation of Nrf2, which is a crucial player in the cellular defense against oxidative 38 and xenobiotic or nutrient stress and can be a therapy target for chronic pain. 39 Nrf2 inducers exert potent analgesic effects in a variety of murine models of chronic pain. 40 Nrf2 activator treatment activates the Nrf2/HO-1 signaling pathway in the spinal cord and dose-dependently attenuates mechanical allodynia in the paclitaxel-induced neuropathic pain model. Nrf2 deficiency aggravates the disease 41 in the rheumatoid arthritis animal model. 42 Nrf2 activation also results in immunoregulatory and anti-inflammatory effects. 43 Positive cooperativity has been observed between AMPK and Nrf2, and serine residues 374, 408, and 433 of Nrf2 are hyperphosphorylated by AMPK activation. 44 Nrf2 mediated antioxidative reaction negatively controls NLRP3 inflammasome activation. 45 In the ischemia and reperfusion injury model, the upregulation of Nrf2 reduces thioredoxin interacting protein expression, acting as a protective regulator against NLRP3 inflammasome activation. 46 It has also been reported that Xn activates the Nrf2 pathway and exerts chemoprotective activity in hepatocytes and a hepatocellular carcinoma cell line. 47 Xn analogues promote the nuclear accumulation of Nrf2, promote Nrf2 activation, and enhance the cellular antioxidant defense system. 48 In this study, Xn was found to activate AMPK and elevate Nrf2 expression and SOD activity.
The predominant source of intracellular ROS is mitochondria and ROS production is a result of the leakage of electrons from the electron transport chain during oxidative phosphorylation. 49 Mitochondrial dysfunction and ROS elevation have been observed in several types of neuropathic pain, including chemotherapy-induced peripheral neuropathy pain, chronic contractile injury pain, 50 and carrageenan-induced inflammatory pain. 51 Mitoquinone (MitoQ) treatment, which is a mitochondrial-targeted antioxidant, has been found to improve mitochondrial dysfunction, reduce the expression of pro-inflammatory cytokines, inhibit oxidative stress and apoptosis, and alleviate neuropathic pain in mice. 52 Drp1 is known to be the central mediator of mitochondrial fission and it is recruited to punctate spots on the mitochondrial surface as a means of promoting fission and causing mitochondrial fragment. 53 AMPK has been reported to play a crucial role in maintaining mitochondrial function. The pharmacological activation of AMPK using A-7,69,662 or AICAR directly phosphorylates MFF and Drp1 while also triggering mitochondrial fission. 54 AMPK activation suppresses protein kinase C and reduces the level of mitochondria-generated ROS. 55 In this study, Xn treatment was found to reduce mitochondrial-ROS levels in the spinal cords of CIA mice and C6 cells. It is suggested that Xn suppresses mitochondrial-ROS in the spinal cords of chronic arthritis pain model mice through the activation of the AMPK/Drp1 signaling pathway.
Conclusion
Spinal inflammation is triggered during rheumatoid arthritis processing, while, antioxidative defense is suppressed, and chronic pain persists. Xn treatment facilitates the activation of AMPK, elevating Nrf2 antioxidative signal, decreasing mitochondrial ROS level, reducing NLRP3 inflammasome reaction, and alleviating chronic arthritis pain (Figure 10). Schematic representation of the potential mechanisms of Xn administration on arthritis pain management. Xn activates AMPK, inhibits Drp1 mediated mitochondrial dysfunction, stimulates Nrf2 mediated antioxidative reaction, reduced spinal inflammation and relives arthritis pain.
Footnotes
Author contributions
Methodology: Qin Wang, Tao Chen, Shu-Qing Zhen. Validation: Liang-Zhu Yu, Ling Liu. Resources: Min Xie, Hai-Li Zhu. Data curation: Qin Wang, Tao Chen, Shu-Qing Zhen. Writing-original draft: Hai-Li Zhu. Visualization: Ling Liu, Min Xie. Supervision: Min Xie, Hai-Li Zhu. Project administration: Hai-Li Zhu. Funding acquisition: Min Xie, Hai-Li Zhu. All authors read and approved the final manuscript.
Declarations of Conflicting Interests
The author(s) declared no potential conflicts of interest with respect to the research, authorship, and/or publication of this article.
Funding
The author(s) disclosed receipt of the following financial support for the research, authorship, and/or publication of this article: This study was supported by the grants from Research Project of Hubei Provincial Department of Education (grant nos. B2022186 and B2022185 and ZY2023F109), Hubei University of Science and Technology Program (grant nos. BK202213, 2021WG06, 2022YKY02, 2022YKY09 and 2020TNB06).