
Abstract
Background
Irritable bowel syndrome (IBS) is a common functional gastrointestinal disorder, and its specific pathogenesis is still unclear. We have previously reported that TTX-resistant (TTX-R) sodium channels in colon-specific dorsal root ganglion (DRG) neurons were sensitized in a rat model of visceral hypersensitivity induced by neonatal colonic inflammation (NCI). However, the detailed molecular mechanism for activation of sodium channels remains unknown. This study was designed to examine roles for melatonin (MT) in sensitization of sodium channels in NCI rats.
Methods
Colorectal distention (CRD) in adult male rats as a measure of visceral hypersensitivity. Colon-specific dorsal root ganglion (DRG) neurons were labeled with DiI and acutely dissociated for measuring excitability and sodium channel current under whole-cell patch clamp configurations. Western blot and Immunofluorescence were employed to detect changes in expression of Nav1.8 and MT2.
Results
The results showed that rats exhibited visceral hypersensitivity after NCI treatment. Intrathecal application of melatonin significantly increased the threshold of CRD in NCI rats with a dose-dependent manner, but has no role in the control group. Whole-cell patch clamp recording showed that melatonin remarkably decreased the excitability and the density of TTX-R sodium channel in DRG neurons from NCI rats. The expression of MT2 receptor at the protein level was markedly lower in NCI rats. 8MP, an agonist of MT2 receptor, enhanced the distention threshold in NCI rats. Application of 8MP reversed the enhanced hypersensitivity of DRG neurons from NCI rats. 8MP also reduced TTX-R sodium current density and modulated dynamics of TTX-R sodium current activation.
Conclusions
These data suggest that sensitization of sodium channels of colon DRG neurons in NCI rats is most likely mediated by MT2 receptor, thus identifying a potential target for treatment for chronic visceral pain in patients with IBS.
Keywords
Introduction
Irritable bowel syndrome (IBS) is a chronic functional disease characterized by gastrointestinal disorders. The clinical manifestation of IBS is chronic intermittent or persistent abdominal pain, accompanied by diarrhea, constipation and increased mental stress. However, the patient did not have obvious intestinal biochemical abnormalities.1-3 According to defecation habits, IBS patients can be divided into three categories: constipation type (IBS-C), diarrhea type (IBS-D) and mixed type (IBS-M). The incidence rate of the disease accounts for 20% of the world’s population, of which female patients account for the majority. Patients’ living conditions and quality of life have been seriously affected.4,5 However, the etiology of IBS is not clear, and there is a lack of effective understanding of its pathogenesis. Which results in slow progress in clinical prevention and treatment. 6 Previous studies in our laboratory have shown that neonatal colonic inflammation (NCI) can induce visceral pain response and visceral hyperalgesia in adult rats,7,8 NCI model, that is, colitis stimulation or trauma is given to rats in the neonatal period. In adult rats, visceral pain sensitivity increases, but it will not cause inflammatory reaction of intestinal mucosa. The model can be replicated stably in experiments, and has been a classic model applied to the study of visceral pain. Therefore, this experiment selects the NCI model as the experimental model to explore.
Melatonin (MT) is an amine hormone secreted by the pineal gland, which widely exists in organisms, from algae to higher mammals to humans. MT mediates a variety of physiological processes, including circadian rhythm regulation, sleep, and acts as an antioxidant.9-13 MT has been identified in mast cells, leukocytes, platelets and primary sensory neurons.13-15 At the same time, MT has also been proved to play a role in a series of chronic pain, such as migraine, fibromyalgia, irritable bowel syndrome.16-18 MT receptors are expressed in primary afferent neurons involved in nociceptive signal transduction, and MT can produce analgesic effect in animal models. This is consistent with the results of clinical trials that MT can reduce headache before going to bed. These results prove that MT has analgesic effect.16,19
MT receptors are divided into three subtypes, including two membrane receptors (MT1R, MT2R) and one nuclear receptor (MT3R).20,21 Previous studies have shown that MT has almost all kinds of pathophysiological effects through its receptors. 22 Most of the literature on the effect of MT on pain shows that MT acts through its two membrane receptors. In mammals, two MT receptors including type 1 and type 2 have been confirmed to exist. 23
Sensitization of primary sensory neurons is maintained by a number of ion channels such as voltage-gated sodium (VGSCs), potassium (VGPCs) and calciumchannels (VGCCs),24-27 transient receptor potential channels and P2X3 receptors.28,29 Nav1.8 is a subtype of voltage-gated sodium channels (VGSCs) which are integral membrane glycol-proteins. Previous studies in our laboratory showed that the expression of Nav1.8 was up-regulated in the model of chronic visceral pain. 25 Therefore, we speculate that MT can alleviate chronic visceral pain by inhibiting the overexpression of Nav1.8 and the sensitivity of nociceptive neurons. As part of an ongoing investigation, we focused on roles of MT in modulating expression and function of VGSCs of colon DRG neurons. Our findings indicated that MT significantly suppressed Nav1.8 expression, reduced TTX-R current density, and lowered neuronal excitability in NCI rats. Therefore, our study implicate that MT plays an analgesic role by regulating sodium channel activity in NCI model rats, and it is identified as a potential molecular target for the treatment of visceral pain in this situation.
Materials and methods
Animals
Male Sprague Dawley (SD) rats, 150–200 g body weight, were housed in plastic cages and under controlled conditions (a 12 h light–dark cycle from 8:00 to 20:00, room temperature: 24 ± 2°C) with a standard rodent diet and fresh water. Care and handling of these animals were approved by the Institutional Animal Care and Use Committee of the Soochow University and were strictly in accordance with the guidelines of the International Association for the Study of Pain. All efforts were made to minimize the suffering and the number of animals. Visceral hypersensitivity was induced by neonatal colonic injection of diluted acetic acid, as described previously. 7 In short, 10-days old pups received an infusion of 0.5% acetic acid solution in 0.2 mL into the colon 2 cm from the anus. Control rats received an equal volume of normal saline (NS). Experiments were performed on these rats at 6–8 weeks of age.
Measurement of visceral hyperalgesia response
Visceral hyperalgesia was measured at the age of 6 wk by recording the threshold of CRD as described previously.30,31 Briefly, anesthetized with isoflurane (RWD, Shenzhen, China), a flexible latex balloon (6 cm) attached to a tygon tubing was inserted 8 cm into the descending colon and rectum via the anus and held in place by taping the tubing to the tail. Rats were placed in small lucite cubicles and allowed to adapt for 30 min. To minimize the possible insult from the repetitive distention stimuli of the colon, distention threshold (DT) was measured. DT was the minimal distention pressure to evoke abdominal visceromotor response. It was recorded in millimeters mercury by giving a steady increase in distention pressure by a sphygmomanometer. Blind method was used in all behavioral tests.
Drug administration
Melatonin (MT) first dissolved in dimethyl sulfoxide (1 mg/mL), and then diluted to the target concentration with 0.9% normal saline (1 nM, 10 nM, 100 nM, intrathecally, i.t.) was directly injected into CON or NCI rats once times or once daily for consecutive 7 days for behavioral experiments, molecular expression and electrophysiological experiments. 8-M-PDOT (8MP, a selective melatonin MT2 receptor agonist: 10 nM, 100 nM, 1000 nM, intrathecally, i.t.) was directly injected into the NCI rats once times or once daily for consecutive 7 days for behavioral experiments, molecular expression and electrophysiological experiments.
Western blotting
DRGs (T13–L2) from NCI-treated rats (6–8 wk) or age-matched control rats were dissected out and lysed in 100 μL MT-cellytics with 1% PIC (Bocai, Shanghai, China) and then ground on ice until there was no precipitation. Stand on the ice for 2 h to fully decompose the tissue. The cell lysates were then microfuged at 15,000 rpm for 30 min at 4°C. The concentration of protein in homogenate was determined using a BCA reagent (Beyotime, Shanghai, China). Calculate the amount of protein sample according to the measured protein concentration and then conduct SDS-PAGE gel electrophoresis (Bio-Rad, Hercules, CA). After electrophoresis, the proteins were electrotransferred onto polyvinyldifluoride membranes (Millipore, Massachusetts, USA) at 200 mA for 2 h at 4°C. Membranes were incubated in 25 mL of blocking buffer (1xTBS with 5% wt/vol fat-free dry milk) for 2 h at room temperature and then incubated with the primary antibodies for 2 h at room temperature. The primary antibodies used were anti-GAPDH (1:1000; Hangzhou Goodhere Biotechnology, Hangzhou, Zhejiang, China), anti-MT2 (1:500; Abcam, Cambridge, England) and anti-Nav1.8 (1:200, Alomone Labs, Jerusalem, Israel). After incubation, membranes were washed with TBST (1xTBS and 5% Tween 20) three times for 15 min each and incubated with anti-rabbit peroxidase-conjugated secondary antibody (1:50,000; Jackson, USA) or anti-mouse horseradish peroxidase-conjugated secondary antibody (1:50,000; Jackson, USA) for 2 h at room temperature. The membranes were then washed with TBST three times for 15 min each. Put the strip on the gel imager, configure ECL chemiluminescence reagent solution (ECL kit; Tanon, Shanghai, China) to drop evenly on the strip, and use Image Lab software to develop. All samples were normalized to GAPDH as a control.
Cell labeling
Colon-specific DRG neurons were labeled by injection of 1, 1′-dioleyl-3, 3, 3′, 3-tetramethylindocarbocyanine methanesulfonate (DiI; Invitrogen) into the colon wall. 31 In brief, when the rats were 5 wk old, they were anesthetized with isoflurane. The abdomen was opened by midline laparotomy, and the colon was exposed. DiI, 25 mg in 0.5 mL methanol, was injected in an ∼1 μL volume at 10 sites on the exposed colon extending from the level of the bladder to about 6 cm in an oral direction. To prevent leakage and possible contamination of adjacent organs with the dye, the needle was left in place for 1 min, and each injection site was washed with NS following each injection. The colon was gently swabbed before closing of the abdomen. Animals were returned to their housing and given free access to drinking water and standard food pellets.
Immunofluorescence studies
Ten days after DiI injection, control and NCI rats were perfused transcardially with 150 mL phosphate-buffered saline followed by 150 mL ice-cold 4% paraformaldehyde in PBS. DRGs (T13-L2) were removed and post fixed for 4 h in PFA and then gradiently dehydrate with 20% and 30% sucrose (24 h each, sink to the bottom as the sign of dehydration completion). 14 μm frozen sections contained DRGs (T13-L2) area were used in immunofluorescence study as described previously. 32 The primary antibodies were anti-MT2 (1:200; Abcam, Cambridge, England), anti-Nav1.8 (1:200, Alomone Labs, Israel). The secondary antibodies were Alexa Fluor 488 (1:100, Life Technologies Inc.) and Alexa Fluor 555 (1:500, Life Technologies Inc.). Images were captured with AXIO SCOPE A1 (20X, ZEISS, Oberkochen, Germany).
Acute dissociation of DRG neurons and whole-cell patch clamp recording
Ten days after DiI injection, NCI (6–8 wk) or age-matched control rats were killed by cervical dislocation, as described previously. 29 DRGs (T13–L2) were bilaterally dissected out and transferred to an ice-cold, oxygenated fresh dissecting solution containing (in mM): 130 NaCl, 5 KCl, 2 KH2PO4, 1.5 CaCl2, 6 MgSO4, 10 glucose, and 10 HEPES, pH 7.2 (osmolarity: 305 mOsm). After removal of the connective tissue, the ganglia were transferred to a 5 mL dissecting solution containing collagenase D (1.8–2.0 mg/mL; Roche, Indianapolis, Indiana, USA) and trypsin (1.2–1.5 mg/mL; Amresco, USA) and incubated for 1.5 h at 34.5°C. DRGs were taken from the enzyme solution, washed, and transferred to 0.5 mL of the dissecting solution containing DNase (0.5 mg/mL; Sigma). A single cell suspension was subsequently obtained by repeated trituration through flame-polished glass pipettes. Cells were plated onto acid-cleaned glass cover slips. Cover slips containing adherent DRG cells were put in a small recording chamber (1 mL volume) and attached to the stage of an inverted microscope (Olympus IX71) fitted for both fluorescence and bright-field microscopy. DiI-labeled neurons were identified by their fluorescence under the fluorescent microscope.
For the patch-clamp recording experiments, cells were continuously cultured at room temperature with normal external solution containing (in mM): 130 NaCl, 5 KCl, 2 KH2PO4, 2.5 CaCl2, 1 MgCl2, 10 HEPES, and 10 glucose, with pH adjusted to 7.2 with NaOH, osmolarity: 295–300 mOsm. Recording pipettes were pulled from borosilicate glass tubing using a horizontal puller (P-97; Sutter Instruments, USA). Unless indicated, patch-clamp pipettes had a resistance of 5–10 MΩ when filled with the pipette solution containing (in mM): 140 K-gluconate, 10 NaCl, 10 HEPES, 10 glucose, 5 EGTA, and 1 CaCl2, pH 7.25 adjusted with KOH; osmolarity: 290–295 mOsm. Resting potential and APs were recorded. The voltage was clamped at −60 mV by a HEKA EPC10 patch-clamp amplifier (HEKA Electronik GmBH; Germany). The leak currents at −60 mV were always <20 pA and were not corrected. The currents were filtered at 2–5 kHz and sampled at 50 or 100 μs/point. Whole cell current and voltage were recorded with a HEKA EPC10 patchclamp amplifier; and data were acquired and stored on a computer for later analysis using FitMaster (HEKA Electronik GmBH; Germany).
Isolation of Nav currents
To record Nav currents, amplifier was switched to the voltage clamp configuration. Neurons were superfused (2 mL/min) at room temperature with an external solution, containing (in mM): 60 NaCl, 80 choline chloride, 0.1 CaCl2, 10 HEPES, 10 tetraethylammonium-Cl, 10 glucose, 0.1 CdCl2 (pH = 7.4, adjustedwith tetraethylammonium-OH, osmolarity: 300 mOsm). The patch electrode had a resistance of 3–5 MΩ when filled with the pipette solution containing (inmM): 140 CsF, 1 MgCl2, 5 EGTA, 3 Na-GTP, 10 glucose, 10 HEPES, pH = 7.2, adjusted with CsOH, osmolarity: 285–295 mOsm. TTX-sensitive (TTX-S) and TTX-resistant (TTX-R) were separated by superfusing of external solution containing TTX (0.5 μM). The total sodium currents were recorded in response to depolarization steps to different testing potentials from −70 mV to +50 mV in 10 mV increments with a duration of 80 ms. TTX-R current was recorded using the above testing potentials from a holding potential of −60 mV in the presence of 0.5 μM TTX. To control for changes in cell size, the current density was measured by dividing the peak current amplitude by whole cell membrane capacitance (pA/pF), which was obtained by reading the value for whole cell input capacitance cancelation directly from the patch-clamp amplifier. To examine TTX-R channel conductance, activation curves were generated by voltage pulses in 10 mV steps from −70 mV to +30 mV and inactivation curves were generated by voltage pulses in 10 mV steps from −90 mV to +30 mV. The reversal potentials of sodium channels were measured directly or by extrapolation if necessary.
Data analysis
Origin 8 software (Origin Lab, Massachusetts, USA) and Prism 8 (GraphPad, California, USA) were used for statistical analysis. All data were represented as mean ± SEM, and the error line in the chart represented SEM. All data have been tested for normal distribution before analysis. Kruskal-Wallis ANOVA followed by Tukey post-hoc test, two-way repeated measures ANOVA followed by Tukey post-hoc test, two-sample t-test and Mann-Whitney test have been used to determine significance. A one-way repeated measures ANOVA followed by Bonferroni post-hoc test was also used for comparison. p < 0.05 was considered statistically significant.
Results
Melatonin intensifies CRD threshold in NCI rats
In the present study, we firstly confirmed that NCI induces chronic visceral hypersensitivity (CVH) in adult rats, which was consistent with our previous study.
7
CVH was determined by measuring CRD threshold at 6 wk of age from control and NCI rats (Figure 1(a)). The CRD threshold of NCI rats was significantly decreased (Figure 1(b), n = 10 rats for each group, *p < 0.05 compared to CON, one-way repeated-measures ANOVA followed by Bonferroni post-hoc test). To determine whether melatonin (MT) activity was involved in NCI induced visceral hypersensitivity, melatonin was administrated intrathecally (i.t.). Injection of melatonin significantly increased CRD threshold in NCI rats, in a dose-dependent fashion (Figure 1(c), n = 8 for each group, *p < 0.05, **p < 0.01, ***p < 0.001 vs. NS, Tukey post-hoc test following Kruskal-Wallis ANOVA). The optimized dose for melatonin to produce the maximal effect was 10 nM in this study. We then determined the time course of melatonin effects. NCI rats received an intrathecal injection of melatonin (10 nM) or NS at the same volume once a day for 7 consecutive days. The effect of melatonin at doses of 10 nM lasted for 2 d (Figure 1(d), n = 8 for each group; *p < 0.05, **p < 0.01, ***p < 0.001 vs. NS, Tukey post-hoc test following two-way repeated-measures ANOVA). To further determine the pharmacological effect of melatonin, we injected melatonin (10 nM, i.t.) to CON group for one time. The results showed that MT has no pharmacological effect on CON group (Figure 1(e), n = 5 for each group; p > 0.05, Tukey post-hoc test following two-way repeated-measures ANOVA). These data suggest that melatonin significantly increase colorectal distension threshold in NCI rats with a dose-dependent fashion. Melatonin intensifies CRD threshold in NCI rats. (a) The experimental protocol of NCI modeling and CRD test. (b) The CRD threshold of NCI rats was significantly lower than CON rats (n = 10 rats for each group, *p < 0.05 compared to CON, one-way repeated-measures ANOVA followed by Bonferroni post-hoc test). (c) MT treatment markedly increased the CRD threshold in NCI rats with a dose-dependent fashion (n = 8 for each group, *p < 0.05, **p < 0.01, ***p < 0.001 vs. NS treatment, Tukey post hoc test following Kruskal-Wallis ANOVA). (d) A dose of melatonin (10 nM) injected once daily for 7 days significantly attenuated chronic visceral pain in NCI rats, and the effect can lasted for 2 days (n = 8 for each group, *p < 0.05, **p < 0.01, ***p < 0.001 vs. NS treatment, Tukey post hoc test following two-way repeated-measures ANOVA). (e) A dose of melatonin (10 nM) injected once times had no effect on CON rats (n = 5 for each group, p > 0.05, Tukey post-hoc test following two-way repeated-measures ANOVA).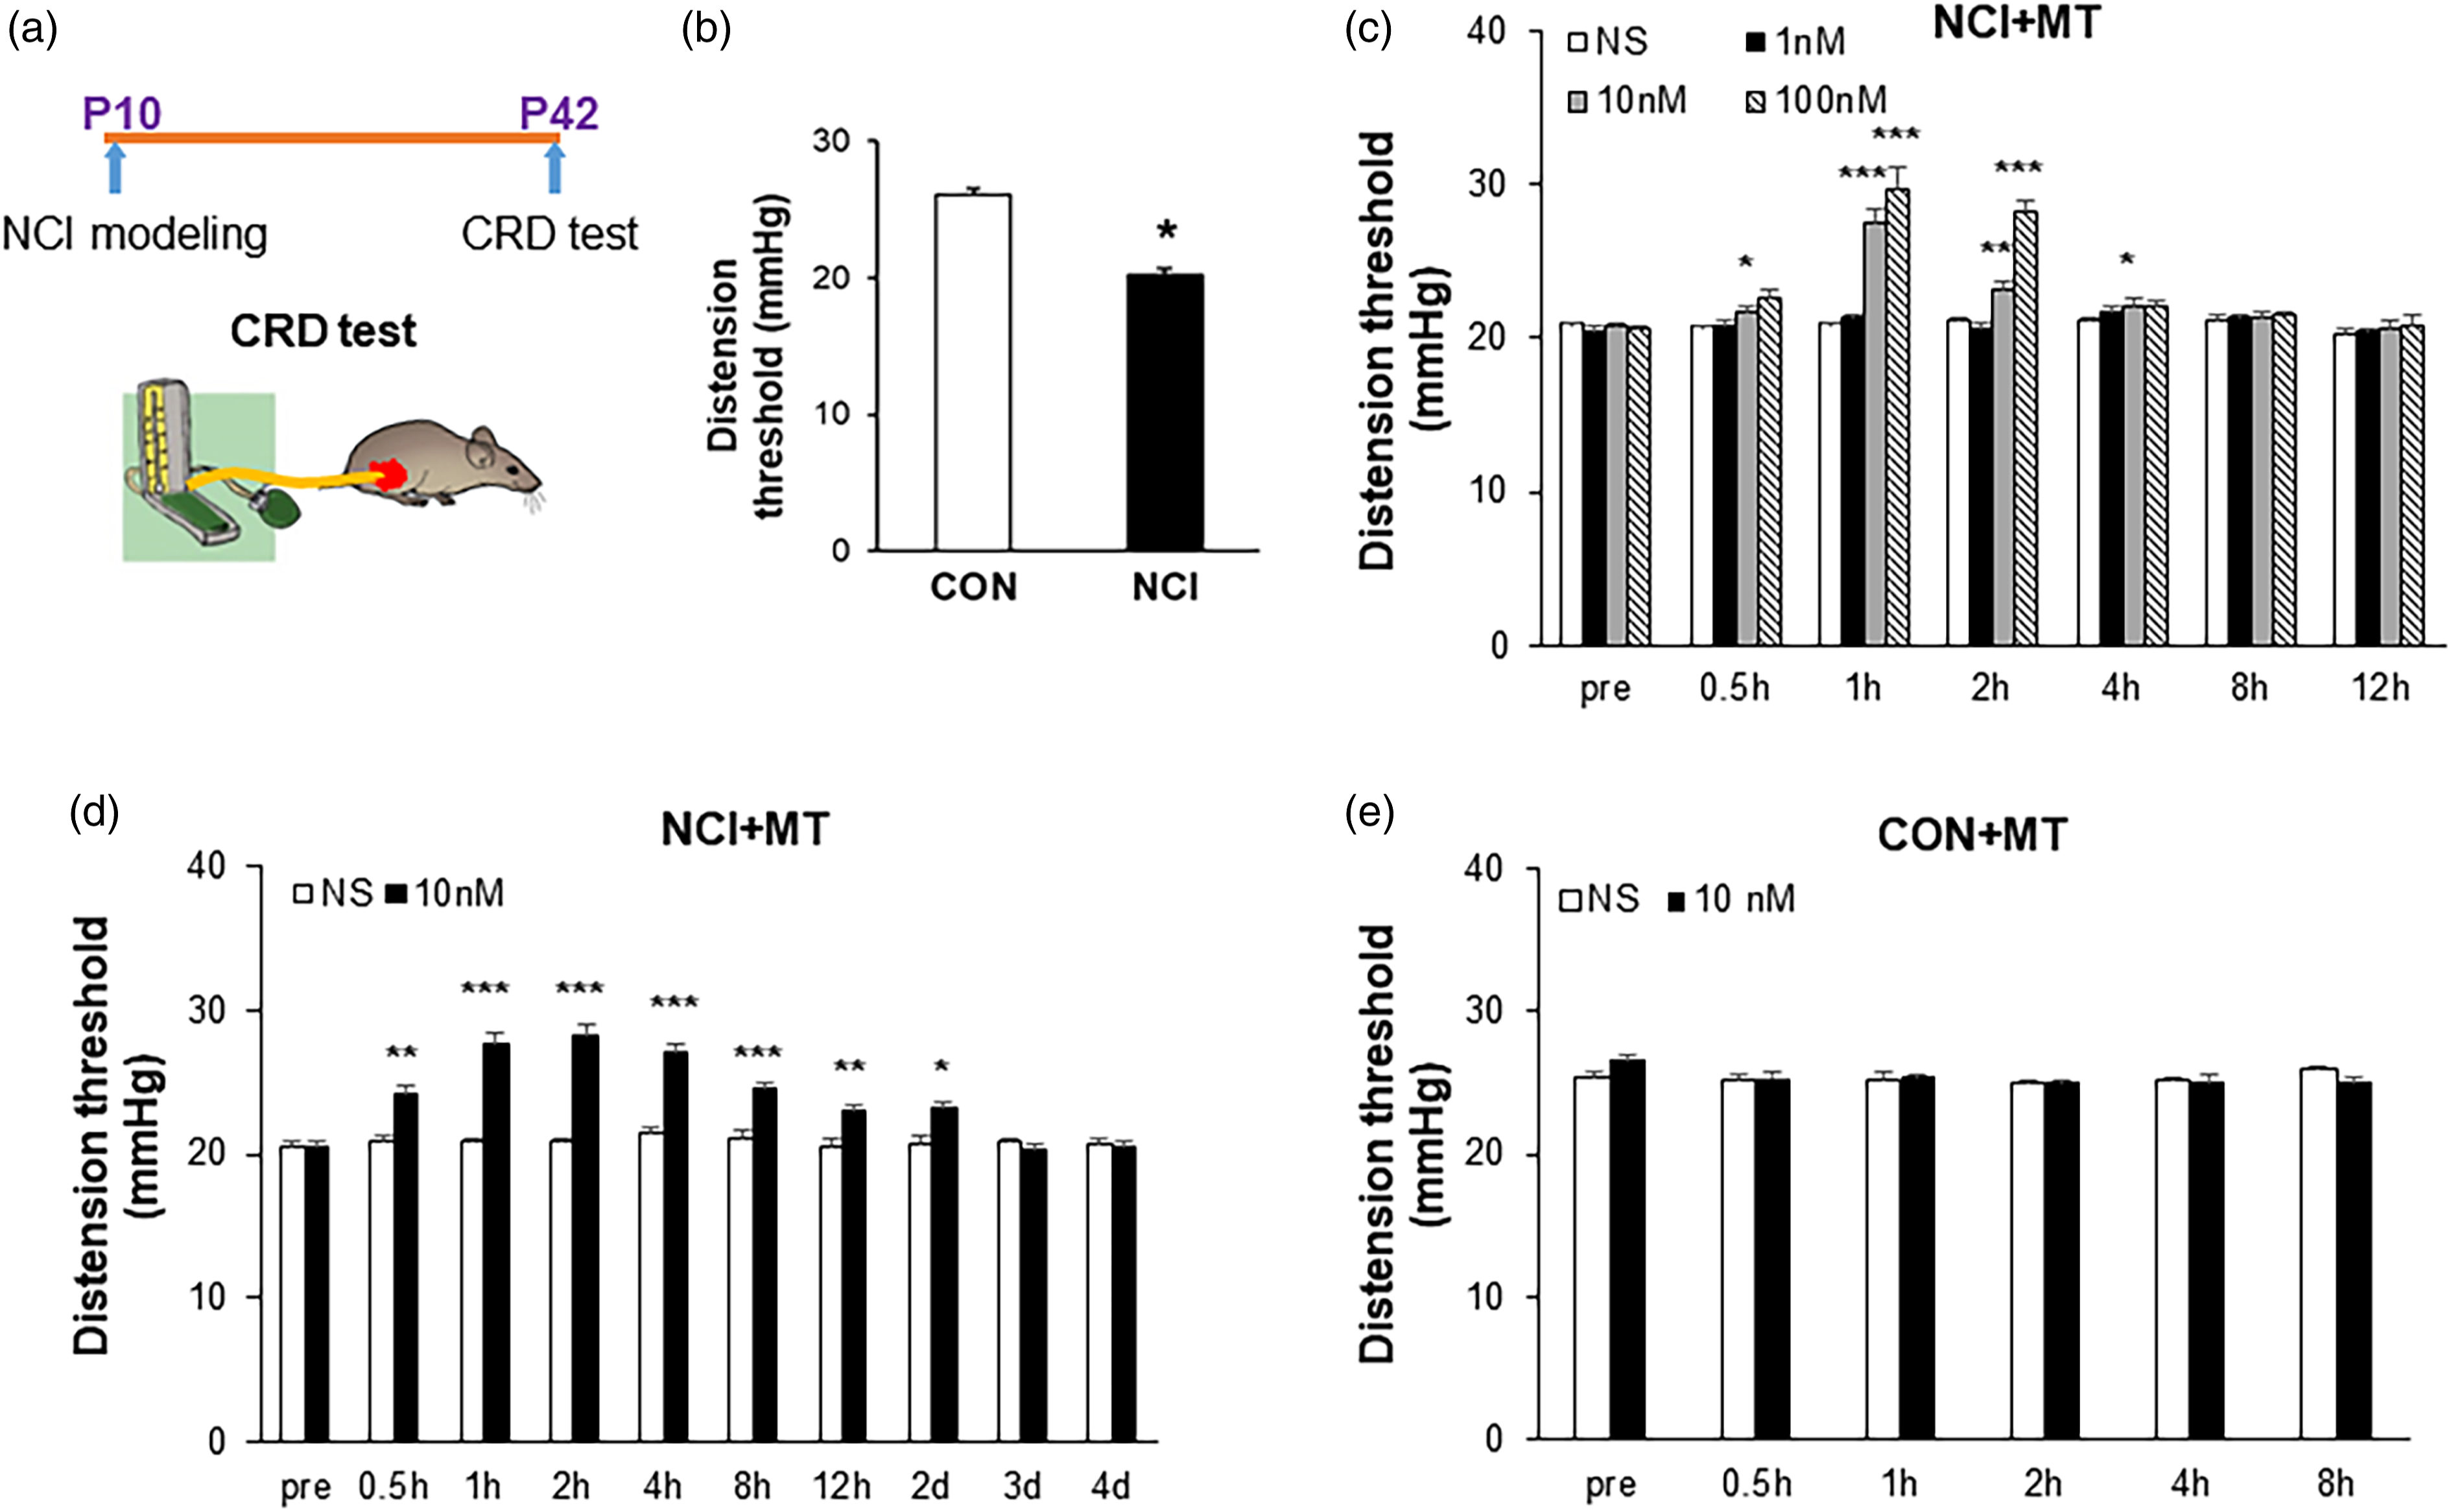
Melatonin treatment reverses hyperexcitability of colonic DRG neurons induced by NCI
Since melatonin attenuates NCI-induced CRD responses, we investigated whether melatonin affects the excitability of colonic DRG T13-L2 neurons derived from NCI rats. Under current-clamp conditions, colon-specific DRG neurons of NCI rats treated with NS (n = 5 rats) or MT (n = 5 rats) were recorded (Figure 2(a)). Resting Potentials (RPs) were −49.4 ± 0.9 and −53.8 ± 1.0 mV for the NS- and MT-treated groups, respectively. Therefore, MT treatment significantly hyperpolarized RPs (Figure 2(b), n = 24 and 20 cells from NS- and MT-treated groups, respectively, ***p < 0.001 compared to NS, two-sample t-test). The rheobase measurements were 0.018 ± 0.002 and 0.045 ± 0.005 nA for the NS- and MT-treated groups, respectively. The administration of MT markedly increased rheobase (Figure 2(c), n = 24 and 20 cells from NS- and MT-treated groups, respectively, ***p < 0.001 compared to NS, two-sample t-test). The action potential (AP) thresholds were −32.5 ± 0.5 and −26.4 ± 0.8 mV for NS- and MT-treated groups, respectively. The MT treatment also increased the AP thresholds (Figure 2(d), n = 24 and 20 cells from NS- and MT-treated groups, respectively, ***p < 0.001 compared to NS, two-sample t-test). MT treatment also greatly decreased the number of APs evoked by 2X and 3X rheobase current stimulation (Figures 2(e) and (g), n = 24 and 20 cells from NS- and MT-treated groups, respectively, **p < 0.01 compared to NS, two-sample t-test). The numbers of AP evoked by 2X rheobase current stimulation were 2.9 ± 0.2 and 1.7 ± 0.2 for NS- and MT-treated groups, respectively. The numbers of AP evoked by 3X rheobase current stimulation were 4.0 ± 0.4 and 2.7 ± 0.2 for NS- and MT-treated groups, respectively. In addition, MT treatment greatly reduced the number of APs evoked by 100, 300 and 500 pA ramp current stimulation. The numbers of APs evoked by 100 pA ramp current stimulation were 11.7 ± 1.5 and 3.7 ± 1.5 for the NS- and MT-treated groups, respectively. The numbers of APs evoked by 300 pA ramp current stimulation were 20.8 ± 2.1 and 8.6 ± 2.0 for the NS- and MT-treated groups, respectively. The numbers of APs evoked by 500 pA ramp current stimulation were 25.8 ± 2.8 and 13.8 ± 2.2 for the NS- and MT-treated groups, respectively. MT treatment remarkably reduced the numbers of APs in response to ramp current stimulation (Figures 2(f) and (h), n = 24 and 20 cells from NS- and MT-treated groups, respectively, ***p < 0.001 compared to NS,two-sample t-test). Melatonin treatment reverses hyperexcitability of colonic DRG neurons induced by NCI. (a) Colon-specific neurons of T13-L2 DRGs (arrow) retrogradely labeled by 1, 1′-dioleyl-3,3,3′,3′-tetramethylindocarbocyanine methanesulfonate (DiI) viewed under fluorescence microscope and bright field. Asterisk: non-DiI labeling cell. Scale bar:10 μm. (b) MT treatment significantly hyperpolarized the resting membrane potential (RPs) in DiI-labeled DRG neurons of NCI rats (n = 24 and 20 cells from NS- and MT-treated groups respectively, ***p < 0.001, compared to NS treatment group, two-sample t-test). (c) MT treatment resulted in a marked increase of the rheobase in DRG neurons of NCI rats (n = 24 and 20 cells from NS- and MT-treated groups respectively, ***p < 0.001, compared to NS treatment group, two-sample t-test). (d) MT treatment markedly increased action potentials (APs) thresholds (n = 24 and 20 cells from NS- and MT-treated groups respectively, ***p < 0.001, compared to NS treatment group, two-sample t-test). (e) Representative traces of APs induced by 300-ms depolarizing current injection (below each trace) at 2X rheobase (left) and 3X rheobase (right) in DRG neurons from NS treatment group (top) and MT treatment group (bottom) of NCI rats under current-clamp condition. MT treatment resulted in a significant decrease in the number of APs induced by a 2X rheobase and 3X rheobase current injection in DRG neurons. (g) Bar graph showing the average number of APs elicited by 2X and 3X rheobase current injection in these same groups of neurons (n = 24 and 20 cells from NS- and MT-treated groups respectively, **p < 0.01 vs. NS treatment, two-sample t-test). (f) Ramp stimulation. Representative traces of APs induced by 100 ms depolarizing current injection (below each trace) at 100 pA, 300 pA and 500 pA ramp stimulation in DRG neurons from NS treatment group (top) and MT treatment group (bottom) of NCI rats under current-clamp condition. MT treatment resulted in a significant decrease in the number of APs induced by a 100 pA, 300 pA and 500 pA ramp stimulation current injection in DRG neurons. (h) Bar graph showing the average number of APs elicited by 100 pA, 300 pA and 500 pA ramp stimulation current injection in these same groups of neurons (n = 24 and 20 cells from NS- and MT-treated groups respectively, ***p < 0.001 vs. NS treatment, two-way repeated-measures ANOVA followed by Bonferroni post-hoc test).
Melatonin reduces TTX-R sodium current density and modulates dynamics of TTX-R sodium current activation
Since melatonin reversed the hyperexcitability of colon-specific DRG neurons of NCI rats, we next investigated whether melatonin treatment suppressed current density of VGSCs in colon-specific DRG neurons. NCI rats were divided into two groups: NCI+MT group (n = 4 rats) treated with melatonin (10 nM, i.t.) and NCI+NS group (n = 4 rats) treated with the same volume of NS (i.t.). The total sodium current density was −225.3 ± 15.4 pA/pF (n = 10 cells) and −121.8 ± 10.0 pA/pF (n = 8 cells) for NS- and MT-treated group, respectively. MT treatment significantly reduced total sodium current density when compared with that of NS group (Figure 3(a), (b) and (c), *p < 0.05, two-sample t-test). To further determine the roles for MT on TTX-R current densities, TTX (0.5 μM) were used to identify TTX-R and TTX-S sodium currents in the present experiment. At the same voltage protocol as described above, TTX-R sodium currents were recorded in the presence of 0.5 μM TTX (Figure 3(d)). The peak current voltage (I–V) curves for TTX-R current were shown in Figure 3(e). TTX-R sodium current density was remarkably decreased in MT-treated rats (Figure 3(f), NS: −148.9 ± 17.8 pA/pF, n = 10 cells; MT: −95.2 ± 15.5 pA/pF, n = 8 cells, *p < 0.05, two-sample t-test). Because inhibition of peak current density of TTX-R sodium current was evident, we next characterized the effect of MT on voltage dependence of TTX-R currents of colon-specific DRG neurons. Activation dependence was constructed from I-V curves of neurons from NS and MT-treated NCI rats (Figure 3(g)). Currents at various test pulses were divided by the driving force for Na+ and the resulting conductance (G) was expressed as a percentage of that achieved at +30 mV for each condition. The G-V relationship curves were fitted with a modified Boltzmann equation. MT treatment led to a ∼10 mV positive shift in the steady state activation curve. The shift of the activation curve in a more depolarizing direction prevents the channel to open in response to weaker depolarization. We next determined the effect of MT on voltage dependence of steady-state inactivation of TTX-R sodium channels of colon-specific DRG neurons. The membrane potential was held at −60 mV and voltage steps were from −90 mV to +30 mV with 10 mV increments and 80 ms duration. Inactivation curves were obtained by plotting TTX-R sodium current during the test pulse (+20 mV) against the membrane potentials during the conditioning pulse. TTX-R sodium current was normalized to Imax during the test pulse to +20 mV after a conditioning pulse to −90 mV. Data were fitted with the negative Boltzmann function (Figure 3(h)). MT treatment did not significantly alter the inactivation curve, indicating the same channel availability in the potential domain between −50 mV and −10 mV of colon-specific DRG neurons from these two groups of rats. Melatonin reduces TTX-R sodium current density and modulates dynamics of TTX-R sodium current activation. (a) For total voltage-gated Na+ (Nav) current, the membrane potential was held at −60 mV and voltage steps were from −70 to +50 mV with 10-mV increments and 80-ms duration. (b) Peak currents (Ipeak) of total current. (c) Bar graphs showing the mean peak current densities of total voltage-gated Na+ (Nav) current. (NS: n = 10 cells, MT: n = 8 cells, *p < 0.05, Mann-Whitney test). (d) For sustained TTX-R sodium current, the voltage steps were the same as those for the total voltage-gated Na+ (Nav) current. (e) Peak currents (Ipeak) of TTX-R current. (f) Bar graphs showing the mean peak current densities of TTX-R voltage-gated Na+ (Nav) current. (NS: n = 10 cells, MT: n = 8 cells, *p < 0.05, Mann–Whitney test). The current density (in pA/pF) was calculated by dividing the current amplitude by cell membrane capacitance. MT treatment significantly decreased density of total voltage-gated Na+ (Nav) current in DiI-labeled neurons compared with the NS treatment group. Current subtraction revealed that MT treatment significantly decreased the TTX-R sodium current density compared with NS treatment group. (g) For activation curves, TTX-R sodium current was generated by voltage pulses in 10-mV increment steps from −70 to +30 mV in 1 DRG neuron from a NS treatment NCI rat and 1 from a MT treatment NCI rat. The reversal membrane potential (Vrev) in this recording condition was 75 mV. At different test potentials, membrane conductance (G) was measured by dividing the peak TTX-R sodium current by the current driving force (Vm − Vrev) and was normalized to that recorded at +30 mV (Gmax). Data were fitted with the following modified Boltzmann equation: G/Gmax = 1/{1+ exp [−(V − V1/2)/k]}, where V is membrane potential, V1/2 (V half) is the membrane voltage at which the current was half-maximally activated, and k is the slope factor. MT treatment induced the activation curve rightward shift compared with the NS treament. (h) For steady-state inactivation curves, a conditional step of various voltages from −90 to +30 mV with 10-mV increment. These inactivation curves are representative curves of 1 neuron from a NS treament NCI rat and 1 neuron from a MT treament NCI rat, respectively. The peak current amplitude was normalized to that recorded at a −90-mV conditioning step (Imax). Data were plotted as a function of conditional step potentials and fitted with the following negative Boltzmann equation: I/Imax = 1/{1+ exp [−(V1/2−V)/k]}.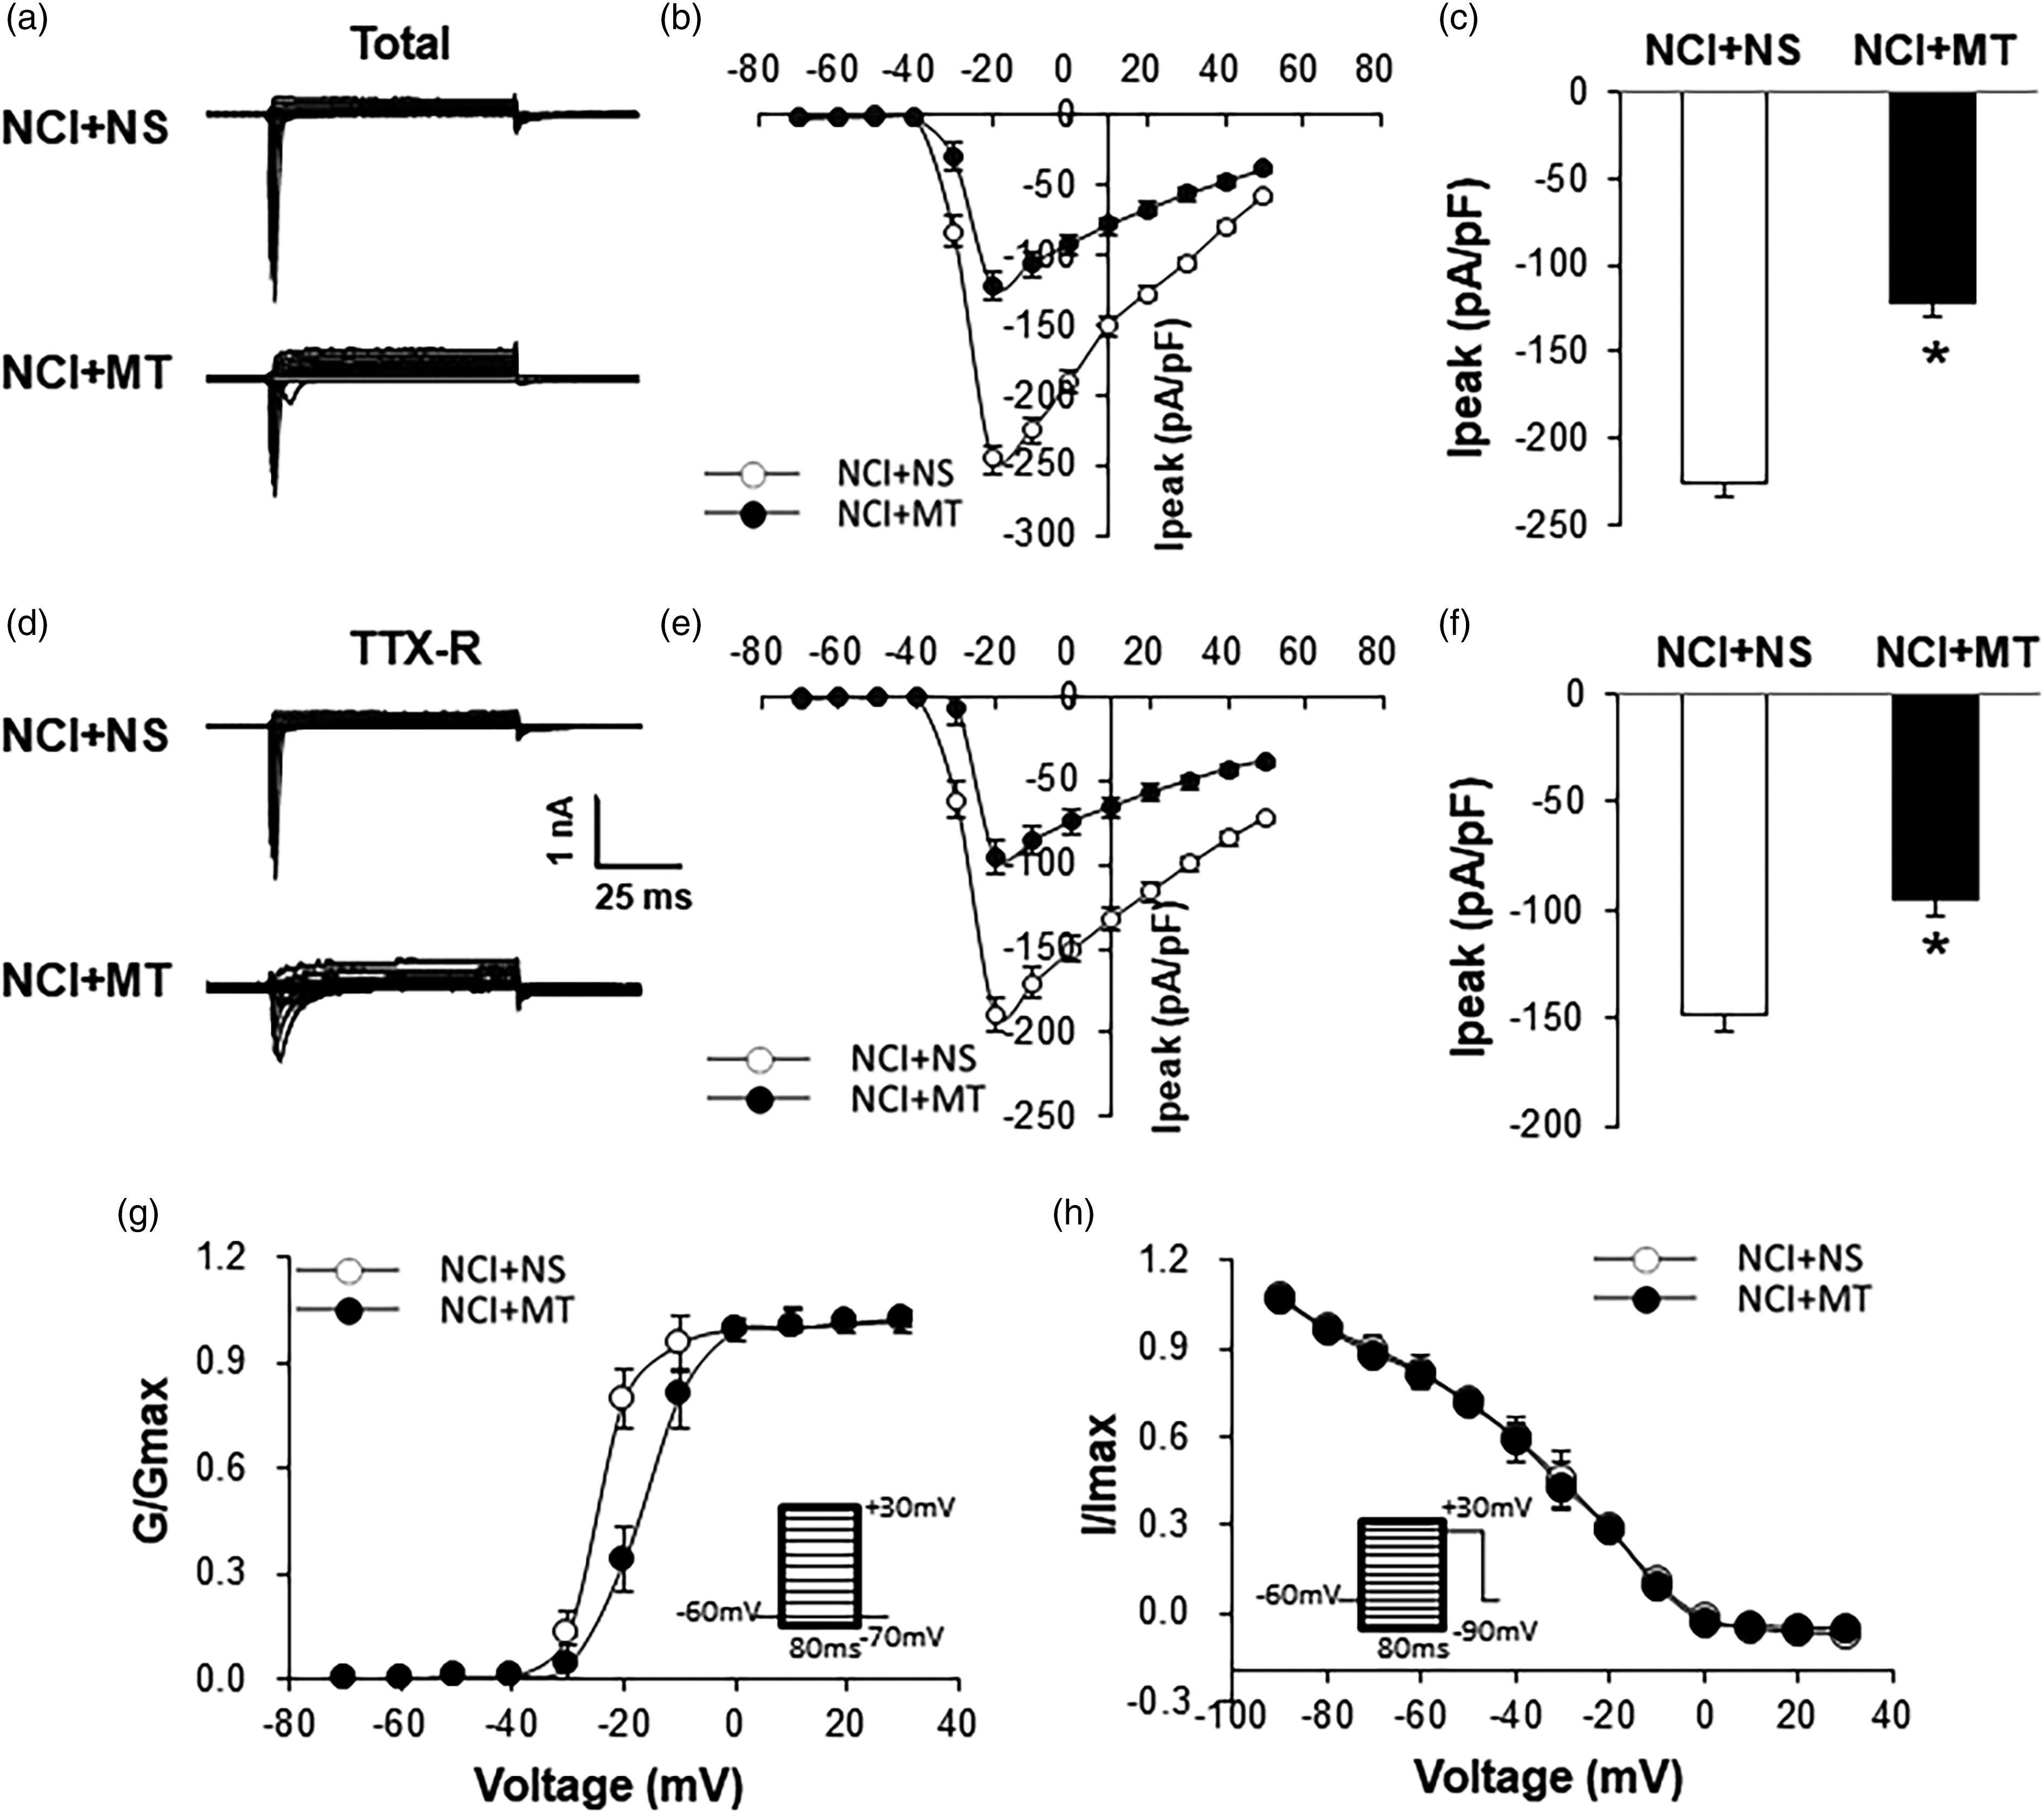
Melatonin suppresses Nav1.8 expression
We next determined whether expression of Nav1.8 was increased in colon DRGs after NCI treatment. Proteins isolated from both sides of T13-L2 DRGs of NCI and age-matched control rats were probed with anti-Nav1.8 antibody. Anti-Nav1.8 antibody labeled a 220 kDa molecular weight protein. Six weeks after NCI treatment, the relative densitometry of Nav1.8 was 0.44 ± 0.05 (n = 4) and 0.69 ± 0.1 (n = 4) for control (CON) and NCI, respectively. The levels of expression of Nav1.8 were increased significantly (Figure 4(a), *p < 0.05, two sample t-test). This is consistent with our previous report.
7
We then determined the role for melatonin in the upregulation of Nav1.8 expression. Melatonin was administrated intrathecally (i.t. 10 nM) at age of 6 weeks once daily for consecutive 7 days. The same volume of normal saline (NS) was used as control. The relative densitometry of Nav1.8 was 1.21 ± 0.03 (n = 3) and 0.78 ± 0.03 (n = 3) for NS and MT, respectively. Melatonin treatment significantly reduced expression of Nav1.8 (Figure 4(b), *p < 0.05, two sample t-test). Thus, melatonin treatment reverses the upregulation of Nav1.8 expression in colon DRGs isolated from NCI rats. Melatonin suppresses Nav1.8 expression. (a) Increase in expression of Nav1.8 after NCI. Western blots for Nav1.8 of ganglia (T13–L2) from NS treament and MT treament NCI rats. GAPDH control for each sample was given. Bar graph showing means density relative to GAPDH for Nav1.8 from NS treament and MT treament NCI rats. Five weeks after NCI treatment, the relative density of Nav1.8 was increased markedly (n = 4 for each group, *p < 0.05; two sample t-test). (b) The expression of Nav1.8 was reduced significantly in MT-treated group (n = 3 for each group, *p < 0.05, two sample t-test).
NCI downregulates the expression of MT2 Receptors in DRGs
Then we assessed the protein expression of melatonin receptor MT2 after NCI (Figure 5(a)). The relative values of MT2 receptor proteins were 1.21 ± 0.2 (n = 4 rats) and 0.78 ± 0.15 (n = 3 rats) in the CON and NCI rats, respectively (Figure 5(a), *p < 0.05, two-sample t-test). There was a significant decrease in MT2 receptor protein levels between CON and NCI rats. Furthermore, to determine the possible interaction between MT2 and sodium channels, we first examined whether MT2 was co-expressed in Nav1.8-positive colon specific DRG neurons. Triple-labeling techniques showed that colon specific DRG neurons that were immune reactive for MT2 also were positive for Nav1.8 and that colon specific DRG neurons that were immune reactive for Nav1.8 were also positive for MT2 (Figure 5(b), arrows). 8-M-PDOT (8MP) a selective melatonin MT2 receptor agonist, to further confirm the 8MP effect on NCI rats, 8MP at dose of 100 nM was intrathecally injected once daily for consecutive 7 days in NCI rats and assessed Nav1.8 protein level. The same volume of normal saline (NS) was used as control. The relative densitometry of Nav1.8 was 0.8 ± 0.01 (n = 4) and 0.49 ± 0.02 (n = 4) for NS and 8MP, respectively. 8MP treatment reverses the upregulation of Nav1.8 expression in colon DRGs isolated from NCI rats (Figure 5(c), *p < 0.05, two-sample t-test). NCI downregulates the expression of MT2 Receptors in DRGs. (a) Increase in expression of MT2 after NCI. Western blots for MT2 of ganglia (T13–L2) from CON and NCI rats. Bar graph showing means density relative to GAPDH for MT2 from CON and NCI rats. Five weeks after NCI treatment, the relative density of MT2 was markedly decreased (n = 4 and 3 rats from CON and NCI treated groups, *p < 0.05; two sample t-test). (b) MT2 was co-expressed in Nav1.8-positive colon specific DRG neurons (arrows). (C) Application of MT agonist, 8MP (100 nM, i.t.), significantly reduced the expression of Nav1.8 of T13–L2 DRGs from NCI rats at age of 6 weeks when compared with NS. (n = 4 for each group, *p < 0.05, two-sample t test).
Agonist of 8MP treatment intensifies distention threshold in NCI rats
If melatonin generated endogenously contributes to the maintenance of visceral hyperalgesia in NCI animals, then application of agonist of 8MP to NCI rats should mimic the effects of melatonin. Therefore, we applied 8MP to NCI rats and assessed behavioral responses. Intrathecal administration of 8MP, led to a significant increase in distention threshold in NCI rats, in a dose-dependent manner (Figure 6(a), *p < 0.05, **p < 0.01, ***p < 0.001 vs. NS, n = 6 for each group, Tukey post hoc test following Kruskal-Wallis ANOVA). The optimized dose for 8MP to produce the maximal effect was 100 nM in this study. To further confirm the 8MP effect on NCI rats, 8MP at dose of 100 nM was intrathecally injected once daily for consecutive 7 days in NCI rats and assessed behavioral responses. Intrathecal administration of 8MP, led to a significant increase in distention threshold in NCI rats. (Figure 6(b), *p < 0.05, **p < 0.01, ***p < 0.001 vs. NS, n = 6 for each group, Tukey post hoc test following two-way repeated-measures ANOVA). The effect of 8MP at doses of 100 nM lasted for 7 hours. These data suggest that 8MP treatment significant intensifies distention threshold in NCI rats. Agonist of 8MP treatment intensifies distention threshold in NCI rats. (a) 8MP treatment led to a significant increase of distention threshold in NCI rats with a dose-dependent manner (n = 6 for each group, *p < 0.05, **p < 0.01, ***p < 0.001 vs. NS treatment, Tukey post hoc test following Kruskal-Wallis ANOVA). (b) Consecutive 7 days injection of 8MP at dose of 100 nM significantly increased the CRD threshold in NCI rats, and the effect can last for 7h (n = 6 for each group, *p < 0.05, **p < 0.01, ***p < 0.001 vs. NS, Tukey post hoc test following two-way repeated-measures ANOVA).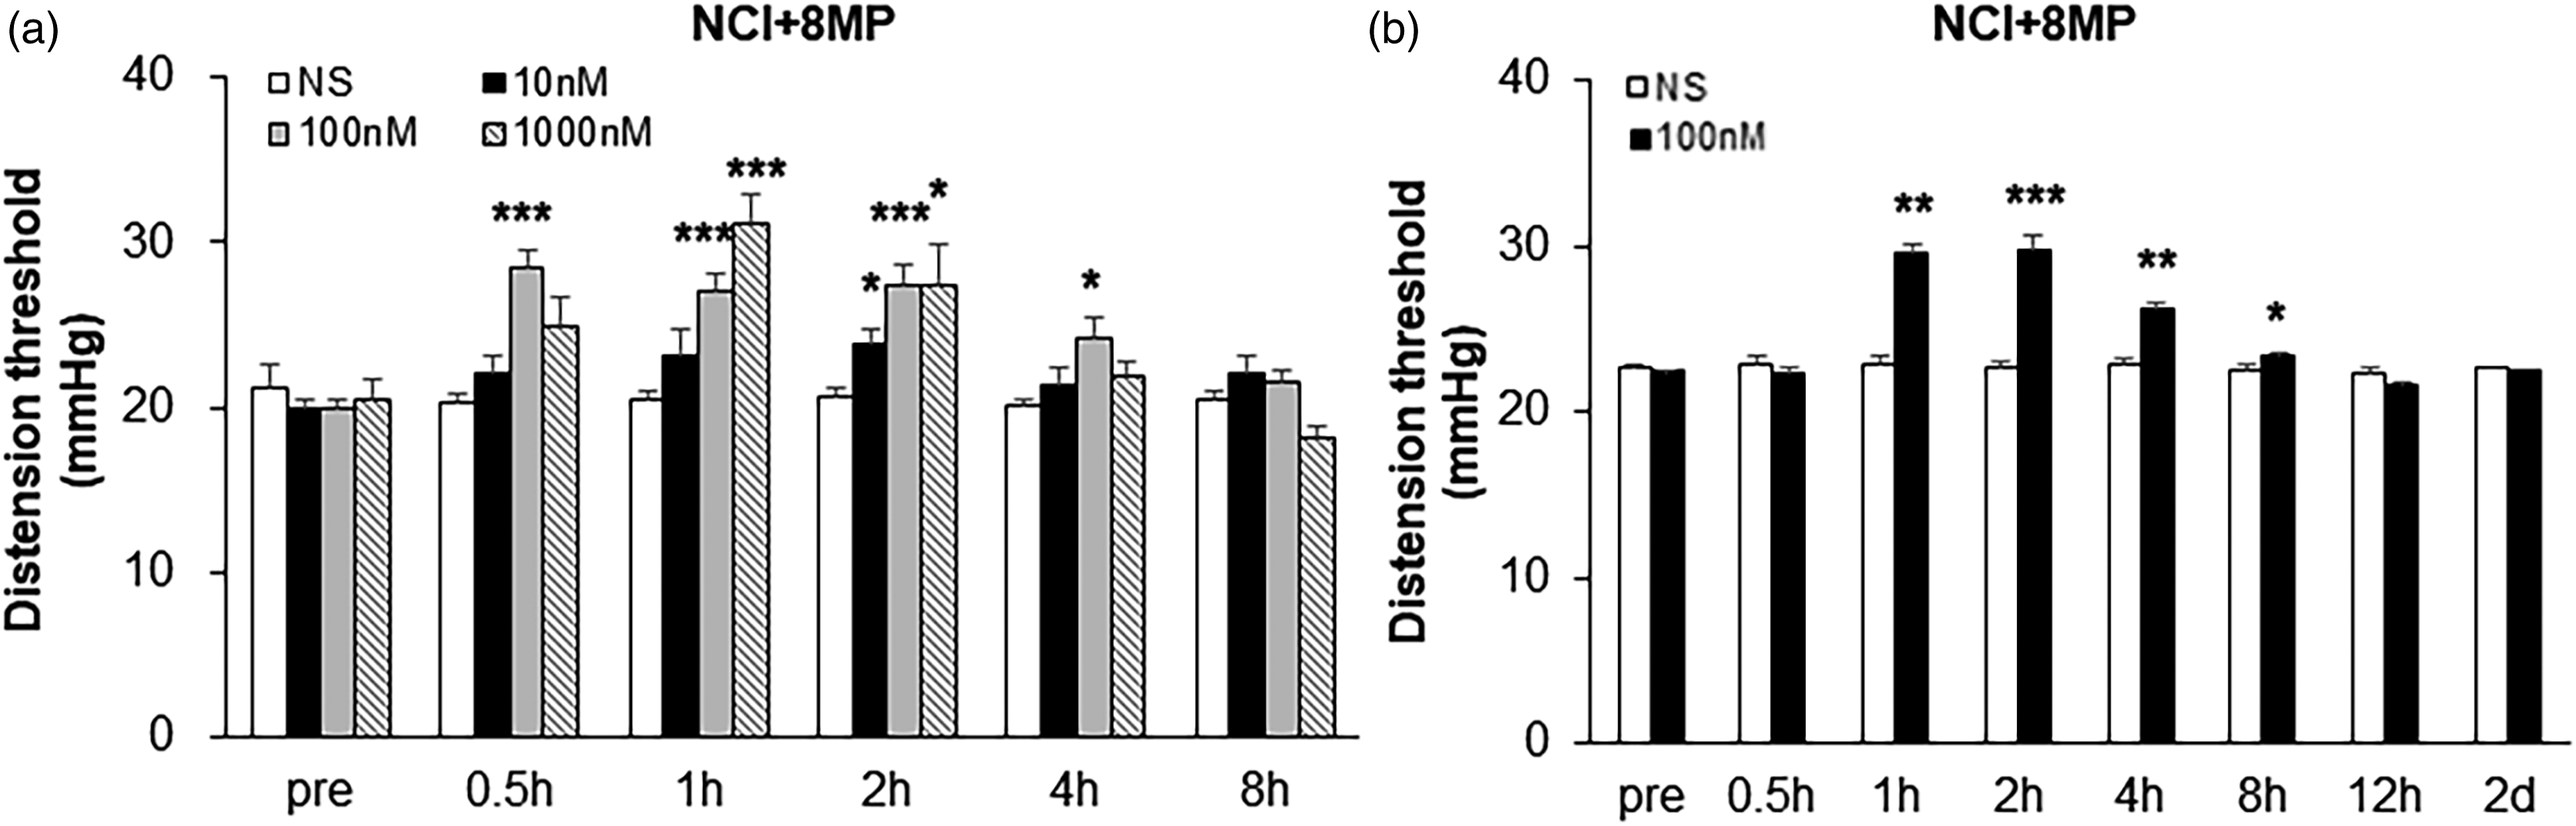
8MP treatment reverses hyperexcitability of colonic DRG neurons induced by NCI
Since Melatonin attenuates hyperexcitability of colonic DRG neurons induced by NCI, we investigated whether 8MP affects the excitability of colonic DRG T13-L2 neurons derived from NCI rats. 8MP at dose of 100 nM was intrathecally injected once daily for consecutive 7 days in NCI rats, NCI+NS group treated with the same volume of NS (i.t.). Under current-clamp conditions, colon-specific DRG neurons of NCI rats treated with NS (n = 5 rats) or 8MP (n = 6 rats) were recorded. Resting Potentials (RPs) were −48.8 ± 0.8 and −55.1 ± 1.2 mV for the NS- and 8MP-treated groups, respectively. Therefore, 8MP treatment significantly hyperpolarized RPs (Figure 7(a), n = 18 and 22 cells from NS- and MT-treated groups, respectively, *p < 0.05 compared to NS, two-sample t-test). The rheobase measurements were 0.017 ± 0.003 and 0.035 ± 0.006 nA for the NS- and 8MP-treated groups, respectively. The administration of 8MP markedly increased rheobase (Figure 7(b), n = 18 and 22 cells from NS- and 8MP-treated groups, respectively, **p < 0.01 compared to NS, two-sample t-test). The action potential (AP) thresholds were −34.2 ± 0.8 and −29.7 ± 0.6 mV for NS- and 8MP-treated groups, respectively. The 8MP treatment also significantly increased the AP thresholds (Figure 7(c), n = 18 and 22 cells from NS- and 8MP-treated groups, respectively, *p < 0.05 compared to NS, two-sample t-test). 8MP treatment also greatly decreased the number of APs evoked by 2X and 3X rheobase current stimulation (Figures 7(d) and (f), n = 18 and 22 cells from NS and 8MP-treated groups, respectively, *p < 0.05 compared to NS, Mann-Whitney test). The numbers of AP evoked by 2X rheobase current stimulation were 2.3 ± 0.2 and 1.75 ± 0.25 for NS- and 8MP-treated groups, respectively. The numbers of AP evoked by 3X rheobase current stimulation were 3.3 ± 0.5 and 2.3 ± 0.2 for NS- and 8MP-treated groups, respectively. In addition, 8MP treatment greatly reduced the number of APs evoked by 100, 300 and 500 pA ramp current stimulation. The numbers of APs evoked by 100 pA ramp current stimulation were 11.4 ± 1.0 and 3.9 ± 0.5 for the NS- and 8MP-treated groups, respectively. The numbers of APs evoked by 300 pA ramp current stimulation were 20.4 ± 1.8 and 11.8 ± 1.6 for the NS- and 8MP-treated groups, respectively. The numbers of APs evoked by 500 pA ramp current stimulation were 26.6 ± 2.3 and 18.7 ± 2.8 for the NS- and 8MP-treated groups, respectively. 8MP treatment remarkably reduced the numbers of APs in response to ramp current stimulation (Figures 7(e) and (g), n = 18 and 22 cells from NS- and 8MP-treated groups, respectively, **p < 0.01 compared to NS, Mann-Whitney test). 8MP treatment reverses hyperexcitability of colonic DRG neurons induced by NCI. (a) 8MP treatment hyperpolarized the resting membrane potential (RPs) in DRG neurons of NCI rats (n = 18 and 22 cells from NS- and 8MP-treated groups, *p < 0.05, compared to NS treatment group, two-sample t-test). (b) 8MP treatment resulted in a marked increase of the rheobase in DRG neurons of NCI rats (n = 18 and 22 cells from NS-and 8MP-treated groups respectively, **p < 0.01, compared to NS treatment group, two-sample t-test). (c) 8MP treatment increased APs thresholds (n = 18 and 22 cells from NS- and 8MP-treated groups, *p < 0.05, compared to NS treatment group, two-sample t-test). (d) Examples of APs by 2X and 3X rheobase current injection of colon specific DRG neurons from NS (top) and 8MP (bottom) treated NCI rats. (f) Administration of 8MP (i.t. 100 nM once daily for consecutive 7 days) markedly reduced numbers of AP evoked by 2X rheobase current stimulation (n = 18 and 22 cells from NS and 8MP-treated groups, *p < 0.05, two-sample t-test). (e) Examples of APs by 100, 300 and 500 pA current injection of colon specific DRG neurons from NS (top) and 8MP (bottom) treated NCI rats. (g) Bar graph showed a significant decrease in numbers of APs evoked by 100, 300 and 500 pA ramp stimulation in 8MP-treated NCI rats (n = 18 and 22 cells from NS- and 8MP-treated groups respectively, **p < 0.01, compared with NS, two-way repeated-measures ANOVA followed by Bonferroni post-hoc test).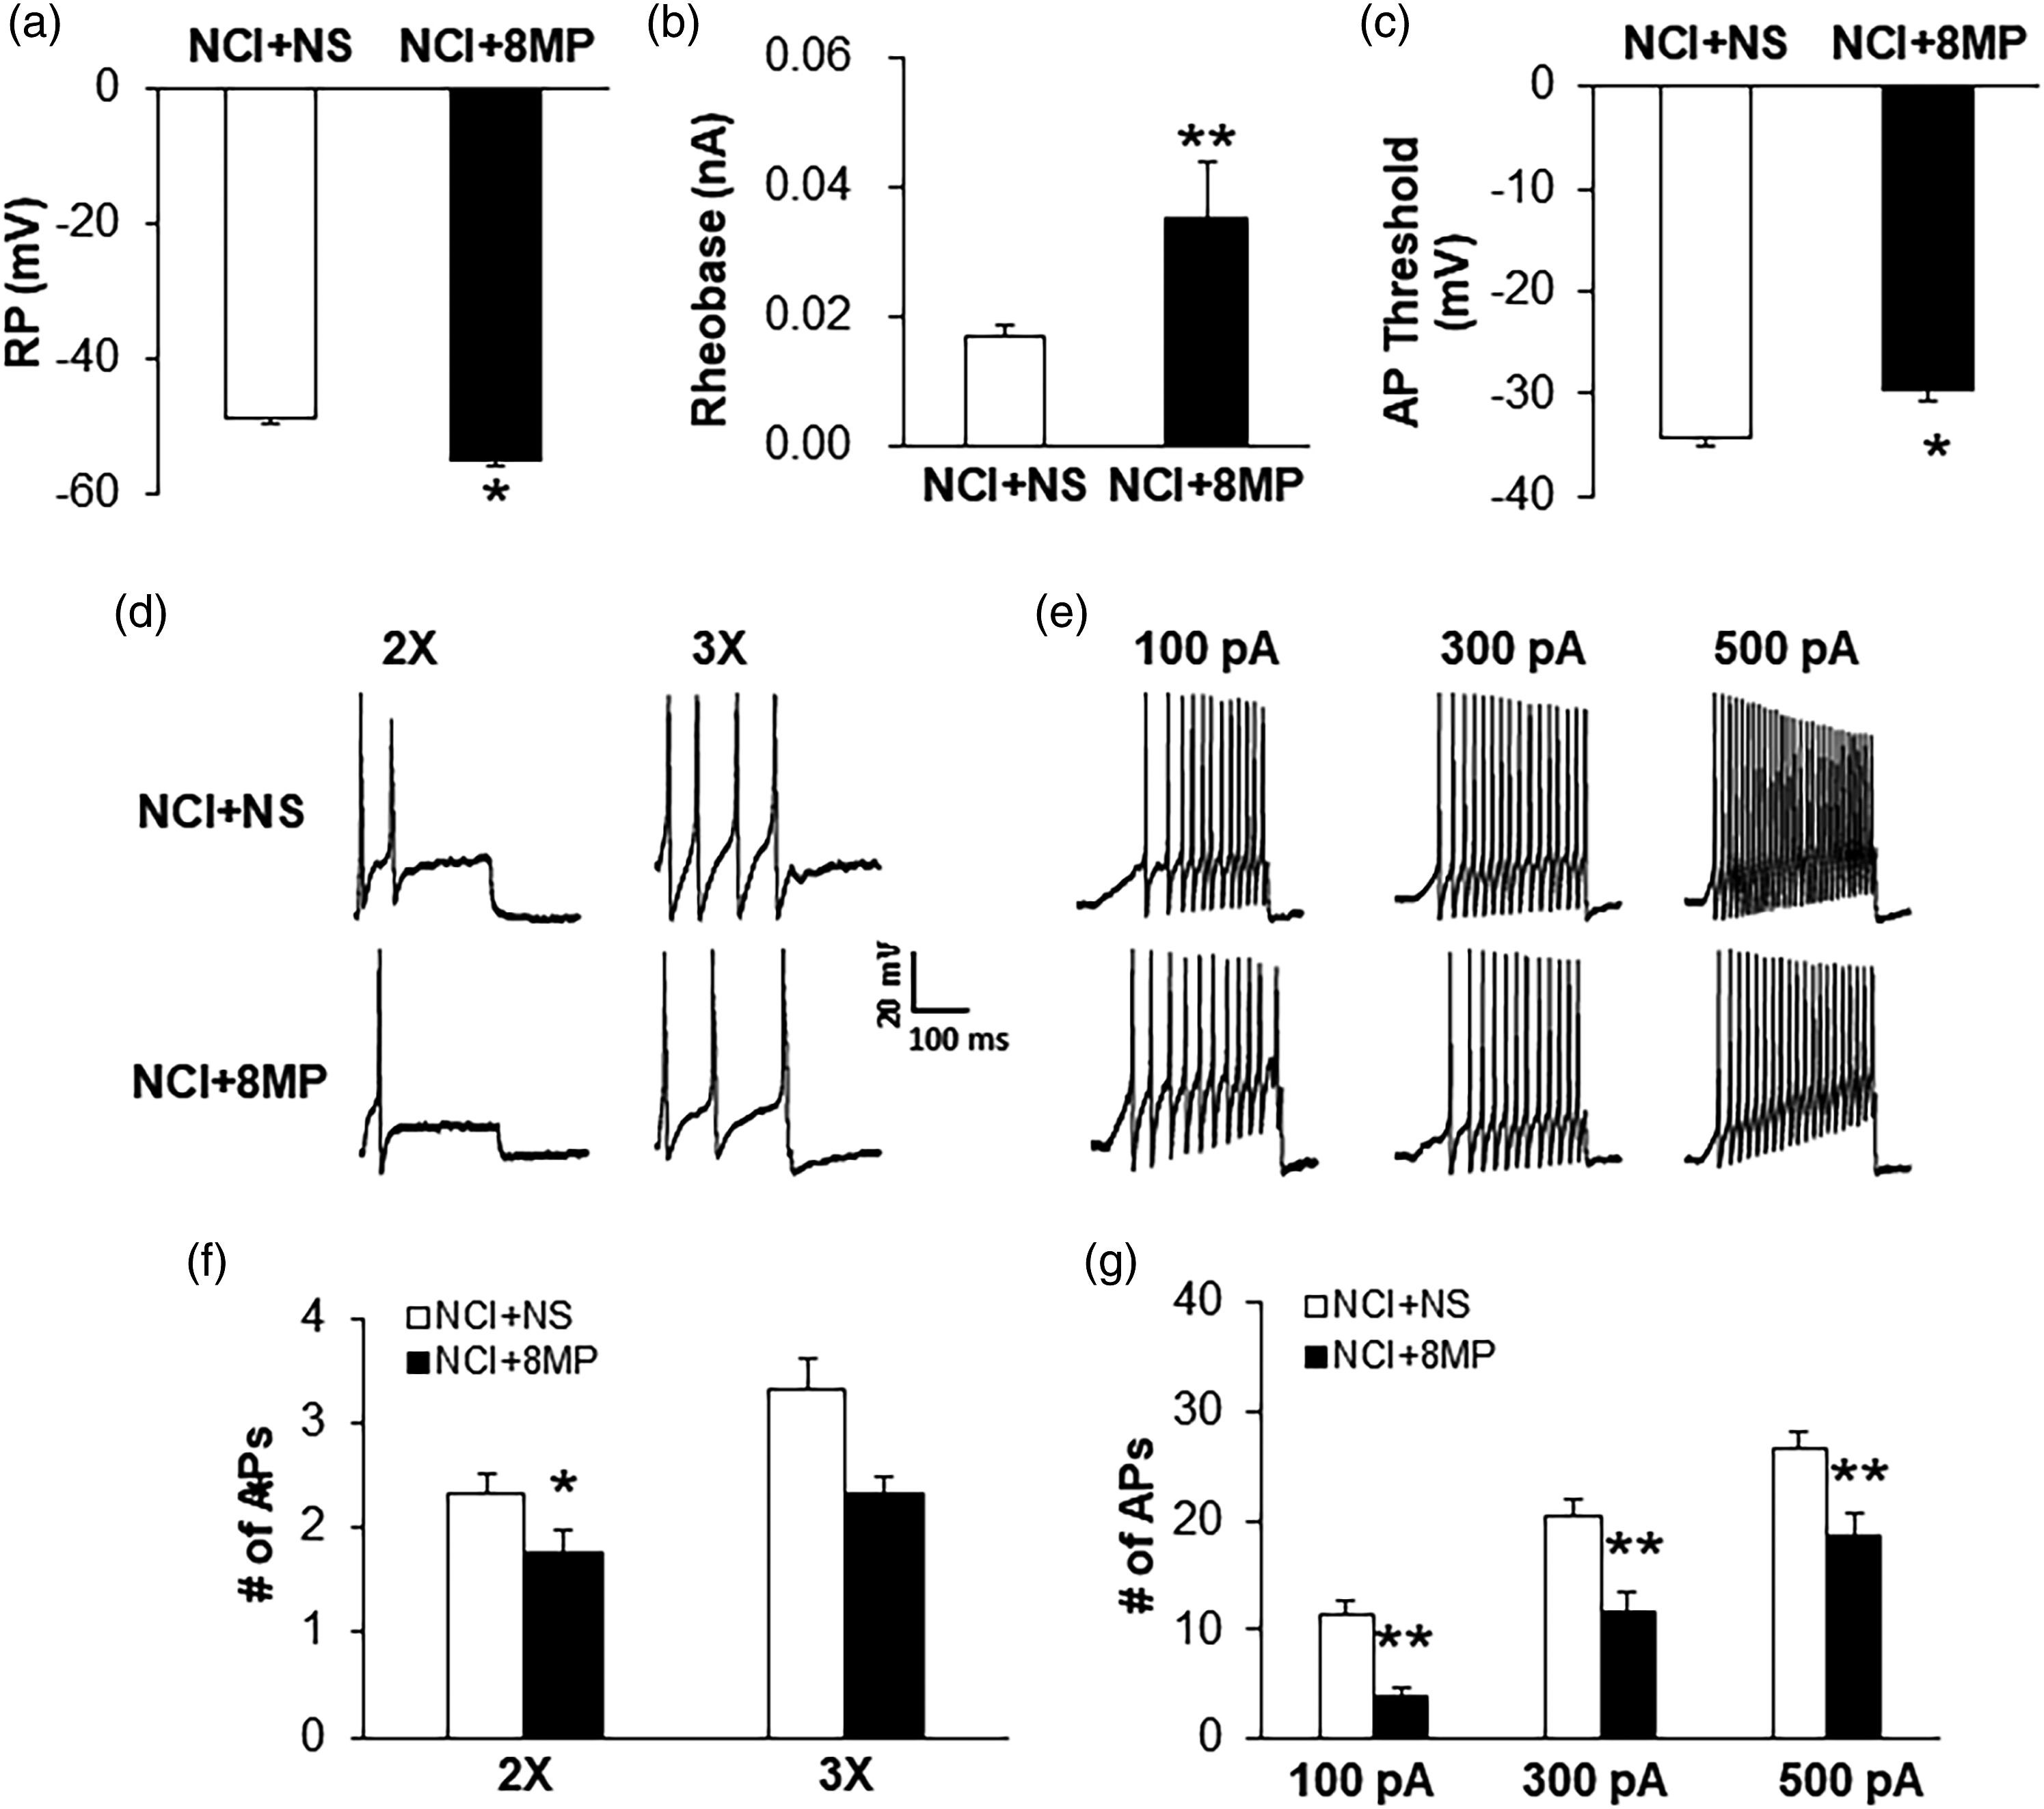
8MP reduces TTX-R sodium current density and modulates dynamics of TTX-R sodium current activation
Since melatonin reduces TTX-R sodium current density and modulates sodium current activation of colon-specific DRG neurons of NCI rats, we next investigated whether 8MP treatment suppressed current density of VGSCs in colon-specific DRG neurons. NCI+NS group (n = 4 rats), NCI+8MP group (n = 4 rats). The total sodium current density was −232 ± 20.6 pA/pF (n = 12 cells) and −156 ± 15.5 pA/pF (n = 10 cells) for NS- and 8MP-treated group, respectively. 8MP treatment significantly reduced total sodium current density when compared with that of NS group (Figure 8(a), (b) and (c), *p < 0.05, Mann-Whitney test). To further determine the roles for 8MP on TTX-R current densities, TTX-R sodium currents were recorded in the presence of 0.5 μM TTX. The TTX-R sodium current density was −139 ± 16.5 pA/pF (n = 12 cells) and −92 ± 21.3 pA/pF (n = 10 cells) for NS- and 8MP-treated group, respectively 8MP treatment significantly reduced TTX-R sodium current density when compared with that of NS group (Figure 8(d), (e) and (f), *p < 0.05, Mann-Whitney test). Because inhibition of peak current density of TTX-R sodium current was evident, we next characterized the effect of 8MP on voltage dependence of TTX-R currents of colon-specific DRG neurons. Activation dependence was constructed from I-V curves of neurons from NS and 8MP-treated NCI rats (Figure 8(g)). 8MP treatment led to a ∼10 mV positive shift in the steady state activation curve. The shift of the activation curve in a more depolarizing direction prevents the channel to open in response to weaker depolarization. We next determined the effect of 8MP on voltage dependence of steady-state inactivation of TTX-R sodium channels of colon-specific DRG neurons. 8MP treatment did not significantly alter the inactivation curve (Figure 8(h)), indicating the same channel availability in the potential domain between −50 mV and −10 mV of colon-specific DRG neurons from these two groups of rats. 8MP reduces TTX-R sodium current density and modulates dynamics of TTX-R sodium current activation. (a) Examples of total Nav currents recorded from NS (top) and 8MP (100 nM, bottom) treated cells from NCI rats. The membrane potential was held at −60 mV and voltage steps were from −70 to +50 mV with 10-mV increments and 80-ms in duration. (b) The currents versus voltages (I–V) curves of total current (Itotal) from NS and 8MP treated cells. (c) Bar graphs showing the mean peak Itotal current density, 8MP treatment significantly reduced total sodium current density when compared with that of NS group. (n = 12 and 10 cells from NS and 8MP-treated groups, *p < 0.05, Mann-Whitney test). (d) Examples of TTX-R from NS (top) and 8MP (bottom) treated cells. The voltage steps were the same as above. (e) The I–V curves of TTX-R from NS and 8MP treated cells. (f) Bar graphs showing the mean peak TTX-R current density, 8MP treatment significantly reduced TTX-R sodium current density when compared with that of NS group. (n = 12 and 10 cells from NS and 8MP-treated groups, *p < 0.05, Mann-Whitney test). (g) For activation curves, TTX-R sodium current was generated by voltage pulses in 10-mV increment steps from −70 to +30 mV in 1 DRG neuron from a NS treatment NCI rat and 1 from a 8MP treatment NCI rat. The reversal membrane potential (Vrev) in this recording condition was 75 mV. At different test potentials, membrane conductance (G) was measured by dividing the peak TTX-R sodium current by the current driving force (Vm−Vrev) and was normalized to that recorded at +30 mV (Gmax). Data were fitted with the following modified Boltzmann equation: G/Gmax = 1/{1+ exp [−(V−V1/2)/k]}, where V is membrane potential, V1/2 (V half) is the membrane voltage at which the current was half-maximally activated, and k is the slope factor. 8MP treatment induced the activation curve rightward shift compared with the NS treament. (h) For steady-state inactivation curves, a conditional step of various voltages from −90 to +30 mV with 10-mV increment. These inactivation curves are representative curves of 1 neuron from a NS treament NCI rat and 1 neuron from a 8MP treament NCI rat, respectively. The peak current amplitude was normalized to that recorded at a −90-mV conditioning step (Imax). Data were plotted as a function of conditional step potentials and fitted with the following negative Boltzmann equation: I/Imax = 1/{1+ exp [−(V1/2−V)/k]}.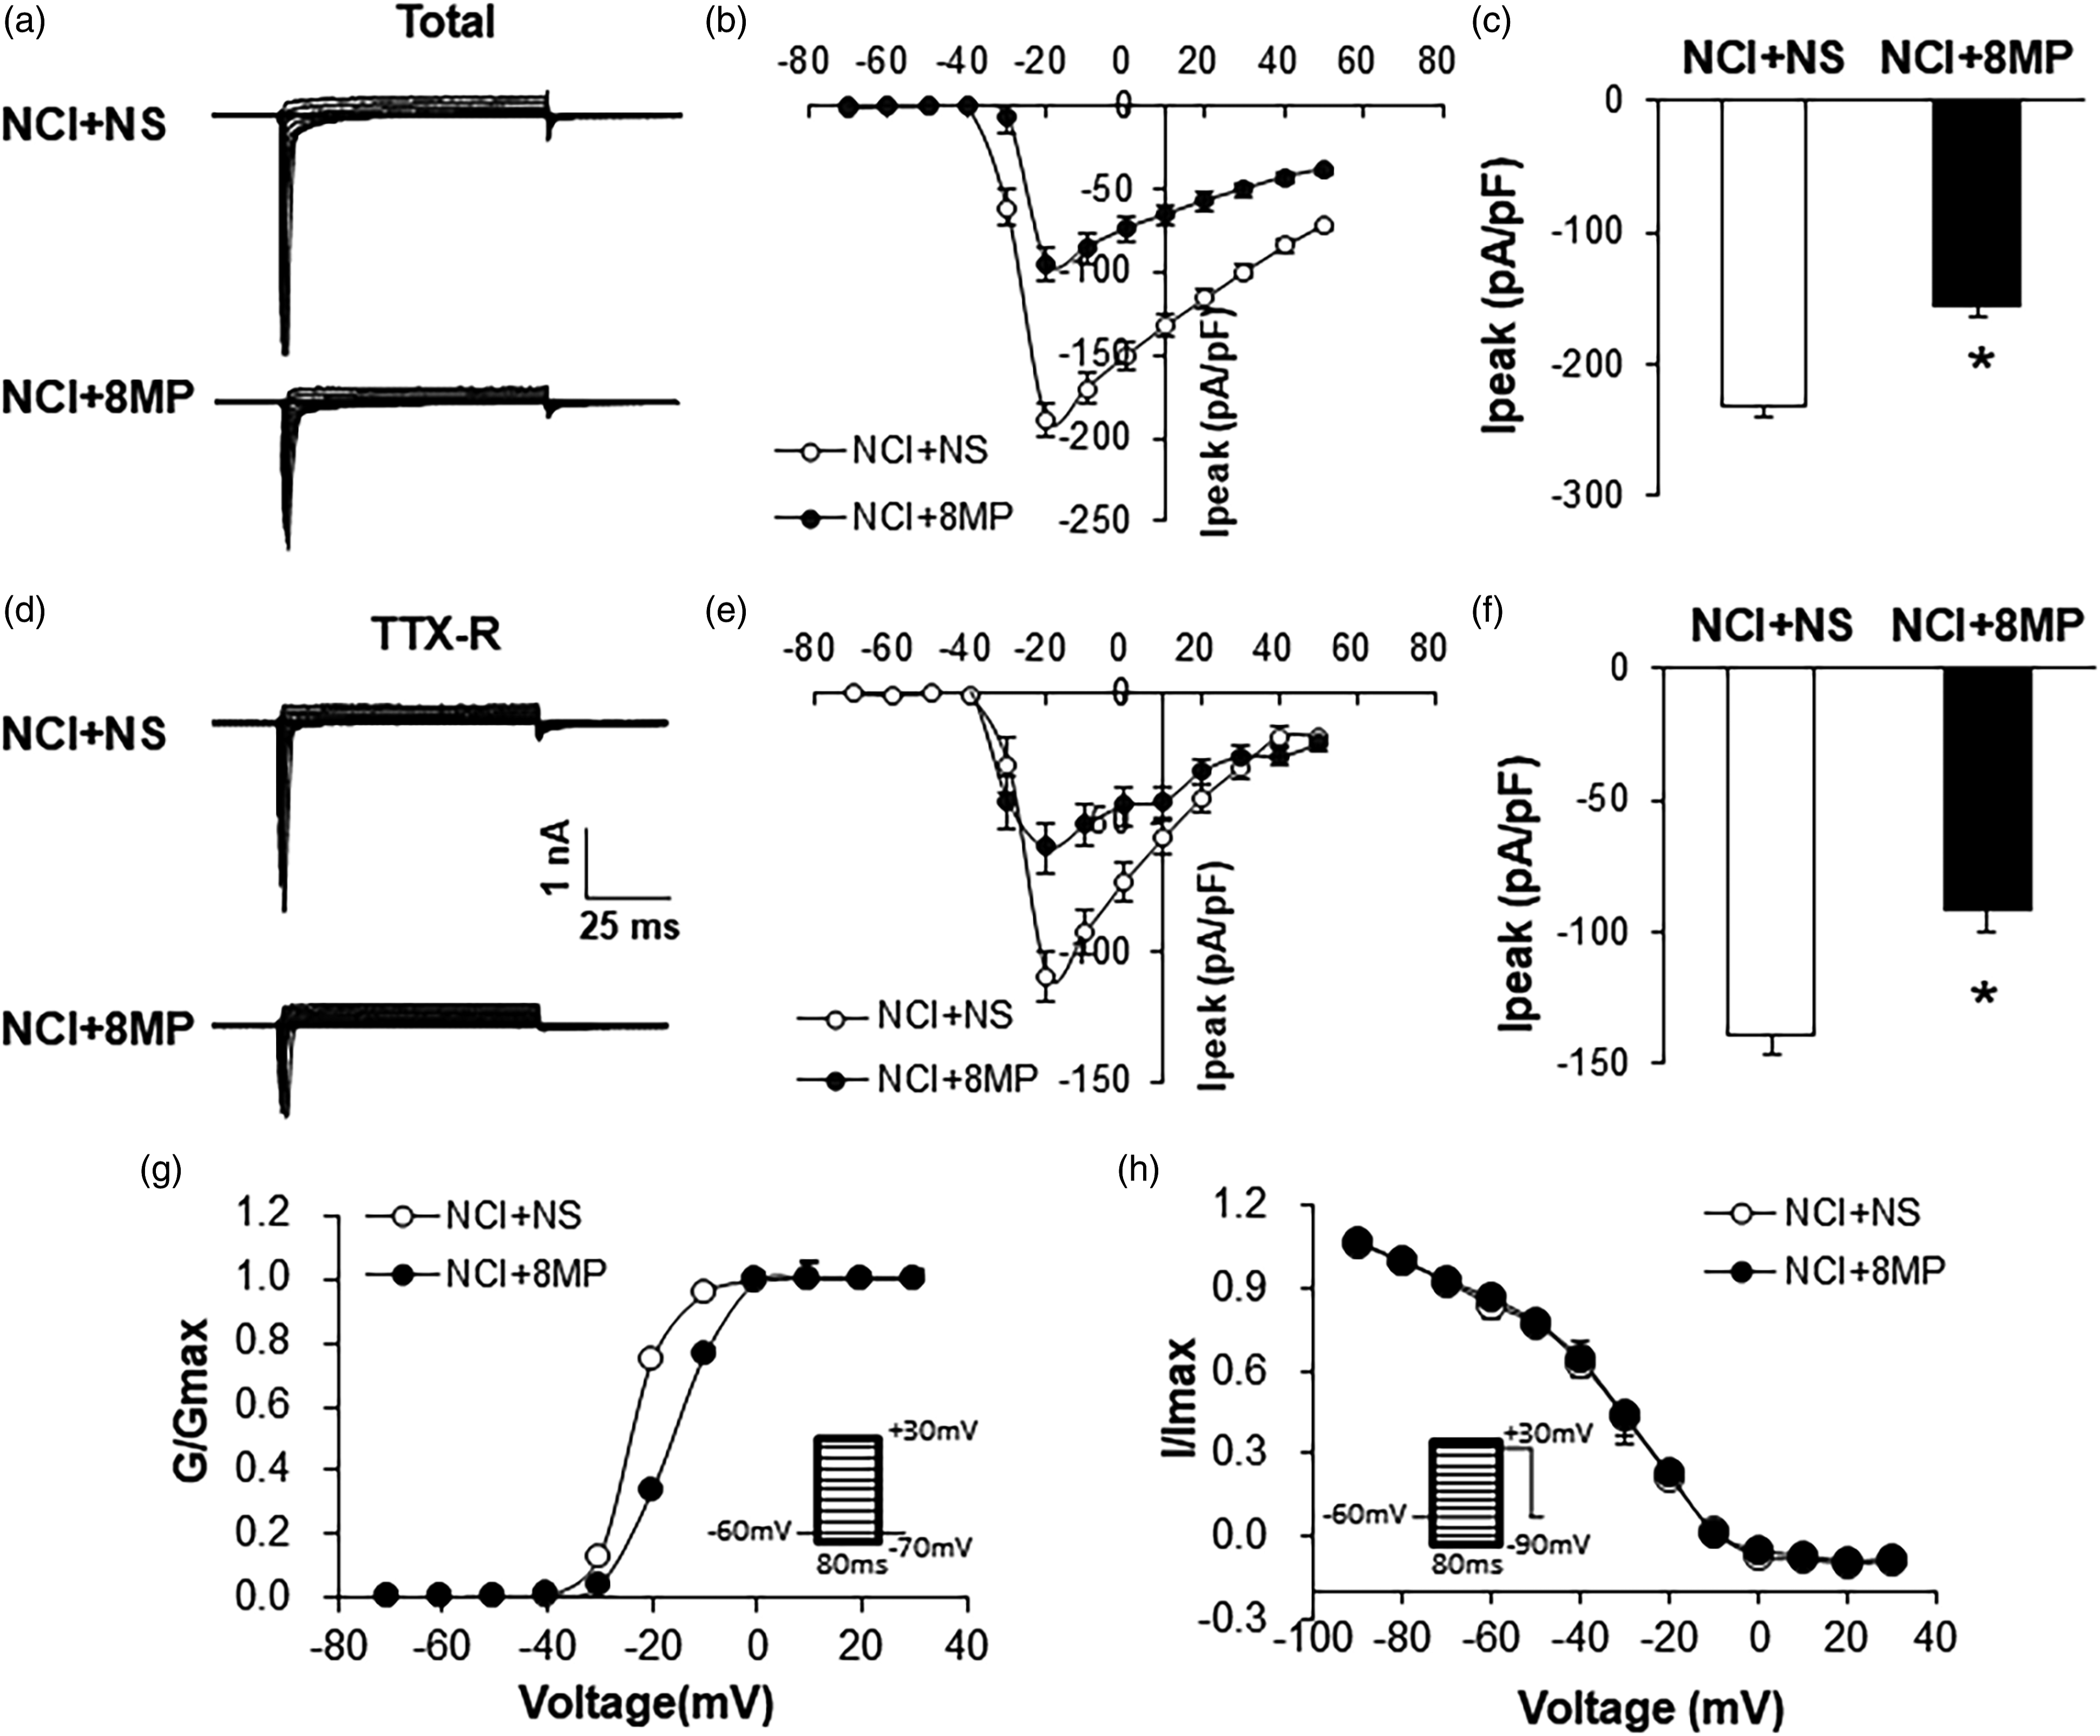
Discussion
Chronic pain is a global problem with a high prevalence. It is estimated that 10% of people are diagnosed with chronic pain every year. 33 With the passage of time, pain signals from the receiving synapses connected by the viscera will be sensitized through the periphery and the central nervous system, resulting in chronic visceral hyperalgesia. 34 Experiencing trauma, neglect or abuse in early life is an effective initiating factor for chronic visceral hyperalgesia in adults, especially closely related to IBS.35,36 At present, the specific pathogenesis of IBS is not clear, leading to the slow progress of the disease research, and the lack of effective prevention and treatment methods in clinic. Previous laboratory studies have shown that neonatal colitis stimulation can induce visceral hyperalgesia in adult rats, and the pain effect can last up to 6 weeks. 7 To study the potential pathogenesis of chronic visceral hyperalgesia, we chose NCI model to simulate the main pathological and physiological characteristics of chronic visceral hyperalgesia in human patients.
In this experiment, we determined that compared with adult rats of the same age control group, the CRD threshold of NCI rats was significantly reduced. This result was consistent with and in an extension for previous study that NCI reduced the distention pressure threshold to elicit visceromotor responses to colorectal distention.7,25
Subsequently, we detected a significant increase in the expression of Nav1.8 protein in the colon DRGs T13-L2 in NCI adult rats. However, after MT treatment, the expression of Nav1.8 decreased significantly compared with NS treatment group in NCI adult rats. We speculate that MT may participate in NCI induced visceral pain by regulating Nav1.8. Next, we intrathecally injected MT agonist 8MP into NCI rats. Compared with NS treatment group, the results showed that the expression of Nav1.8 decreased significantly, and significantly reversed visceral pain in rats, and the effect was time and dose-dependent. The above results show that MT significantly reduced visceral hyperalgesia induced by neonatal colitis stimulation in rats, but its mechanism needs to be further explored.
Therefore, we used the whole cell patch clamp technique to record the excitatory changes of DRG neurons in 6 weeks old NCI rats. Compared with NS group, the action potential firing frequency of NCI rats in MT treatment group was significantly reduced under current stimulation. This may be one of the reasons for visceral hyperalgesia in NCI rats. The same results were obtained by repeating the above experiment with MT agonist 8MP, but its significance was low.
In conclusion, our study showed that MT significantly reduced the Nav1.8 expression of colon specific DRG neurons in NCI rats and inhibited TTX-R sodium current, normalizing the excitability of primary sensory neurons in the state of functional colonic visceral pain. Therefore, MT inhibiting the overexpression of Nav1.8 may provide new hope for the treatment and intervention of IBS patients.
Footnotes
Acknowledgements
This work was supported by grants from National Natural Science Foundation of China (81902239 and 81971036). The funders had no role in the study design, data collection, and analysis, decision to publish, or preparation of the manuscript.
Author contributions
M-D. L and Y-X. W performed experiments, analyzed data and prepared figures and the manuscript. J-P. C and M-Y. C performed experiments and analyzed data. Q-L. W prepared figures and the manuscript. S. H designed experiments, supervised the experiments and finalized the manuscript. All the authors have read and approved the paper.
Declaration of conflicting interests
The author(s) declared no potential conflicts of interest with respect to the research, authorship, and/or publication of this article.
Funding
The author(s) disclosed receipt of the following financial support for the research, authorship, and/or publication of this article: This work was supported by the National Natural Science Foundation of China; 81902239, 81971036.
Ethics approval
Care and handling of the animals were approved by the Institutional Animal Care and Use Committee of Soochow University and were in accordance with the guidelines of the International Association for the Study of Pain.