
Abstract
The role of Aβ-afferents in somatosensory function is often oversimplified as low threshold mechanoreceptors (LTMRs) with large omission of Aβ-afferent involvement in nociception. Recently, we have characterized Aβ-afferent neurons which have large diameter somas in the trigeminal ganglion (TG) and classified them into non-nociceptive and nociceptive-like TG afferent neurons based on their electrophysiological properties. Here, we extend our previous observations to further characterize electrophysiological properties of trigeminal Aβ-afferent neurons and investigate their mechanical and chemical sensitivity by patch-clamp recordings from large-diameter TG neurons in ex vivo TG preparations of adult male and female rats. Based on cluster analysis of electrophysiological properties, trigeminal Aβ-afferent neurons can be classified into five discrete types (type I, IIa, IIb, IIIa, and IIIb), which responded differentially to mechanical stimulation and sensory mediators including serotonin (5-HT), acetylcholine (ACh) and adenosine triphosphate (ATP). Notably, type I neuron action potential (AP) was small in amplitude, width was narrow in duration, and peak dV/dt repolarization was great with no deflection observed, whereas discretely graded differences were observed for type IIa, IIb, IIIa, and IIIb, as AP increased in amplitude, width broadened in duration, and peak dV/dt repolarization reduced with the emergence of increasing deflection. Type I, IIa, and IIb neurons were mostly mechanically sensitive, displaying robust and rapidly adapting mechanically activated current (IMA) in response to membrane displacement, while IIIa and IIIb, conversely, were almost all mechanically insensitive. Interestingly, mechanical insensitivity coincided with increased sensitivity to 5-HT and ACh. Together, type I, IIa and IIb display features of LTMR Aβ-afferent neurons while type IIIa and type IIIb show properties of nociceptive Aβ-afferent neurons.
Keywords
Introduction
Somatosensory afferents transduce mechanical, thermal, and chemical stimuli at the periphery and convey the sensory signals to the central nervous system. These nerves can be classified into C-, Aδ- and Aβ-afferents based on their conduction velocities (A.R. Light 1993). The somas of somatosensory afferents are located in the dorsal root ganglions (DRGs) and trigeminal ganglions (TGs), which vary in sizes with small-to medium-diameter neurons giving rise to C- and Aδ-afferents and large-diameter neurons giving rise to Aβ-afferents (Vermeiren et al. 2020). Functions of somatosensory afferents are commonly studied by making electrophysiological recordings from the somas of these nerves or afferent neurons (Korner and Lampert 2022). C-and Aδ-afferent neurons have been extensively studied, and most of them are involved in nociception induced by high-intensity mechanical, thermal, and chemical stimulation (Korner and Lampert 2022; Lawson et al. 2019; Vermeiren et al. 2020), although some Aδ- and C-afferents are low threshold mechanoreceptors (LTMRs) for sensing touch (Djouhri 2016; Li et al. 2011). In contrast, Aβ-afferent neurons are largely understudied and their functions are often oversimplified as being LTMRs for sensing touch (Djouhri and Lawson 2004; Lawson et al. 2019), and the potential involvement of Aβ-afferent neurons in nociception is largely neglected. However, studies have shown that Aβ-afferent neurons in DRGs are a heterogeneous population of somatosensory neurons and many of them sense high threshold mechanical and thermal stimuli to function as nociceptors (Djouhri and Lawson 2004; Fang et al. 2005; Lawson et al. 2019).
LTMR Aβ-afferent neurons give rise to a number of specialized tactile end organs such as Merkel disc, Meissner’s corpuscle, and lanceolate endings that are located at the periphery for sensing touch stimuli (Abraira and Ginty 2013; Handler and Ginty 2021). Recordings made from different LTMR Aβ-afferent neurons demonstrate mechanically activated currents (IMA) in response to membrane displacement, and the IMA currents recorded from these LTMRs are believed to be mediated by Piezo2 channels (Zheng et al. 2019). LTMR Aβ-afferent neurons show distinct electrophysiological properties, for example, action potentials (APs) of LTMR Aβ-afferent neurons display narrow width and small amplitude (Zheng et al. 2019). Pharmacological studies have suggested LTMRs are selectively tuned to sensory mediators through differing receptor and ion channel expression (Sonekatsu et al. 2022). Although LTMR Aβ-afferent neurons are mainly involved in the sense of touch under physiological conditions (Li et al. 2011), it has been suggested that they may initiate mechanical allodynia when central sensitization occurs under pathological conditions (Tashima et al. 2018).
Aβ-afferent neurons that sense high threshold mechanical stimuli are regarded as nociceptive Aβ-afferent neurons (Djouhri and Lawson 2004). Nociceptive Aβ-afferents are thought to be first responders of noxious mechanical stimuli to generate immediate painful sensation (Djouhri and Lawson 2004; Fang et al. 2005; Lawson et al. 2019). Electrophysiological properties of nociceptive Aβ-afferent neurons have been characterized using in vivo intracellular recordings made from DRG neurons in anesthetized animals (Djouhri and Lawson 2004; Ritter and Mendell 1992). In comparison to LTMR Aβ-afferent neurons, nociceptive Aβ-afferent neurons in DRGs display APs with broader width, larger amplitude, longer AHP duration, and deflection or shoulder in repolarization phase. These electrophysiological properties of nociceptive Aβ-afferent neurons in DRGs resemble those of nociceptive C- and Aδ afferent neurons in DRGs (Fang et al. 2005; Rose et al. 1986). Although in vivo intracellular recordings from DRG neurons show that nociceptive Aβ-afferents respond to high threshold mechanical stimulation applied at the periphery, it remains unknown what types of mechanoreceptors are expressed in nociceptive Aβ-afferents to transduce high threshold mechanical stimuli.
Previous studies on both LTMR Aβ-afferent neurons and nociceptive Aβ-afferent neurons were performed on DRG neurons which innervate the body part of animals. Orofacial regions are innervated by C-, Aδ-, and Aβ-afferents arise from trigeminal ganglia (TG), and very limited studies have been conducted on trigeminal Aβ-afferent neurons. Most previous electrophysiological studies were performed from small-diameter nociceptive TG neurons including those that innervate orofacial regions (Kanda et al. 2021; Viatchenko-Karpinski et al. 2019; Viatchenko-Karpinski et al. 2018). Only recently have we characterized electrophysiological properties of rat trigeminal Aβ-afferent neurons using ex vivo rat trigeminal nerve preparations and patch-clamp recording technique (Okutsu et al. 2021). Based on their distinct AP properties, we previously classified trigeminal Aβ-afferent neurons into four types. Two types (I and II) had AP properties similar to those of LTMR Aβ-afferent neurons, and two other types (IIIa and IIIb) displayed AP properties resembling those of nociceptive Aβ-afferent neurons. In the present study, we further characterized electrophysiological properties of trigeminal Aβ-afferent neurons and classified them into five types based on cluster analysis. Furthermore, we investigated mechanical and chemical sensitivity in the five types of trigeminal Aβ-afferent neurons.
Materials and methods
Animals
Adult male and female Sprague-Dawley rats aged 9–14 weeks were used in experiments. All animal procedures followed the Guide for the Care and Use of Laboratory Animals, U.S. Public Health Service, and were approved by the University of Alabama at Birmingham Institutional Animal Care and Use Committee (IACUC).
Ex vivo trigeminal ganglion preparation and patch-clamp recordings
Ex vivo TG preparation and patch-clamp recordings were performed in a manner similar to our previous studies (Chang et al. 2021; Okutsu et al. 2021). In brief, rats were anesthetized and decapitated, and trigeminal ganglia (TG) were bilaterally dissected out and submerged in ice cold Krebs solution in a 35 mm Petri dish containing (in mM): 117 NaCl, 3.6 KCl, 1.2 Na2PO4, 2.5 CaCl2, 1.2 MgCl2, 25 NaHCO3, and 25 glucose. The Krebs solution was saturated with 95% O2 and 5% CO2, had pH of 7.35, and osmolarity of 324 mOsm. Connective tissue on the surface of the TG was removed with fine forceps, and ex vivo TG preparation was then placed, with dorsal side facing up, in a recording chamber and affixed to the bottom of the chamber with a tissue anchor and submerged in the Krebs solution at the room temperature of 24°C. The recording chamber was mounted on the stage of an Olympus BX51 microscope that was equipped with IR-DIC and fluorescent imaging systems. TGs were exposed to 0.05% dispase II (Roche, Indianapolis, IN, USA) and 0.05% collagenase (MilliporeSigma, Billerica, MA, USA) in the Krebs solution for 7–12 min at the room temperature of 24°C. The enzymes were then washed off with the Krebs solution and TG was continuously perfused at 2 mL/min with the Krebs solution. Under a ×40 objective, V2 TG neurons with diameter ≥40 μm were selected for whole-cell patch-clamp recordings.
For the whole-cell patch-clamp recordings, recording electrodes were pulled with a Flaming/Brown Micropipette Puller (P-97, Sutter Instruments, CA, USA). Patch pipettes were filled with a recording internal solution containing (in mM): 105 Kgluconate, 30 KCl, 2.4 MgCl2, 0.5 CaCl2, 10 HEPES, 5 EGTA, 5 Na2ATP, 0.3 NaGTP (pH 7.3, 330 mOsm). The electrode resistance after filling the recording electrode internal solution ranged from 3 to 6 MΩ. Liquid junction potential was calculated as 12 mV and correction was performed after experiments. To determine the properties of membranes and action potentials of recorded TG neurons, patch-clamp recordings were performed under the whole-cell current-clamp configuration with bridge balance being applied during recordings. Step currents were injected into TG neurons through recording electrodes. Step currents were applied from −0.1 nA to 2 nA with increments of 0.1 nA per step and the duration of each step was 500 ms. APs evoked by current steps were used to determine AP parameters including AP rheobase, amplitude, width, thresholds, dV/dt of AP depolarizations and repolarizations. To determine ionic currents flowing through membranes of TG neurons following voltage steps, recordings were performed under the whole-cell voltage-clamp configuration with TG neuron membranes held at −60 mV. Voltage steps were applied from −100 mV to +50 mV (voltage command of −88 to +62 mV) with increments of 10 mV each step and a step duration of 500 ms. Unless otherwise indicated, membrane voltages mentioned in the texts for this set of experiments have been corrected for the calculated junction potentials of 12 mV.
Signals of current-clamp and voltage-clamp experiments were amplified using a MultiClamp 700B amplifier (Molecular Device). Signals of current-clamp recordings were low-pass filtered at 10 kHz and sampled at 20 kHz. Signals of voltage-clamp recordings were low-pass filtered at 3 kHz and sampled at 20 kHz. The signals were sampled using the pCLAMP 11 software (Molecular Devices). All experiments were performed at 24°C and membranes were held at −72 mV (−60 mV command).
Test of mechanical sensitivity
In a subset of 66 large-diameter TG neurons, mechanical sensitivity of these TG neurons was assessed in response to mechanical displacement of TG neuron membranes by a mechanical probe. The mechanical probe was fabricated with a glass pipette with its tip fire-polished and the size of the tip was ∼2 μm. The mechanical probe was mounted on a pipette holder and controlled by a piezo actuator (Physik Instrumente, Auburn, MA). In the experiment, whole-cell patch-clamp recording was first applied to a large-diameter TG neuron. Then a second electrode was positioned against the recorded neuron, opposite the intended site of mechanical stimulation, serving as an anchor to stabilize the recorded neuron during membrane displacement. Once anchored, the mechanical probe was positioned at the site of stimulation on the surface of the recorded TG neuron. To initiate mechanical stimulation, the tip of the mechanical probe moved downward (30°) to displace cell membranes with displacement steps each at 1 μm increment for up to 30 μm. Each displacement step consisted of a ramp-up phase with a speed of 10 μm/ms, a holding phase of 250 ms, and a ramp-down phase which was the reversal of ramp-up.
Test of chemical sensitivity
In an additional subset of 67 large-diameter TG neurons, cells were tested for their responses to sensory mediators including serotonin (5-HT), acetylcholine (ACh), or adenosine triphosphate (ATP). Large-diameter TG neurons were patch-clamp recorded under the whole-cell voltage-clamp configuration with cells held at −60 mV. 5-HT, ACh, or ATP, each at 2 mM, was focally applied to the recorded TG neuron via a glass pipette that was connected to a gravity-feeding drug application system. The glass pipette had inner diameter of 1.12 mm, and the outlet of the glass pipette was positioned 300 μm away from the recorded TG neuron. Each testing chemical was applied at the rate of 2 mL/min for 6 s.
Data analysis
Membrane Properties
Soma diameter reported as mean of length and width. Resting membrane potential (Vm) was measured immediately after achieving whole-cell configuration. Action potentials (APs) were evoked using depolarizing rectangular current steps each with 100 pA increment for 500 ms. AP rheobase was measured as amplitude of first current step to evoke AP. AP threshold was defined as membrane potential at which rate of depolarization (dV/dt) exceeded 20 mV/ms. AP upstroke was measured from threshold to peak, and AP width was measured as duration between 50% upstroke and 50% repolarization. Decay time constant (τ) of mechanically activated currents (IMA) was determined by exponential curve fitting using Clampfit 11 software (Molecular Devices). Data were analyzed using MATLAB R2020b (MathWorks) and all statistical analyses were performed within Prism 8 (GraphPad). Unless otherwise indicated, data are expressed as plots of individual observations with mean ± SEM. One-way ANOVA with uncorrected Fisher’s LSD test were performed for multiple comparisons as recommend previously (Rothman 1990). To reduce type 1 error (false positive) with the uncorrected Fisher’s LSD, the present study define ‘significance’ using p < 0.01 and ‘high significance’ using p < 0.001, and ‘no significance’ for p ≥ 0.01.
Cluster and factor analysis
Two-step cluster analysis within SPSS (IBM SPSS version 28 IBM Corp., Armonk, New York, USA) was performed (Vaden et al. 2020) on the dataset using 10 variables which included soma diameter, resting membrane potential (Vm), membrane capacitance (Cm), membrane resistance (Rm), AP rheobase, AP threshold, AP amplitude, AP width, negative dV/dt peak amplitude, and action potential shape. Continuous variables were standardized, distance was measured using log-likelihood, cluster number was determined automatically, and Aikaike’s information criterion (AIC) was selected for clustering criterion. Explorative factor analysis (principal component method) within SPSS was performed (David et al. 2007; Ghaderi et al. 2018) on the dataset using the above eight electrophysiological properties (variables) to generate principal component (PC) plots.
Results
Cluster analysis and classification of large-diameter TG neurons
We used ex vivo TG preparations and performed whole-cell patch-clamp recordings from 246 TG neurons whose soma diameters were ≥40 μm (47.48 ± 0.27 μm, n = 246) (Figure 1(a) and (b)). TG somas in this size range are considered to be large-diameter neurons since they were shown to conduct in Aβ-afferent conduction velocity range in our previous study (Okutsu et al. 2021). Two-step cluster analysis (Vaden et al. 2020) was performed on the dataset using eight electrophysiological parameters, including resting membrane potential (Vm), membrane capacitance (Cm), membrane input resistance (Rm), action potential (AP) rheobase, AP threshold, AP amplitude, AP width, and negative dV/dt peak, in addition to soma diameter and AP shape, which resulted in five clusters. Explorative factor analysis (principal component method) was then performed (David et al. 2007; Ghaderi et al. 2018) on the five clusters to identify which of the extracted electrophysiological parameters best clustered individual cells (Figure 1(c)–(e)). Factor analysis served as an independent measurement since the procedure is naïve to number of clusters and membership. Principal component (PC) one and PC2 (Figure 1(c)) were found to summarize >89% of the total variability (Figure 1(e)), with dV/dt and AP width representing the main contributors. Frequency distribution of PC1 within each of the five clusters in plotted in Figure 1(d). Based on the cluster analysis in the present study as well as our previous study (Okutsu et al., 2021), the five clusters were classified as type I (n = 61), IIa (n = 53), IIb (n = 33), IIIa (n = 60), and IIIb (n = 39) large-diameter TG neurons (Figure 1(c)). This classification is consistent with our previous grouping of large-diameter TG neurons based on AP dV/dt, except an additional type, type IIb, is recognized in the present study. Cluster analysis classifies rat large-diameter TG neurons into five types. (a) Ex vivo TG preparation imaged under a ×40 objective. TG neurons with soma diameter ≥40 μm (asterisks indicated) were selected for whole-cell patch-clamp recordings in the present study. (b) Histogram of soma diameters of large-diameter TG neurons included in the present study, dashed line indicates cut-off diameter of 40 μm. TG neurons with diameter <40 μm were excluded. (c) Scatter plot of the first two principal components (PC1 vs PC2) values obtained from factor analysis of electrophysiological properties of large-diameter TG neurons. These properties, presented in Figures 2–5, include resting membrane potential (Vm), membrane capacitance (Cm), membrane input resistance (Rm), action potential (AP) rheobase, AP threshold, AP amplitude, AP width, and negative dV/dt peak. Cluster membership for individual cells is represented by color labeling. (d) Histogram of PC1 within clusters. The plots in c and d show the distribution of five clusters which are termed in the present study as type I (red), IIa (blue), IIb (grey), IIIa (yellow), and IIIb (green) large-diameter TG neurons. (e) Percent variability accounted by each PC.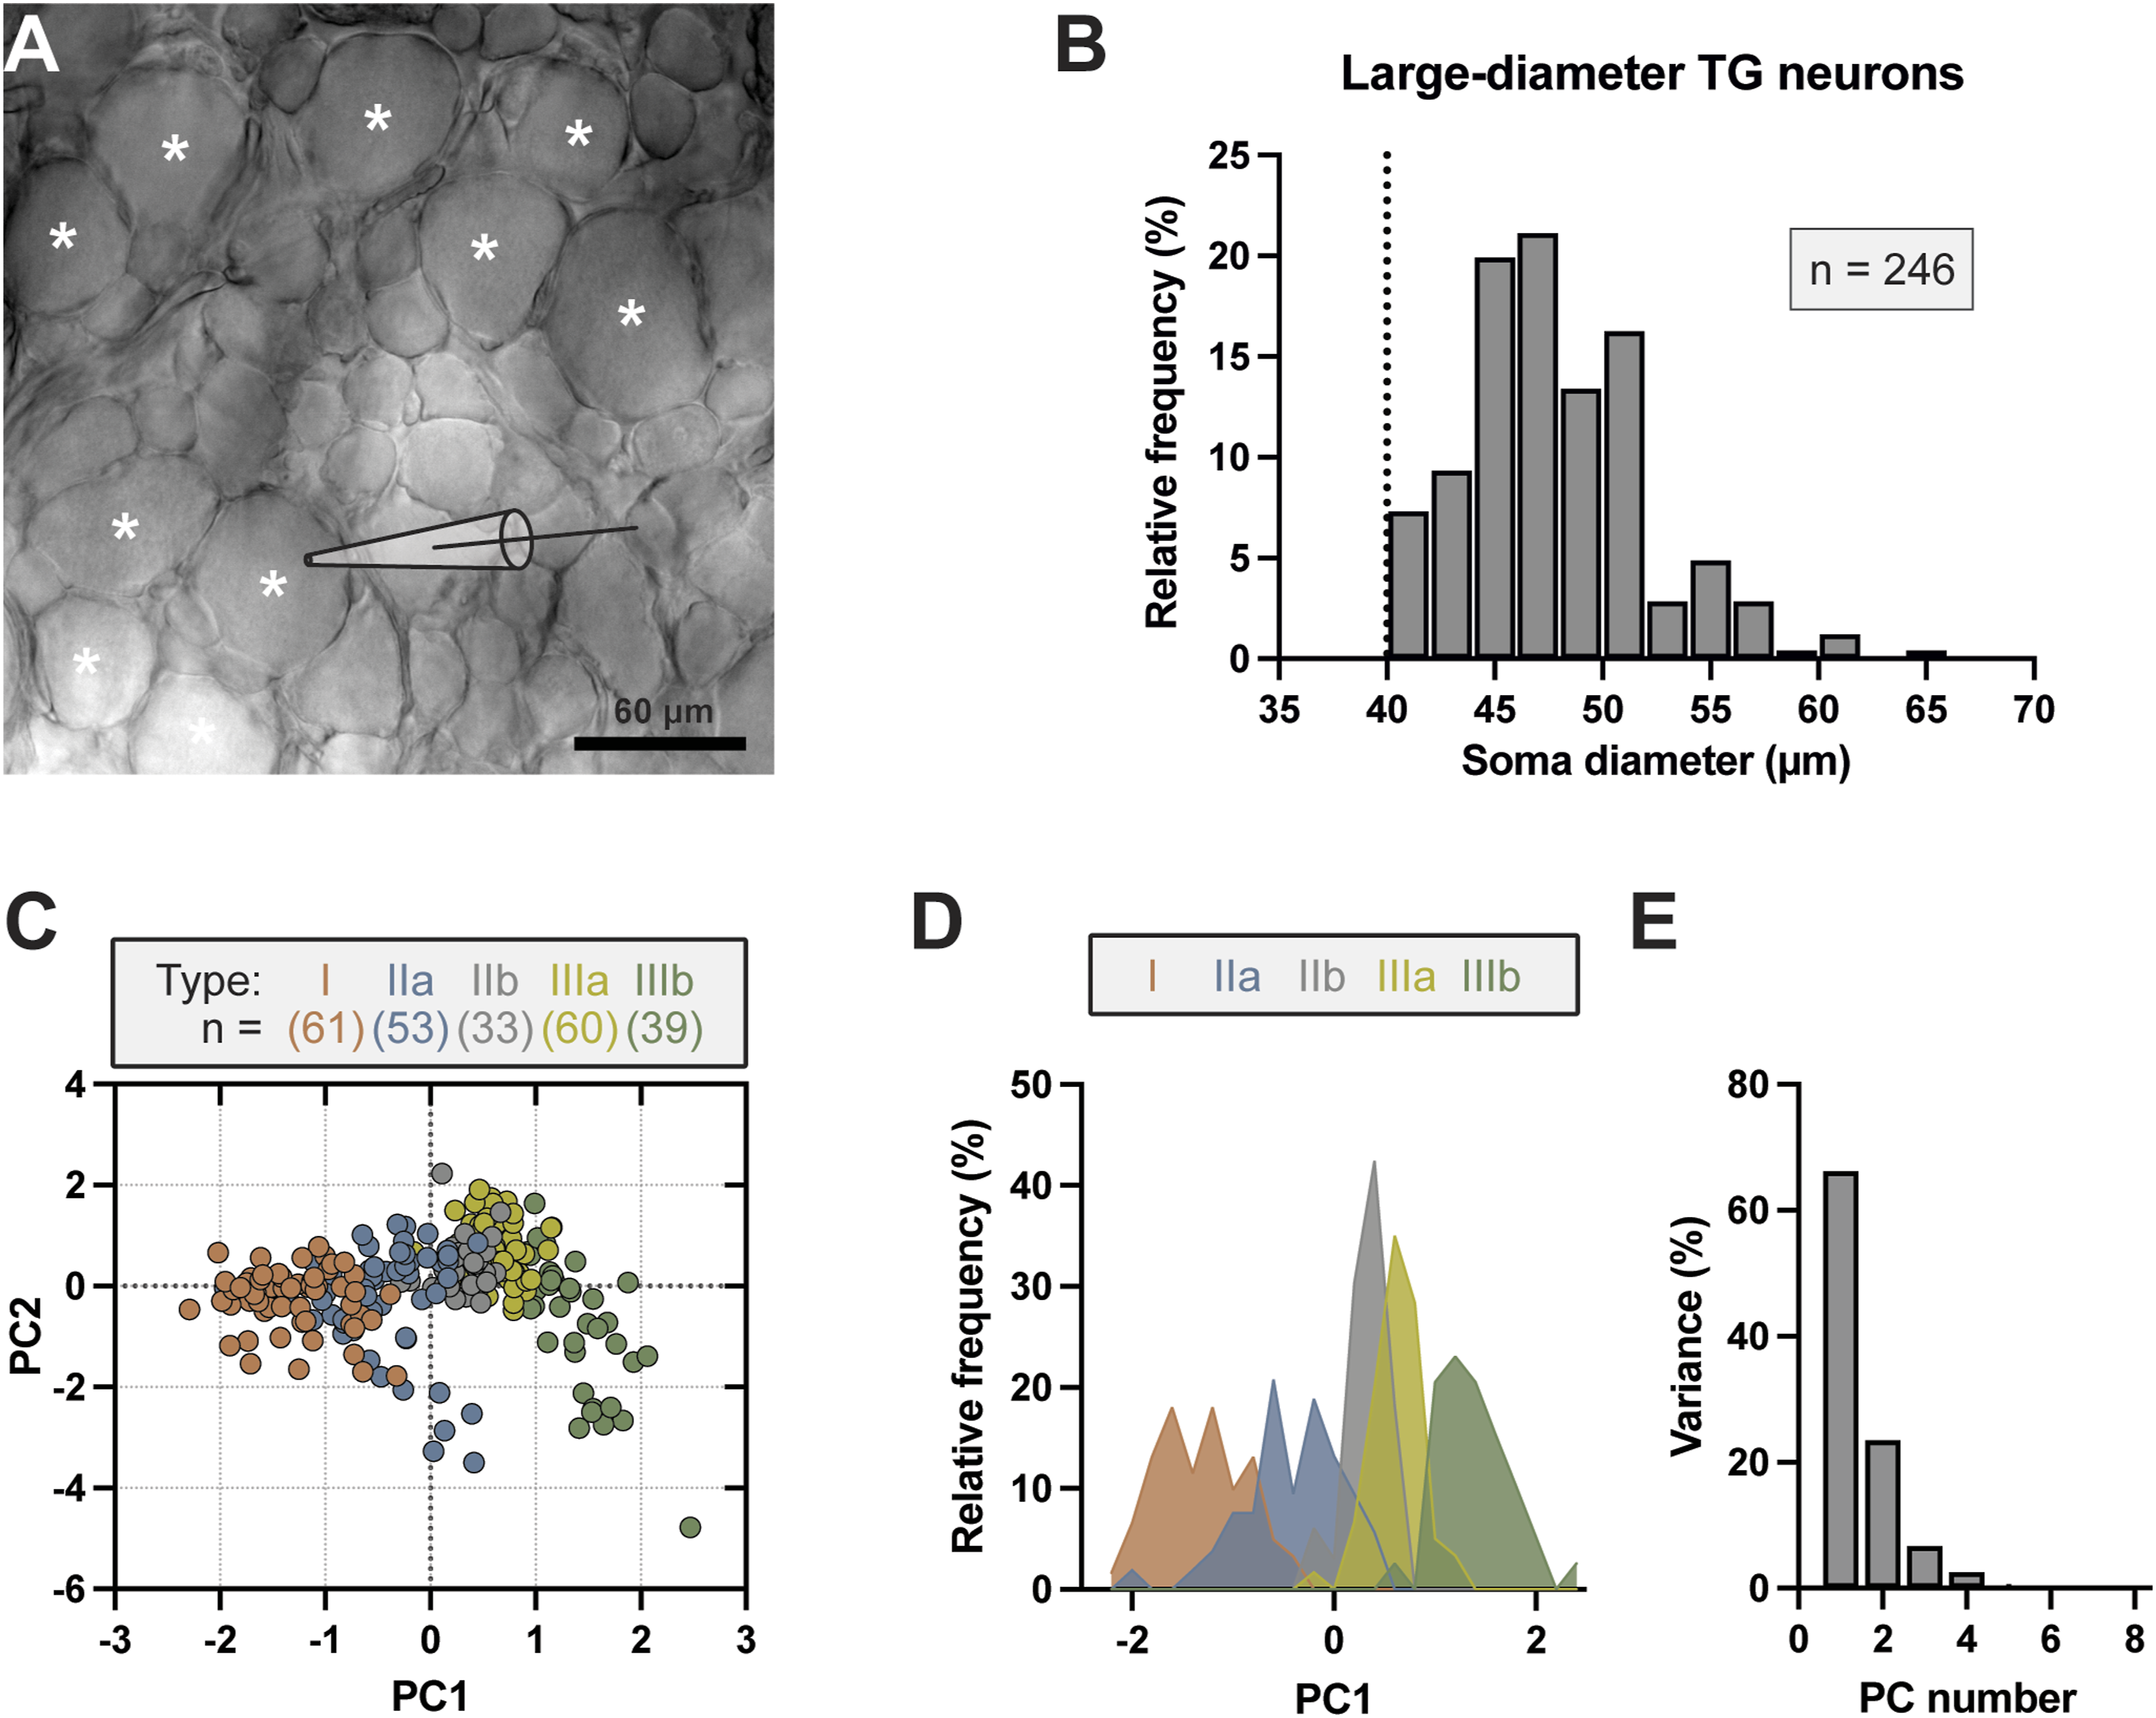
Passive and active membrane properties
Although all recorded cells were large-diameter TG neurons, mean soma diameter was smallest in type IIIb TG neurons (44.74 ± 0.51 μm, n = 39), and significantly different from all other types (Figure 2(a)). Type IIb soma diameter was largest (49.56 ± 0.78 μm, n = 33), followed by type IIIa (48.19 ± 0.48 μm, n = 60), type I (47.48 ± 0.48 μm, n = 61) and IIa (47.39 ± 0.71 μm, n = 53; Figure 2(a)). Membrane capacitance (Cm) was lowest in type I (82.49 ± 1.78 pF, n = 61), and statistically indifferent from type IIa (89.14 ± 3.35 pF, n = 53). Type IIIb (102.2 ± 2.81 pF, n = 39) large diameter TG neurons differed significantly from all other types (p < 0.001; Figure 2(b)). Cm was greatest in type IIb (120 ± 2.57 pF, n = 33 but statistically indifferent from type IIIa large-diameter TG neurons (118.5 ± 2 pF, n = 60). Resting membrane potential (Vm) was most negative in type I (−76.38 ± 0.49 mV, n = 61) and least negative in type IIb large-diameter TG neurons (−71.48 ± 0.73 mV, n = 33), with type IIa (−74.56 ± 0.56 mV, n = 53), IIIa (−72.05 ± 0.42 mV, n = 60), and IIIb large-diameter TG neurons (−73.42 ± 0.79 mV, n = 39) in between (Figure 2(c)). Membrane input resistance (Rm) was greatest in type IIIb (82.66 ± 6.35 MΩ, n = 39), and differed significantly from type I (37.76 ± 2.1 MΩ, n = 61), type IIa (48.38 ± 4.23 MΩ, n = 53), type IIb (50.76 ± 2.26 MΩ, n = 33), and IIIa large-diameter TG neurons (41.71 ± 1.76 MΩ, n = 60). Passive membrane properties of five types of large-diameter TG neurons. (a–d) Scatter plot of (a) soma diameter, (b) membrane capacitance, (c) resting membrane potential, and (d) membrane resistance. Sample sizes: type I (n = 61, orange), IIa (n = 53, blue), IIb (n = 33, grey), IIIa (n = 60, yellow), and IIIb (n = 39, green). Each symbol represents an individual experimental observation, mean ± SEM values are also shown, **p < 0.01, ***p < 0.001.
Action potentials evoked in response to supra-threshold stimulation varied in amplitude and kinetics amongst the five types of large-diameter TG neurons (Figure 3(a)). Characteristic waveforms of APs were small and narrow for type I large-diameter TG neurons, and increased incrementally in amplitude and time course by type to the large and broad waveforms observed in type IIIb TG neurons. Deflection during repolarization was evident in type IIIa and type IIIb TG neurons. AP upstroke was smallest in type I (59.19 ± 0.95 mV, n = 61), and significantly higher with type IIa (67.70 ± 0.95 mV, n = 53, p < 0.001), type IIb (71.57 ± 1.01 mV, n = 33, p < 0.001), type IIIa (80.31 ± 0.95 mV, n = 60, p < 0.001), and type IIIb (81.02 ± 1.15 mV, n = 39, p < 0.001) large-diameter TG neurons (Figure 3(c)). No difference was observed between IIIa and IIIb (Figure 3(c)). AP kinetics, measured as AP width, were also fastest in type I (0.52 ± 0.01 ms, n = 61), slowing in type IIa (0.65 ± 0.01 ms, n = 53, p = 0.01), and significantly in IIb (0.83 ± 0.01 ms, n = 33, p < 0.001), IIIa (1.24 ± 0.02 ms, n = 60, p < 0.001), and IIIb (2.12 ± 0.10 ms, n = 39, p < 0.001; Figure 3(d)). Rheobase was lowest in type IIIb (1.19 ± 0.07 nA, n = 39), significantly higher in type IIIa (1.57 ± 0.06 nA, n = 60, p < 0.01), IIb (1.64 ± 0.09 nA, n = 33, p < 0.01), IIa (1.77 ± 0.09 nA, n = 53, p < 0.001), and I (1.98 ± 0.14 nA, n = 61, p < 0.001), in comparison (Figure 3(e)). AP threshold was lowest in type IIIa (−43.31 ± 0.83 mV, n = 60), compared to type I (−40.93 ± 0.74 mV, n = 61), IIb (−39.95 ± 1.09 mV, n = 33), IIIb (−40.64 ± 1.23 mV, n = 39), and type IIa TG neurons (−42.54 ± 0.95 mV, n = 53; Figure 3(f)). Active membrane properties of five types of large-diameter TG neurons. (a) Action potentials (APs) evoked by suprathreshold current injection in type I (orange), IIa (blue), IIb (grey), IIIa (yellow), and IIIb (green) large-diameter TG neurons. (b) The dV/dt transformation of APs of type I (red), IIa (blue), IIb (grey), IIIa (yellow), and IIIb (green) large-diameter TG neurons. In both a and b, values of mean ± SEM are used for each trace and all traces are aligned at measured threshold (20 mV/ms, dashed line). (c–h) Scatter plot of AP rheobase (c), AP threshold (d), AP upstroke (e), AP width (f), dV/dt depolarizing peak (g), and dV/dt repolarizing peak (h) in the five types of large-diameter TG neurons. Sample sizes: type I (n = 61, orange), IIa (n = 53, blue), IIb (n = 33, grey), IIIa (n = 60, yellow), and IIIb (n = 39, green). For C-H, each symbol represents an individual experimental observation, mean ± SEM values are also shown, **p < 0.01, ***p < 0.001.
Examining the time derivative of membrane voltage (dV/dt) reveals distinct action potential properties amongst all five types (Figure 3(b)). Maximal rate of depolarization was greatest and statistically indifferent for types I (274.7 ± 5.80 mV/ms, n = 61), IIa (292.1 ± 6.46 mV/ms, n = 53), and IIb TG neurons (280.2 ± 9.11 mV/ms, n = 33), reducing significantly in type IIIa (249.8 ± 6.58 mV/ms, n = 60, p < 0.01) and again, further in type IIIb TG neurons (165.8 ± 8.96 mV/ms, n = 39, p < 0.001, Figure 3(g)). Membrane repolarization was fastest in type I neurons (−176.5 ± 2.81 mV/ms, n = 61; Figure 3(h)), indicated by the large and narrow negative dV/dt peak (Figure 3(b)). A significant slowing of membrane repolarization was noted in type IIa (−135.6 ± 2.50 mV/ms, n = 53; Figure 3(h)), resulting in both blunting and broadening of the negative dV/dt peak (Figure 3(b)). With type IIb (−107 ± 1.89 mV/ms, n = 33; Figure 3(h)), the distinct and singular peak observed in types I and IIa is lost, and the emergence of a brief plateau becomes evident (Figure 3(b)), reflecting the significant reduction in measured rate of membrane voltage change. This plateau is significantly reduced in amplitude for type IIIa (−89.69 ± 1.46 mV/ms, n = 60; Figure 3(h)), transitioning from brief to intermediate in duration (Figure 3(b)), and further reduction in measured rate of membrane repolarization resulted in the shallow and prolonged plateau observed in type IIIb (−59.44 ± 2.06 mV/ms, n = 39; Figures 3(b) and (h)).
Voltage-activated currents
Depolarizing voltage steps evoked fast inward currents immediately followed by outward currents in each type of large-diameter TG neurons (Figure 4(a)). Outward currents evoked by depolarizing voltages in somatosensory neurons are mainly mediated by voltage-gated K+ channels. Outward currents in large-diameter TG neurons usually display adaptation with peak amplitudes at the initial phase and reduced amplitudes at late phase of the voltage commend step. Large outward current at the initial phase was not significantly different among the five types of large-diameter TG neurons (I, 714.7 ± 24.45 nA*mV, n = 60; IIa, 730.8 ± 23.14 nA*mV, n = 49; IIb, 670.6 ± 26.30 nA*mV, n = 32; IIIa, 705.7 ± 23.46 nA*mV, n = 59; IIIb, 676.8 ± 27.72 nA*mV, n = 38; Figure 4(b) and (d)). This was clearly demonstrated by the I-V curves (Figure 4(b)) and the area under the I-V curve (Figure 4(d)) of the initial phase outward currents recorded from the five types of large-diameter TG neurons. However, the outward currents at the late phase displayed significant difference among different types of large-diameter TG neurons (Figure 4(c) and (e)), as was shown by their I-V curves (Figure 4(c)) and AUC (Figure 4(e)). For example, AUC of late phase outward currents was greatest in type I (638.4 ± 20.82 nA*mV, n = 60), statistically indifferent from IIa (642.9 ± 19.60 nA*mV, n = 49), and IIb (581.6 ± 20.14 nA*mV, n = 32). AUC was lowest for type IIIb (482.9 ± 19.39 nA*mV, n = 38), which was statistically different from IIIa (564.8 ± 13.92 nA*mV, n = 59, p < 0.01), IIb (p < 0.01), IIa (p < 0.001), and I (p < 0.001; Figure 4(e)). Normalizing the late phase AUC to the initial phase AUC (late/initial) allowed for quantification of outward current adaptation amongst large-diameter TG neuron types. Outward current adaptation was low in type I (89.79 ± 0.61%, n = 60), IIa (88.37 ± 0.81%, n = 49), and IIb large-diameter TG neurons (87.33 ± 0.75%, n = 32), and there was no significant difference among them. The degree of outward current adaptation was higher in type IIIa (81.82 ± 1.26%, n = 59, p < 0.001) and greatest in type IIIb large-diameter TG neurons (71.90 ± 1.34%, n = 38, p < 0.001, Figure 4(f)). Voltage-activated outward currents in five types of large-diameter TG neurons. (a) Example traces of voltage-activated currents in a type I (orange), IIa (blue), IIb (grey), IIIa (yellow), and IIIb (green) large-diameter TG neuron. Solid arrowheads and open arrowheads indicate initial phase and late phase of voltage-activated outward currents which were used for current-voltage relationship plots in b and c, respectively. Cells were held at −60 mV and voltage steps were applied from −100 to 50 mV with 10 mV increment each step. (b, c) Current-voltage (I–V) relationship of voltage-activated outward currents at initial stage (b) and late stage (c) for type I, IIa, IIb, IIIa, and IIIb large-diameter TG neurons. (d, e) Area under the I–V curve (AUC) of voltage-activated outward currents at initial phase (d) and late phase (e) for type I, IIa, IIb, IIIa, and IIIb large-diameter TG neurons. (f) Ratio of late and initial outward current AUCs for type I, IIa, IIb, IIIa, and IIIb large-diameter TG neurons. In b–f, sample sizes were type I = 61, type IIa = 53, type IIb = 33, type IIIa = 60, type IIIb = 39. For d–e, each symbol represents an individual experimental observation, mean ± SEM values are also shown, **p < 0.01, ***p < 0.001.
We examined fast inward currents evoked by depolarizing voltage steps in large-diameter TG neurons. The fast inward currents recorded from the five types of large-diameter TG neurons displayed different kinetics (Figure 5(a)). We used half width of the inward current evoked at different depolarizing voltage steps as a measure of inward current kinetics (Figure 5(b)). The half widths of inward currents evoked by depolarizing voltages differed among the five types of large-diameter TG neurons (Figure 5(b)). For example, with the step to −10 mV, inward current half width duration was 0.42 ± 0.01 ms (n = 60) for type I, 0.49 ± 0.01 ms (n = 49) for type IIa, 0.58 ± 0.01 ms (n = 32) for type IIb, 0.81 ± 0.02 ms (n = 59) for type IIIa, and 1.14 ± 0.04 (n = 38) for type IIIb TG Neurons (Figure 5(b)). The differences in inward current half width were less with higher voltage steps (Figure 5(b)). Area under the curve of inward current haft width vs voltage steps were calculated and used for statistical comparison (Figure 5(c)). AUC was 24.22 ± 0.23 ms*mV (n = 60) for type I, 27.06 ± 0.31 ms*mV (n = 49) for type IIa, 32.05 ± 0.43 ms*mV (n = 32) for type IIb, 42.63 ± 0.73 ms*mV (n = 59) for type IIIa, and 55.03 ± 1.46 ms*mV (n = 38) for type IIIb, and statistical significance was observed amongst all five types of large-diameter TG neurons (Figure 5(c)). Voltage-activated transient inward current in five types of large-diameter TG neurons. (a) Averaged and normalized traces of transient inward currents evoked by depolarizing voltage step from −60 to −10 mV (voltage command) show different current kinetics in type I (orange), IIa (blue), IIb (grey), IIIa (yellow), IIIb (green) large-diameter TG neurons. (b) Width at half max (WHM) of inward current evoked by voltage steps from holding voltage of −60 mV to different depolarizing voltages in type I (n = 60, orange), IIa (n = 49, blue), IIb (n = 32, grey), IIIa (n = 59, yellow), IIIb (n = 38, green) large-diameter TG neurons. Data represent Mean ± SEM (c) Area under the curve (AUC) integrated from data in B to compare WHM among type I (n = 60, orange); IIa (n = 49, blue), IIb (n = 32, grey), IIIa (n = 59, yellow) and IIIb (n = 38, green) large-diameter TG neurons. Data represent mean ± SEM, **p < 0.01, ***p < 0.001.
Hyperpolarization-evoked membrane potential sag
Membrane potential sag observed in response to hyperpolarizing current injection occurs as a result of HCN-mediated currents (Ih) (Hogan and Poroli 2008). Figure 6(a) shows example traces of membrane potential sag of the five types of large-diameter TG neurons in response to negative current pulses that hyperpolarized membranes from Vm to −140 mV. Current amplitude necessary for hyperpolarizing membrane from Vm to −140 mV was significantly less for type IIIb (0.92 ± 0.07 nA, n = 39), compared to type I (1.48 ± 0.04 nA, n = 61, p < 0.001), IIa (1.49 ± 0.08 nA, n = 53, p < 0.001), IIb (1.46 ± 0.06 nA, n = 33, p < 0.001), and IIIa neurons (1.65 ± 0.09 nA, n = 59, p < 0.001, Figure 6(b)). The resultant sag potential was measured (Figure 6(a) and (c)). Sag potential observed in type IIIb large-diameter TG neurons was significantly smaller in amplitude (30.37 ± 1.90 mV, n = 38, p < 0.001) than other types, and two neurons included in type IIIb were found to be absent of sag potential (Figure 6(c)). Sag potential was greatest in type IIb (47.34 ± 1.04 mV, n = 33), followed by type IIa (44.80 ± 0.71 mV, n = 51), IIIa (43.99 ± 0.77 mV, n = 58), and I (43.71 ± 0.71 mV, n = 61). Membrane sag potential in five types of large-diameter TG neurons. (a) Five sets of traces show membrane potential sags induced by hyperpolarizing current steps injected into type I (first panel), IIa (2nd panel), IIb (3rd panel), IIIa (4th panel), and IIIb (5th panel) large-diameter TG neurons. Sag potentials are indicated by the dashed lines in each panel. Hyperpolarizing current steps are indicated on the top of each trace, which initially hyperpolarized TG neuron membranes from Vm to −140 mV (top) in each tested cells. Values of mean ± SEM are used for graph the traces. (b) Summary data of hyperpolarizing currents required to hyperpolarize membrane potentials from Vm to −140 mV in type I (n = 61), IIa (n = 53), IIb (n = 33), IIIa (n = 60), and IIIb (n = 39) large-diameter TG neurons. (c) Summary data of sag potentials occurred following membrane hyperpolarization to −140 mV in type I (n = 61), IIa (n = 53), IIb (n = 33), IIIa (n = 60), and IIIb (n = 39) large-diameter TG neurons. Each symbol represents an individual experimental observation, mean ± SEM values are also shown, **p < 0.01, ***p < 0.001.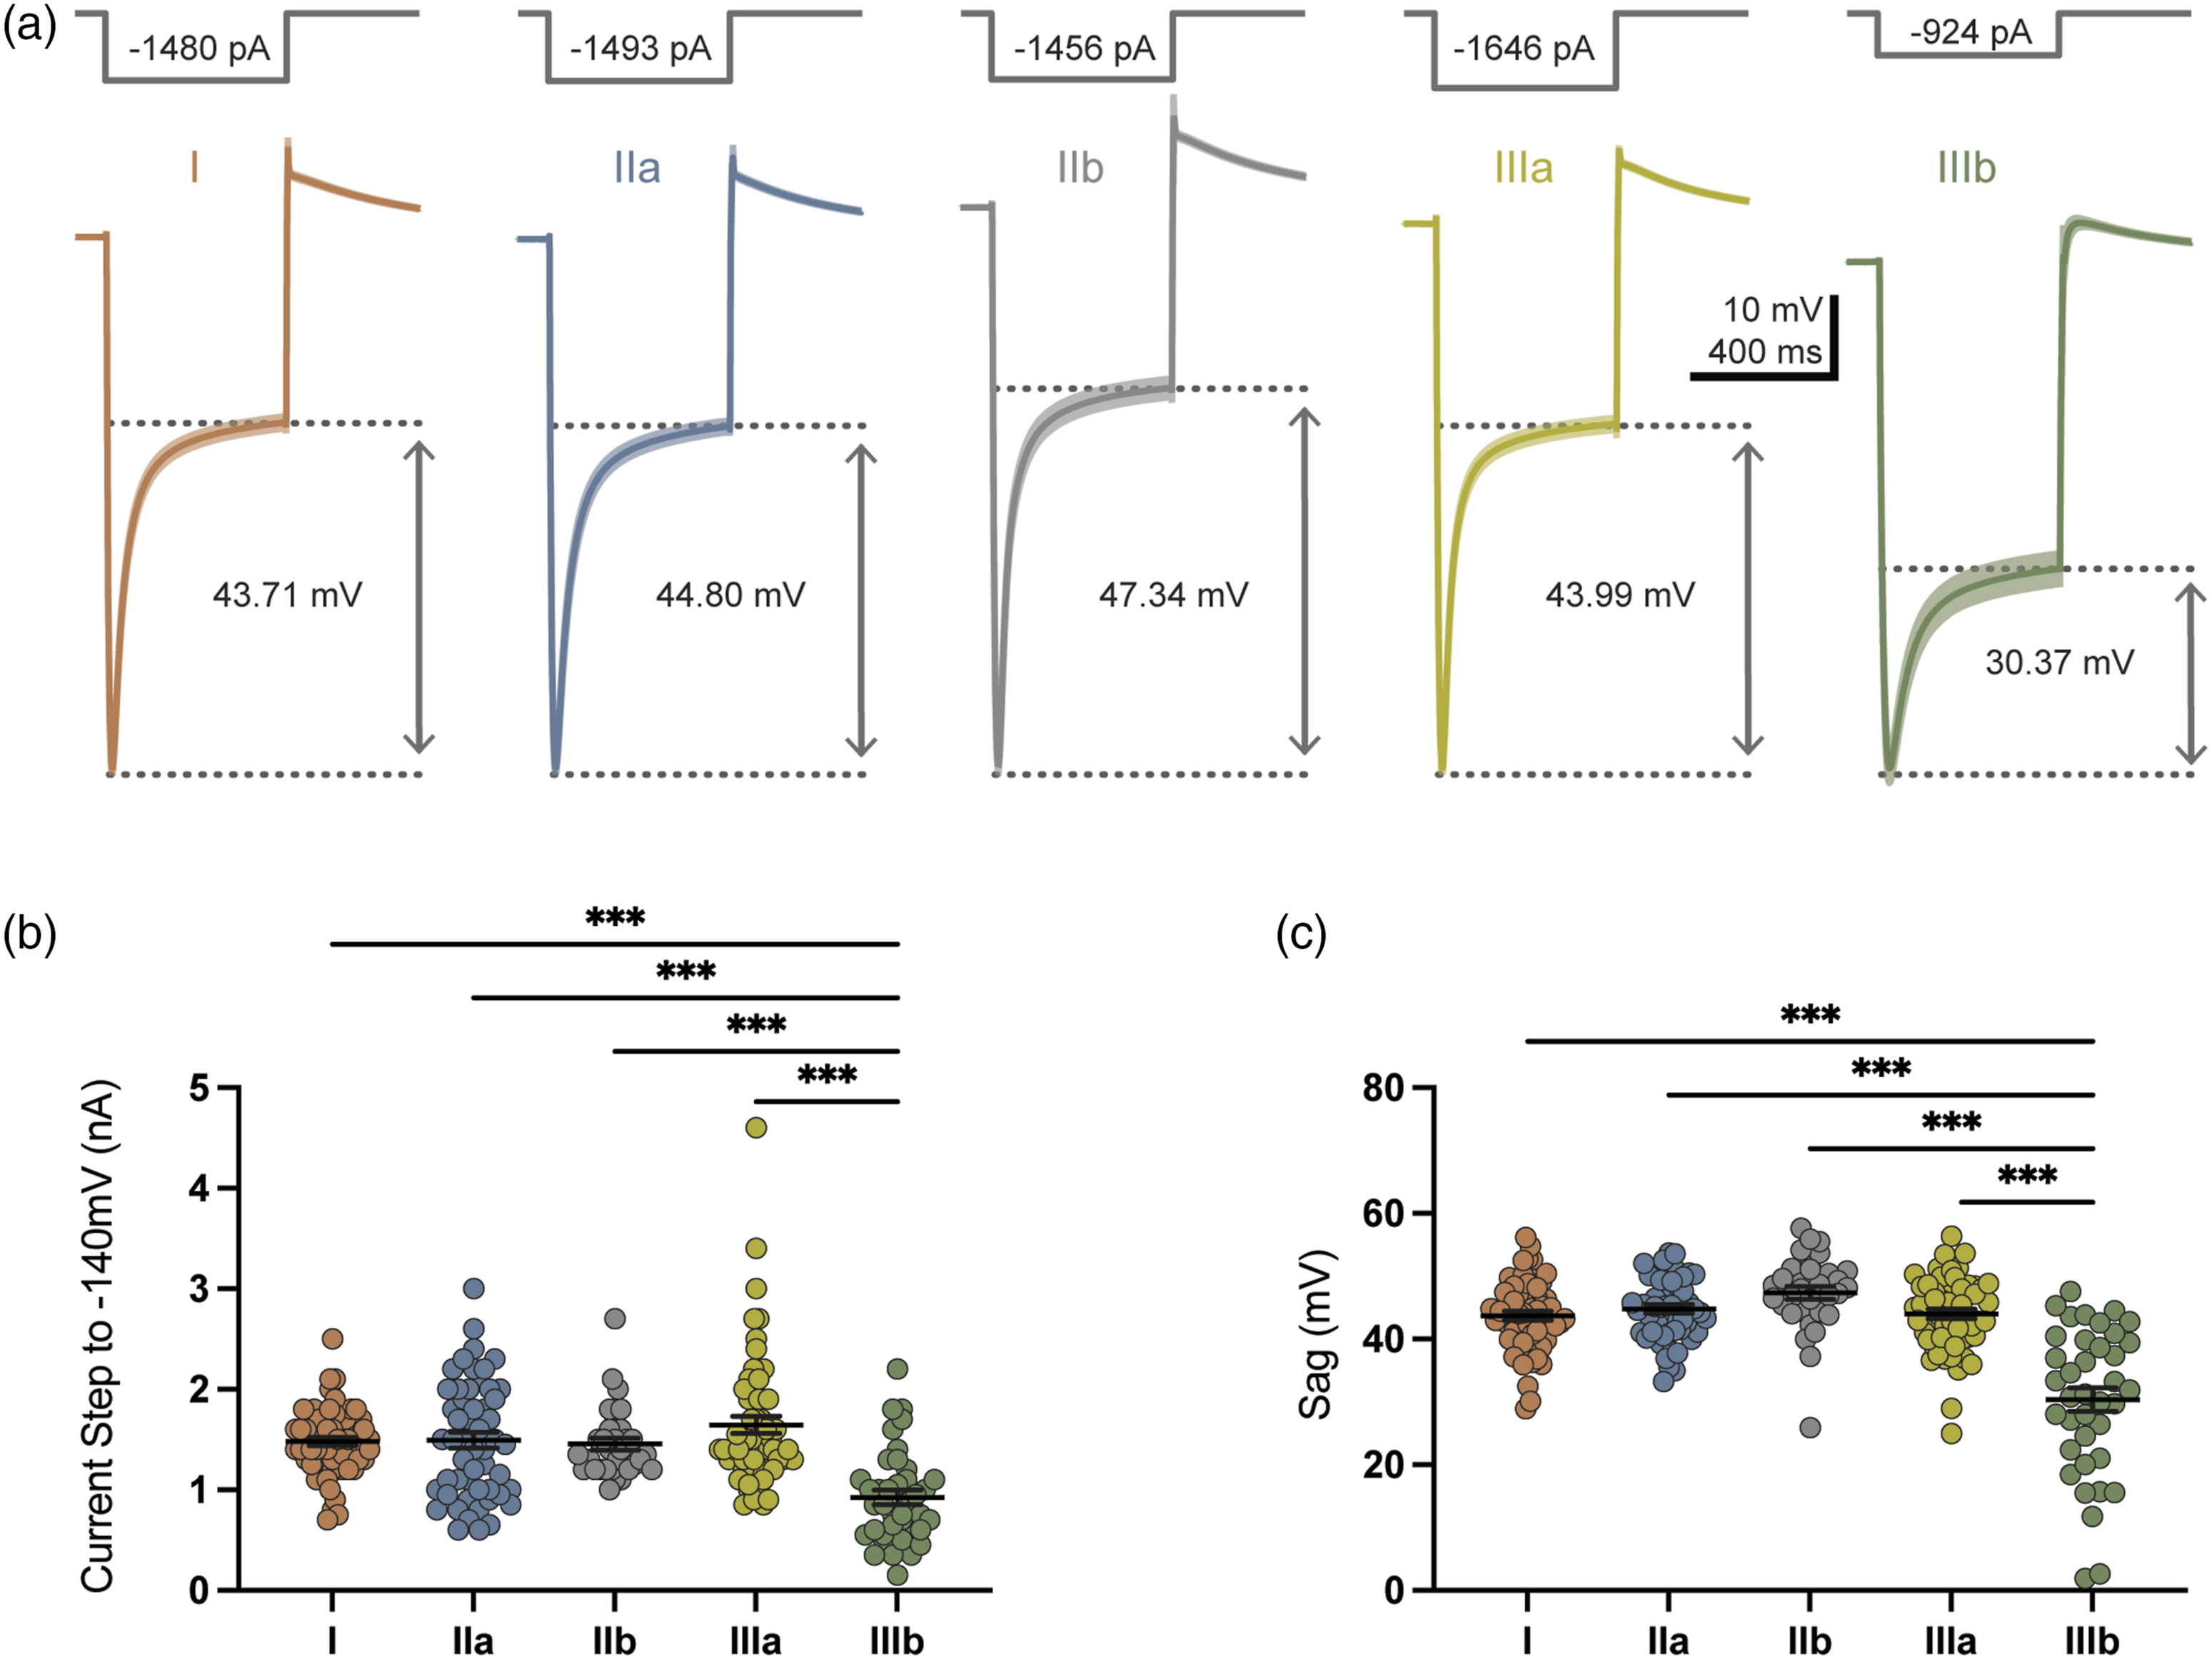
Mechanical sensitivity
In a subset of 66 large-diameter TG neurons, mechanical sensitivity was assessed in response to membrane displacement for up to 30 μm. Within the five types of large-diameter TG neurons, divergent mechanical sensitivity was observed. Robust mechanically activated current (IMA) was observed in types I, IIa, and IIb (Figure 7(a), (c), and (d)), with varied rates of current adaptation (Figure 7(a)). Mechanical sensitivity was minimal or absent in types IIIa and IIIb neurons, and in the sample population, appear insensitive to mechanical stimulation with membrane displacement (Figure 7(a), (c), and (d)). Measured as AUC, IMA was greatest in type IIa (3.75 ± 0.27 nA*μm, n = 20), yet not statistically greater than type I (3.12 ± 0.26 nA*μm, n = 20), or type IIb (3.02 ± 0.29 nA*μm, n = 8, p = 0.06). While no statistical difference in AUC was observed between types IIIa (0.40 ± 0.03 nA*μm, n = 8) and IIIb (0.30 ± 0.02 nA*μm, n = 10), both types were statistically different from types I (p < 0.001), IIa (p < 0.001), and IIb (p < 0.001). To account for observed difference in soma diameter and the fact that not all neurons were able to sustain 30 μm displacement, membrane displacement was normalized by soma diameter of each cell. Mechanical responses to the normalized membrane displacement also showed high mechanical sensitivity in type I, IIa, and IIb, but not type IIIa and IIIb neurons (Figure 7(b)). We compared IMA evoked by membrane displacement of 40% soma diameter among the five large-diameter TG neurons. Large amplitudes were observed in types I (131.7 ± 20.43 pA, n = 14), IIa (151.9 ± 19.07 pA, n = 19), and IIb (121 ± 29.48 pA, n = 8), that were statistically indifferent from each other, but significantly greater than amplitudes of IIIa (20.95 ± 4.71 pA, n = 7) and IIIb (15.32 ± 3.82 pA, n = 8, Figure 7(e)). Decay time constant (τ) of IMA was measured for types I (2.60 ± 0.42 ms, n = 14), IIa (5.35 ± 0.97 ms, n = 19), and IIb (10.71 ± 2.66 ms, n = 8), revealing significant differences between type I and IIb (p < 0.001), IIa and IIb (p = 0.007), but not I and IIa (p = 0.09). Defining mechanical sensitivity as a mechanically evoked current greater than 50 pA in amplitude, types IIIa and IIIb were observed to be mechanically insensitive. Mechanical sensitivity of five types of large-diameter TG neurons. (a) Five sets of example traces of mechanically activated currents (IMA) in response to membrane displacement in a type I (1st panel), IIa (2nd panel), IIb (3rd panel), IIIa (4th panel), and IIIb (5th panel) large-diameter TG neuron. Membrane displacements, from 1 to 30 μm with increment of 1 μm, are indicated on the top of each set of example traces. (b) IMA amplitude-displacement plot of individual type I (n = 14), IIa (n = 19), IIb (n = 8), IIIa (n = 7), and IIIb (n = 8) large-diameter TG neurons. Membrane displacement is normalized to soma diameter. (c and d) Summary IMA amplitude-displacement plot (c) and area under the curve (AUC), d, for type I (n = 20), IIa (n = 20), IIb (n = 8), IIIa (n = 8), and IIIb (n = 10) large-diameter TG neurons. (e) Comparison of IMA currents in response to displacement equivalent to 40% of soma diameter among type I (n = 14), IIa (n = 19), IIb (n = 8), IIIa (n = 7), and IIIb (n = 8) large-diameter TG neurons. Each symbol represents an individual experimental observation. Mean ± SEM values are shown in c–e, **p < 0.01, ***p < 0.001.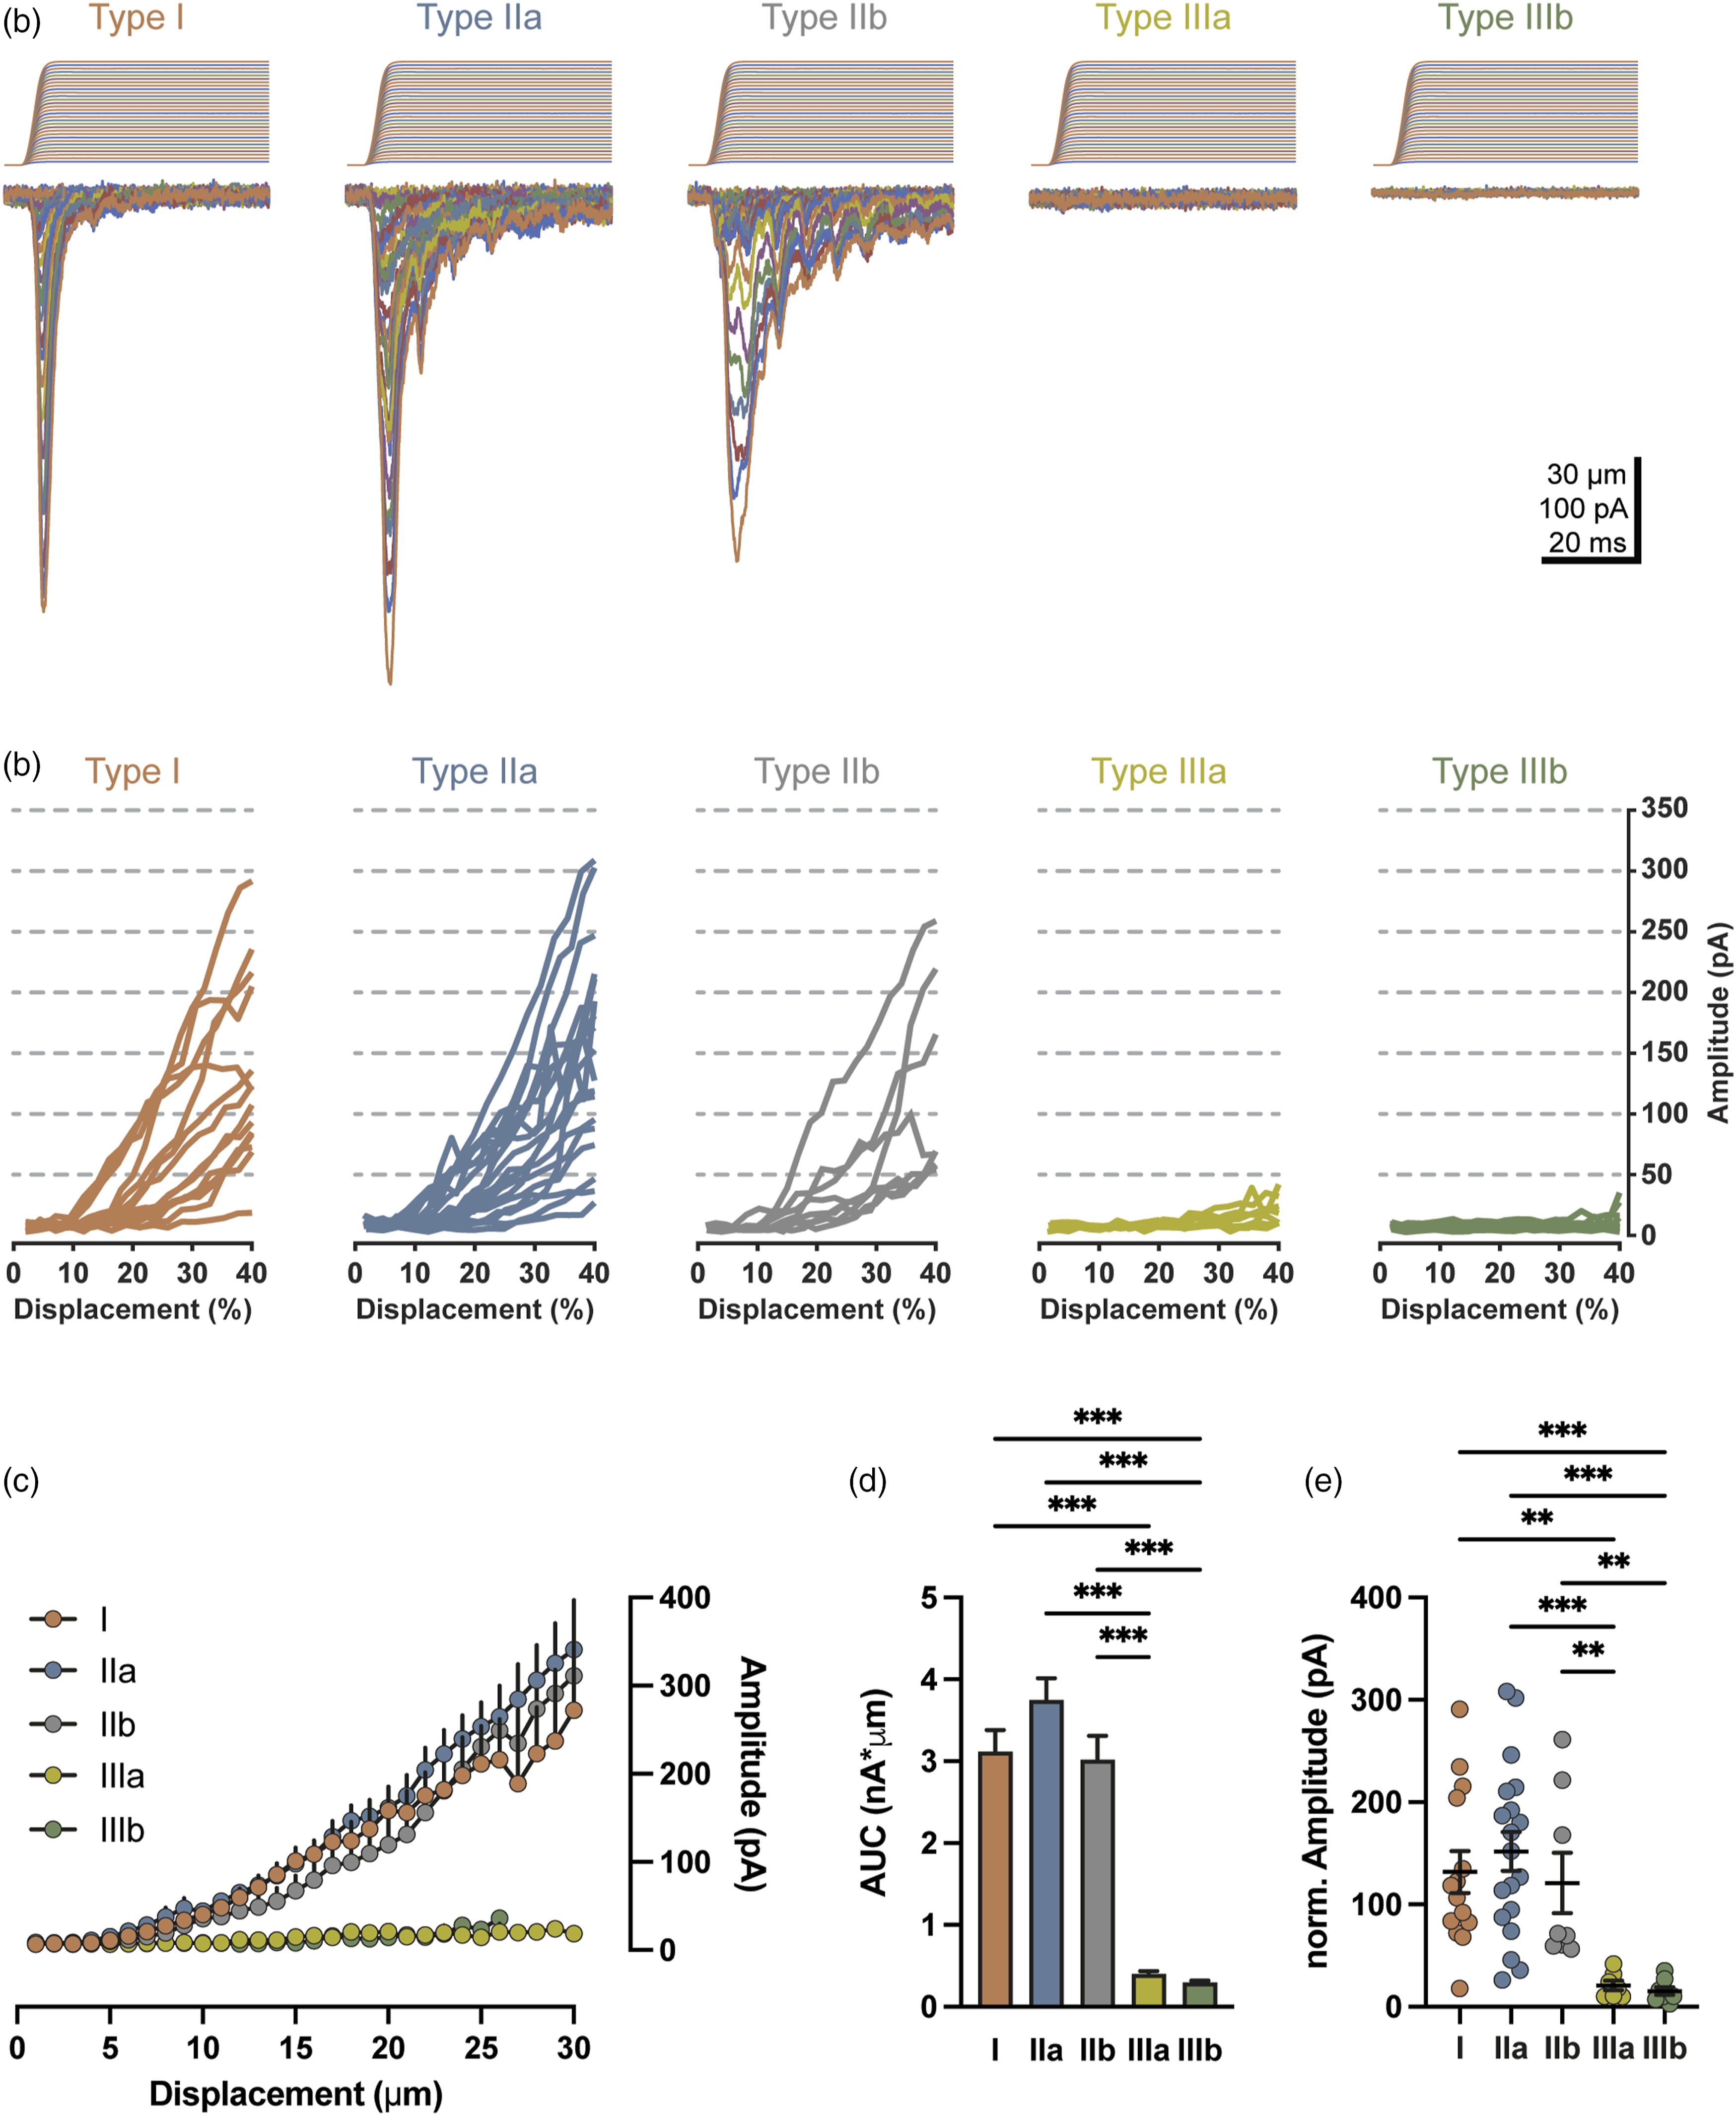
Sensitivity to sensory mediators 5-HT, ACh, and ATP
In an additional subset of 67 large-diameter TG neurons, sensitivity to sensory mediators including serotonin (5-HT), acetylcholine (ACh), or adenosine triphosphate (ATP) was tested. Focal application of 5-HT (2 mM) evoked robust inward currents in both type IIIb (777.3 ± 137.8 pA, n = 12) and, to a significantly lesser degree, IIIa (306.9 ± 63.42 pA, n = 18, p < 0.001), as measured in contrast to the minimal inward currents observed in type I (59.37 ± 4.86 pA, n = 16, p < 0.001), IIa (55.44 ± 16.39 pA, n = 11, p < 0.001), and IIb large-diameter TG neurons (105.8 ± 29.06 pA, n = 10, p < 0.001), which were statistically indifferent from each other (Figure 8(a) and (b)). In order to explore a type-based categorical 5-HT sensitivity, neurons were classified as either responders (defined as neurons with evoked inward current of 50 pA or greater in amplitude) or non-responders (defined as neurons with evoked inward current of less than 50 pA in amplitude), and resultant percent of 5-HT responsive neurons was plotted by type (Figure 8(c)). Overall, differing percent of 5-HT responsive neurons was measured amongst types, with low percent observed in type IIa (36.4%), moderate percent in I (62.5%) and IIb (70%), and high percent observed in types IIIa (83.3%), and IIIb (100%). Similarly, application of ACh evoked robust and significant inward currents in IIIb (2142 ± 496.5 pA, n = 12), with further evaluation of the distribution suggesting a potential subset split for ACh sensitivity within type IIIb (Figure 8(d) and (e)). Although a few type IIIa neurons displayed robust inward currents greater than 2 nA, the group average was smaller in amplitude (553.2 ± 204.2 pA, n = 18), and statistically indifferent from type I (232.1 ± 42.39 pA, n = 16), type IIa (130.6 ± 32.06 pA, n = 11), and IIb (203.1 ± 44.18 pA, n = 10). Compared to 5-HT, focal application of ACh resulted in less pronounced type-based difference in percent of ACh responsive neurons, and moderate to high percent of neurons responded to ACh (type I, 93.8%; IIa, 72.7%; IIb, 100%; IIIa, 94.4%; and IIIb, 100%; Figure 8(f)). ATP-evoked inward currents were greatest in amplitude for type IIb (259.2 ± 52.86 pA, n = 10), and significantly different compared to type I (100.6 ± 15.47 pA, n = 16, p < 0.01), which displayed the smallest response and least variability by type (Figure 8(g) and (h)). Larger, but statistically indifferent responses were observed in type IIa (144.5 ± 41.24 pA, n = 11), IIIa (206 ± 39.46 pA, n = 18), and IIIb (159.9 ± 34.35 pA, n = 12). Similar to ACh but with some reductions, the percent of type-based ATP responsive neurons was low for type IIa (54.5%), moderate for type I (75%), and high for types IIb (100%), IIIa (83.3%), and IIIb (91.7%; Figure 8(i)). Chemical sensitivity of five types of large-diameter TG neurons. (a) Example traces of inward currents evoked in response to focal application of 5-HT (2 mM) in the five types of large-diameter TG neurons. (b) Summary plots of 5-HT-evoked inward currents in type I (n = 16), IIa (n = 11), IIb (n = 10), IIIa (n = 18), and IIIb (n = 12) large-diameter TG neurons. (c) Percent of 5-HT-responsive cells in type I (12.5%; 2/16), IIa (27.3%; 3/11), IIb (70%; 7/10), IIIa (83%; 15/18), and IIIb (100%; 12/12) large-diameter TG neurons. (d) Example traces of inward currents evoked in response to focal application of ACh (2 mM) in five types of large-diameter TG neurons. (e) Summary plots of ACh-evoked inward currents in type I (n = 16), IIa (n = 11), IIb (n = 10), IIIa (n = 18), and IIIb (n = 12) large-diameter TG neurons. (f) Percent of ACh-responsive cells in type I (87.5%; 14/16), IIa (63.6%; 7/11), IIb (100%; 10/10), IIIa (94.4%; 17/18), and IIIb (100%; 12/12) large-diameter TG neurons. (g) Example traces of inward currents evoked in response to focal application of ATP (2 mM) in five types of large-diameter TG neurons. (H) Summary plots of ATP-evoked inward currents in type I (n = 16), IIa (n = 11), IIb (n = 10), IIIa (n = 18), and IIIb (n = 12) large-diameter TG neurons. (i) Percent of ATP-responsive cells in type I (62.5%; 10/16), IIa (54.5%; 6/11), IIb (90%; 9/10), IIIa (83%; 15/18), and IIIb (66.6%; 8/12) large-diameter TG neurons. In b, e, and h, individual observations as well as Mean ± SEM are shown, **p < 0.01, ***p < 0.001.
Discussion
The experiments presented here demonstrate a heterogeneous population of large-diameter afferent neurons exists within the V2 region of rat TGs which can be classified by electrophysiological properties into five types with distinct mechanical and chemical sensitivity. Of them, type I, IIa and IIb display narrow APs with small amplitude, high sensitivity to mechanical stimulation, and low sensitivity to sensory mediators. In contrast, type IIIa and IIIb show wide APs with large amplitude, insensitivity to mechanical stimulation, but highly sensitive to sensory mediators. The five types of large-diameter TG neurons identified here are potentially different functional subtypes of trigeminal Aβ-afferent neurons, with type I, IIa, and IIb being LTMRs Aβ-afferent neurons, and type IIIa and IIIb most likely been nociceptive Aβ-afferent neurons. Our findings provide new insights into roles of different types of Aβ-afferent nerves in trigeminal sensory functions including nociception.
In the present study, we performed patch-clamp recordings from large-diameter TG neurons in ex vivo trigeminal ganglion preparations. These TG neurons have been shown to be Aβ-afferent neurons in our recent study (Okutsu et al. 2021). There are a number of advantages with our approach over previous studies. Previous studies used in vivo intracellular recordings and demonstrated distinct electrophysiological properties of Aβ-afferent neurons in DRGs and their response to mechanical stimulation applied to the periphery (Korner and Lampert 2022). However, in vivo intracellular recordings provided limited information about ion channels involved in mechanical and chemical sensitivity of Aβ-afferent neurons. Previously, patch-clamp recordings have been performed on acutely dissociated DRG and TG neurons. However, most of large-diameter somatosensory neurons become damaged by cell dissociation (Gold et al. 1996). The application of patch-clamp recordings on large-diameter TG neurons in our ex vivo TG preparation have overcome the aforementioned technical issues with other approaches. With our ex vivo TG preparation and patch-clamp recordings, the present study reveals distinct electrophysiological properties as well as ionic currents evoked by mechanical and chemical stimuli in different types of trigeminal Aβ-afferent neurons.
Five distinct types of large-diameter TG neurons are classified in the present study based on cluster analysis of dataset with multiple electrophysiological parameters. This classification is generally consistent with our previous classification based on the shape and dV/dt of APs except the present study reported one more type (type IIb) than our previous study (Okutsu et al. 2021). This new observation is likely the result of enhanced sample sizes as well as the use of cluster analysis in the present study. Significant type differences were found in passive membrane properties including resting membrane potentials and input resistance, and also in active membrane properties including AP amplitude, width, threshold, rheobase, depolarizing and repolarizing dV/dt of APs. Previous studies with in vivo intracellular recordings also observed differences in AP properties in Aβ-afferents in DRGs and classified them into two main types, LTMR and nociceptive Aβ-afferent neurons (Djouhri et al. 1998; Djouhri and Lawson 2004; Lawson et al. 2019). In the present study, type I, IIa and IIb large-diameter TG neurons show narrow APs with small amplitude, which are consistent with LTMR Aβ-afferent neurons in DRGs (Djouhri et al. 1998; Djouhri and Lawson 2004; Lawson et al. 2019). On the other hand, our type IIIa and IIIb large diameter TG neurons displayed wider APs with larger amplitude and deflection during AP repolarization, which are consistent with nociceptive Aβ-afferent neurons in DRGs shown in previous studies (Djouhri et al. 1998; Djouhri and Lawson 2004; Lawson et al. 2019).
We show significant differences in voltage-activated currents among large-diameter TG neurons. For example, type IIIb displays the strongest adaptation outward currents, indicating strong A-type voltage-activated currents (IA) in this type of TG neurons. IA currents are mediated by Kv1.4, Kv3.4, Kv4.1, Kv4.2, and/or Kv4.3 in somatosensory neurons (Zemel et al. 2018). It would be interesting to investigate in future which types of these channels mediate IA currents in different types of large-diameter TG neurons. Voltage-activate inward currents, which are mediated by voltage-gated Na+ channels, show graded slow current kinetics from type I to IIIb large-diameter TG neurons. This may suggest that Nav1.8 (Bennett et al. 2019), which has slower current kinetics, is expressed at a significant level in some large-diameter TG neurons such as type IIIb, resulting in slow inward currents. Consistent with this idea, Nav1.8 immunoreactivity has been observed in large-diameter DRG neurons, and Nav1.8-cre drives the expression of GFP in a subpopulation of large-diameter DRG neurons (Bennett et al. 2019; Shields et al. 2012). Nav1.8 has long been used as a marker for C- and Aδ-nociceptors. It would be interesting to know if it may be also a molecular marker for Aβ-nociceptors. Interestingly, a recent study with Nav1.8-Cre mice shows that Nav1.8-expressing large-diameter DRG neurons are silent cold sensing neurons involved in cold allodynia induced by chemotherapy drug oxaliplatin (MacDonald et al. 2021). This raises a possibility that our type IIIa and/or IIIb large-diameter TG neurons may belong to the silent cold-sensing afferent neurons. The present study show that all five types of large-diameter TG neurons display sag potentials in response to the injection of hyperpolarizing currents. The sag potentials are known to be a result of activation of HCN channels (Hogan and Poroli 2008). Of the five types of large-diameter TG neurons, type IIIb had smallest sag potentials, i.e. the least expression of HCN channels. The functional role of HCN channels in different types of large diameter TG neurons are unknown at present time. The low expression of HCN channels in type IIIb large-diameter TG neurons is particularly interesting and worth of future investigation.
One of the main focuses of the present study was to evaluate mechanical and chemical sensitivity in different types of trigeminal Aβ-afferent neurons. Therefore, the use of our ex vivo TG preparation was critical to experimental integrity as it permits the study of healthy and viable large-diameter somatosensory neurons (≥40 μm) with Aβ-afferent conduction velocities (Okutsu et al. 2021). Of the five types of large diameter TG neurons, types I, IIa and IIb display high sensitivity to membrane displacement with large IMA currents. The IMA currents display rapidly adapting kinetics similar to Piezo2-mediated currents, consistent with those recorded from genetically marked LTMR Aβ-afferent neurons in mice (Zheng et al. 2019). Interestingly, IMA currents in type 1 has relatively faster kinetics and in type IIb has relatively slower kinetics. It is currently unknown why IMA current kinetics are different among the three types of large-diameter TG neurons, but we have previously found that static membrane tension is a biological factor affecting IMA current kinetics in DRG neurons (Jia et al. 2016). Our results raise a high possible that types I, IIa, and IIb large-diameter TG neurons are LTMR Aβ-afferent neurons. In addition to high mechanical sensitivity, electrophysiological properties of the three types of large-diameter TG neurons such as narrow APs with large amplitude and absence of repolarization deflection are also consistent with previous reports of AP properties of LTMR Aβ-afferent neurons (Zheng et al. 2019). Interestingly, the high mechanical sensitivity of type I, IIa and IIb large-diameter TG neurons is accompanied by low sensitivity to 5-HT and ACh, and low to moderate sensitivity to ATP.
The lack of IMA currents in response to very large membrane displacement in types IIIa and IIIb large-diameter TG neurons indicates that they are not LTMR Aβ-afferent neurons. While it is possible these large-diameter TG neurons are HTMR Aβ-afferents, it should be noted that no significant IMA currents were observed with 30 μm of displacement which is more than 60% of soma diameter for IIIa and IIIb neurons, except one type IIIb neuron which displayed very small and slowly adapting IMA current. This raises the possibility that type IIIa and IIIb might generally lack mechanoreceptors. However, intrinsic electrophysiological properties of type IIIa and IIIb show their high similarity to those of HTMR nociceptive Aβ-afferents of DRGs in previous in vivo intracellular recordings (Djouhri et al. 1998). HTMR nociceptive Aβ-afferents are believed to be first responders to harmful mechanical stimulation such as pinch and pinprick which induce tissue damage. With this thought, it is possible that purported HTMR nociceptive Aβ-afferents are inappropriately termed, and may actually lack mechanoreceptors. Instead, mechanically induced tissue damage may cause the release of chemical mediators, which in turn activate nociceptive Aβ-afferents to convey harmful mechanical signals. Consistent with this idea, type IIIa and IIIb large diameter TG neurons, which appear to be mechanically insensitive, are highly sensitivity to a number of sensory mediators which may be released following mechanical tissue damage. The high chemical sensitivity is manifested by large inward currents evoked by 5-HT, ACh and ATP in IIIa and IIIb large-diameter TG neurons, indicating the expression of high levels of 5-HT3 receptors, nicotinic receptors and P2X receptors, respectively, in these two types of neurons. Future studies profiling their sensitivity to different types of sensory mediators in type IIIa and type IIIb large-diameter TG neurons may provide further insight into their potential role in nociception. It is also plausible that these two types of trigeminal Aβ-afferent neurons may be silent nociceptors, which become mechanically sensitive once expressed chemical receptors are over-activated by sensory mediators under pathological conditions.
Footnotes
Author contributions
J.G.G conceived research project. RV and J.G.G designed and RV performed experiments. RV analyzed data and participated data interpretation. J.G.G. and RV wrote the paper.
Declaration of conflicting interests
The author(s) declared no potential conflicts of interest with respect to the research, authorship, and/or publication of this article.
Funding
The author(s) disclosed receipt of the following financial support for the research, authorship, and/or publication of this article: This work was supported by the NIH grants NS109059, DE018661 and DE023090 to J.G.G.