
Abstract
Abnormal pain has recently been estimated to affect ∼50 million adults each year within the United States. With many treatment options for abnormal pain, such as opioid analgesics, carrying numerous deleterious side effects, research into safer and more effective treatment options is crucial. To help elucidate the mechanisms controlling nociceptive sensitivity, the Drosophila melanogaster larval nociception model has been used to characterize well-conserved pathways through the use of genetic modification and/or injury to alter the sensitivity of experimental animals. Mammalian models have provided evidence of β-catenin signaling involvement in neuropathic pain development. By capitalizing on the conserved nature of β-catenin functions in the fruit fly, here we describe a role for Armadillo, the fly homolog to mammalian β-catenin, in regulating baseline sensitivity in the primary nociceptor of the fly, in the absence of injury, using under- and over-expression of Armadillo in a cell-specific manner. Underexpression of Armadillo resulted in hyposensitivity, while overexpression of wild-type Armadillo or expression of a degradation-resistant Armadillo resulted in hypersensitivity. Neither underexpression nor overexpression of Armadillo resulted in observed dendritic morphological changes that could contribute to behavioral phenotypes observed. These results showed that focused manipulation of Armadillo expression within the nociceptors is sufficient to modulate baseline response in the nociceptors to a noxious stimulus and that these changes are not shown to be associated with a morphogenetic effect.
Introduction
Abnormal pain has recently been estimated to affect approximately 50 million adults each year within the United States.1–3 With many treatment options for abnormal pain, such as opioid analgesics, carrying numerous deleterious side effects, 4 research into safer and more effective treatment options is crucial. Despite this need, new, successful drug development for abnormal pain has been laborious, mostly due to a lack of understanding of the mechanisms that control pain sensitivity. 5 Specialized peripheral sensory neurons, referred to here as primary nociceptors, that detect noxious stimuli, are the first responders to the threat of injury in the pain signaling pathway.6,7 Sensitivity of the nociceptors can be increased, for example after injury, by reducing the threshold of activation required to trigger a response. However, if such nociceptive sensitization persists after the injury has healed, symptoms of hyperalgesia and allodynia can take root and give way to abnormal pain.6,8–10 When this type of pain persists/reoccurs for typically three to six months, it is commonly referred to as chronic, and can lead to a substantial decrease in quality of life and an increased threat for opioid addiction in these patients.11–15 The mechanisms by which nociceptive sensitivity is controlled warrant further study in order to reveal improved treatments for abnormal pain.
In recent years, Drosophila melanogaster has proven to be an exceptional in vivo model organism for the investigation of mechanisms of neurological diseases, such as Parkinson’s or chemotherapy-induced peripheral neuropathy, due to its relative organismal simplicity and powerful genetic toolkit.16–18 Fruit flies, like their human counterparts, exhibit a behavioral nociceptive response to noxious stimuli and can also develop nociceptive sensitization after injury, allowing for translatable modeling of allodynia and hyperalgesia, both known as possible symptoms of chronic pain.19–26 The nociceptors of the fruit fly have similar function and morphology to that of vertebrate counterparts; many genes underlying the perception of pain are conserved across species.26–28 Additionally, there is an abundance of evidence demonstrating that fruit flies exhibit a variety of responses to encountered noxious stimuli, mostly centered around escape behaviors.29,30 Important pain discoveries made with this model are the roles of Painless (suggested to be homologous to mammalian ANKTM1 and analogous in function to mammalian TRPV131–33), and identification of the Drosophila DEG/ENaC channel, Pickpocket (ppk: similar to vertebrate epithelial sodium channels), which is known for sensing and reacting to harsh mechanical stimulation in the fly.34,35 Studies have also shown that adult fruit flies possess a GABA-ergic mechanism of central pain regulation, similar to humans. 36 A nociceptive sensitization model has been developed utilizing Drosophila larvae, in which UV-injured and/or genetically modified animals become hyper or hypo-sensitive. 19 Using this model, the necessity and sufficiency of several biochemical signaling pathways such as Hedgehog, TNF-α (named Eiger in Drosophila), and BMP pathways, functioning in the nociceptors, were revealed.19–25 Discovery of these pathways has increased knowledge relating to the development of nociceptive sensitization. However, a full understanding of this mechanism, including the control of baseline nociceptor sensitivity, meaning the level of sensitivity in the absence of injury, is still elusive.
Wnt/β-catenin, a highly conserved signaling pathway37,38 described functionally as much by mammalian research as by research studying its Drosophila counterpart, Wg/Armadillo signaling, has been historically investigated for its roles in embryogenesis39,40 and cancer development.41,42 A main component in the Wnt/Wg signaling pathway, β-catenin, homolog to Drosophila Armadillo (Arm), is the intracellular transducer of canonical Wnt/Wg signaling, whereby its nuclear translocation results in transcriptional activation of Wnt/Wg target genes (Figure 1).38,43,44 In the absence of the Wnt/Wg ligand, β-catenin/Arm protein levels are reduced within the cytoplasm by a two-step kinase-destruction complex, which phosphorylates β-catenin/Arm for subsequent ubiquitination and proteosome degradation (Figure 1).38,45–49 Binding of the Wnt ligand to its cell-surface receptor38,45,50 activates the pathway by inactivation of the destruction complex, allowing β-catenin/Arm levels to increase, enter the nucleus, and activate transcription of target genes (Figure 1). A “moonlighting” protein, β-catenin/Arm is also known for its role in cadherin mediated cell-cell adhesion.51–53 Armadillo has at least two distinct cellular functions. When Wnt/Wg pathway is off, the destruction complex prevents accumulation of Arm (Armadillo) by proteolysis. When the Wnt/Wg pathway is on, inactivation of the destruction complex allows Arm to accumulate, enter the nucleus, and activate expression of the Wnt/Wg response genes. Arm is also known to play a role in cell adhesion, where it binds to cadherin at the plasma membrane of the cell.
In the rodent, β-catenin expression is upregulated in the spinal cord/dorsal horn,54–57 and dorsal root ganglia (DRG)57,58 in neuropathic pain states. In studies where neuropathic injury increased mechanical 54–59 and thermal/cold 58 sensitivity in behavioral assays, attenuation of this hypersensitivity was achieved through local administration of pharmacological Wnt/β-catenin signaling inhibitors. This points toward a therapeutic role for local Wnt/β-catenin pathway blockade in the management of neuropathic pain. Paradoxically, when β-catenin was knocked out in a subset of DRG sensory neurons, the nociceptors, no changes in baseline nociceptive sensitivity were observed. 60 By capitalizing on the conserved nature of Wnt/β-catenin signaling in the fruit fly 61 and the previously validated fruit fly model for investigating nociception,19,20,32 this study sought to determine the role of Arm in regulating sensitivity in a specific neuron, the primary nociceptor of the fly, in the absence of injury, using experimental under- and over-expression of Arm in a cell-specific manner.
Methods
Fly husbandry
Flies were obtained from the Bloomington Drosophila Stock Center (BDSC) in Bloomington, Indiana and maintained in 6 oz stock bottles containing sucrose-cornmeal-yeast medium. Bottles were stored at ambient room temperature and kept between 45-60% humidity. Apart from lines used for MiMIC analysis, genotypes used in experiments were prepared using the Gal4/UAS62,63 system with the following Gal4 driver lines featuring the pickpocket34,35,64 promoter: ppk1.9-GAL4 (in w 1118 ) for thermal nociception assays and ppk1.9-Gal4, UAS-mCD8-GFP (in yw) for neuromorphometric analysis, immunohistochemistry, CTCF and Integrated Density analysis. Transgenic lines included: UAS-arm. S1065,66 (in y 1 w 1118 ) (BDSC_4782), UAS-arm. S266,67 (in y 1 w 1118 ) (BDSC_4783; for behavior experiments, balancer swapped to TM6b for its Tb marker visible in larvae), UAS-arm-IR-1 68 (in y 1 v 1 ) (BDSC_35004), UAS-arm-IR-2 68 (in y 1 v 1 ) (BDSC_31304), MiMICarm MI08675 69 (BDSC_44994), UAS-gro-IR-1 68 (in y 1 v 1 ) (BDSC_35759), UAS-gro-IR-2 70 (in y 1 v 1 ) (BDSC_91407), and ppk1.9-tdTomato. Wild-type fly lines and control lines for TRiP68,70 RNAi lines used were: w 1118 (BDSC_3605), y 1 v 1 (BDSC_36303), and y 1 w 1118 (BDSC_6598). Each Gal4/UAS genotype used in thermal nociception assays was compared to two controls: one with the genetic background (w 1118 ) of the Gal4 driver crossed with the UAS transgenic line (No Gal4 control) and one with the Gal4 driver line crossed to the genetic background (either y 1 v 1 , w 1118 , or y 1 w 1118 ) of the UAS transgenic line (No UAS control). The Gal4/UAS system allows over- or underexpression of a given target gene in a specific cell type, determined by the Gal4 driver. 62 In these experiments, the Gal4 driver used was ppk1.9-Gal4, which selects the dendritic arborization neurons known as Class IV multidendritic neurons, well characterized as primary nociceptors.26,30
Thermal Nociception Assays
Foraging third instar larvae were assayed by methods previously validated.19–25,32 In these nociception assays, the dorsal side of the larva (midline between abdominal segments A4-A6) was lightly touched by a thermal tipped heat probe (ProDev Engineering, Missouri City, Texas) set to the previously determined noxious temperature of 45°C
19
to assess normal nociception. The operator was blind to genotype and the resulting behavior was evaluated within a 20 s
19
timeframe for latency of larval nocifensive escape behavior, characterized as a corkscrew rolling response, with time of response or no response recorded (Figure 2(a)).
30
Baseline thermal nociception behavioral assays for transgenic Arm larvae and expression of Arm within nociceptors.
Immunohistochemistry
Third instar larvae expressing GFP within their nociceptors (via ppk-Gal4, UAS-mCD8-GFP), were filleted as previously described 22 and immediately fixed by 30-min incubation at room temperature (RT) with ice-cold 4% paraformaldehyde in phosphate buffered saline solution (PBS). Fixation was followed by washes in 0.3–1.0% PBT (1% Triton X-100 in PBS for anti-c-MYC and anti-Gro experiments and 0.3% Triton X-100 in PBS for anti-Arm experiments), which included two 1-min washes, one 10-min wash, and one 1-h wash at RT. Washed fillets were then blocked using PBT-B (0.3% Triton X-100 + 1% bovine serum albumin (BSA) + PBS) for at least 1 h at RT. After initial blocking, fillets were incubated overnight at 4°C using gentle rotation with either mouse anti-Arm (DSHB Hybridoma Product N2 7A1 Armadillo) 39 for arm.S2 and arm-IR-1 experiments at a dilution of 1:200 in PBT-B, or mouse anti-c-MYC (DSHB Hybridoma Product 9E 10 supernatant) 71 for arm.S10 and arm.S2 experiments at a dilution of 1:10 in PBT-B, or mouse anti-Gro (DSHB Hybridoma Product anti-Gro supernatant) 72 for gro-IR-1 experiment at a dilution of 1:100 in PBT-B. Overnight incubation was followed by two 30-min washes in PBT-B with rotation and then a second blocking for 1 h using fresh PBT-B + 5% normal goat serum (NGS) at RT. Following the second blocking, fillets were incubated for 2 h at RT with the fluorescently conjugated secondary antibody, goat anti-mouse AlexaFluor-647 (Catalog#: A-21236, Invitrogen, Thermo Fisher Scientific, Inc), diluted to 1:500 in PBT-B + 5% NGS. Fillets were then washed three times in 0.3% PBT (0.3% Triton X-100 in PBS) for 30 min, followed by two washes for 2 min with PBS. Fillets were mounted onto slides using Vectashield Antifade Mounting Medium with DAPI (H-1200, Vector Laboratories) for nuclear staining and kept in the dark at 4°C.
Imaging and CTCF analysis
Nociceptors from third instar larvae fillets prepared for fluorescent analysis by immunohistochemistry were imaged with a Leica TCS SP5 scanning laser confocal microscope using a 40x oil objective and a HyD detector. Z-stacks were obtained with a 0.38 µm step size, a scan format of 1024 x 1024, and, for the channel to be quantified, using uniform acquisition settings across experimental and control samples for smart gain, laser power, zoom, frame averaging, and pinhole. In an effort to comply with previously described ethical and appropriate biological imaging procedures
73
and to avoid any misrepresentations in fluorescence intensity, great efforts were taken to avoid the saturation of pixels during image acquisition for the fluorescence channels to be quantified. In this effort to remain below pixel saturation, yet also keep image acquisition settings constant across all samples and treatments within an experiment, fluorescence signal in some samples was obtained at much lower laser power output than if they were imaged independently. For example, No UAS sample images for anti-Arm in Figure 3 were acquired at a scanning confocal laser power output of 14%, however, the No UAS sample images for anti-Arm in Figure 4 had to be acquired at a lower laser power output of 4% due to the higher intensity of fluorescence in the arm.S2 line for anti-Arm. Using Fiji,
74
five z-slices toward the mid-section of each nociceptor z-stack were sum projected and then cropped to remove the majority of dendritic structures and display the nociceptor soma primarily. Additionally, within Fiji,
74
masks were made from these cropped sum projections that corresponded to either the nucleus, visualized by DAPI fluorescence, or the soma, visualized by GFP fluorescence, to obtain regions of interest (ROIs) specific to that portion of the cell. To keep mask generation steps consistent across all samples and eliminate selection bias as much as possible, a macro was recorded in Fiji
74
for semi-automation and is available upon request. Any overlapping nuclei (visualized by DAPI) surrounding the nociceptor were also masked and made into an ROI which was then cleared from each soma and nuclear mask before obtaining the final ROIs used for measurement, to account for any anti-Arm, anti-Gro, or anti-c-MYC fluorescence that could arise from cells close to the nociceptor. Nuclear, cytoplasm, and soma ROIs were then used to measure area and integrated density in Fiji
74
for anti-Arm, anti-Gro or anti-c-MYC fluorescence within the cropped sum projections and corrected total cellular fluorescence (CTCF) was calculated using the following calculation described previously.
75
The formula for CTCF is CTCF= Integrated density - (Area of selected cell x Mean fluorescence of background readings). The mean fluorescence of background was the average of three mean fluorescence measurements obtained using images of larval fillet controls that did not receive the primary antibody (anti-Arm or anti-Gro), or those samples that did not express the c-MYC protein endogenously (No UAS samples in the anti-c-MYC experiment). To verify that antibody fluorescence signal was statistically above background levels in anti-Arm and anti-Gro experiments, we compared integrated density (the product of area and mean gray value) measurements obtained in Fiji
74
(using the ROIs generated by masks for soma, cytoplasm, and nucleus of each sample) for No 1°Ab controls and No UAS controls. The CTCF and Integrated Density for each sample/group was then averaged and a Student’s t test with Welch’s correction was applied or, in situations where the Shapiro-Wilk test indicated that the data were not normally distributed, a Mann-Whitney U test was applied. CTCF and Integrated Density statistical analysis tests were carried out using Microsoft Excel (version 2104 and 2204) with the Real Statistics Resource Pack software package (Release 7.6), Copyright (2013–2021) Charles Zaiontz, www.real-statistics.com) and R statistical coding software.
76
Representative images used in figures were sum-projected with the same five z-slices used in analysis, cropped with uniform area, and adjusted for brightness/contrast uniformly within the channel being quantitated across all conditions since laser level/gain was kept low to prevent saturation during acquisition. DAPI is shown with the lookup table “cyan hot”, and anti-Arm, anti-Gro, anti-c-MYC are shown with the lookup table “magenta”, in Fiji.
74
Representative CTCF images shown are within one standard deviation of the average soma CTCF calculation/group. Arm:GFP/ppk-tdTomato was imaged using the 63x oil objective on a third-instar larva anesthetized in halocarbon-ether mixture (2:1) and placed on a microscope slide with glass coverslip for live imaging. The z-stack acquired with a 0.34 µm step size was then max projected and cropped using Fiji
74
with brightness/contrast settings adjusted for clarity. Knockdown of Arm within nociceptors results in behavioral hyposensitivity. Overexpression of Arm via arm.S2 within nociceptors results in behavioral hypersensitivity. (A) Immunofluorescent detection of Arm.S2 using anti-Arm antibody and confocal imaging (40x magnification). Top: ppk1.9-Gal4,UAS-mCD8-GFP > y
1
w
1118
with no 1° Ab, n = 3. Middle: same genotype, n ≥ 6, with anti-Arm shows the endogenous expression of Arm in the nociceptor in both cytoplasm and nucleus. Bottom: ppk1.9-Gal4, UAS-mCD8-GFP > UAS-arm.S2, n ≥ 6. A tracing representing an example of an ROI used in measurement of fluorescence has been added to the montage. (B) CTCF quantification of Arm immunofluorescence confirms additional Arm expression in both the cytoplasm and nucleus (indicated by co-localization with DAPI), statistically analyzed by Student’s t test with Welch’s correction or Mann-Whitney U test where data was found to not be normally distributed, significance ** indicates n < 0.01. Note the split Y-axis used to represent both the native and elevated Arm levels. (C) Integrated Density was measured for soma, cytoplasm, and nucleus for “No UAS” (ppk1.9-Gal4,UAS-mCD8-GFP > y
1
w
1118
), n = 7, and “No 1°Ab” (ppk1.9-Gal4,UAS-mCD8-GFP > y
1
w
1118
) (where the primary antibody was not added), n = 3, samples, averaged per group, and statistically analyzed to verify significant signal over background for anti-Arm fluorescence. Statistical analysis was by Student’s t test with Welch’s correction or Mann-Whitney U test where data was found to not be normally distributed, significance * indicates p < 0.05, *** indicates p < 0.001. (D) Percent response plotted against time in thermal nociception assay at 45°C for animals expressing additional wild-type Arm in nociceptors via arm.S2 (ppk1.9-Gal4 > UAS-arm.S2) shown in red vs. controls “No Gal4” (w
1118
> UAS-arm.S2) shown in green and “No UAS” (ppk1.9-Gal4 > y
1
w
1118
) shown in blue, n ≥ 90/group. Statistical analysis by log-rank test shows significant nociceptive hypersensitivity of animals expressing Arm.S2, compared to both controls, significance *** indicates p < 0.001.

Neuromorphometry
To determine if observed behavioral phenotypes were associated with changes in neuromorphology of the class IV multidendritic neurons targeted, neurons were measured in vivo for total dendritic length, dendritic branching, and changes to the dendritic arbor through Sholl 77 analysis . Third instar larvae measuring 4.0–4.5 mm in length were anesthetized with ether for up to 4 min then placed within a halocarbon-ether mixture (2:1) on a microscope slide and covered with a 22 x 50 mm glass coverslip for live imaging. Using a Leica TCS SP5 scanning laser confocal microscope and a HyD detector, nociceptors were imaged between abdominal segments 4–6. Z stacks were collected using the 20x (NA 0.7) dry objective, a resolution of 1024 x 1024, and a z-stack step-size of 0.88 μm. Max projections (carried out in Fiji 74 ) of images were exported as tifs to Jasc® Paint Shop Pro™ (Version 7.04) and/or the Superimpose X Neo for iPad (1.5.2). Within these programs, axons and background autofluorescence of non-quantifying structures (such as denticle belts) were removed from images and dendrites were traced 78 over at disjointed, low intensity pixel areas where due to low signal, decreasing threshold would introduce an excess of noise surrounding the dendrite and increasing threshold would result in the introduction of gaps that would need to be manually reconstructed. 79 For analysis of dendritic length and dendritic branching, these images were then thresholded, skeletonized, and measured via the AnalyzeSkeleton (2D/3D) plugin 80 in Fiji 74 as previously described with modification for neuromorphometric quantification. 81 Output data from the AnalyzeSkeleton analysis was compiled via Python scripts prior to import into Microsoft Excel (version 2104) for statistical analysis. For Sholl analysis, 77 images were analyzed using the Sholl Analysis 82 plugin in Fiji 74 by methods described previously.82,83 Representative images have been cropped to the nociceptor of interest, shown without color and the lookup table, “Invert LUT”, in Fiji 74 applied for clearer visualization of dendrites.
Statistics
Thermal nociception assays were plotted as percent accumulated response versus latency where an end-point cut-off of 20 s was applied and latency in seconds recorded. After applying a binary variable to the data based on ‘response’ or ‘no response’ at the 20 s cut-off time, statistical analysis of latency of response between all behavioral data groups was completed using Log-rank analysis and applying Benjamini and Hochberg procedure for multiple testing. In neuromorphometrical pairwise comparisons, average dendritic branch length and average number of branches were evaluated using a Student’s t test with Welch’s correction. Sholl profile data was found to not be normally distributed via Shapiro-Wilk test and so pairwise comparison was evaluated via the Mann-Whitney U test. CTCF and Integrated density analysis was analyzed by a Student’s t test with Welch’s correction, or the Mann-Whitney U test as described previously. Log-rank analysis was performed using R statistical coding software 76 and applying the ‘survival’ analysis package. 84 All other statistical tests and plots were carried out using Microsoft Excel (version 2104 and 2204) and the Real Statistics Resource Pack software package (Release 7.6), Copyright (2013–2021) Charles Zaiontz, www.real-statistics.com).
Results
Since Arm is known to activate transcription of canonical Wnt/Wg signaling target genes38,43,44 and Wnt/β-catenin signaling has been shown to regulate neuropathic pain development in mammals after injury,54,55,57,58 we sought to assess whether underexpression of Arm within the nociceptors would result in a decrease in nociceptive sensitivity in the absence of injury. This assessment can be easily carried out in the fly using validated, thermal nociception assay techniques (Figure 2(a)).19,20,30,32
We confirmed that Arm is expressed within third instar larval nociceptors using the MiMIC method 69 (Figure 2(b)), in which GFP is fused with the Arm coding region and subject to the same regulation as the normal gene. The functionality of the resulting Arm:GFP fusion protein is indicated by the observation that flies homozygous for this construct are viable. Imaged in live anaesthetized larvae, punctate GFP expression is visible in nociceptor somata and neurites, indicated by ppk1.9-tdTomato expression, as well as the neurites of other unidentified neurons (Figure 2(b)). Since our analysis using these MiMIC images did not include fluorescence quantification but rather protein localization, efforts to maintain pixel saturation were not stringently followed.
Next, we used Gal4/UAS cell targeting and RNA interference technology (arm-IR-1 and arm-IR-2) to reduce Arm expression specifically in the nociceptors. Confirmation of Arm expression and knockdown (arm-IR-1) within the nociceptors of animals was obtained through immunofluorescent quantification of Arm protein via use of a previously validated Arm antibody 39 and rigorous comparison techniques. Effort was taken to avoid pixel saturation and image acquisition settings were kept constant in the fluorescence channel quantified across all conditions. Results showed a significant decrease in anti-Arm fluorescent signal in the nociceptor somata of arm-IR-1 animals, compared to control animals (Figures 3(a) and (b)). Results also showed a significantly higher anti-Arm fluorescent signal in nociceptor somata of No UAS animals, compared to No 1°Ab controls (Figure 3(c)). arm-IR-1 animals were then compared to controls for thermal nociception response to a noxious 45°C temperature probe, by evaluation of nocifensive behavior without previous injury (Figure 3(d)), within a 20 s timeframe. 19 arm-IR-1 animals showed a significant decrease in nocifensive response when compared to controls (Figure 3(d)). Concerns that off-target effects caused this phenotype are reduced by analysis of a second non-overlapping Arm IR line (UAS-arm-IR-2) which also showed a significant decrease in nociceptive sensitivity (Figure 3(e)).
To compare with the underexpression study described above, we then evaluated Arm’s capacity to control nociceptor sensitivity by overexpressing Arm protein. We did this by driving expression of a wild-type Arm protein (via Arm.S2)66,67 within the nociceptors specifically. Resulting overexpression, compared to controls, was confirmed through immunofluorescent quantification using anti-Arm in fixed tissue (Figures 4(a) to (c)) as above. Effort was again taken to avoid pixel saturation and image acquisition settings were kept constant in the fluorescence channel quantified across all conditions. This effort resulted in lower laser intensity output being used in image acquisition than the previous Arm-IR-1 IHC experiment, due to the increase in fluorescence intensity for the Arm.S2 anti-Arm signal. Results, however, still showed a significantly higher anti-Arm fluorescent signal in nociceptor somata of No UAS animals, compared to No 1°Ab controls (Figure 4(c)), verifying significant anti-Arm signal above background in normal animals. The arm.S2 transgene significantly increases Arm expression in both the cytoplasm and nucleus of the nociceptor (Figures 4(a) and (b)). Thermal nociception assays at 45°C were then carried out and showed that animals expressing increased nociceptor Arm levels via arm.S2 responded significantly faster, compared to their specific control lines (Figure 4(d)).
In an effort to explore the effects of an Arm trafficking environment similar to that produced when Wnt/Wg signaling is activated (Figure 1), we carried out experiments (Figure 5) using a transgenic line expressing a manipulated Arm protein (Arm.S10), in which regions within the N terminus needed for phosphorylation and ubiquitination had been deleted.65,66 Since these deletions overlap regions of the epitope targeted by the anti-Arm monoclonal antibody used above,39,65,66,85 the expression of the arm.S10 transgene within the nociceptors was confirmed via treatment of fixed tissue with a c-MYC antibody 65,66,71,85 (Figures 5(a) and (b)) targeting ArmS10’s c-MYC tag. Since Arm.S266,67 is likewise tagged with c-MYC, we also compared expression levels of these two modified Arm proteins, Arm.S2 and Arm.S10, and found that Arm.S2 is the more highly expressed in this context (Figures 5(a) and (b)). Both modified protein constructs significantly increased overall Arm levels in the nociceptor nuclei and cytoplasm (Figures 5(a) and (b)). Thermal nociception assays at 45°C showed that animals expressing arm.S10 within their nociceptors responded significantly faster than normal controls (Figure 5(c)). Overexpression of Arm via arm.S10 within nociceptors results in behavioral hypersensitivity. (A) Immunofluorescent comparison of Arm.S2's and Arm.S10's c-MYC tags through confocal imaging (40x magnification). Top: ppk1.9-Gal4, UAS-mCD8-GFP > y
1
w
1118
(No 1° Ab), n = 3-6, shows absence of c-MYC staining in control animals. Middle: ppk1.9-Gal4, UAS-mCD8-GFP > UAS-arm.S2, n = 7 shows strong expression in the nociceptor. Bottom: ppk1.9-Gal4, UAS-mCD8-GFP > UAS-arm.S10, n = 7 shows specific expression of Arm.S10 in the nociceptor. A tracing representing an example of an ROI used in measurement of fluorescence has been added to the montage. (B) CTCF quantification and comparison of c-MYC immunofluorescence shows that arm.S2 produces stronger Arm expression than does arm.S10, in both the cytoplasm and the nucleus, statistically analyzed by Student’s t test with Welch’s correction, ** indicates p < 0.01. (C) Percent response plotted against time in thermal nociception assay at 45° C for animals expressing arm.S10 (ppk1.9-Gal4 > UAS-arm.S10) shown in red vs. control “No Gal4” (w
1118
> UAS-arm.S10) shown in green and “No UAS” (ppk1.9-Gal4 > y
1
w
1118
) shown in blue, n ≥ 90/group. Statistical analysis by log-rank test shows significant nociceptive hypersensitivity compared to both controls, *** indicates p < 0.001.
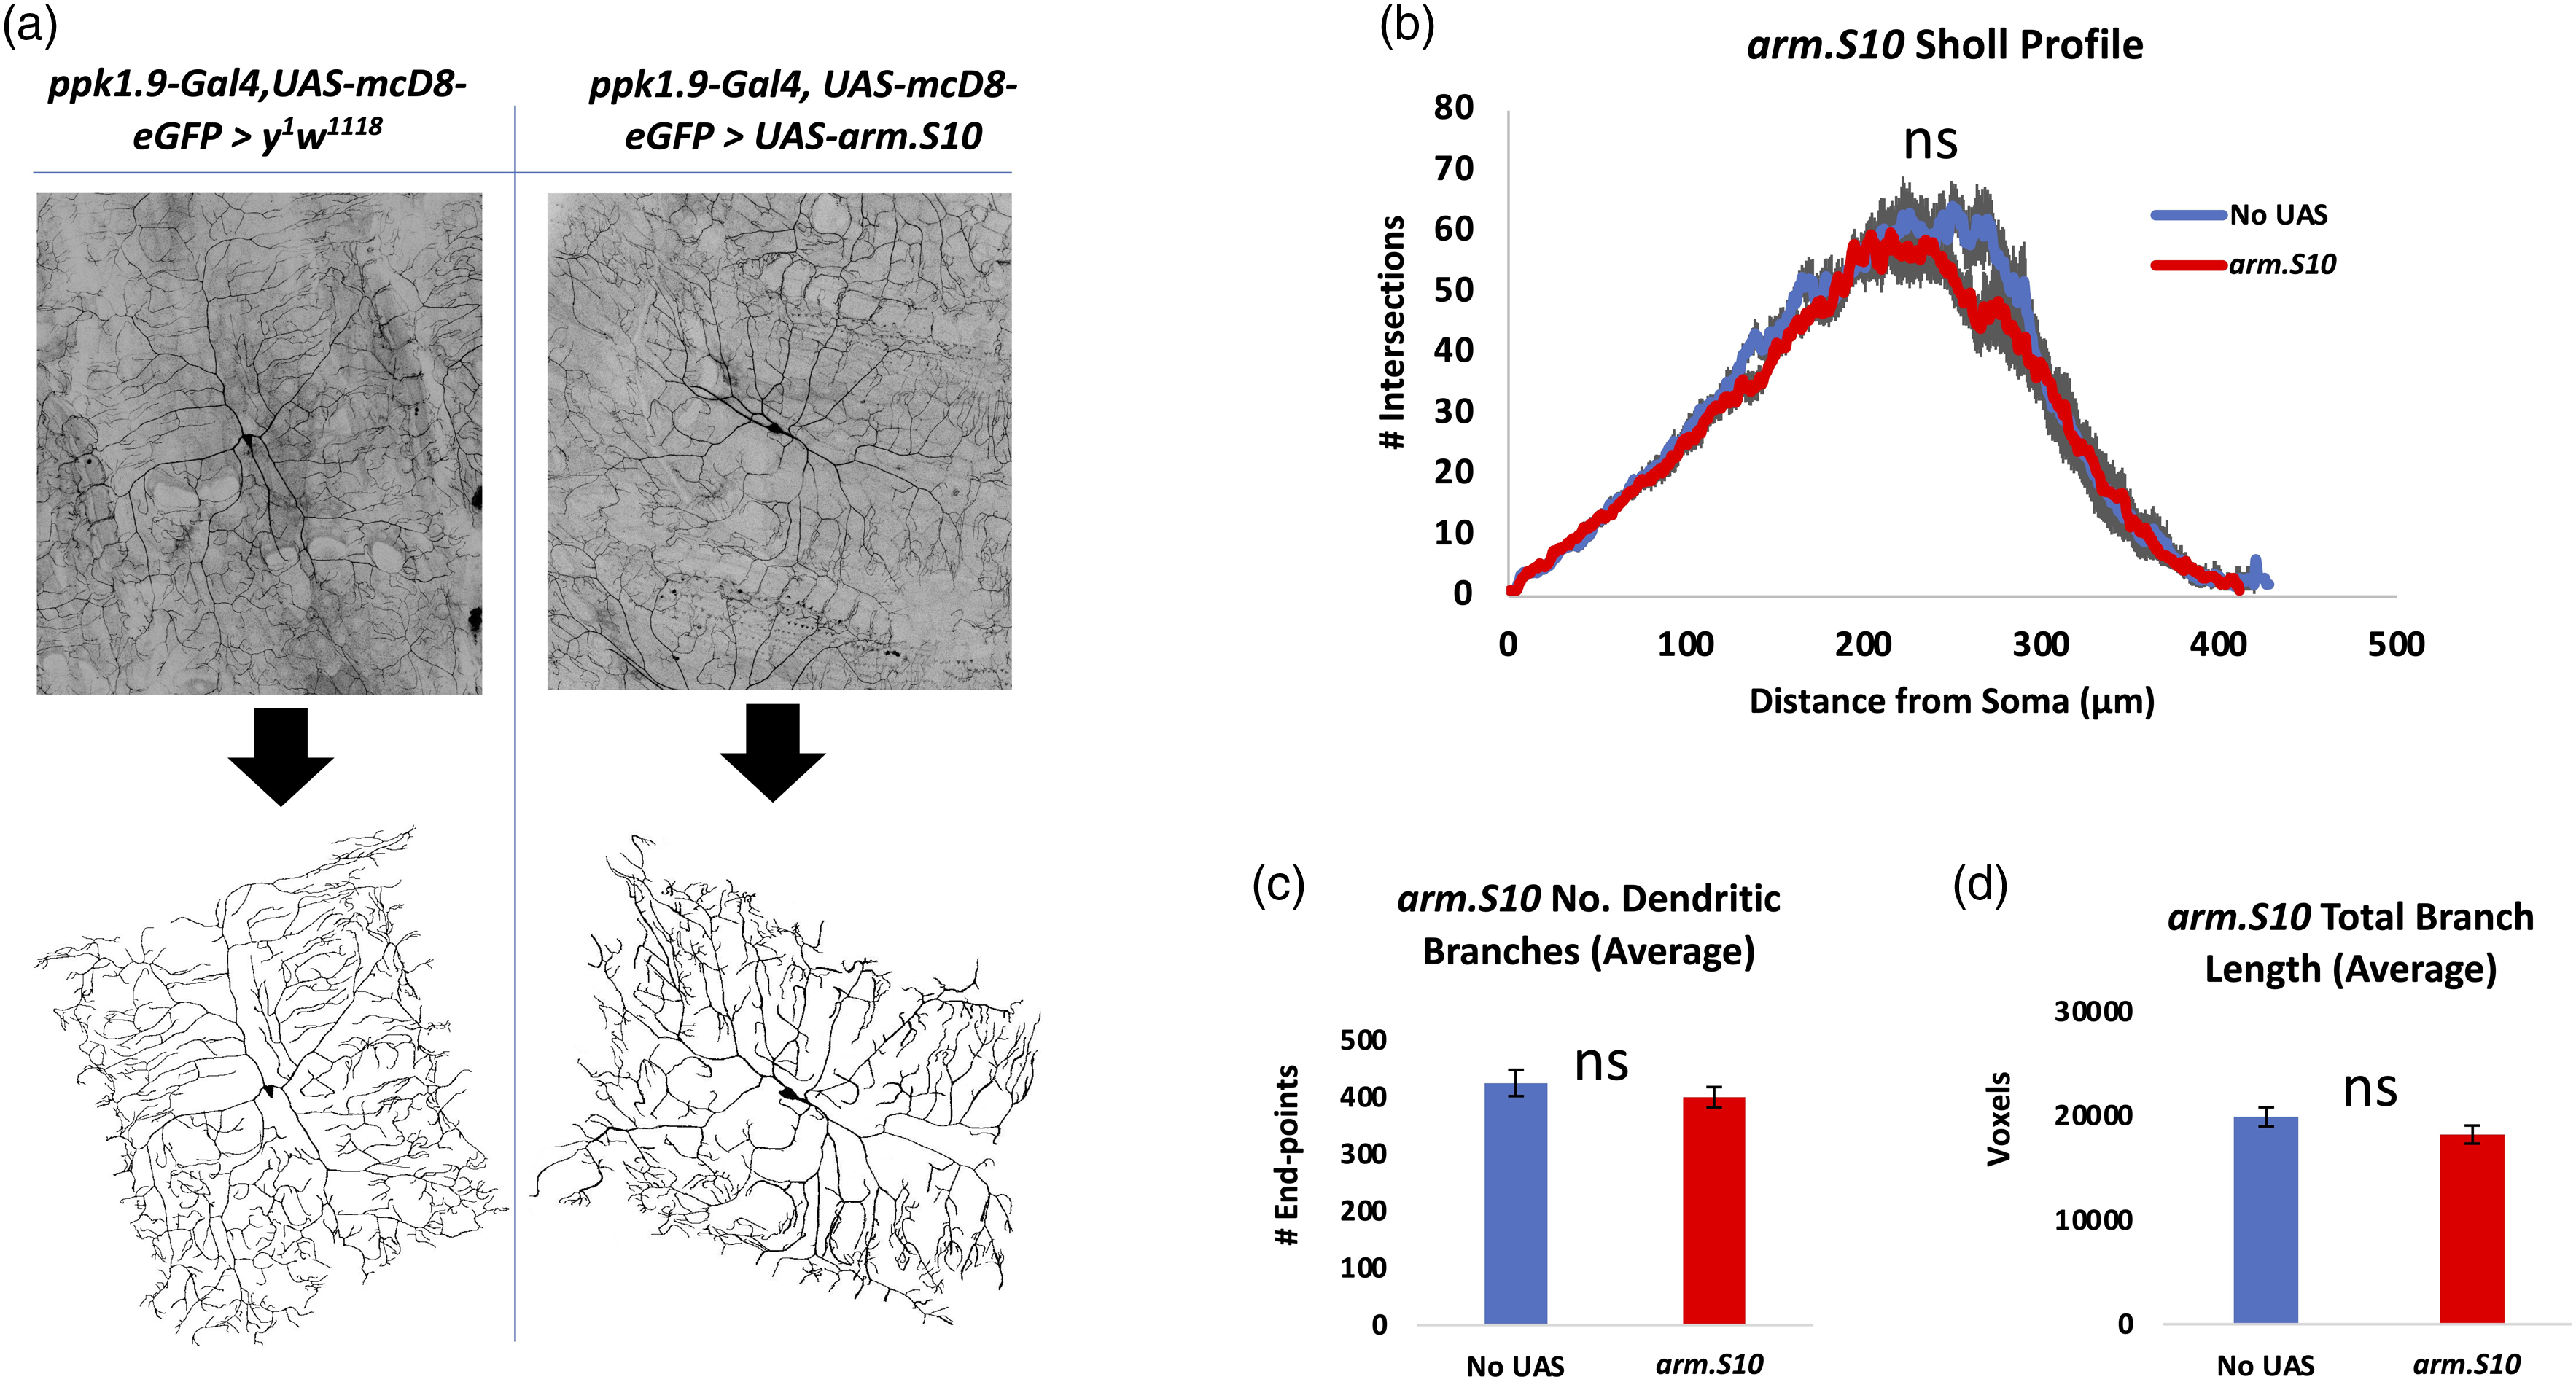
We investigated the possibility that the nociceptors of larvae with altered Arm activity may also have altered morphology. Nociceptors within animals expressing either a transgene knocking down expression of Arm within the nociceptors (Arm-IR-1) or expressing a modified form of Arm within the nociceptors (Arm.S10), were analyzed for dendritic number, length, and dendritic arbor complexity (Sholl analysis).
77
Neither nociceptors expressing arm-IR-1 (Figure 6) nor those expressing arm.S10 (Figure 7) showed any statistical difference in dendritic length, number of dendrites, or dendritic arbor complexity. Neuromorphometric analysis of nociceptors with Arm knockdown shows no effect on dendritic morphology. (A) Nociceptors expressing arm-IR-1 to knock down Arm (ppk1.9-Gal4, UAS-mCD8-eGFP > UAS-arm-IR-1), n = 10, were analyzed for (B) dendritic arborization by Sholl analysis, (C) dendritic number, and (D) dendrite length, in comparison to controls (ppk1.9-Gal4, UAS-mCD8-eGFP > y
1
v
1
), n = 10. No significant differences in these parameters were observed. Gray area in B represents SEM. ns = no significance found by Student’s t test with Welch’s correction or by the Mann-Whitney U test when data was not normally distributed. Neuromorphometric analysis of nociceptors expressing Arm.S10 shows no effect on dendritic morphology. (A) Nociceptors expressing arm.S10 to elevate Arm (ppk1.9-Gal4, UAS-mCD8-eGFP > UAS-arm.S10), n = 7, were analyzed for (B) dendritic arborization by Sholl analysis, (C) dendritic number, and (D) dendrite length, in comparison to controls (ppk1.9-Gal4, UAS-mCD8-eGFP > y
1
w
1118
), n = 7. No significant differences in these parameters were observed. Gray area in B represents SEM. ns = no significance found by Student’s t test with Welch’s correction or by the Mann-Whitney U test when data was not normally distributed.
We also knocked down the expression of Gro (Groucho), known to repress the transcription of Wnt/Wg and BMP target genes (Figure 8).86,87 Confirmation of Gro knockdown (via gro-IR-1) was obtained through immunofluorescent quantification of Gro protein using a previously validated Gro antibody72,88 in fixed larval tissues (Figures 9(a) to (c)). Effort was again taken to avoid pixel saturation and image acquisition settings were kept constant in the fluorescence channel quantified across all conditions. Gro was found to be significantly reduced in expression exclusively within the nuclei of nociceptors in animals expressing gro-IR-1, compared to control animals (Figures 9(a) and (b)). Results also showed a significantly higher anti-Gro fluorescent signal in the nociceptor somata of the No UAS control animals when compared to No 1°Ab controls animals (Figure 9(c)), indicating significant signal against background. gro-IR-1 animals were then compared to controls for baseline thermal nociception response to a noxious 45°C temperature and showed no significant differences in nocifensive response (Figure 9(d)). A second non-overlapping gro-IR (gro-IR-2) line was also behaviorally tested, with similar results (Figure 9(e)). Gro (Groucho) is a transcriptional repressor in the Wnt/Wg pathway, downstream of Arm. Wnt/Wg pathway activation leads to Arm accumulation and antagonism with the repressor Gro in order to transcriptionally activate target genes. Knockdown of Gro within nociceptors does not alter behavioral sensitivity.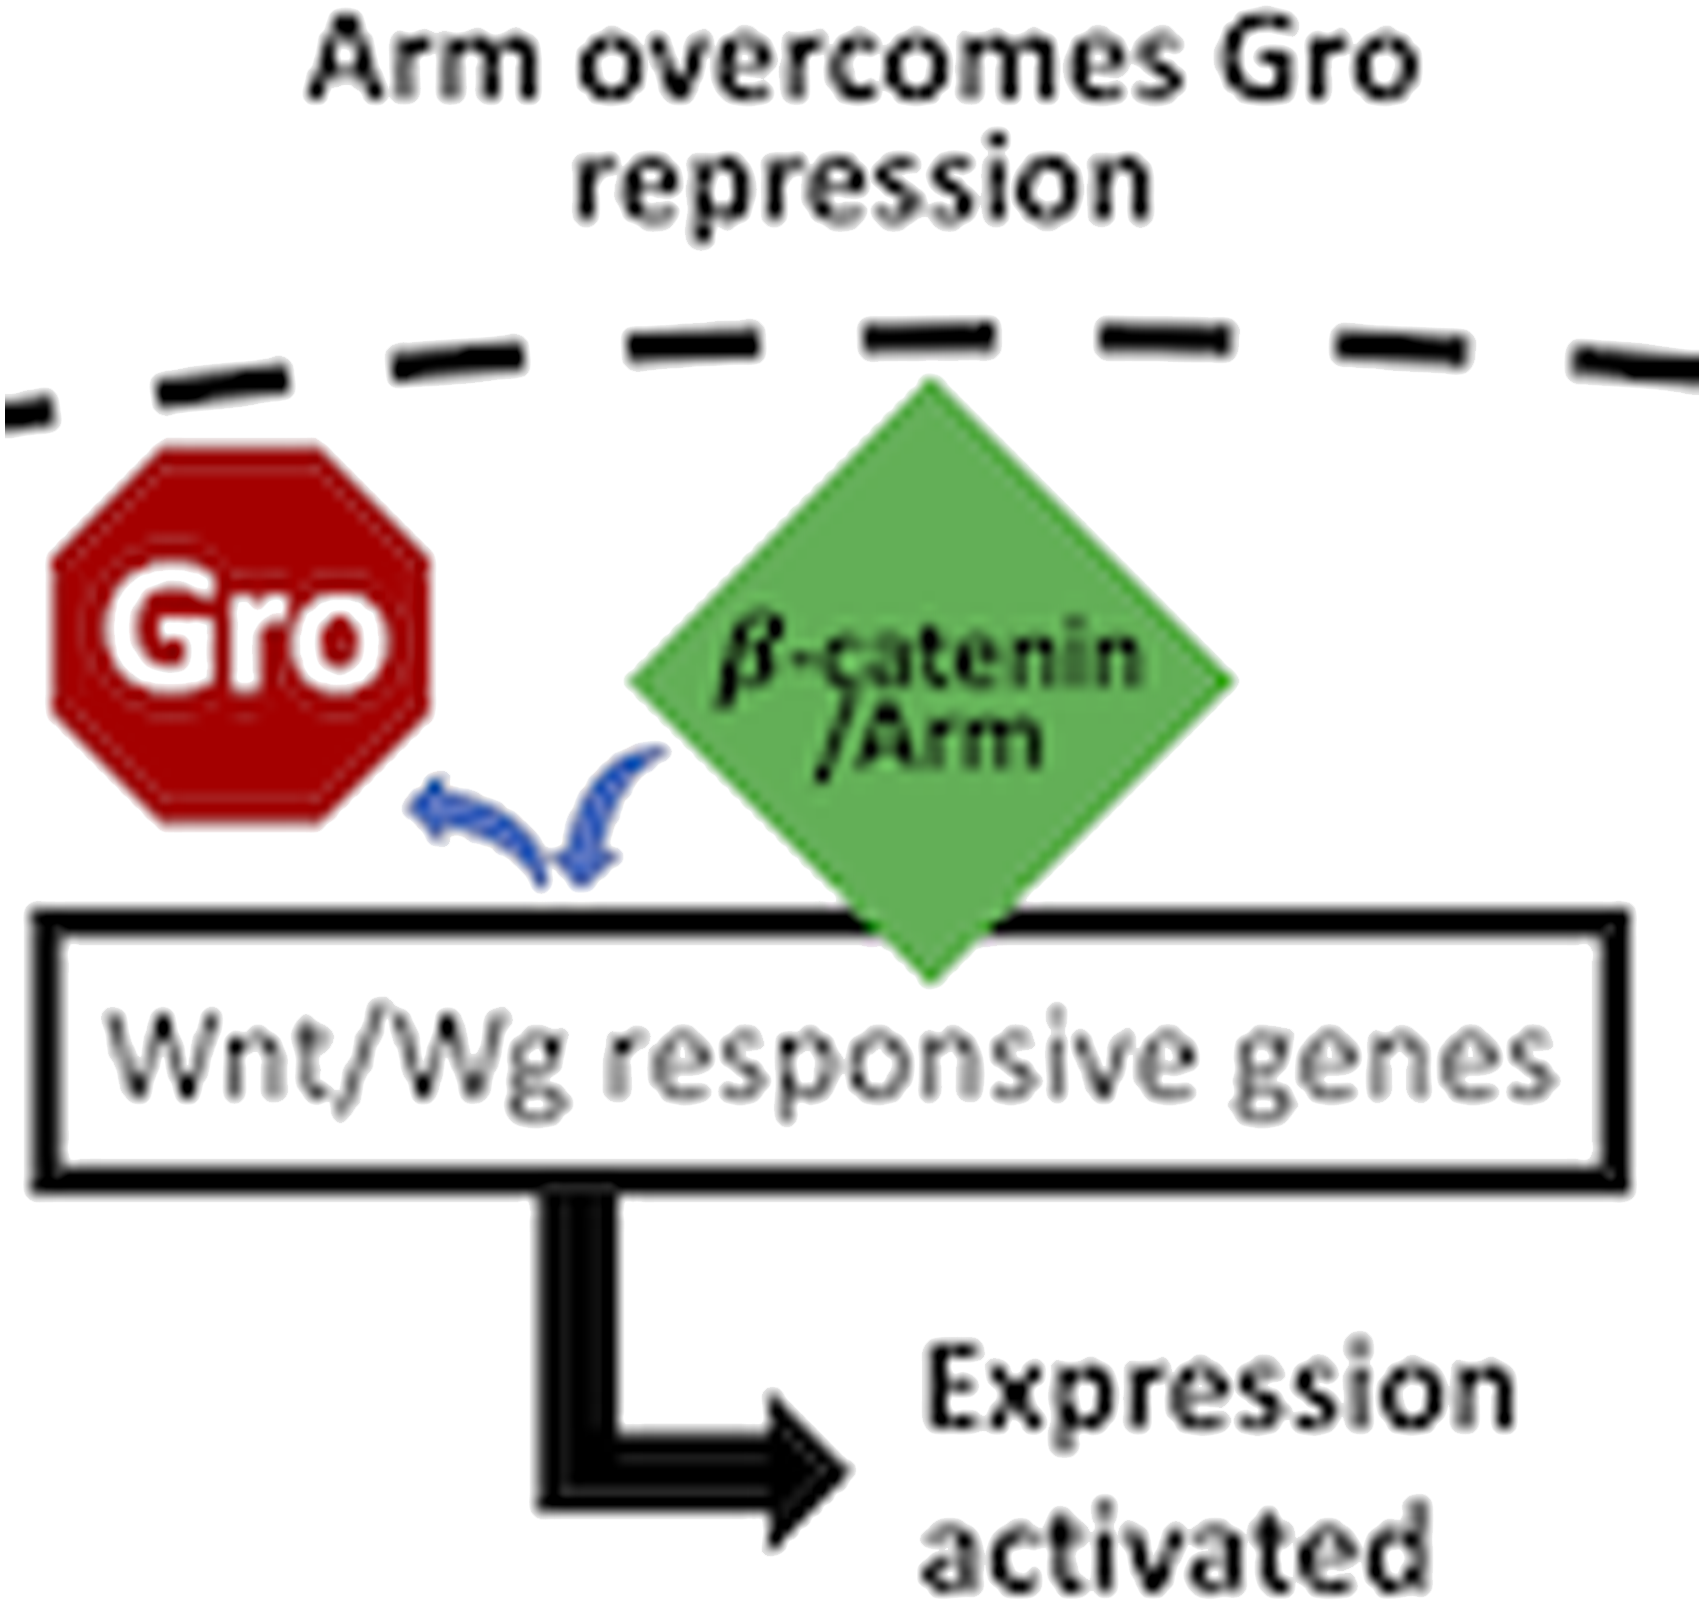

Discussion
β-Catenin, the closest mammalian homolog of Drosophila Armadillo (Arm), and the Wnt signaling pathway have been shown to be upregulated during the development of neuropathic pain in mammals,54-57 and locally administered blockers of Wnt/Wg signaling produces relief of neuropathic pain.54–59 However, baseline pain sensitivity is unaltered by nociceptor-specific knockout of β-catenin. 60 We sought to shed light on the relationship between β-catenin’s various functions and baseline pain using a simplified model system, the fly.
Of the numerous gene candidates previously identified as controlling nociceptor sensitivity in fruit flies, the glypican, Dally, 89 a potentiator of Wnt/Wg signaling, was found to be required in the nociceptor for nociceptive sensitization after injury. 25 Also, the transcription factor Brinker, a negative regulator of BMP signaling in the fly and known to antagonize Wg/Wnt signaling, 90 suppresses nociceptive sensitivity. 24 The findings reported here contribute further evidence consistent with the idea that β-catenin/Arm signaling affects nociceptor sensitivity in the fly by demonstrating that Arm, shown here to be expressed within class IV da neurons, or nociceptors, of Drosophila larvae (Figure 2(b)), is capable of controlling nociceptive sensitivity in the absence of injury.
Though prior studies have shown the necessity of other pathways such as Hedgehog, TNF-α/Eiger, and BMP pathways for UV injury induced nociceptive sensitization in the fly,19–25 and the TRP channels Painless32,33 and dTRPA1, 91 and Anoctamin Family channel Subdued 92 for maintenance of nociceptor sensitivity, there are potentially aspects of the nociceptor sensitivity mechanism that have been largely unexplored. By testing behavioral response latencies at a known noxious temperature of 45°C, 19 our results reveal a cell-specific requirement for Arm in maintaining nociceptor sensitivity in the absence of injury or illness. This requirement was demonstrated by significant increase in latencies observed in un-injured animals with Arm knocked down specifically within their nociceptors by two non-overlapping RNAi constructs, compared to normal control animals (Figures 3(d) and (e)). The results of behavioral testing of animals in which Arm is reduced specifically in the nociceptor indicate that the less Arm is available, the lower the nociceptive sensitivity, compared to normal controls.
In contrast, when additional wild-type Arm (Arm.S2) was expressed in the nociceptors, animals showed a genetically induced hyperalgesia response, or enhanced response to a normally noxious stimulus (Figure 4(d)). As an additional means of elevating Arm activity, we also employed Arm.S10, in which regions within the N terminus necessary for phosphorylation and ubiquitination had been deleted, increasing the protein’s resistance to degradation.65–67 This manipulation mimics the reduction in Arm degradation that prevails when Wnt/Wg signaling is activated.45,49,66 Consistent with the results of Arm.S2 expression, expression of Arm.S10 in nociceptors also produced behavioral hypersensitivity (Figure 5(c)), despite the lower resulting abundance of Arm.S10 relative to Arm.S2, as compared by immunodetection of the c-MYC tag featured in both constructs (Figures 5(a) and (b)). Taken together, results of behavioral testing of animals in which the Arm level was experimentally elevated specifically in the nociceptor indicate that the more Arm is available, the higher the nociceptive sensitivity, compared to normal controls.
When nociceptors either under-expressing Arm (via arm-IR-1) or expressing an additional c-MYC tagged form of Arm (Arm.S10) were evaluated for changes in dendritic morphology, no significant morphological changes were found. These morphometric analysis results were notable considering that Wnt/Wg signaling is known to be involved in neuronal development and neurogenesis.93–95 β-Catenin has furthermore been shown in mammalian hippocampal neurons to influence dendrite morphogenesis through its role in the cadherin-catenin complex, influencing actin cytoskeleton stabilization and cell-cell adhesion, a role separate from β-catenin’s role in the canonical Wnt signaling pathway.96,97 Our findings that Arm manipulation has no detected effect on dendritic morphology are inconsistent with those prior studies in mammals, perhaps due to factors such as species differences, differences in cell type and location (peripheral sensory neurons as opposed to central interneurons), as well as differences in experimental design (in vivo versus in vitro96,97).
Nociceptor dendrites form adhesion structures with overlying epidermal cells known as sheaths. Jiang and colleagues 98 found that manipulations that impair epidermal-dendritic sheath maturation also reduce nociceptive sensitivity. Since Arm is a known partner in adherens junction assembly, 65 these observations are consistent with our results indicating Arm underexpression in the nociceptor leads to reduced nociceptive sensitivity, while overexpression leads to increased sensitivity. Thus, it seems possible that our observations of Arm’s effects on nociceptor sensitivity could be at least partially due to its non-transcriptional role in cell adhesion during the maturation of epidermal sheaths.
Supporting this hypothesis is the observation that knockdown of Gro, known to antagonize Arm transcriptional activity, 87 has no significant effect on sensitivity. Animals in which Gro (Groucho), a transcriptional repressor in the Wnt/Wg and BMP pathways, was reduced specifically in the nociceptors (Figure 9), showed similar nociceptive sensitivity to controls (Figures 9(d) and (e)). These results fail to support the hypothesis that Gro is involved in regulating nociceptor sensitivity, despite other reports supporting its role in transcriptional repression of BMP and Wnt/Wg target genes.86,87 However, it is possible that in this context, Gro’s known co-repressors are able to compensate for experimental Gro underexpression, allowing sufficient transcriptional repression of BMP/Wg target genes within the nociceptors.
This report shows that manipulation of Arm expression specifically within the nociceptors is sufficient to modulate behavioral response to a noxious thermal stimulus in the absence of injury and that these changes are not associated with a detectable morphological effect. In contrast, in a similar study carried out in the mouse model, Simonetti and colleagues 60 genetically impaired β-catenin activity specifically in the nociceptor and observed no change in thermonociception. We suggest that the reason for these differing outcomes may lie in the evolutionary relationship between flies and mammals. In vertebrates, another catenin, γ-catenin (plakoglobin) has been shown to be capable of substituting for β-catenin’s adhesion function, but not its transcriptional function.99–102 Similar results were found when mammalian β-catenin and γ-catenin were expressed in Drosophila to complement Arm mutants, where both β-catenin and γ-catenin were found to be functional at cadherins complexes, but only β-catenin showed Wg signaling capabilities. 61 Knockdown of the fly Armadillo, homologous to both mammalian β-catenin and γ-catenin,61,103,104 reduces β/γ-catenin function: transcriptional, adhesional, or other. 67 So perhaps these findings demonstrate the need for further investigation of β-catenin/Arm within nociceptors in a way that could potentially complement mammalian pain investigation in uncovering potential new drug targets for the treatment of clinical pain. Further investigation into β-catenin/Arm’s transcriptional and cell adhesion functions is warranted to gain a broader understanding of the mechanism of maintaining baseline nociceptor sensitivity both in flies and mammalian systems.
Footnotes
Acknowledgments
Stocks obtained from the Bloomington Drosophila Stock Center (NIH P40OD018537), including those generated by the TRiP at Harvard Medical School (NIH/NIGMS R01-GM084947), were used in this study. The ppk1.9-Gal4 and ppk1.9-Gal4, UAS-mCD8-GFP lines were a generous gift from M. Galko. Custom Python algorithms and scripts used in morphometry analysis were a generous gift from D. Cox. The N2 7A1 Armadillo monoclonal antibody, developed by E. Wieschaus, the 9E 10 monoclonal antibody, developed by J.M. Bishop, and the Gro monoclonal antibody, developed by C. Delidakis, were obtained from the Developmental Studies Hybridoma Bank, created by the NICHD of the NIH and maintained at the University of Iowa, Department of Biology, Iowa City, IA 52242. The authors gratefully acknowledge the support of NIH/NINDS award 2R15NS095195-02 to G. Ganter, NIH/NIGMS COBRE award 1P20GM103643-01A1 to I. Meng, its Histology and Imaging Core, and the UNE Microscope Core Facility, funded by NSF Grants #0116398 and #1125672.
Declaration of conflicting interests
The author(s) declared no potential conflicts of interest with respect to the research, authorship, and/or publication of this article.
Funding
The author(s) disclosed receipt of the following financial support for the research, authorship, and/or publication of this article: This work was supported by the National Institute of Neurological Disorders and Stroke (2R15NS095195-02), National Institute of General Medical Sciences (1P20GM103643-01A1), and National Science Foundation (0116398, 1125672).