
Abstract
Morphine is the most commonly used drug for treating physical and psychological suffering caused by advanced cancer. Although morphine is known to elicit multiple supraspinal analgesic effects, its behavioral correlates with respect to the whole-brain metabolic activity during cancer-induced bone pain have not been elucidated. We injected 4T1 mouse breast cancer cells into the left femur bone marrow cavity of BALB/c mice. All mice developed limb use deficits, mechanical allodynia, and hypersensitivity to cold, which were effectively suppressed with morphine. Serial 18F-fluorodeoxyglucose positron emission tomography (FDG-PET) was performed for each mouse before cancer induction (0 day), after cancer-induced bone pain was established (14 days), and during effective morphine treatment (16 days). The longitudinal FDG-PET imaging analysis demonstrated that cancer-induced bone pain increased glucose uptake in the insular cortex and hypothalamus and decreased the activity of the retrosplenial cortex. Morphine reversed the activation of the insular cortex and hypothalamus. Furthermore, morphine activated the amygdala and rostral ventromedial medulla and suppressed the activity of anterior cingulate cortex. Our findings of hypothalamic and insular cortical activation support the hypothesis that cancer-induced bone pain has strong inflammatory and affective components in freely moving animals. Morphine may provide descending inhibitory and facilitatory actions in the treatment of cancer-induced bone pain in a clinical setting.
Introduction
Metastatic cancer-induced bone pain (CIBP) is one of the most common types of pain and causes of morbidity in patients with advanced cancer. 1 Bone metastasis pain can be categorized as nociceptive inflammatory pain, which is caused by an osteolytic lesion or pathologic fracture, and neuropathic pain, which is caused by cancer invasion into adjacent structures. 2 When cancer metastasizes to the bone, it can cause persistent and unbearable pain, which involves peripheral inflammation that can further progress to chronic pain.3–5 The sensations of pain and sickness are related to immune system reactions.6,7 The CIBP mouse model has been investigated at the spinal cord level.8,9 However, a longitudinal 18F-fluorodeoxyglucose positron emission tomography (FDG-PET) study has never been conducted at the supraspinal level.
Morphine is a strong opioid that has been currently recommended for cancer-induced pain treatment.10,11 Multiple brain areas and complex brain circuits are involved in morphine analgesia. 12 However, a longitudinal study of the whole-brain area on which morphine acts to produce its analgesic effects in patients with CIBP is absent.
PET has been used for studying global functional brain changes.13,14 This method uses 18F-fluorodeoxyglucose (FDG) isotope as a functional marker of glucose metabolism. In this technique, the concentration of isotope trapped inside brain cells due to glucose uptake is measured, thereby indicating the brain areas activated or inactivated during a specific uptake period. A primary difference between FDG-PET and functional magnetic resonance imaging (fMRI) is that mice can move freely during the FDG uptake period, whereas anesthesia is usually necessary for fMRI imaging, which changes the physical condition and brain function of the tested animals. In this study, we used repetitive FDG-PET to investigate changes associated with glucose metabolism in mice brains before and after CIBP development. The relevance of the change in brain areas to CIBP was further tested with morphine analgesia.
Materials and methods
Animals
This study used seven- to nine-week-old female BALB/c mice weighing 17–21 g. Groups of three mice were housed together in plastic cages in a temperature- and humidity-controlled room (23°C ± 2°C and 55% ± 5%) with a 12-h light–dark cycle. Food and water were available ad libitum. The Institutional Animal Care and Use Committee of National Taiwan University approved all experimental and animal handling procedures. The methods adopted in this study abide by the “Codes for Experimental Use of Animals” of the Council of Agriculture of Taiwan, which is based on the Animal Protection Law of Taiwan.
Cell lines
The mouse mammary carcinoma cell line 4T1 (ATCC; CRL-2539™) was provided by Dr. Wen-Fang Cheng (National Taiwan University, Taipei, Taiwan). Cells were subcultured according to the manufacturer’s instructions. Cultures were harvested with 0.25% trypsin-ethylenediaminetetraacetic acid (EDTA) (Gibco Invitrogen) and resuspended in 0.1 M phosphate-buffered saline (PBS) until the cancer operation. The cells were placed on ice until implantation.
Bone cancer operation
The entire surgery was performed under anesthesia induced through an intraperitoneal injection of a ketamine xylazine mixture (75:11.66 mg/kg). We used a modified version of the method described by Heegaard to induce bone cancer. 15 Briefly, an incision was made over the patellar tendon and the distal medial part of the vastus medialis. The patella was pushed aside to expose the left distal femoral epiphysis. A hole was drilled into the medullary cavity using a 29-gauge insulin syringe needle (0.5-mL insulin syringe; Becton, Dickinson and Company, New Jersey, USA), and 20 μL of PBS containing 10,000 4T1 cancer cells was inoculated using an insulin syringe. Sham-operated controls were inoculated with PBS alone. The skin was sutured with 4/0 silk thread, and for seven days, the mice were allowed to rest and recover.
Drug
Morphine (morphine hydrochloride injection 10 mg/mL; Pharmaceutical Plant of Controlled Drugs, Food and Drug Administration, Ministry of Health and Welfare, Taiwan) was injected intraperitoneally (dosage: 15 mg/kg) 75 min before the third PET scan. This dosage was determined by a separate behavioral pretest.
Behavioral tests
Movement-evoked pain and mechanical and cold allodynia were assessed five to seven days before injecting cancer cells or shams; on days 7, 10, and 14 following the surgery, and on day 16 following the surgery and morphine treatment.
Movement-evoked pain (limb use deficit)
For adaptation, mice were placed on a glass plate at a controlled temperature of 30°C ± 1°C for 15 min. Abnormal limping and guarding behaviors were recorded for 15 min. The movement of cancer-induced hindlimbs was rated on the following scale: 4, normal use; 3, substantial limping; 2, limping and guarding behavior; 1, partial non-use of the limb in locomotor activity; and 0, complete lack of limb use. 16
Mechanical allodynia (von Frey test)
The mice were acclimated to the elevated wire mesh for 15–30 min before testing. During testing, a set of von Frey filaments of increasing force (0.02, 0.04, 0.07, 0.16, 0.40, 0.60, 1.00, and 1.40 g) was applied to the plantar surface of the hind paw using a modified staircase method. 17 Pain response was determined on the observation of a mouse briskly withdrawing its foot from the bending filament. The 50% withdrawal threshold was tested three times, and the mean value was used.
Cold allodynia (acetone test)
Acetone tests were conducted using a blunt plastic tube connected to a syringe, and a droplet of acetone was placed on the plantar surface of the hind paw. The cumulative duration of nocifensive behaviors, such as lifting, licking, biting, and shaking of the hindlimb, was recorded for testing cold allodynia. Withdrawal responses having a minimum length of 0.5 s and a maximum length of 20 s were recorded. 18 Tests were performed five times.
FDG-PET scan protocol
The mice with CIBP (n = 9) and sham (n = 8) underwent the PET scan three times. The baseline scan was performed 1–5 days before the surgery, the CIBP scan was performed 14 days after the surgery, and the morphine treatment scan was performed 16 days after the surgery.
The mice were fasted overnight before each scan. At the beginning of each scan, each mouse received 500 μCi of FDG intraperitoneally with <2 min of isoflurane inhalation (5% in 100% oxygen). During the FDG uptake period, the mice were placed on a glass plate in a transparent acrylic box for 60 min. Moreover, we recorded their rest, movement, and sleep behaviors for 20 min at 60-s intervals. The mice were placed into the PET scanner with a head holder under isoflurane inhalation (2% in 100% oxygen) until the end of the scan. The scan time was 30 min for PET and 11 min for computed tomography (CT).
FDG uptake in the brain was measured using an eXplore Vista Dual-Ring Small-Animal PET/CT scanner (GE Healthcare, Waukesha, WI, USA) with an average full width at half maximum resolution of 1.26 mm. FDG uptake was quantified using standardized uptake values (SUVs). The SUV formula is as follows: SUV = regional FDG concentration (Bq/mL)/injected FDG dose (Bq) × body weight (kg). The raw images were anatomically standardized to achieve symmetrical midline alignment. To improve the resolution and sensitivity of the acquired images, the images were reconstructed using the 3D ordered subsets expectation maximization algorithm. The nominal voxel size was 0.387 mm × 0.387 mm × 0.775 mm.
PET image processing
PET images were processed according to our previously published voxel-based statistical parametric mapping (SPM) analytical method.19,20 We used SPM (SPM8; Wellcome Trust Centre for Neuroimaging, Institute of Neurology, UCL, United Kingdom) to co-register FDG-PET images to the corresponding T2-weighted magnetic resonance imaging (MRI) images. We obtained the corresponding MRI images from our lab’s MRI database, which served as anatomical images. Nonbrain areas were removed from the PET and MRI images by using Medical Image Processing, Analysis, and Visualization (MIPAV version 4.1.2, Center for Information Technology, National Institutes of Health, Bethesda, Maryland, USA). We then converted the SUVs to activation index (AI) values 20 through normalization of each voxel signal to the whole-brain average signal, which provided a measure of the relative neural activity compared with the whole-brain average, and minimized variations caused by operation errors during the FDG intraperitoneal injection. The normalized PET images and MRI images were co-registered to the stereotaxic coordinates with reference to the averaged T2-weighted images of all the brains in this experimental series and resliced with trilinear interpolation (final voxel size: 0.2 mm × 0.2 mm × 0.2 mm).
Statistical mapping of PET images
To map brain activation differences between the experimental groups, we used SPM8 to conduct voxel-based multiple regression analysis with the following equation: Y(i) = β1(limb use score(i)) + β2(sleeping(i)) + β3(moving(i)) + β4(pre-CIBP(i)) + β5(CIBP(i)) + β6(CIBP-morphine(i)) + β7(pre-sham(i)) + β8(sham(i)) + β9(sham-morphine(i)) + ε(i). For a given voxel, Y(i) is the ith observation of the AI. The values of β, which are estimates, represent the contribution of each variable to the AI. The εi is the ith independent identically distributed normal error. In each of the ith observations, one of the variables (pre-CIBP(i), CIBP(i), CIBP-morphine(i), pre-sham(i), sham(i) and sham-morphine(i)) is 1, and the others are 0, depending on the experimental group. Behavioral scores (limb use, sleeping, and moving) recorded during each of the ith observations were added into the regression model to differentiate the motor-related variations from group comparisons, especially the side effect where morphine drastically reduced motor activity. The motor-related variations were also caused by habituation during the repeated PET scans, and demotivation resulted from the deficient hindlimb developing femoral bone cancer. Finally, brain activation differences between the groups were computed using SPM T-contrast (β5 vs. β4 and β8; β6 vs. β5), and significance was determined using an individual voxel threshold of p < 0.05 with a cluster size threshold of 20 continuous voxels.
For the region of interest (ROI) analysis, we used OsiriX Imaging software (Pixmeo, Geneva, Switzerland) to extract the SUVs of selected ROIs. The specific brain structures included the anterior and posterior cingulate cortices (ACC and PCC), retrosplenial cortex (RSC), anterior and posterior insular cortices (AIC and PIC), primary somatosensory cortex (S1FL and S1HL; forelimb and hindlimb regions), secondary somatosensory cortex (S2), primary motor cortex (M1), caudate putamen (CPu), nucleus accumbens (NAcc) core region, central nucleus of the amygdala (CeA), ventral posterolateral and posteromedial (VPL and VPM) thalamic nucleus, hypothalamus, and rostral ventromedial medulla (RVM). AI in percentage was then calculated using the following equation: AI (%) = [(Sampled ROI SUVs − Average total brain SUVs)/Average total brain SUVs] × 100%. 21
Histopathological examination
On day 21, the mice were deeply anesthetized with 0.1 mL of pentobarbital (65 mg/mL), and the femurs of the mice were removed to determine cancer cell infiltration. The femurs were fixed in 4% paraformaldehyde and decalcified in 10% EDTA. After embedding in paraffin, the femurs were cut into 4-μm sections and stained with hematoxylin–eosin reagent.
Statistical analysis
For behavioral tests, we used two-way repeated measures analysis of variance (ANOVA) and Tukey’s post hoc multiple comparison. The statistical significance of morphine treatment and ROI analysis of AI difference with one-way repeated measures ANOVA and Tukey’s post hoc multiple comparison was determined using SigmaPlot software version 14.0 (Systat Software Inc., San Jose, CA, USA). Results are presented as mean ± standard error of the mean. Data were considered statistically significant at p < 0.05.
Results
CIBP mice showed limb use deficits with mechanical and cold allodynia
The time course of three behavioral results for the CIBP mice compared with the sham group is depicted in Figure 1(a) to (c). In the CIBP group, the limb use score decreased significantly on day 7 after the surgery (2.67 ± 0.12; p < 0.001; Figure 1(a)), the withdrawal threshold decreased in the von Frey test from day 10 (0.09 ± 0.02 g; p < 0.01; Figure 1(b)), and the withdrawal response duration in the acetone test increased from day 10 (4.22 ± 0.65; p < 0.001; Figure 1(c)) compared with the sham group. Thus, the CIBP mice had developed limb use deficits with mechanical and cold allodynia after femur bone surgery and inoculation with cancer cells.
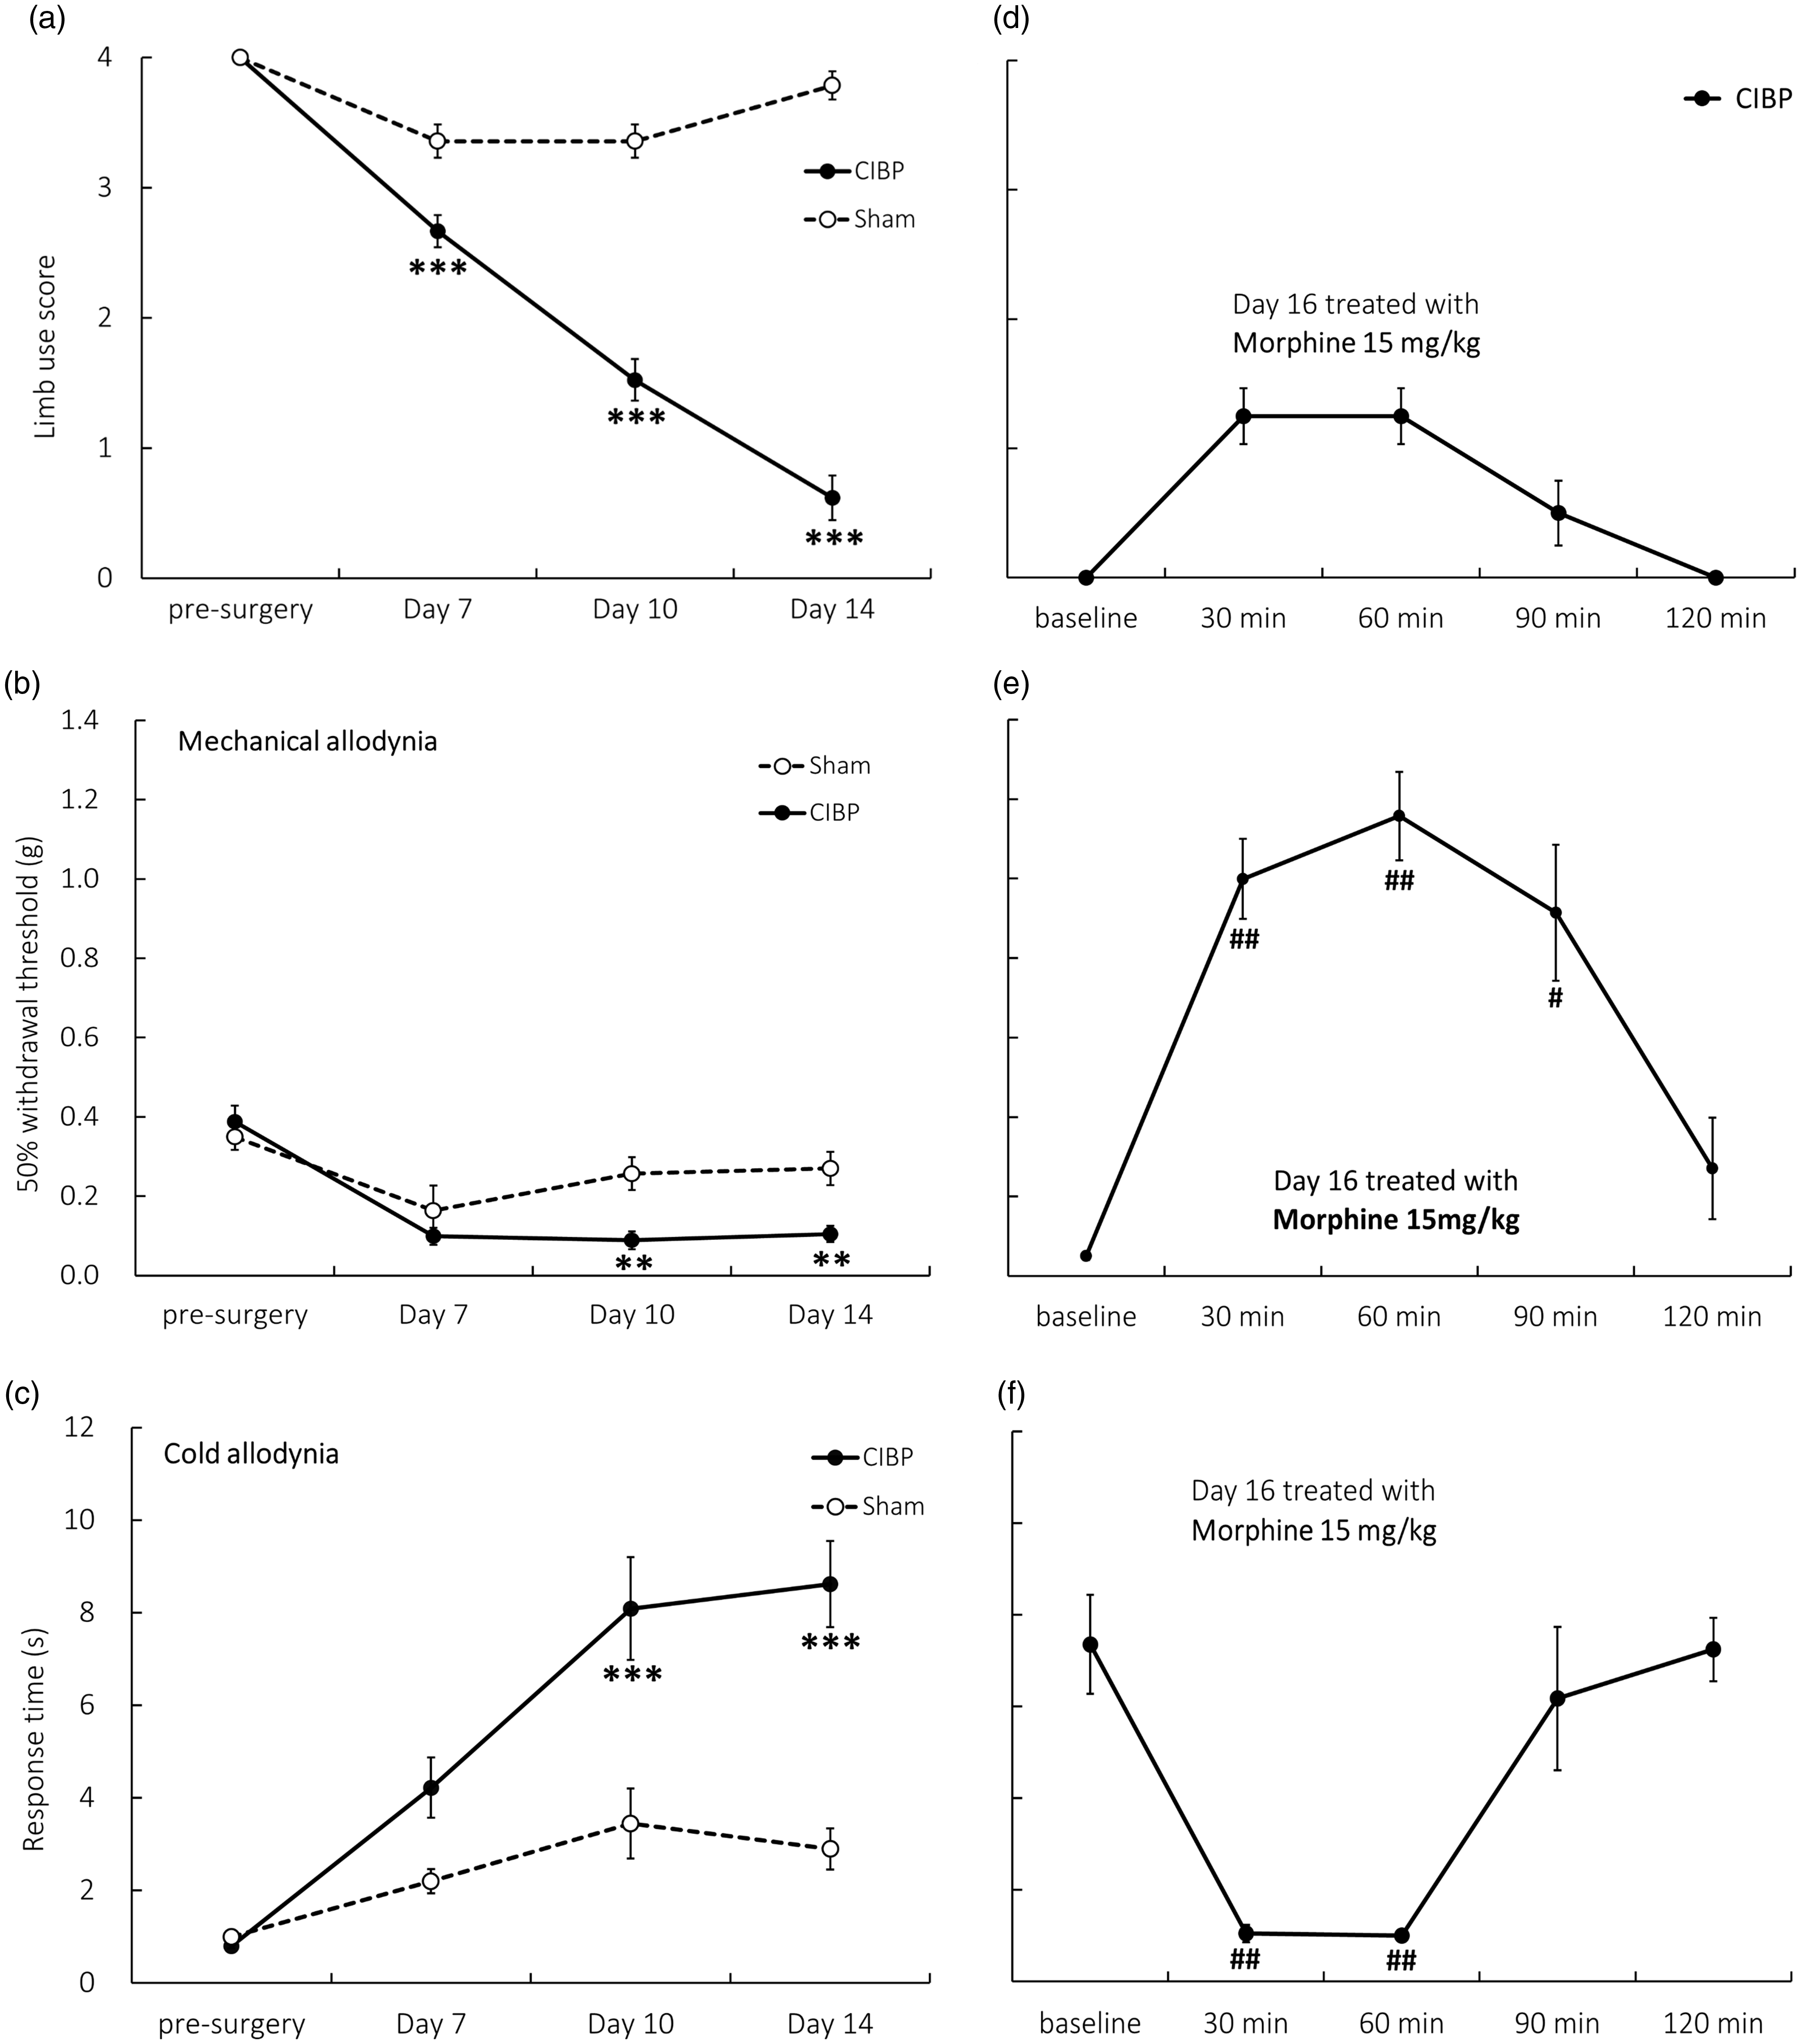
Time course of various pain-related behaviors. (a) Limb use scores decreased seven days after cancer implantation surgery (n = 14–21). (b) Mechanical allodynia was tested using von Frey filaments (n = 8–14). The withdrawal threshold of the CIBP mice compared with the sham group significantly decreased on day 10. (c) Cold allodynia increased seven days after surgery (n = 11–12). (d–f) On day 16, morphine treatment relieved all pain behaviors. In this series of morphine effects, n = 4 for limb use score, n = 6 for the von Frey test, and n = 8 for the acetone test. Each mouse was injected with morphine one time only. CIBP vs. sham: *p < 0.05, **p < 0.01, ***p < 0.001. Morphine treatment vs. baseline: #p < 0.05, ##p < 0.01. CIBP: cancer-induced bone pain.
Morphine alleviated CIBP
The three behavioral results of morphine administration on day 16 are depicted in Figure 1(d) to (f). Morphine relieved limb use deficits 30 min and 60 min after injection (1.25 ± 0.21; Figure 1(d)), although the results were statistically nonsignificant. Furthermore, the effects of morphine were observed at similar durations in the cold allodynia test (30 min, 1.05 ± 0.19 s; 60 min, 1.00 ± 0.08 s; p < 0.01; Figure 1(f)), and for the mechanical allodynia test, the morphine effect was also observed at 90 min (30 min, 1.00 ± 0.1 g; 60 min, 1.16 ± 0.11 g; 90 min, 0.91 ± 0.17 g; p < 0.05; Figure 1(e)). These results indicated that morphine relieved CIBP symptoms transiently for 1–1.5 h.
Brain glucose metabolic activity changes in CIBP and under morphine analgesia
The SPM results of FDG-PET images according to voxel-based multiple regression analysis are presented in Figure 2. Comparing mice brain images after CIBP with those before CIBP surgery and under sham conditions (Figure 2(a)) showed that the glucose metabolic rate increased in the contralateral AIC (Figure 2(a), +1.05, 0 mm) and hypothalamus (Figure 2(a), 0, −1.05 mm) and decreased in the RSC (Figure 2(a), −2.1, 3 mm) after CIBP. Furthermore, comparing CIBP mice treated with morphine with those under the CIBP condition (Figure 2(b)) showed that the glucose metabolic rate decreased activities in the bilateral AIC, S2 and ACC (Figure 2(b), +1.05, 0 mm), and hypothalamus (Figure 2(b), 0, −1.05 mm) and increased activities in the amygdala (Figure 2(b), −2.1, −3 mm) and RVM (Figure 2(b), −4.05, −5.1 mm).

Brain t-maps (voxel-based morphometry) of the coronal sections of the CIBP (n = 9) and sham (n = 8) mice. The eight sections are arranged from the most rostral (2.1 mm rostral to the bregma) at the left-most side of the top panel to the most caudal (5.1 mm caudal to the bregma) at the right-most corner of the lowest panel. Convergent data are evident for many brain areas with significant decreases (blue) and increases (red) in glucose metabolic activity, as identified using multiple regression analysis: Y(i) = β1(limb use score(i)) + β2(sleeping(i)) + β3(moving(i)) + β4(pre-CIBP(i)) + β5(CIBP(i)) + β6(CIBP-morphine(i)) + β7(pre-sham(i)) + β8(sham(i)) + β9(sham-morphine(i)) + ε(i). (a) For CIBP, β5 vs. β4 and β8. Cancer bone pain-induced brain activity increased in the contralateral AIC and Hy and decreased in the RSC. (b) For the morphine effect, β6 vs. β5, morphine treatment at 16 days after the surgery decreased activities in the bilateral AIC, S2, and ACC and abolished the increased glucose metabolic activity in the Hy; simultaneously, it increased AM and RVM activity. ACC: anterior cingulate cortex; AIC: anterior insular cortex; AM: amygdala; Hy: hypothalamus; RSC: retrosplenial cortex; RVM: rostral ventromedial medulla; S2: secondary somatosensory cortex.
ROI analysis of specific brain areas
Table 1 shows the results of the ROI analysis, which determines quantitative activity changes in specific brain structures on the basis of AI values. In the CIBP group, a comparison of the mice before and after morphine treatment showed that the AI decreased in the contralateral AIC, NAcc, and ipsilateral hypothalamus and increased in the ipsilateral RVM after morphine treatment. In the sham group, a comparison of the mice before and after surgery showed that the AI increased in the contralateral CPu and ipsilateral amygdala after the surgery. Furthermore, after morphine treatment, the AI value decreased in the contralateral ACC, PCC, bilateral AIC, ipsilateral PIC, and S1 and increased in the bilateral RVM.
Activation index (%) of the CIBP and sham groups according to ROI analysis.

Postsurgery (CIBP or sham) compared with presurgery using one-way repeated measures ANOVA. Morphine-treated state compared with postsurgery state using one-way repeated measures ANOVA. Blue color indicates decreased AI%, and red color indicates increased AI%. Data are presented as mean ± SEM. For expansions of the abbreviations, refer to the main text. ANOVA: analysis of variance; AI: activation index; CIBP: cancer-induced bone pain; ROI: region of interest; SEM: standard error of the mean; i: ipsilateral; c: contralateral; RVM: rostral ventromedial medulla; VPM: ventral posteromedial; VPL: ventral posterolateral; CeA: central nucleus of the amygdala; CPu: caudate putamen; NAcc: Nucleus Accumbens; M1: primary motor cortex; ACC: anterior cingulate cortex; PCC: posterior cingulate cortex; RSC: retrosplenial cortex; AIC: anterior insular cortex; PIC: posterior insular cortex; S1HL: primary somatosensory cortex hindlimb; S1FL: primary somatosensory cortex forelimb; S2: secondary somatosensory cortex.*p < 0.05; #p < 0.05.
Cancer-induced histopathological changes in the femur
In the CIBP mice, the femur presented focal osteolysis of the trabecular bone and cortical bone, and extensive infiltration of cancer cells was noted locally (Figure 3(a) and (b)). However, no significant histopathological changes in the femur were identified in the sham group with intrafemoral implantation (Figure 3(c) and (d)).

Hematoxylin and eosin-stained femur cells of (a) CIBP mouse and (c) sham mouse. (b and d) Higher magnification photomicrographs of (a) and (c), respectively. Osteoclasts (black arrows) are present between cancer cells and osteolytic lesions. Scale bars: 100 μm.
Discussion
In our study, glucose metabolic changes in the brains of the CIBP mice were demonstrated for the first time. However, an analgesic dose of morphine completely reversed the activity changes in these brain regions, namely the hypothalamus and IC. Furthermore, morphine treatment activated the amygdala and ventromedial medulla.
We first established the validity of our CIBP pain model by longitudinally following the spontaneous and evoked pain-related behaviors of the cancer-induced mice. We used the limb use score for quantitatively assessing movement-evoked pain, a method well established by Mantyh et al.22,23 The allodynia level correlates with osteolysis and nociceptor sensitization. 24 Osteolytic bone pain is mainly nociceptive at first, but when it becomes persistent, both peripheral and central nerve systems are sensitized. 25 On days 14–16 after cancer cell injection, our CIBP model appeared to have chronic and persistent pain.
On day 14 after the surgery, our FDG-PET data demonstrated a significant change in the hypothalamus of the CIBP mice. This result may relate to tumor progression and the inflammatory process. Inflammation is a critical component of bone metastasis. The tumor interacts with the leukocyte receptors that it stimulates, which causes the production of proinflammatory cytokines, such as interleukin (IL)-1, IL-6, and tumor necrosis factor-α. These immune response modulations cause further tumor progression, 4 especially IL-6 signaling, and may play a critical role in tumor-induced bone remodeling and ongoing pain. 26 In addition, a rising IL-6 level induces the brain to produce prostaglandin E2, which alters the activity of neurons controlling the hypothalamic-pituitary-adrenal axis. 27 The pathogenesis of sickness-related symptoms, such as elevated body temperature, increased sleep, and loss of appetite, are related to proinflammatory cytokines and inflammation.6,7,28
Despite peripheral mechanisms of bone metastasis being well documented, few studies have investigated the brain mechanism during CIBP. We found only one report discussing the brain network of cancer pain in a rodent model. 29 However, that study used resting fMRI to identify changes in the functional brain network of mice with chronic bone cancer pain under medetomidine anesthesia. That study demonstrated that CIBP might alter the resting state activity of the cingulate cortex, prefrontal cortex (PFC), and ventral striatum, which indicated a strong affective component in the CIBP mice. Because this study was conducted under anesthesia, it was unclear whether these brain changes were relevant to pain. Another study that performed imaging on human cancer patients showed that patients with chronic cancer pain exhibited activation in the PFC. 30
FDG-PET images of the CIBP mice showed increased activity in the AIC on contralateral sides of the brain, but the activity reversed after morphine treatment. The IC region has been considered to integrate sensory and emotional inputs.13,31 PET studies have demonstrated IC activation of neural activity in allodynia subjects.32,33 The RSC exhibited decreased activity under a CIBP state, but no further changes were observed under morphine analgesia. The RSC was reported to be involved in descending inhibitory mechanisms under the formalin and tail-flick test. 34 Moreover, stimulated RSC can induce an antinociceptive effect. 34
Several brain regions have exhibited decreased activity under morphine analgesia, and the most prominent changes were evident in the ACC and AIC. The ACC may play a critical role in affective processing in chronic ongoing neuropathic pain, 35 CIBP, 36 and deactivation of the pharmacological effect of analgesia.20,37 Both the IC and ACC are critical components in pain affecting functioning. Our findings thus confirmed the crucial involvement of the affective part of the brain in the advanced stage of CIBP.
The morphine-treated CIBP mice demonstrated increased activity of the amygdala and RVM. According to radioligand binding assays, the regional distribution of opiate receptors is the highest in the amygdala, IC, caudate, and anterior hypothalamus, followed by the frontal and parietal cortices, putamen, thalamus, and periaqueductal gray in the midbrain. 38 Autoradiographic and PET studies have shown39–41 μ receptors to be the densest in the periaqueductal midbrain, amygdala, thalamus, and striatum. The amygdala plays a key role in emotional processing and the emotional–affective dimension of pain. The neural circuitry of the amygdala is involved in the increased excitatory and inhibitory transmission of the pain pathway. For example, the central nucleus of the amygdala, which was the most activated area after morphine treatment in the present study, is directly connected with the periaqueductal gray region, which is a critical component of the descending pain modulatory system. Pharmacological intervention in the amygdala showed that decreased amygdala activity generally inhibits pain behaviors. 42 However, targeting pain-related medial PFC (mPFC) dysfunction and increased inhibitory neuronal activity in the amygdala could elicit pain behaviors. 43 Our study suggested amygdala activation with morphine may be involved in pain inhibition.
The RVM is an essential endogenous descending pain control system, and in previous neuropathic pain studies, it was not only demonstrated as the facilitatory pathway but also as related to central sensitization development.44,45 The microglia and astrocytes in the RVM were markedly activated, and inhibition of microglia-expressed P2X7R significantly alleviated pain behaviors of cancer rats. 46
However, in the present study, a significant increase in glucose metabolic activity was observed after morphine treatment even in the sham mice (Table 1). This indicates that these changes may not be directly related to the analgesic effect. In addition to analgesia, morphine may have caused many other effects, such as reinforcement. 47 In an fMRI study of opioid-naïve healthy volunteers, low-dose morphine infusion activated reward structures, including the NAcc, amygdala, and hippocampus. Furthermore, morphine, being a sedative drug, deactivated the cortical area. 48 Although morphine dose up to 30 mg/kg may not impair rotarod function, 49 we noted sedation in mice after treatment with a morphine dose of <15 mg/kg.
In human neuroimaging studies, painful mechanical stimulation of bone and muscle involved the bilateral insula, AIC, PIC and S2, inferior parietal lobe, and basal ganglia in an fMRI study of healthy volunteers. 50 Another fMRI study revealed similar results 51 where painful mechanical stimulation in patients with knee osteoarthritis (OA) activated the bilateral thalamus, S2, IC and cingulate cortex, and unilateral putamen and amygdala. Kulkarni et al. 52 used FDG-PET to identify changes in selective brain areas of patients with knee OA. The results revealed that in patients with arthritic pain, the regional cerebral metabolic rate of glucose metabolism was enhanced in all pain-processing brain areas, which included the bilateral PIC, AIC, PFC, orbitofrontal cortex and S1, and left thalamus, amygdala, and right supplementary motor area. However, the AIC is the most significantly activated area in patients with arthritic pain. OA may involve both acute pain 13 and neuropathic pain features. 53
The fMRI study of patients with trigeminal neuropathic pain (TNP) and temporomandibular disorders showed 54 that in patients with TNP, the gray matter volume increased in the PIC and decreased in the S1, AIC, putamen, NAcc, and thalamus. However, in patients with chronic back pain, the gray matter volume increased in the basal ganglia and thalamus and decreased in the brainstem and S1. 55 Thus, different types of chronic pain may involve different brain areas. Chronic pain and stress hormones involve the corticolimbic system, including the PFC, amygdala, and hippocampus. 56 fMRI studies of patients with chronic low back pain have shown that the anatomical and functional connectivity of the mPFC and NAcc is related to chronic pain development, and the amygdala is related to subacute to chronic states of back pain.57,58
The FDG-PET/CT image can provide quantitative results in clinical oncology. 59 Because of the high glucose metabolic rate in the brain, brain FDG-PET imaging is not routinely used in clinical settings. However, under experimental conditions, many studies have demonstrated functional brain changes under pain conditions in both rodents and humans.30,60–62 To the best of our knowledge, ours is the first FDG-PET brain functional imaging study to reveal major changes in the brain of CIBP mice. A limitation of this study is the lack of measurements of physiological markers, such as body temperature and cytokine; these markers must be explored through further research.
In this CIBP model, freely moving mice exhibited a full spectrum of sensory phenotypes that were relieved with morphine. Our longitudinal FDG-PET scanning demonstrated the active role of the IC and hypothalamus in pain development. Morphine suppressed the glucose metabolic activity in the IC and hypothalamus and activated the amygdala and RVM. Thus, our findings regarding hypothalamic and insular cortical activation support the hypothesis that CIBP has strong inflammatory and affective components. The additional association of morphine with the amygdala and RVM confirmed that morphine exerts its pharmacological action through a combination of descending inhibition and facilitation and affective systems. This complex mode of analgesic action on various brain regions explains how morphine works through somatosensory and affective–cognitive modulation. This information could also provide translational evidence for developing more selective strategies for targeting refractory bone cancer pain.
Footnotes
Acknowledgments
The authors are thankful for the excellent technical support from the Department of Nuclear Medicine at National Taiwan University Hospital and Small Animal PET/CT Core Facility of the Molecular Imaging Center of National Taiwan University.
Author Contributions
WYL, WZS, and CTY conceived the experiments; WHC and WYL performed the experiments; THC analyzed the PET images; and WYL and CTY prepared the first draft of the manuscript. WYL, WZS, and CTY are responsible for the final draft of the manuscript.
Declaration of Conflicting Interests
The author(s) declared no potential conflicts of interest with respect to the research, authorship, and/or publication of this article.
Funding
The author(s) disclosed receipt of the following financial support for the research, authorship, and/or publication of this article: The present study was supported by the National Health Research Institute (grant number NHRI-EX103-10104NI) and the Ministry of Science and Technology (grant number MOST105-2311-B-002–029 and MOST 106–2314-B-002–071-MY3).