
Abstract
Background
AYX1 is an unmodified DNA-decoy designed to reduce acute post-surgical pain and its chronification with a single intrathecal dose at the time of surgery. AYX1 inhibits the transcription factor early growth response protein 1, which is transiently induced at the time of injury and triggers gene regulation in the dorsal root ganglia and spinal cord that leads to long-term sensitization and pain. This work characterizes the AYX1 dose-response profile in rats and the link to AYX1 pharmacokinetics and metabolism in the cerebrospinal fluid, dorsal root ganglia, and spinal cord.
Results
The effects of ascending dose-levels of AYX1 on mechanical hypersensitivity were measured in the spared nerve injury model of chronic pain and in a plantar incision model of acute post-surgical pain. AYX1 dose-response profile shows that efficacy rapidly increases from a minimum effective dose of ∼ 0.5 mg to a peak maximum effective dose of ∼ 1 mg. With further dose escalation, the efficacy paradoxically appears to decrease by ∼ 30% and then returns to full efficacy at the maximum feasible dose of ∼ 4 mg. The reduction of efficacy is associated to doses triggering a near-saturation of AYX1 metabolism by nucleases in the cerebrospinal fluid and a paradoxical reduction of AYX1 exposure during the period of early growth response protein 1 induction. This effect is overcome at higher doses that compensate for the effect of metabolism.
Discussion
AYX1 is a competitive antagonist of early growth response protein 1, which is consistent with the overall increased efficacy observed as dose-levels initially escalate. Chemically, AYX1 is unprotected against degradation by nucleases. The sensitivity to nucleases is reflected in a paradoxical reduction of efficacy in the dose-response curve.
Conclusions
These findings point to the importance of the nuclease environment of the cerebrospinal fluid to the research and development of AYX1 and other intrathecal nucleotide-based therapeutics.
Introduction
Pain following surgery remains a major public health issue with ∼80% of surgery patients suffering acute pain and ∼ 10% to 50% developing chronic pain.1–4 The transition to chronic pain reflects the long-term sensitization of the dorsal root ganglia (DRG) and spinal cord network triggered by surgical trauma. 5 Upon such trauma, the transcription factor early growth response protein 1 (EGR1) is transiently induced in the DRG and spinal cord and locally initiates genomic regulations that establish long-lasting neuronal sensitization.6–10
AYX1 is an unmodified double-stranded 23-bp deoxyoligonucleotide, or DNA-decoy, with a sequence that mimics the natural genomic DNA sequence bound by EGR1 and specifically inhibits its activity. 11 It is delivered via a single intrathecal (IT) bolus injection around the time of surgery to reduce acute pain and prevent its chronification. AYX1 efficacy in animal pain models has been described in a prior publication: briefly, a one-time administration provides up to ∼80% reduction of mechanical hypersensitivity over controls. 11 The preventive effect can lasts for over a month (i.e., the longest tested period in the rat spared nerve injury model of chronic pain, at which point pain was resolving in controls in our hands) and is observed across pain models of complementary etiologies (e.g., tissue incision, bone, or nerve injury). 11 AYX1 is under active clinical development (ADYX-004 trial, clinicaltrial.gov identifier NCT02081703).
We characterized the AYX1 dose-response profile in rats using the complementary spared nerve injury and plantar incision models of pain. To be effective, AYX1 must be present in the DRG-spinal cord network at sufficient levels to inhibit EGR1. Prior studies in the spinal cord have shown that EGR1 induction is detectable from 30 to 60 min up to at least ∼12 h following a noxious or sensitizing stimulus.12,13 The pharmacokinetic properties of single strand oligonucleotides are just beginning to be understood14–17 and to the best of our knowledge, no information is publicly available regarding IT injection of DNA-decoys as a class of molecules. We characterized AYX1 local pharmacokinetics (PK) and metabolism features driving AYX1 exposure in the lumbar cerebrospinal fluid (LCSF), DRG, and spinal cord during that timeframe. These combined data show that the AYX1 dose-response pattern is consistent with the PK and metabolism features of AYX1 as an oligonucleotide unprotected from nuclease-based metabolism.
Methods
Animals
Sprague Dawley rats (Harlan industry or Charles River Laboratories), ∼250 to 350 g were used. Experiments were carried out according to animal care protocols approved by the respective Institutional Animal Care and Use Committees of each testing site and were designed to minimize the amount of animals utilized.
The following number of rats were used: 35 rats for the ADY-SNI2 pharmacology study (one rat in the vehicle group and one rat in the 1.05 mg AYX1 group were excluded from the study due to autotomy and euthanasia following surgery), 42 rats for the ADY-INC5 pharmacology study (no exclusion), 75 rats for the in vivo PK and metabolism work (no exclusion), 4 rats for the spinal homogenate metabolism work (no exclusion), and 4 rats for the histology presented here (no exclusion).
IT administration
AYX1 (sense strand: 5′-GTATGCGTGGGCGGTGGGCGTAG-3′, antisense strand: 5′-CTACGCCCACCGCCCACGCATAC-3′) or vehicle were administered intrathecally under anesthesia as a percutaneous bolus at the L4/5 or L5/6 vertebral level at the time of surgery as previously described in literature. 11 IT injection volume was 20 µL in the ADY-SNI2 and ADY-INC5 studies. For the PK experiments, 1.1 mg of AYX1 clinical formulation (110 mg/mL) was injected in 10 µL, 2.2 mg in 20 µL, and 3.85 mg in 35 µL to follow an ascending dose-volume scheme similar to that of AYX1 clinical trials (clinicaltrial.gov identifier NCT02081703).
Behavioral testing
The spared nerve injury and plantar incision models were performed as described elsewhere. 11 Rats were habituated to cages with mesh wire floors for at least 1 h before testing. Calibrated von Frey hairs were applied with the following pseudo-random pattern: 6, 1, 10, 4, 26, 10, and 8 g. For each testing level, the von Frey hair was applied five times consecutively around the incision, and the number of paw withdrawals (0–5 per level, 0–35 total) was recorded as a response. The time interval between each testing level for a given rat was 3 min. For each study, each tested cohort of animals included controls. Testing was conducted by a single experimenter at each testing site in a blinded fashion: blinded test and control article vials were sent to the testing sites, and the codes were only revealed after the entire testing was completed.
Tissue sampling
For AYX1 concentration measurement, LCSF was collected percutaneously once at the L3/4 vertebral level in separate groups of rats at 30, 60, 120, 240, 360, and 720 min following IT administration. The collection was facilitated by pressing the neck and applying mechanical traction to the tail while holding the head of the animal and/or inclining the animal’s position to an approximate 45° angle as follow: rats were placed over a stainless steel bowl to curve the lumbar portion of the spinal cord/vertebra, anesthetized under 1% to 3% isoflurane using a nose mask, the animal head and forepaws both taped to the nose mask to secure the animal and allow the experimenter to gently apply traction to the tail during collection. A 30G needle was inserted directly into the IT space to allow the LCSF to rise naturally by differential pressure between the LCSF and the air outside the needle. The LCSF that rose in the needle hub was then collected using a sterile insulin syringe and needle. No impact of anesthesia was observed on LCSF collection; 30 to 50 µL of LCSF were collected per animal. Animals were then sacrificed, and DRG and spinal cord from the T12 to T13 vertebral level (corresponding to the L1–L2 spinal level) 18 to the sacral tip were collected, washed in 1X phosphate buffered saline (PBS), and frozen for subsequent AYX1 tissue uptake analysis (DRG were pooled for each animal).
AYX1 analytical assay
AYX1 was quantified by Capillary Gel Electrophoresis-Hybridization (CGEH). Samples were extracted using phenol-chloroform and alcohol precipitation and hybridized to a fluorescent-labeled probe specific to AYX1. The probe-analyte species were separated and detected using capillary electrophoresis with laser-induced fluorescence and back-calculated to a matrix standard curve. The assay allows detecting and quantifying N-1 to N-6 shortmer metabolites or shorter versions of AYX1 produced by nuclease-based nucleotide removal. Values reported as “total AYX1” include full length plus shortmer metabolites.
Spinal cord homogenate incubation
Rats were anesthetized, exsanguinated with ice cold 1X PBS, spinal cords harvested, washed in ice cold 1X PBS, weighed, cut in pieces, pooled into 500 µL of ice-cold nuclease buffer (100 mM tris-HCL and 1 mM magnesium acetate, pH 8), and homogenized with a dounce homogenizer. AYX1-homogenate mixes were incubated at 37℃. Reactions were stopped with proteinase K (100 µg/mL). For the EXOIII nuclease experiment, incubations were made using the reaction buffer provided with the enzyme (Promega, WI, catalogue # M1811) and stopped with 20 mM ethylene diamine tetraacetic acid.
Histology
AYX1 was conjugated on the sense strand to an ALEXA488 tag (5′ ALEXA Fluor 488, NHS Ester, IDTDNA, IL) and was injected IT as described above. Thirty minutes following the injection, spinal cord and DRG were collected in a dark room, washed in saline, cryoprotected in sucrose, fixed in 4% paraformaldehyde at 4℃, embedded, frozen on dry ice, and mounted for cryostat sectioning. Tissue sections of 12 µm were made and observed under fluorescent microscope.
PK analysis
AYX1 and shortmers were analyzed by non-compartment methods (no modeling); AUC was estimated by the trapezoid method; terminal slope and T1/2 were estimated by log-linear regression of 3+ points in the terminal phase; and T1/2 were not reported if the coefficient of regression R2 for the slope estimation was <0.8.
Statistical analysis
A non-parametric Student T-test, followed by a T-Welsh analysis for uneven variance correction, was used to analyze individual conditions and whole data distribution between experimental conditions (Excel 14.4.1). Dose-dependent relationships were analyzed using analysis of variance (GraphPad Prism 7.0a Software, La Jolla California USA, www.graphpad.com). Data are presented throughout the article as Mean followed by either a standard error (SE) or a standard error to the mean.
Results
AYX1 dose-response profile
Dose-response across AYX1 pharmacology studies.

Note: veh: vehicle; Uni: University; AZ: Arizona; IA: Iowa; KY: Kentucky.
Individual dose-efficacy levels for each pharmacology study of the AYX1 dose-response meta-analysis. Efficacy normalized on vehicle and on maximum efficacy within a given study: 0 = no difference from vehicle, 1 = 100% suppression of mechanical hypersensitivity compared to vehicle; ANOVA was used to assess the strength of the dose-response in each study including the vehicle groups.
The studies were performed at several US laboratories and covered doses from ∼0.5 mg up to the maximum feasible dose of ∼ 4 mg based on AYX1 solubility limit and volume of IT injection. The AYX1 efficacy profile was similar across studies: efficacy appeared within 24 h of injury and administration and lasted, at maximal efficacy, until hypersensitivity was resolving in control animals regardless of whether pain was due to last a few days or several weeks (see literature,
11
Figure 1(a) and (b) and Table 1). Across dose-levels, an increase of efficacy was expressed as an increase in magnitude of pain suppression compared to controls and as an increase in the duration of that effect, i.e., the effect of sub-optimal doses did not last until pain resolved in controls (see literature,
11
Figure 1(a) and (b)).
(a) Effect of ascending AYX1 dose-levels on the development of pain measured as mechanical hypersensitivity in the spared nerve injury model of chronic neuropathic pain in the ADY-SNI2 study. Total responses (number of paw withdrawals) to repetitive von Frey stimulation in animals treated with vehicle (black circles), 0.7 mg (black squares), 1.05 mg (white squares), 1.4 mg (white circles), or 2.8 mg (white lozenges) AYX1 are presented; T-test, different from vehicle at a given time-point: *p < 0.05, data distribution over the testing period: p < 0.001 for all tested doses. Vehicle or AYX1 were administered once IT at the time of surgery, n = 4 to 5 per group; values are presented as mean + SEM. (b) Effect of ascending AYX1 dose-levels on the development of pain measured as mechanical hypersensitivity in the plantar incisional model of acute pain in the ADY-INC5 study. The effect of AYX1 0.56, 0.84, 1.12, 1.40, 2.80, and 4.20 mg was tested against vehicle. For clarity in light of the amount of tested groups, the vehicle (black circles), 1.12 (black triangles), 2.8 (white circles), and 4.2 mg (white squares) of AYX1 groups are displayed as representative responses observed during the study. The magnitude of effects of all tested doses is presented in Table 1. T-test followed by a T-Welsh analysis: *p = 0.07, **p = 0.02, data distribution over the testing period, vehicle versus 4.2 mg: p = 0.02; values are presented as mean + SEM. Vehicle or AYX1 were administered once IT at the time of surgery, n = 6 per group. (c) and (d) Dose-response patterns observed in the ADY-SNI2 and ADY-INC5 studies, respectively. The magnitude of effect for each dose-level normalized on the maximum efficacy measured within each study is presented (black triangles). Connecting curves are presented as dotted lines. Data are fitted with an exponential association fit (dashed line), excluding the outlier dose (circled). For the ADY-SNI2 study, excluding the outlier dose shifts the coefficient of regression R2 of the exponential fit from 0.75 to 0.97 and from 0.44 to 0.85 in the ADY-INC5 study.
To build up AYX1 dose-response in given study, the efficacy of each tested dose-level was measured as a percentage of reduction of area-under-the curve of total von Frey responses compared to controls from the time of IT injection and injury until the last day of testing. The meta-analysis dose-responses across studies and pain models were justified by the similarity of the AYX1 efficacy profile observed across those studies and pain models. To allow for a sensitive analysis, data were normalized for each study on the maximum efficacy measured for that study. Both normalized and non-normalized efficacy values for each tested dose and study are presented in Table 1. Examining individual studies, the magnitude of AYX1 efficacy rapidly increases with dose until maximum efficacy is reached, suggesting an exponential association relationship followed by a plateau of efficacy (Figure 1(b) and (c)). Interestingly, in four out of the seven studies (ADY-SNI2, -SNI4, -INC5, -DOD1), one dose-level produced a lower efficacy than predicted, an outlier in the overall dose-response pattern and exponential fit (Figure 1(b) and (c) and Table 1). The occurrence of this observation across more than half of the studies in complementary pain models and separate testing laboratories supports a real feature over the likelihood of a random effect. This feature is not only observed in individual studies but also conserved in the meta-analysis of the combined seven studies which delineates the following pattern: efficacy rapidly increases from a minimum efficacy dose of ∼0.5 mg, levels around 1 mg and as the dose is further increased, efficacy reduces by ∼30% in average, and full efficacy can be recovered for higher doses up to the maximum feasible dose of ∼4 mg (Figure 2). The general shape of the AYX1 dose-pattern is consistent with its mechanism of action as a competitive antagonist of EGR1 activity, with the exception of the limited range of efficacy reduction. To understand this pattern of dose-response, we characterized AYX1 metabolism and PK in the lumbar DRG, spinal cord, and CSF.
(a) Meta-analysis of AYX1 dose-response profile including results from the ADY-SNI2, INC5, SN1,2-4 (Mamet et al., 2014), -INC25 (Mamet et al., 2014), and -DOD1 (Mamet et al., 2014) studies testing AYX1 efficacy in either the spared nerve injury of neuropathic pain or in the incisional model of post-surgical pain. Data are normalized internally for each study against the maximum observed efficacy relative to vehicle-treated animals and presented as mean ± SEM. The connecting curve is presented with a dotted line, and data fitted with a polynomial equation of the fourth order are presented as a dashed line. A systematic series of potential dose-response fits were tested. The highest coefficients of regression were R2 ∼ 0.35 for the polynomial fit above and equivalent or lower for various association equations, including one-phase exponential or hyperbolic fits. In absence of a robust coefficient of regression and considering that the polynomial curve fits the meta-analysis and the results of the majority of individual studies, it was selected as the closest representation of AYX1 dose-response over a hyperbolic or exponential plateauing curve. (b) Concentration of AYX1 shortmers in the LCSF 30 min following injection of 1.1, 2.2, or 3.85 mg of AYX1; n = 5 per dose-level; results are presented as mean ± SEM for each dose-level. Data are fitted with a sigmoidal function (dotted line).
AYX1 metabolism in spinal cord homogenates
LCSF, DRG, and spinal pharmacokinetic parameters of AYX1 and shortmers metabolites.

Note: SE: standard error; NR: not reported; LCSF: lumbar cerebrospinal fluid; DRG: dorsal root ganglia.
Comparison of LCSF, DRG, and spinal cord pharmacokinetic parameters following a single IT administration of ascending dose-levels of AYX1. Individual AYX1 and shortmer values are presented in Tables 3 and 4, respectively. When appropriate, the µg/mL units in the LCSF listed in the Cmax, AUC, Mean, SE, and/or Median columns correspond to µg/mg of tissue units for the DRG and spinal cord tissues; N = 4 to 5 rat per dose, time-point, and tissue.

(a) Rate of AYX1 metabolism as a function of AYX1 concentration in fresh spinal cord homogenates. The rate of AYX1 metabolism is presented as the amount of full-length AYX1 degraded per minute as a function of AYX1 concentration introduced in the homogenates. Data are presented for each measured time-point: 5 (circle), 30 (square), and 60 (triangle) min. Linear regression for each data set are presented; coefficient of linear regression R2 is ∼0.99 for 5, 30, and 60 min; data are presented as mean + SEM. (b) Metabolic patterns of full-length AYX1 and individual N-1 to N-6 metabolites measured with the CGHE assay. For each analyzed sample, the relative amount of AYX1 or individual metabolite species was normalized on the species found in largest amount. Each curve represents the metabolite pattern observed for a dose-level, compartment, and time, and the corresponding concentration of total AYX1 is listed in the legend. The amounts of N-4 to N-6 metabolites were pooled together due to the frequent fusion of their corresponding peaks in the CGHE assay. Values are presented as mean + SEM, n = 2 to 4 per condition, FL = full-length AYX1, N-x = metabolite species. (c) Illustration of electropherograms from the CGEH analytical method from the LCSF at 60 and 240 min following injection. Right arrows show full-length AYX1 and the left arrows the extremity of the analyzable area. Peaks in between the two arrows represent AYX1 shortmers from N-1 to N-6.
AYX1 lumbar exposure and in vivo metabolism
EGR1 induction is detectable within ∼30 to 60 min following a noxious stimulation.12,13 The histologic visualization of a fluorescent conjugate of AYX1 in the lumbar spinal cord and DRG 30 min following an IT injection shows that AYX1 is already present in cell nuclei (Figure 4), where it can compete with the newly induced EGR1. EGR1 induction is known to continue for at least 720 min following the initial stimulation, as illustrated in the spinal cord.12,13 AYX1 exposure and metabolism in the LCSF, DRG, and spinal cord was studied during the overall period of EGR1 induction using doses across the broad range of AYX1 efficacious dose-levels: 1.1, 2.2, and 3.85 mg. LCSF, DRG, and spinal cord were collected at 30, 60, 120, 240, 360, and 720 min post-injection. The presence of full-length, intact AYX1 and N-1 to N-6 shortmer metabolites was measured using a CGEH method. The resulting PK parameters are shown in Table 2, and the corresponding individual data-points are shown in Tables 3 and 4.
AYX1 presence in lumbar DRG (a) and spinal cord (b) cells was observed 30 min following an IT injection of 1.7 mg of AYX1 conjugated to an ALEX488 tag (green). Tissue auto-fluorescence was controlled using non-injected rats (c). Areas identified in the top panels with white rectangles are magnified in the bottom panels. One example of AYX1-positive cell nuclei is pointed out for the DRG and spinal cord with a vertical arrow. A few cells show AYX1 present in the cytoplasm, and one example is pointed out in both tissues by a horizontal arrow. This observation is consistent with independent experiments showing the presence of decoys in the nucleus and/or cytoplasm of cells following various administration methods47–49; Top panel scale bar = 100 µm, bottom panel scale bar = 25 µm, and n = 2 rats per condition. LCSF, DRG, and spinal AYX1 concentrations for each AYX1 dose-level and at each measured time-point. Note: LCSF: lumbar cerebrospinal fluid; DRG: dorsal root ganglia. Individual AYX1 concentration values over time following a single IT administration of ascending dose-levels of AYX1. When appropriate, the µg/mL units in the LCSF section correspond to µg/mg of tissue units for the DRG and spinal cord tissues sections. LCSF, DRG, and spinal shortmers concentrations for each AYX1 dose-level and at each measured time-point of AYX1. Note: LCSF: lumbar cerebrospinal fluid; DRG: dorsal root ganglia. Individual AYX1 shortmer metabolites concentration values over time following a single IT administration of ascending dose-levels of AYX1. When appropriate, the µg/mL units in the LCSF section correspond to µg/mg of tissue units for the DRG and spinal cord tissues sections.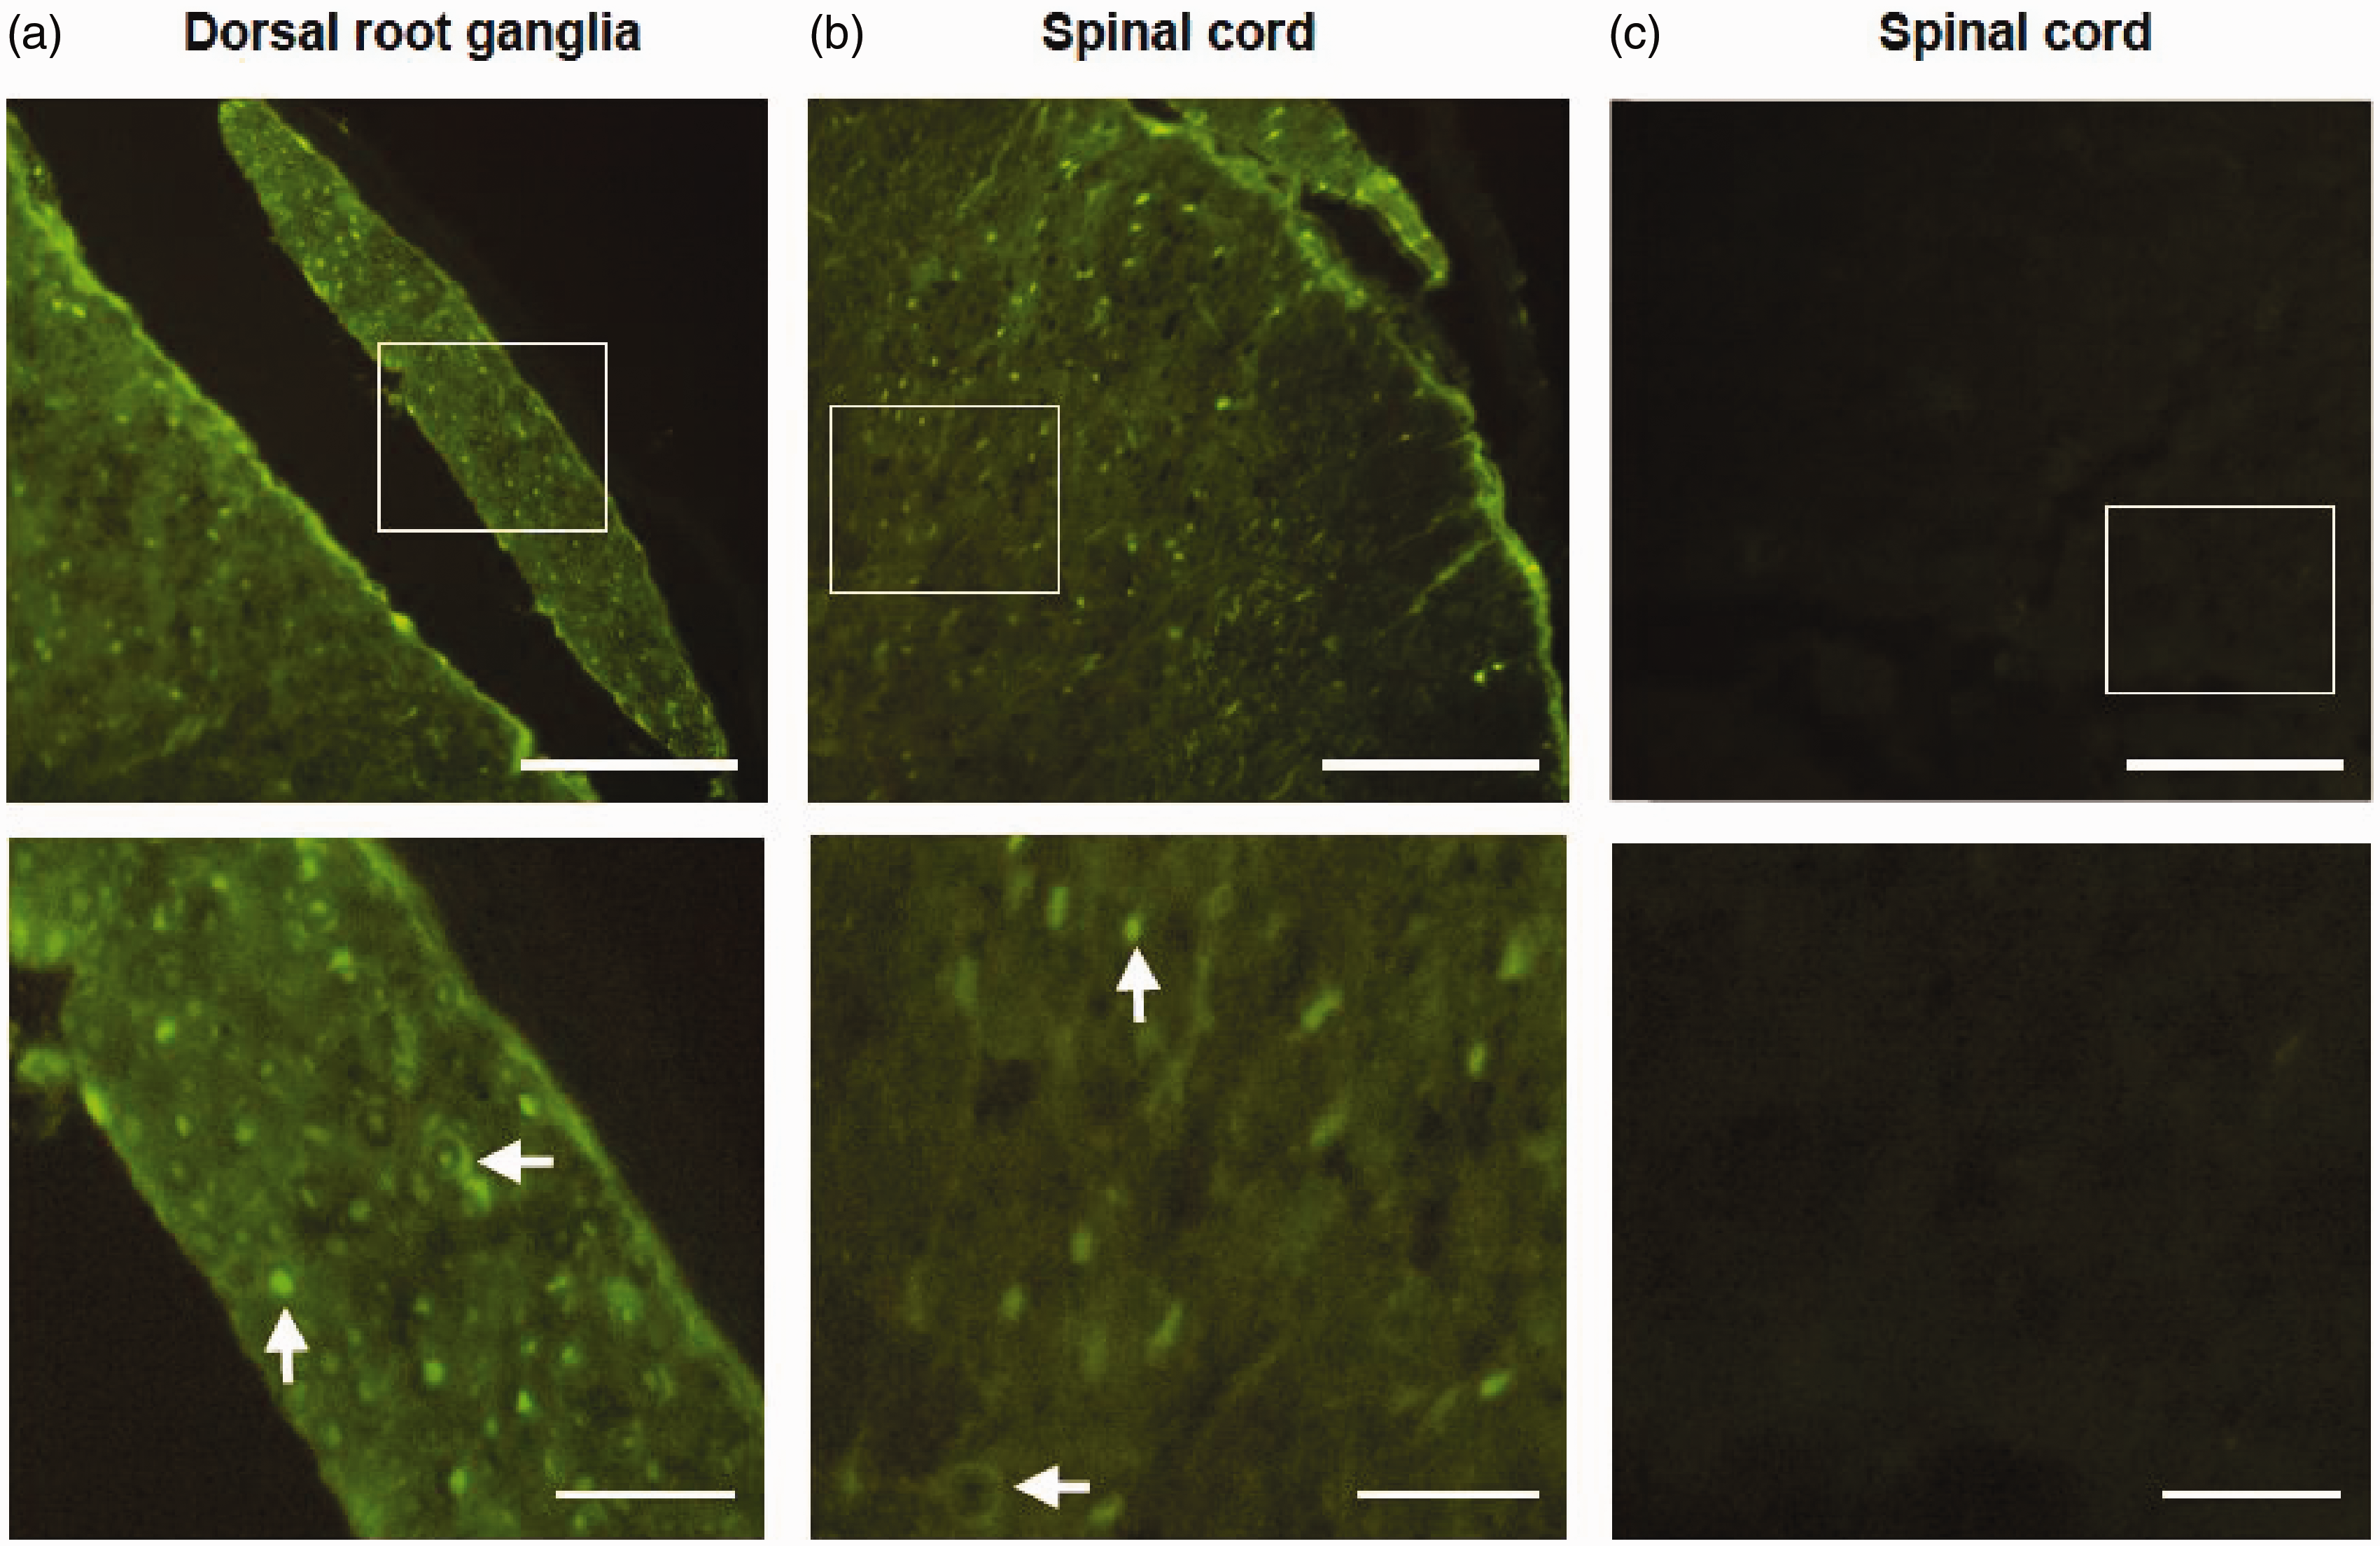


The maximal concentrations of AYX1 in the LCSF increased with doses and were observed at 30 min, the first tested time-point and initial AYX1 concentrations dropped by approximately 50-fold 120 min following injection. This timeframe of rapid decrease corresponds to a period of elevated AYX1 metabolism. This is illustrated by the similar and maximal concentrations of AYX1 shortmer metabolites measured at 30 min for the mid and high AYX1 doses: ∼4393 and ∼3829 µg/mL of shortmers in presence of 6468 and 9328 µg/mL of intact AYX1, respectively (Table 4 and Figure 2(b)). Maximal levels of shortmers further remained at 60 min for the high dose: ∼4688 µg/mL in presence of ∼2678 µg/mL of intact AYX1, Table 4. Subsequently, shortmer concentrations diminished and leveled off while AYX1 concentrations continued to drop in the low ng/mL range or below detection limit. This is illustrated by the estimated T1/2, values which were longer overall for the shortmers versus AYX1 (Table 2).
The AYX1 exposure pattern in the DRG and spinal cord was similar to that observed in the LCSF, with concentrations largely dropping over the 120 min following injection. However, initial AYX1 concentrations in the DRG and spinal cord after injection were approximately three to four orders of magnitude lower than the LCSF concentrations, and AYX1 was still present at ∼1 to 30 ng/mg of tissue after 720 min (Table 3).
The total exposure of AYX1 increased with doses when calculated from the first measured time-point of 30 min until the last time-point of 720 min. However, the exposure at the mid dose was approximately half that of the low dose exposure in the LCSF, DRG, and spinal cord during the 60 min to 720 min timeframe (Table 2). This observation correlates to the fact that the mid dose of AYX1 engages a near-saturating rate of metabolism in the LCSF during the first 30 to 60 min period, as measured by shortmer concentrations, while the low dose only produced a low metabolism rate (Figure 2(b) and Tables 3 and 4).
Specificity of AYX1 metabolite patterns
The comparison of oligonucleotide shortmer metabolite patterns, defined as N-minus metabolite species and their relative amounts, provides important clues as to the nuclease environments. 20 The quantification of N-1 to N-6 AYX1 metabolites in the lumbar DRG, spinal cord, and CSF at 60 and 240 min highlights specific patterns across overlapping concentrations of intact AYX1 plus shortmer metabolites, or total AYX1. DRG and spinal cord patterns were similar at each measured level of total AYX1 concentrations while LCSF patterns varied from those with concentrations. DRG and LCSF patterns are illustrated Figure 3(b) and (c). A high relative presence of AYX1 with decreasing amounts of individual metabolites of shorter length is observed in the LCSF at 60 min with elevated concentrations of total AYX1. At the same time-point in the DRG and spinal cord, a low relative presence of AYX1 with increasing amounts of shorter length metabolites is observed for concentrations of total AYX1 that are approximately two orders of magnitude lower. At 240 min, total AYX1 concentrations are still two orders of magnitude higher in the LCSF compared to local tissues, but the same pattern of metabolites is now observed: a low relative presence of AYX1 with elevated N-2 and N-3 metabolites.
Discussion
AYX1 dose-response profile
AYX1 is a DNA-decoy administered once by the IT route to prevent pain and its chronification following surgery or trauma. Its pharmacology for reducing mechanical hypersensitivity was characterized in multiple studies in the incisional (three studies) and spared nerve injury (four studies) models of acute and chronic pain. Across those studies, the average maximum effect of AYX1 measured as a reduction of area-under-the-curve during the entire study period compared to controls was ∼65% ± 7.9% (SE), with a minimum efficacy of ∼32%, and a maximum efficacy of ∼80% (Table 1). The associated dose-response pattern initially shows a rapid increase of efficacy from the minimally efficacious dose up to a maximum efficacy with only a two-fold dose increase. As doses further increase toward the maximum feasible dose, a reduction of efficacy followed by a recovery phase are observed in the majority of the individual studies (Table 1) as well as in their meta-analyses. The average peak dose found to reduce efficacy across studies was 1.52 mg ± 0.44 mg (SE). Concurrently, the polynomial fit of the dose-response meta-analysis places that peak dose on the high end of that range at ∼2 mg. Note that in one study (ADY-SNI4), a reduction of efficacy was also observed at the maximum feasible dose, based on AYX1 solubility limit and volume of IT injection. This result could be explained by AYX1 increased viscosity at this concentration (i.e., 40 times higher than water), which could lead to a variable distribution in the LCSF across animals and studies. Of note, AYX1 dose-response and its landmark features occur over a narrow range of doses. This is similar to antisense oligonucleotides, with dose-response curves that often span within a only 10-fold factor. 24
AYX1 exposure in the LCSF, DRG, and spinal cord
To be effective, AYX1 must inhibit EGR1 activity in the DRG and/or spinal cord during EGR1 induction, 11 from ∼30 to 60 min up to ∼12 h after a noxious stimulation.12,13 An increase of local AYX1 exposure during that timeframe is anticipated to increase efficacy up to an exposure level that exceeds what is required for a complete inhibition of EGR1, which seems to occur for doses ∼1 mg. The exposure of ∼2 mg AYX1 is two fold lower in the LCSF and four times lower in the DRG and spinal cord than that of ∼1 mg dose during that same period. This likely results in a lower opposition to EGR1 action and could explain the paradoxical reduction of efficacy observed in the dose-response curve.
The paradoxical reduction in exposure appears to be driven by the level of nuclease activity engaged in the LCSF during the first 30 to 60 min following injection: the ∼2 mg dose was sufficient to trigger a rapid, near-saturation of AYX1 metabolism while the ∼1 mg dose only triggered a slow, basal metabolism. Consequently, AYX1 concentration from the ∼2 mg dose (∼720 µg/mL) was lower in the LCSF at 60 min compared to the ∼1 mg dose (∼1400 µg/mL). At that time-point, the concentrations of shortmers were ∼100 µg/mL for both doses, suggesting that both doses were now associated with a similar and basal metabolism rate that maintained their relative exposures onward. By direct diffusion from the LCSF to the local tissues, the relative positioning of exposure of the two doses appeared directly transferred to the DRG and spinal cord where AYX1 exerts its pharmacological activity. For the higher ∼4 mg dose, which also triggers a saturating metabolism during the initial period following dosing, the “excess” of AYX1 over the 2 mg dose appeared to offset an abrupt impact of the metabolism and its exposure remained above that of the ∼1 mg dose after 60 min.
Those combined data suggest that the reduction in efficacy in the AYX1 dose-response pattern occurs for the range of doses triggering near-saturation of metabolism in the LCSF upon injection: ∼1.5 to ∼2 mg AYX1.
Cerebrospinal fluid (CSF) nuclease environment
The CSF nuclease environment influences the AYX1 dose-response profile. Our data suggest that it is a multi-nuclease system with an elevated Km, hence with a low affinity of CSF nucleases for AYX1, and is rapidly saturable. Indeed, the detection of several AYX1 metabolic patterns suggests that an increasing range of nucleases metabolizes AYX1 as a function of concentration. Also, the presence of the same pattern of metabolites in the CSF and tissues at 240 min while total AYX1 concentrations are ∼2 order of magnitude higher suggests similar nucleases metabolize AYX1 but that in the CSF, their affinity for AYX1 is lower. This may reflect the significant influence of the composition of different environments (e.g., pH, metal ions, and salts) on nuclease Km.25–27
Prior studies applying oligonucleotides to the CSF reported an absence or a low nuclease activity in the CSF while the analysis of the CSF proteome confirms the presence of several nucleases.28–30 The data from this work provide a possible link between those apparently contradictory observations: the CSF contains active nucleases but their activity was not readily detected in prior studies likely due the low oligonucleotide concentrations used (e.g., ∼0.1 mg/mL of CSF) compared to AYX1 (i.e., ∼3–4 mg/mL).28,30 Lastly, the fact that the metabolism remains saturated at 60 min for the high dose in presence of concentrations of full-length AYX1 lower than metabolite concentrations suggests an hysteresis of the nucleases in the CSF, a phenomenon in enzymology referring to enzymes which kinetics responds slowly to rapid changes of substrate concentrations. 31
AYX1 tissue concentrations
During most of the EGR1 induction period, AYX1 concentrations in the DRG and spinal cord after injection of efficacious doses were in the low ng/mg of tissue range. To understand the meaning of such concentrations, one can estimate the number of AYX1 molecules per DRG cell relative to the estimated number of EGR1 molecules and EGR1 binding sites in the genome for an AYX1 concentration ∼10 ng/mg. Based on an average measured DRG weight of ∼1.79 mg (i.e., weight of a DRG used in the PK work described above), ∼10 ng AYX1/mg of DRG corresponds to ∼4.6 million AYX1 molecules per cell (assuming ∼15,000 neurons 32 and ∼10 satellite cells per neuron per DRG and a negligible extracellular space). The number of copies of a transcription factor varies per cell from ∼5000 to ∼4,000,00033 and there are ∼1000 to 1500 EGR1 binding sites per genome. 34 Thus, AYX1 concentrations in the ng/mg range represent biologically active concentrations as the corresponding, estimated amount of AYX1 molecules per cell within that range can be in excess of the number of genomic EGR1 binding sites and potential EGR1 molecules.
AYX1, EGR1, and neurons
EGR1 can be expressed in a variety of cells including neurons, glial, or immune cells to carry out complementary functions. In a nociceptive context, EGR1 induction in the DRG and spinal cord appears specific to neurons rather than glial cells as observed after peripheral nerve injury, inflammation, thermal or mechanical noxious stimuli, and electrically induced-long term potentiation.12,13,35–37 This expression pattern directly correlates to EGR1 core function of inducer of long-term neuronal sensitization.12,38 While macrophages and other immune cells penetrate the spinal cord and DRG to modulate pain signals in neuropathic pain situations, this happens significantly after one or more days post-injury,39–42 which is past the time of residence of AYX1 in the LCSF and local neuronal tissues. Altogether, EGR1 expression profile and AYX1 PK support AYX1 focused action within EGR1-expressing neurons in the DRG and spinal cord rather than an action in other cell types that can also express EGR1. The microscopic visualization of an AYX1-fluorescent conjugate in cells nuclei 30 min following an IT administration shows that AYX1 penetrates cells rapidly. While the type of cells taking up AYX1 cannot be determined from this experiment, it is assumed that AYX1 enters neurons but an entry in non-neural cells cannot be excluded. This latter possibility is illustrated with the finding that antisense oligonucleotides can penetrate both neurons and glia in the spinal cord. 43 In terms of uptake mechanism, AYX1 likely enters these cells via endocytic pathways, which are common as well as saturable mechanisms of entry for oligonucleotides.44,45
Conclusion
AYX1 is a DNA-decoy drug candidate that inhibits the transcription factor EGR1 in the DRG-spinal cord network at the time of injury to reduce acute pain and its chronification. We show that AYX1 efficacy increases overall with dose. For doses that trigger a near-saturation of metabolism in the LCSF, however, local exposure at AYX1 site of action can be reduced and associated to a lowering of efficacy. Additional mechanisms related to the excess of metabolites associated with near-saturating metabolism could also be at play. Since oligonucleotide transport into cells is saturable and can be inhibited by high oligonucleotide concentrations,45,46 it is possible that the excess of rapidly produced AYX1 metabolites associated with the mid range doses competitively inhibit cellular uptake while the level of full-length AYX1 is already low, further supporting a reduction of efficacy. This hypothesis would require experimental confirmation. Altogether, these data show that AYX1 pharmacology is directly tied to its mechanism of action (inhibiting EGR1 over a period of time following trauma), route of administration (local exposure in the LCSF, DRG, and spinal cord), and its chemistry (an unmodified oligonucleotide sensitive to nuclease degradation).
Footnotes
Acknowledgment
The authors thank Giuseppina Iacono at Charles River Montreal for performing the AYX1 pharmacokinetic experiment, Dr. Jim Timmins at Helix Diagnostics for the CGEH analysis of the LCSF, DRG, and spinal cord samples, and Dr. Jerry Moore at Pacific Biodevelopment for the AYX1 PK analysis. Finally, the authors are grateful to Dr. William K. Schmidt for his overall guidance and to Dr. Eric Marcusson for his input to the article.
Author Contributions
Julien Mamet, Donald Manning, and Scott Harris designed and monitored this work. Michael Klukinov, David Yeomans, Renee Donahue, and Brad Taylor performed pharmacology experiments. Michael Klukinov also performed the spinal cord homogenate experiments. Tony Yaksh and Kelly Eddinger guided pharmacology study designs. All authors read and approved the final manuscript.
Declaration of Conflicting Interests
The author(s) declared the following potential conflicts of interest with respect to the research, authorship, and/or publication of this article: Julien Mamet, Donald Manning, and Scott Harris are employees and stockholder of Adynxx, Inc. David Yeomans, Brad Taylor, and Tony Yaksh are consultants and/or stockholders of Adynxx.
Funding
The author(s) disclosed receipt of the following financial support for the research, authorship, and/or publication of this article: This work was funded by Adynxx, Inc.