
Abstract
Background
Chronic pain in masticatory muscles is a major medical problem. Although mechanisms underlying persistent pain in masticatory muscles are not fully understood, sensitization of nociceptive primary afferents following muscle inflammation or injury contributes to muscle hyperalgesia. It is well known that craniofacial muscle injury or inflammation induces regulation of multiple genes in trigeminal ganglia, which is associated with muscle hyperalgesia. However, overall transcriptional profiles within trigeminal ganglia following masseter inflammation have not yet been determined. In the present study, we performed RNA sequencing assay in rat trigeminal ganglia to identify transcriptome profiles of genes relevant to hyperalgesia following inflammation of the rat masseter muscle.
Results
Masseter inflammation differentially regulated >3500 genes in trigeminal ganglia. Predominant biological pathways were predicted to be related with activation of resident non-neuronal cells within trigeminal ganglia or recruitment of immune cells. To focus our analysis on the genes more relevant to nociceptors, we selected genes implicated in pain mechanisms, genes enriched in small- to medium-sized sensory neurons, and genes enriched in TRPV1-lineage nociceptors. Among the 2320 candidate genes, 622 genes showed differential expression following masseter inflammation. When the analysis was limited to these candidate genes, pathways related with G protein-coupled signaling and synaptic plasticity were predicted to be enriched. Inspection of individual gene expression changes confirmed the transcriptional changes of multiple nociceptor genes associated with masseter hyperalgesia (e.g., Trpv1, Trpa1, P2rx3, Tac1, and Bdnf) and also suggested a number of novel probable contributors (e.g., Piezo2, Tmem100, and Hdac9).
Conclusion
These findings should further advance our understanding of peripheral mechanisms involved in persistent craniofacial muscle pain conditions and provide a rational basis for identifying novel genes or sets of genes that can be potentially targeted for treating such conditions.
Introduction
Pain in the masticatory muscles is one of the major symptoms of temporomandibular joint disorders (TMD). Craniofacial muscle pain also develops as a result of submasseteric infection. 1 While our knowledge on acute or persistent craniofacial muscle pain has considerably improved, pathophysiological mechanisms that can be targeted for the development of novel mechanism-based treatment are being continuously investigated both in clinical and preclinical studies. Experimental induction of inflammation or injury in the masseter muscle has been used predominantly in preclinical studies as a surrogate model to study neurobiological mechanisms of craniofacial muscle pain.2–4
Peripheral sensitization of muscle nociceptors has been implicated as one of the major sources of muscle hyperalgesia. 5 In previous studies, we and others identified several nociceptive molecules such as NMDA receptor, metabotropic glutamate receptor 5, TRPV1, TRPA1, and P2X3 that are involved in inflammation-induced masseter hyperalgesia.6–12 Masseter inflammation also upregulates the expression levels of several inflammatory cytokines and neuropeptides within trigeminal ganglia (TG).2,13,14 We have also shown that anti-nociceptive molecules such as µ-opioid receptor and cannabinoid receptor type 1 in TG neurons undergo transcriptional changes following masseter inflammation, and their expression levels are highly correlated with anti-nociceptive efficacy.15,16 These studies suggest that masseter inflammation leads to changes in multitude of genes within TG and that these composite genetic changes may account for the behavioral phenotypes.
Recent advances in bioinformatics and sequencing analysis allows genome-wide analysis of transcriptome. RNA sequencing (RNA-seq) assays have been used not only to determine detailed profiles of sensory ganglia transcriptome under physiological conditions but also to investigate changes following tissue injury or neuropathy.17–20 These studies suggest insult-specific changes in transcriptome profiles, which may be associated with unique nociceptor plasticity. However, overall transcriptional profiles within TG following masseter inflammation have not yet been determined. In the present study, we performed RNA-seq assay in TG to identify transcriptome profiles of genes relevant to hyperalgesia following inflammation of the rat masseter muscle. The goals of the present study are to determine overall profiles of multiple genes differentially regulated following masseter inflammation, to provide mechanistic insight into the genetic basis of masseter inflammation-induced hyperalgesia, and to suggest novel sets of probable targets for future studies. This knowledge should further advance our understanding of peripheral mechanisms involved in persistent craniofacial muscle pain and provide a rational basis for identifying novel genes or sets of genes that can be potentially targeted for treatment.
Methods
Experimental animals
Adult male Sprague–Dawley rats (250–350 g; Harlan, Indianapolis, IN) were used (four rats per group). All animals were housed in a temperature-controlled room under a 12:12 light–dark cycle with access to food and water ad libitum. All animal experimental studies and procedures were conducted in accordance with the NIH Guide for the Care and Use of Laboratory Animals (Publication No. 80-23) and under a University of Maryland approved Institutional Animal Care and Use Committee protocol.
Masseter inflammation
Inflammation was induced by injecting 50 µl of 50% Complete Freund’s adjuvant (CFA) in isotonic saline (Sigma–Aldrich, St. Louis, MO) into the mid-region of the masseter muscle via a 27-gauge needle. Rats were briefly anesthetized with 3% isoflurane for the injection procedure. Such intramuscular CFA treatment induces robust mechanical allodynia and spontaneous pain in rats. 7
Behavioral studies
Mechanical hypersensitivity in the masseter muscle was assessed under CFA-induced inflammatory condition as described previously. 7 A series of calibrated Von Frey filaments (1–125 g) were applied to the region over the masseter muscle. An active withdrawal of the head from the filament application was defined as a positive response. Each VF filament was applied five times and the response frequencies ((number of responses/number of stimuli) ×100%) to a range of filament forces were determined. After a non-linear regression analysis, an EF50 value, the filament force (g) necessary to produce a 50% response frequency, was determined. Mechanical sensitivity of the masseter muscle was determined before and three days after the CFA injection in the masseter muscle. The effect of a TRPV1 antagonist, AMG9810 (Sigma-Aldrich, St. Louis, MO), on mechanical sensitivity was examined on three days following CFA injection. On test day, AMG9810 (1 µmol in 50 µl) or the same volume of vehicle was administered directly in the masseter muscle under anesthesia using isoflurane. The post AMG9810 or vehicle effect was measured 30 min, 1 h, and 24 h after the drug injection.
RNA isolation
After three days following the injection, TG in the ipsilateral side were harvested from CFA- or saline-injected rats. We chose day 3 since the peak response was maintained up to three days and based on the assumption that transcriptional changes leading to persistent pain might begin to occur in the first three days. RNA extraction and real-time PCR was performed and analyzed as described previously. 7 Total RNAs were extracted by using Trizol (Invitrogen, Carlsbad, CA) and purified according to the RNeasy kit (Qiagen, Germantown, MD) that included a DNase treatment for removing genomic DNA. RNA integrity was evaluated by BioAnalyzer analysis. Samples with RNA integrity number greater than 8.0 were used for preparing library.
Real-time PCR assay
Real-time PCR assay was performed as described previously. 7 The following primer pairs were used to detect TRPV1, forward 5’-GGTGTGCCTGCACCTAGC-3’, reverse 5’-CTCTTGGGGTGGGGACTC-3’; Piezo2, forward 5’-GGCAAGGTGGTGGTGACCAT-3’, reverse 5’-GTCCAATCAGGTGCCCAGCA-3’; and GAPDH, forward 5’-TCACCACCATGGAGAAGGCG-3’, reverse 5’-GCTAAGCAGTTGGTGGTGCA-3’. We obtained the ratios between the genes of interest and GAPDH to calculate the relative abundance of mRNA levels in each sample. Relative quantification of the mRNA was calculated by the comparative CT method (2−ΔΔ CT method).
Library construction and RNA sequencing
Illumina RNAseq libraries were prepared with the TruSeq RNA Sample Prep kit (Illumina, San Diego, CA) per manufacturer’s protocol. Ribosomal RNA in total RNA samples was removed before library construction using the Ribo-Zero rRNA Removal Kits (Epicentre Technologies, Madison, WI). Adapters containing seven nucleotide indexes were ligated to the double-stranded cDNA. The DNA was purified between enzymatic reactions and the size selection of the library was performed with AMPure XT beads (Beckman Coulter Genomics, Danvers, MA). Libraries were assessed for concentration and fragment size using the DNA High Sensitivity Assay on the LabChip GX (Perkin Elmer, Waltham, MA). The library concentrations were also assessed by qPCR using the KAPA Library Quantification Kit (Complete, Universal) (Kapa Biosystems, Woburn, MA). The libraries were pooled and sequenced on a 100 base pairs paired-end Illumina HiSeq 2500 run (Illumina, San Diego, CA). The sequenced reads were aligned to the reference sequence (Ensembl version Rnor_5.0.77) using TopHat version 1.4.1 (Trapnell et al., 2009). 21 The alignments allowed up to 2 bp mismatches per 25 bp segment, and we removed reads that aligned to more than 20 different genomic regions. Transcript abundances and splice variant identification was done using Cufflinks version 1.3 using the BAM alignment files obtained from TopHat. 22 BigWig coverage files were generated from the BAM alignment files using the UCSC genome browser tools.
Data analysis
The quantitative expression values were calculated for each sample based on the number of fragments per kilobase of exon per million fragments mapped. Differential gene expression was compared between saline- and CFA-injected groups (four animals/group) using DESeq. 23
Statistical analysis
To cluster the samples based upon the similarity of their patterns of gene expression, we performed principal component analysis using R version 3.2.3. For differential gene expression analysis, the p values were generated in DESeq and adjusted using the Benjamin-Hochberg method to control for false discovery. The difference was considered to be significant when q value, which is a p value with corrected false discovery ratio, is lower than 0.05. For real-time PCR assay, the data between saline and CFA three-day groups were analyzed with Student’s t-test. Data were presented as mean ± SEM and a p < 0.05 was considered significant. For behavioral assay, drug effects were compared before and after the drug treatment and analyzed with a one-way ANOVA. All multiple group comparisons were followed by Duncan’s post hoc test.
Functional classification of differentially regulated genes
Genes differentially upregulated in CFA-treated group were functionally annotated and classified by “Molecular Function” of gene list analysis in PANTHER Classification System (www.pantherdb.org). 24
Canonical pathway analysis
To identify biological pathways enriched in TG following masseter inflammation, we performed Canonical pathway analysis (CPA) by using Ingenuity Pathway Analysis software (Qiagen). CPA predicts enriched biological pathways based on the affected genes that are associated with canonical pathways in the Ingenuity Knowledge Base. The list of genes and interactions among genes in individual pathway are available from https://targetexplorer.ingenuity.com/index.htm. We performed CPA by using either the entire genes or a subset of candidate genes that are relevant with chronic pain and nociceptors (see below). The significance of the association of the data set with the pathway was evaluated by calculating a ratio of the number of differentially regulated genes that map to the pathway divided by the total number of genes that map to the canonical pathways. When a p value determined by Fisher’s exact test was smaller than 0.05, the association was considered to be significant.
Listing candidate genes relevant to pain and nociceptors
For narrowing down the analysis to genes relevant with chronic pain and nociceptors, we generated a list of 2320 genes based on three criteria as below. The list of entire genes and category of each gene are available in Supplemental Material 1.
Pain genes (PG)
We listed a group of genes related with acute and chronic pain. We took advantage of the list of genes in the Pain Research Panels (Algynomics). These panels include a group of human genes producing proteins mediating transmission of pain signals, producing central and peripheral inflammatory responses, and influencing mood and affect. 25 These panels also include genes found to be associated with intermediate phenotypes predictive of TMD onset. 26 We pooled all the genes included in Pain Research Panel version 1 and version 2 (www.algynomics.com). We also reviewed the literature regarding genes involved in TMD 27 and added a few additional genes that were not included in the Pain Research Panels. PG are composed of 681 genes.
Sensory neuronal genes (SN)
PG include not only the genes enriched in sensory neurons but also ones mainly functioning in the central nervous system or even in non-neuronal cells. To focus our analysis on the genes enriched in sensory neurons, especially medium- to small-diameter neurons, we adopted a list of genes identified from dissociated sensory neurons through magnetic purification. Thakur et al. 20 demonstrated that magnetic cell sorting (MACS) successfully segregates neuronal cells from non-neuronal cells from mouse sensory ganglia. Without MACS, only ∼10% of adherent cells were neuronal cells whereas MACS increased neuronal population up to ∼95%. Transcriptome analysis verified that many genes were enriched in the population collected through MARC. We selected genes that showed increase in expression by >40%, which might select genes that are enriched more than five folds in neurons compared to non-neuronal cells based on assumption that neurons constitute ∼10% of the entire population. SN are composed of 1532 genes.
TRPV1-lineage neuronal genes (VL)
Since our previous studies and other groups’ reports suggest the primary roles of TRPV1 and TRPA1 in inflammatory muscle pain, it is important to identify genes enriched in TRPV1-expressing neurons that undergo changes in transcripts following masseter inflammation. A recent study elegantly demonstrated the molecular signature of VL neurons. By using mouse lines selectively labeling or ablating TRPV1 lineage neurons, Goswami et al. 18 identified a group of genes enriched in VL sensory neurons. Among these genes, we selected genes that are enriched >3 fold in VL neurons compared to non-VL neurons. VL are composed of 611 genes.
Results
Injection of CFA into masseter muscle induces a robust reduction in the response threshold to mechanical stimuli three days after the injection (Figure 1), which is consistent with our previous report.
7
Such threshold change was effectively attenuated by masseter injection of AMG9810, a specific antagonist of TRPV1 that has been suggested as a contributor of masseter hyperalgesia. These data support that CFA injection to masseter muscle can serve as a reliable model for transcriptome analysis to study mechanisms of inflammatory masseter hyperalgesia.
CFA-induced masseter hyperalgesia involves TRPV1. Mechanical force (g) that produced the head withdrawal responses 50% of the trials (EF50) is plotted for Baseline before and after three days following CFA injection. Effects of intramuscular vehicle or AMG9810 on mechanical sensitivity were tested by measuring mechanical threshold for pre- and 0.5, 1, 24 h following injection. *p < 0.05; ***p < 0.001 in post hoc assay following one-way ANOVA. N = 5 in each group.
To determine expression profiles of genes, we obtained TG from the rats injected with either vehicle or CFA in the masseter muscle and performed RNA-seq assay. We obtained more than 80 million total reads per samples (84 million in naïve and 94 million in CFA; p > 0.16 in Student’s t-test). Reads were mapped to the reference rat genome and quantitatively compared transcriptomes. To get an overview of the relationships of gene expressions between CFA- or saline-injected rats, a principal component analysis was performed using the read counts for all genes in each sample normalized by library size (Figure 2). The results showed that a clear segregation and clustering of two populations in the two-dimensional representation suggesting that clear differences in RNA expression exist between saline and CFA groups but not within groups. Among the genes showing fragments per kilobase of exon per million fragments mapped > 10, ∼3499 genes showed significant differences between vehicle- and CFA-injected groups; 1683 genes were upregulated and 1816 genes were downregulated. Among these, we functionally classified the upregulated genes that have been primarily focused in pain studies by PANTHER gene list analysis. Our analysis on functional annotation of ∼1300 genes that were upregulated by >20% showed that gene functions were predominantly related to catalytic, binding (to protein or nucleic acid), transporter, and receptor activity (Figure 3). The receptor activity was mainly from GPCR, GABA, acetylcholine, or glutamate receptors.
Principal component analysis of RNA-seq data from saline- (S1 to S4) or CFA-injected (C1 to C4) mice. Pie charts of the functional annotation of upregulated genes (>1.2 fold) following masseter inflammation. Functional categories from “Molecular Function” analysis in PANTHER Classification System (left) and subcategory of receptor activity (right) are charted.

To identify major biological pathways regulated in TG, we performed CPA. CPA suggested that masseter inflammation produces inflammatory responses not only in peripheral tissues but also within TG. The most highly enriched canonical pathway was “Hepatic Fibrosis/Hepatic Stellate Cell Activation” pathway. This pathway involves proinflammatory cytokine and chemokine regulating hepatic stellate cells, which are activated upon liver damage. “Leukocyte extravasation signaling” was the second most enriched pathway. Multiple other pathways involving regulations of immune cells were predominantly enriched.
TG contains sensory neurons and non-neuronal cells such as satellite glial cells. The number of non-neuronal cells is predominant over that of sensory neurons. Therefore, CPA more likely reflects changes in non-neuronal cells rather than nociceptive neurons. To analyze pathways more relevant to genes enriched in sensory neurons, especially nociceptors, we selected 2320 genes based on the three criteria (PG, SN, and VL) as described in Methods section (Figure 4(a)). Among the 2320 genes, we found that 622 genes showed differential expression following masseter inflammation (Figure 4(b), Supplemental Material 1). We performed CPA limited to the 2320 genes, and top 20 enriched pathways are shown in Table 1. “G-Protein Coupled Receptor Signaling” and “cAMP-mediated signaling” were the top two enriched pathways. Third was “Synaptic Long Term Potentiation” pathway and fourth was “Neuropathic Pain Signaling In Dorsal Horn Neurons.” Pathways involving two transcription factors, cAMP response element-binding protein and nuclear factor of activated T-cells, were also highly enriched.
Numbers of total (a) or differentially regulated (b) genes in three different categories: pain genes (PG), sensory neuronal (SN), and TRPV1-lineage (VL) genes. Enriched canonical pathways of the differentially regulated candidate genes following masseter inflammation.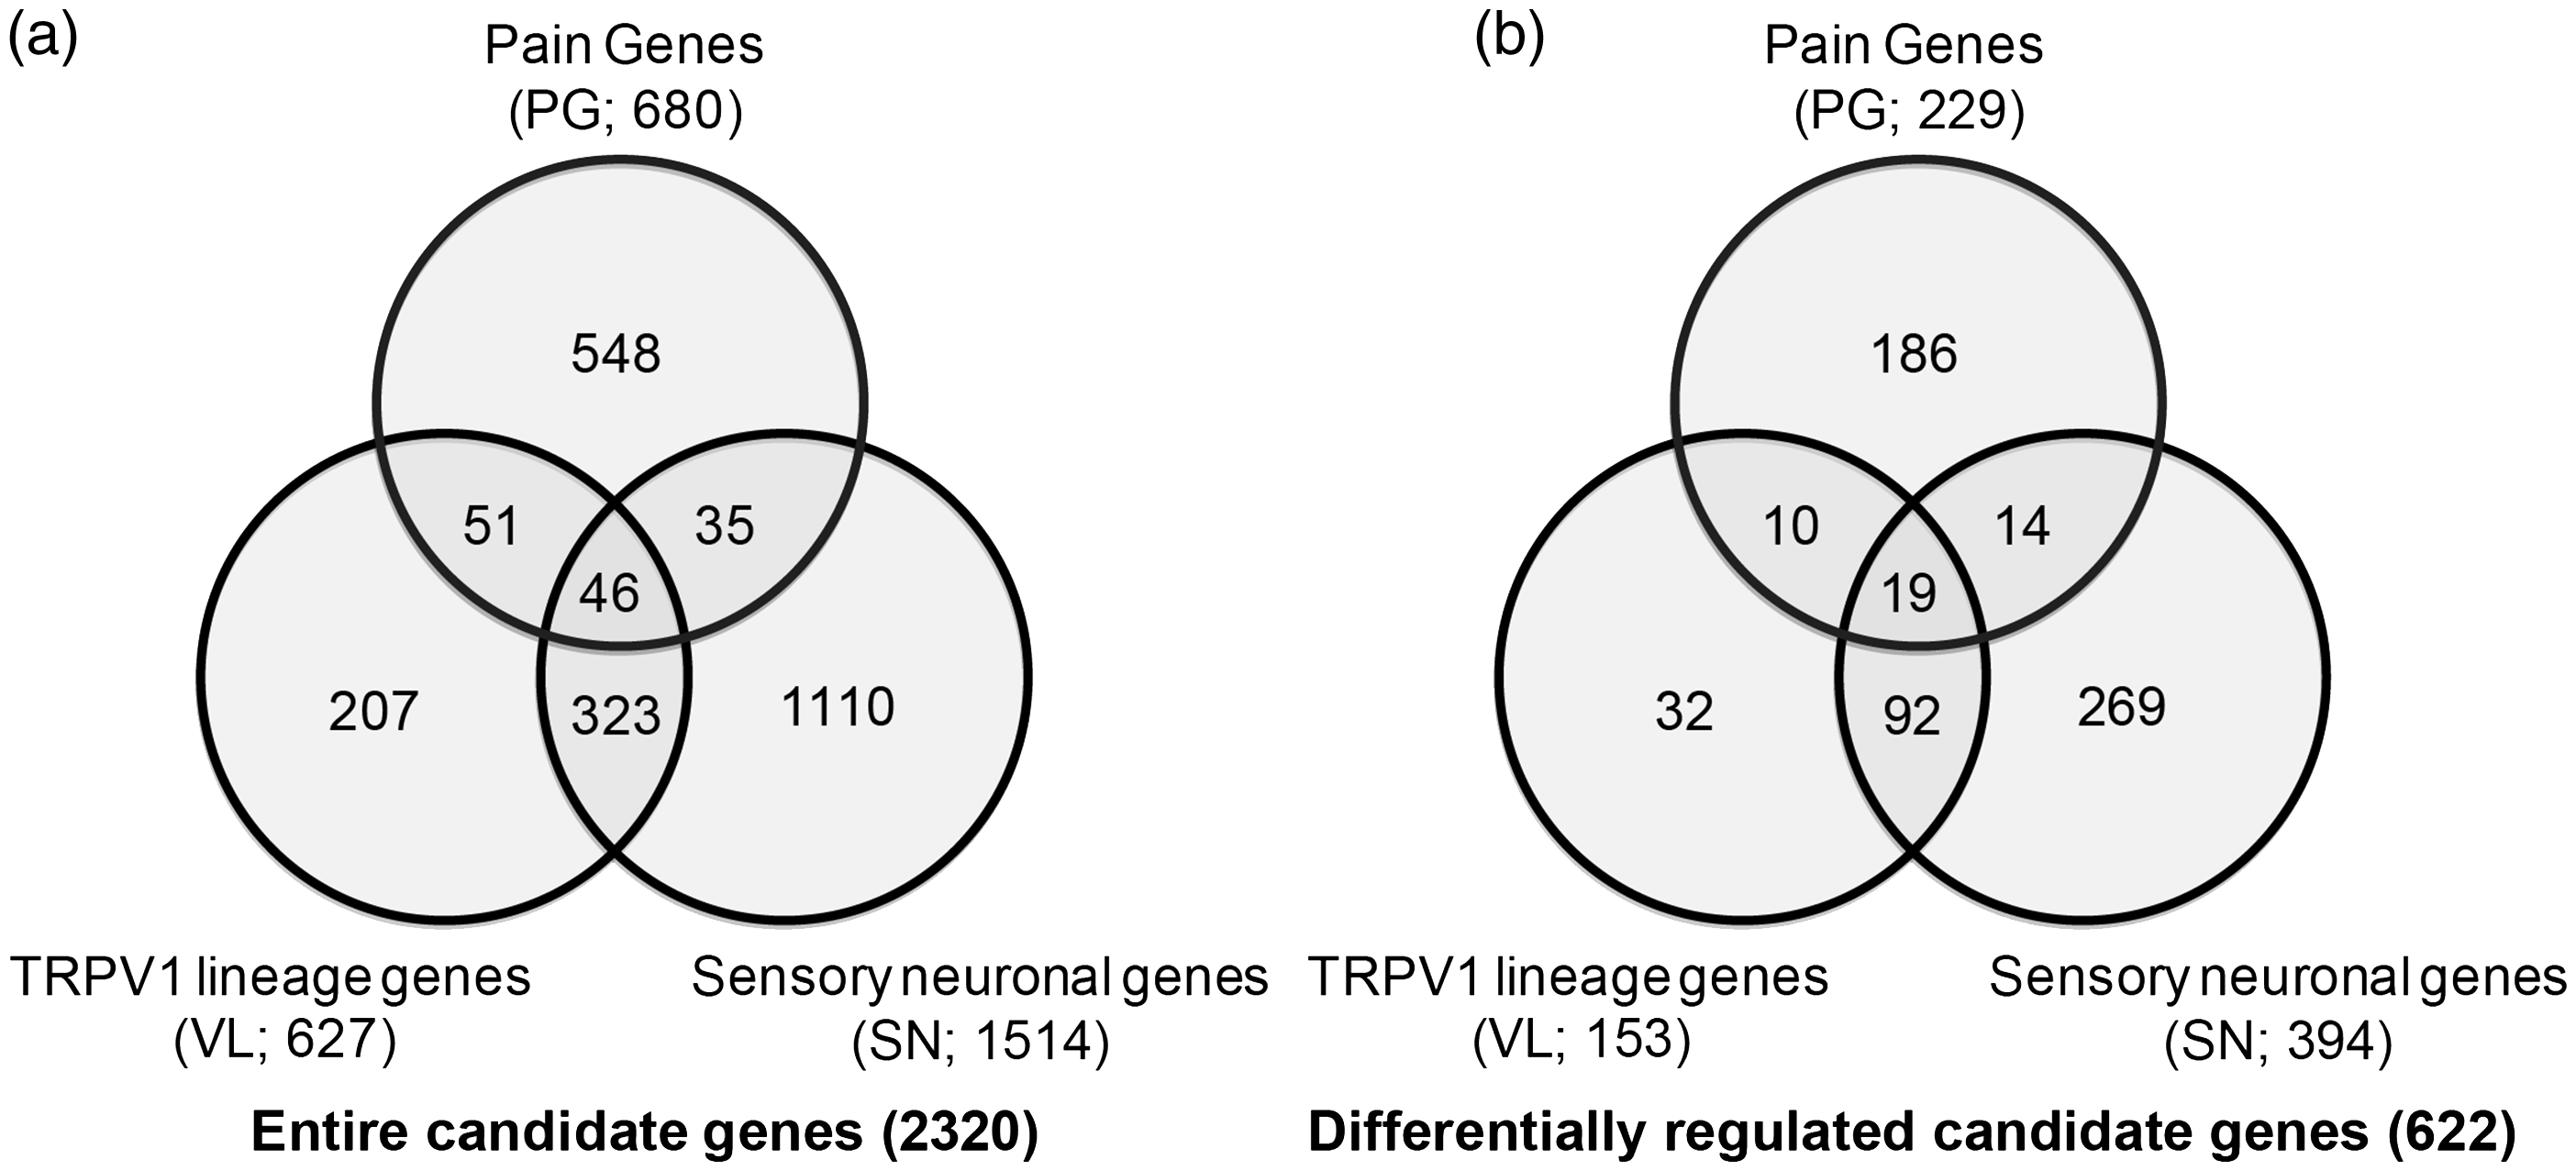

Selected pain genes (PG) overlapped with sensory neuronal (SN), and/or TRPV1-lineage (VL) genes, which were differentially regulated following masseter inflammation.

FC: fold change; q: false discovery rate adjusted p value; P: pain genes; S: sensory neuronal genes; V: TRPV1 lineage genes.
q < 0.05.
q < 0.005.
q < 10−4.
q < 10−5.
q < 10−6.
Selected pain genes (PG) not overlapped with sensory neuronal (SN), or TRPV1-lineage (VL) genes, which were differentially regulated following masseter inflammation.

FC: fold change; q: false discovery rate adjusted p value; P: pain genes.
q 0.05
q 0.005
q < 10−5
Selected Sensory Neuronal (SN) and/or TRPV1-lineage (VL) genes, which were differentially regulated following masseter inflammation.

FC: fold change; q: false discovery rate adjusted p value; S: sensory neuronal genes; V: TRPV1 lineage genes.
q 0.05.
q < 0.005.
q < 10−4.
q < 10−5.
q < 10−6.
For validation of RNAseq results, we confirmed the expression of two genes, TRPV1 and Piezo2, by real-time PCR analysis. Consistent with RNAseq results, Trpv1 and Piezo2 mRNA was upregulated by approximately 1.3 and 3.4 fold, respectively, compared to control (Trpv1, 1.0 ± 0.09 in naïve vs 1.28 ± 0.03 in CFA, p < 0.05; Piezo2, 1.0 ± 0.12 in naïve, 3.41 ± 0.07 in CFA, p < 10−4, Student’s t-test; n = 4 in each group).
Discussion
In the present study, we determined transcription profiles within TG after three days following masseter inflammation in rats by performing RNA-sequencing assay followed by transcriptome analysis. This assay allowed an unbiased comparison of the expression levels of >21,000 genes in vehicle- and CFA-treated groups. We found that masseter inflammation remotely alters the expression of approximately 17% of the entire genes within TG. Among these, approximately 1300 genes were upregulated greater than 1.2 fold. Bioinformatic analysis of datasets classified these genes into multiple functional categories and identified major biological pathways enriched in TG following masseter inflammation. By listing the candidate genes, we identified significant changes of multiple nociceptor genes that have been validated or genes that may potentially be involved in craniofacial hyperalgesia following masseter inflammation.
Our data represent alterations in transcriptome profiles within TG, but we do not assume similar changes in their protein levels since the amounts of transcripts are not necessarily correlated with proteins levels. In our transcriptome analysis, we presumed that genes showing large changes in transcription have greater functional impacts. However, the lack of change in the transcript level does not imply the lack of contribution of the given gene in hyperalgesia. Despite these limitations, we still believe that the analysis of transcriptome changes is a reasonable method for predicting the overall intraganglionic events associated with masseter inflammation and infer mechanistic cascades leading to craniofacial hyperalgesia.
Functional classification of the differentially regulated genes suggested multiple dynamic changes that are induced within TG following masseter inflammation. Such analysis, however, does not reveal whether the source of activity is neuronal or non-neuronal cells. Indeed, CPA predicted that masseter inflammation induces strong activation of resident supporting cells inside the ganglia, presumably Schwann cells or satellite glia. Strong activation of Mobp and Gfap supports such prediction. In addition, strong inflammatory responses were dominant suggesting the roles of infiltrating immune cells in inducing plastic changes within the ganglia. Neuropathic injury enhances infiltration of leukocytes within TG, 31 although infiltration of immune cells into TG following muscle inflammation was not determined yet. To obtain information related to sensory neurons and nociceptive pathways and to better explain genetic basis of masseter hyperalgesia, we focused our attention to the preselected subpopulation of candidate genes. In the CPA for the candidate genes, GPCR and G-protein signaling were predicted to be predominantly enriched pathways. It is well established that numerous GPCR for chemical mediators function as pronociceptive or antinociceptive molecules in peripheral terminals. A subset of genes involved in neuropathic pain signaling was also enriched as reflected by upregulation of Bdnf, Prkca, Tac1, etc. Another enriched pathway following masseter inflammation was synaptic long-term potentiation. Multiple other genes contributing to synaptic function and structure (e.g., synaptotagmin, synaptoporin, Bdnf, and Ptprt) were also found to be upregulated. Interestingly, these genes were mostly expressed in VL neurons, suggesting that masseter inflammation could drive synaptic plasticity in central terminals within trigeminal nucleus, likely through TRPV1-expressing nociceptors. Indeed, the activation of TRPV1-expressing nociceptors in masseter muscle or temporomandibular joint (TMJ) induces hyperexcitability of central trigeminal neurons.32,33 Mechanisms of contribution of TRPV1-expressing nociceptors to synaptic plasticity within trigeminal nucleus will need to be determined.
RNA-seq analysis also allowed us to investigate changes in individual genes following masseter inflammation. Classification of the candidate genes into three groups (PG, SN, and VL) allowed us to better infer the extent or potential of contribution of those genes to pain mechanisms. We identified a number of such genes that show overlapping between the groups (Table 2). These genes are highly likely to be expressed in nociceptors and have been previously identified to be relevant to pain conditions in humans. Our RNA-seq analysis showed the same trend of alteration as reported in previous studies in some (e.g., Trpv1, Trpa1, and P2rx3) but not all (e.g., Asic3 34 ) of nociceptive genes implicated in masseter hyperalgesia. In Table 3, we also selected additional PG genes that are differentially regulated. Although these genes were not classified to SN or VL due to the high stringency of the selection criteria we applied, many of the genes certainly functions in primary afferent nociceptors. These genes warrant further study as they could possibly contribute to masseter inflammation-induced craniofacial hyperalgesia.
Among the genes that do not belong to PG, we also identified genes that could be functionally important (Table 4). Enhanced expression of Piezo2, a mechanosensitive ion channel, could play a role in mechanical hyperalgesia. 35 TMEM100 affects hyperalgesia by regulating interactions of TRPV1 and TRPA1. 36 HDAC9 epigenetically regulates expression of nociceptor genes. 37 Sox11 regulates axonal regeneration in injured sensory neurons. 38 Genetic variation of Arhgap28, Rho GTPase activating protein 28, and Kcnn3, a calcium-activated potassium channel, are associated with migraine. 39 Upregulation of GABA(A) α2 receptor suggests enhanced hyperalgesic effects of GABA modulators 40 under masseter myositis. Upregulation of Il31ra, interleukin 31 receptor A, suggests that masseter inflammation may increase itch sensation as well as pain. 41 These genes could contribute to masseter inflammation-related craniofacial hyperalgesia but further investigations are necessary.
Although inflammation was induced in masseter muscle, we do not presume that the observed transcriptome change within TG was confined to muscle afferents or merely associated with muscle hyperaglesia. Transcriptional activation may be initiated in muscle afferents, which may be followed by intraganglionic signaling or neuroinflammatory changes exerting wider influence, presumably involving primary afferents projecting to other craniofacial tissues. Such mechanisms could be involved in widespread craniofacial hyperalgesia such as joint pain or migraine, and therefore might serve as a primary afferent mechanism for ectopic hyperalgesia.
In conclusion, transcriptome analysis of TG following masseter muscle allowed us to gain mechanistic insights of craniofacial hyperalgesia following masseter inflammation. Better understanding of transcriptional changes in TG following craniofacial muscle injury should help developing novel approaches to manage persistent craniofacial pain conditions.
Footnotes
Acknowledgments
The authors would like to thank Youping Zhang for technical assistance and Sean Daugherty for assistance with all aspects of the RNA-seq analysis.
Author contributions
MKC and JYR designed the experiments and wrote the manuscript. JA performed experiments. MKC, JYR, JP, and JA analyzed the data and approved the final version of manuscript.
Declaration of Conflicting Interests
The author(s) declared no potential conflicts of interest with respect to the research, authorship, and/or publication of this article.
Funding
The author(s) disclosed receipt of the following financial support for the research, authorship, and/or publication of this article: This study was supported by the National Institutes of Health grant R01 DE023846 (MKC) and R01 DE016062 (JYR).