
Abstract
Social participation has been linked to healthy aging, yet little is known about social participation during extended periods of time for adults with intellectual and developmental disabilities. The social participation of 777 adults with intellectual and developmental disabilities (aged 18-77 years), during a 4-year period, was examined. Sociodemographic, physical, and behavioral health-related correlates of engagement in social participation were investigated. Findings indicated that the majority of adults with intellectual and developmental disabilities engaged in at least a moderate level of social participation during the 4-years. Employment status, physical health, and Special Olympics participation were associated with a higher level of social participation. Findings have implications for supports and services seeking to promote social participation opportunities for adults with intellectual and developmental disabilities.
Social participation is linked to healthy aging in the general population, promoting physical/cognitive health, and psychological well-being (e.g., Barbieri, 2021; Englehardt et al., 2010; Wanchai & Phrompayak, 2019). Research suggests that social participation provides similar benefits for individuals with intellectual and developmental disabilities (e.g., Badia et al., 2013a; Garcia-Villamisar & Dattilo, 2010). Yet, studies indicate that individuals with intellectual and developmental disabilities have fewer opportunities for social participation compared to typically developing peers (Kaljača et al., 2019; King et al., 2013; Taheri et al., 2016), and may experience an increased risk of social exclusion/isolation (e.g., Bigby, 2012; Krauss et al., 1992; Renwick et al., 2019). To date, research has utilized various definitions of social participation, however, it is most frequently agreed that social participation includes engagement in activities that involve interaction with others in one’s environment or community (Levasseur et al., 2010). Studies of social participation amongst individuals with intellectual and developmental disabilities have largely examined brief snapshots in time (e.g., two weeks), limiting what is known about extended periods of social participation. This understanding is key to developing services and policies that promote healthy aging and inclusion. The goal of the present study was to examine level of social participation during a 4-year period for adults with intellectual and developmental disabilities and correlates of engagement during that time.
Research indicates that individuals with intellectual and developmental disabilities regularly engage in social participation (Badia et al., 2013a; Dusseljee et al., 2011; Mihaila et al., 2017). Mihaila and colleagues (2017) found that 80% of a sample of adults with Down syndrome engaged in social leisure at least weekly and Smith and colleagues (2020) found that 45% of a sample of adults with intellectual and developmental disabilities reported high social participation. Across studies, 35-92% of adults with intellectual and developmental disabilities report having friends (Dusseljee et al., 2011; Jobling & Cuskelly, 2002; Smith et al., 2020), though social networks often differ from the general population (e.g., include staff/co-residents; McCausland et al., 2018). Yet evidence also suggests social participation may decline with age. Dusseljee and colleagues (2011) found that adults with intellectual and developmental disabilities aged 50+ (versus <50) had fewer social contacts. Similarly, in a longitudinal study of adults with Down syndrome, Carr (2008) found that while 47% participated in clubs at least weekly at age 30, only 28% maintained that participation at 40. To understand if there are discrete levels of social participation, or whether social participation is consistent for all adults with intellectual and developmental disabilities, it is necessary to examine an extended period of social participation.
Moreover, it is necessary to understand factors that promote social participation. Sociodemographic factors may contribute to differing levels of social participation. Older age is associated with lower social participation (Badia et al., 2013a) and greater social exclusion (Robertson et al., 2001). Greater severity of intellectual disability has also been associated with fewer social interactions (Duseljee et al., 2011), less social inclusion (Robertson et al., 2001), and lower social leisure (Mihaila et al., 2017). Adults with intellectual and developmental disabilities with greater severity of intellectual disability may have more communication difficulties, and, therefore, a more limited range of social activities available to them. Several studies found that individuals with intellectual and developmental disabilities living in community settings have more community participation than those living in institutions or segregated settings (Stancliffe et al., 2000; Verdonschot et al., 2009). Yet, others found that adults with intellectual and developmental disabilities living at home (versus community) had greater participation (Badia et al., 2013b). Adults with intellectual and developmental disabilities living at home may have more support from caregivers to facilitate social participation. Residing in an urban area may further enhance social participation because of increased availability of community activities/services; individuals with intellectual and developmental disabilities living in urban (versus rural) areas have been found to participate more in social leisure (Badia et al., 2013b). Employment may also promote participation by providing opportunities to cultivate friendships. One study found that adults with Down syndrome engaged in full-time (versus part-time) employment reported greater social leisure (Mihaila et al., 2020).
Physical health-related characteristics of adults with intellectual and developmental disabilities may also impact social participation. Greater self-rated health (Emerson et al., 2014) and better physical health/functioning (Azaiza et al., 2011; McCausland et al., 2016) have been positively associated with social and community participation. Involvement in Special Olympics may also enhance social participation by promoting a wider social network through interactions with teammates/competitors (Crawford et al., 2015).
Finally, behavioral health-related characteristics of adults with intellectual and developmental disabilities may affect social participation. Evidence from the general population suggests that social participation may be associated with mental health (e.g., Jang & Chiriboga, 2011). Associations between behavioral health-related factors and social participation have yet to be examined amongst adults with intellectual and developmental disabilities; however, adults with intellectual and developmental disabilities with depression report more stressful social interactions compared to their peers without depression (Hartley & MacClean, 2009). Adults with intellectual and developmental disabilities experiencing poor behavioral health (e.g., anxiety/depression) may be at risk for more stressful/negative interactions and may have lower social participation.
The present study aims were to: 1) describe level of social participation during a 4-year period and 2) examine sociodemographic, physical, and behavioral health-related correlates of social participation during that time.
Method
Sample
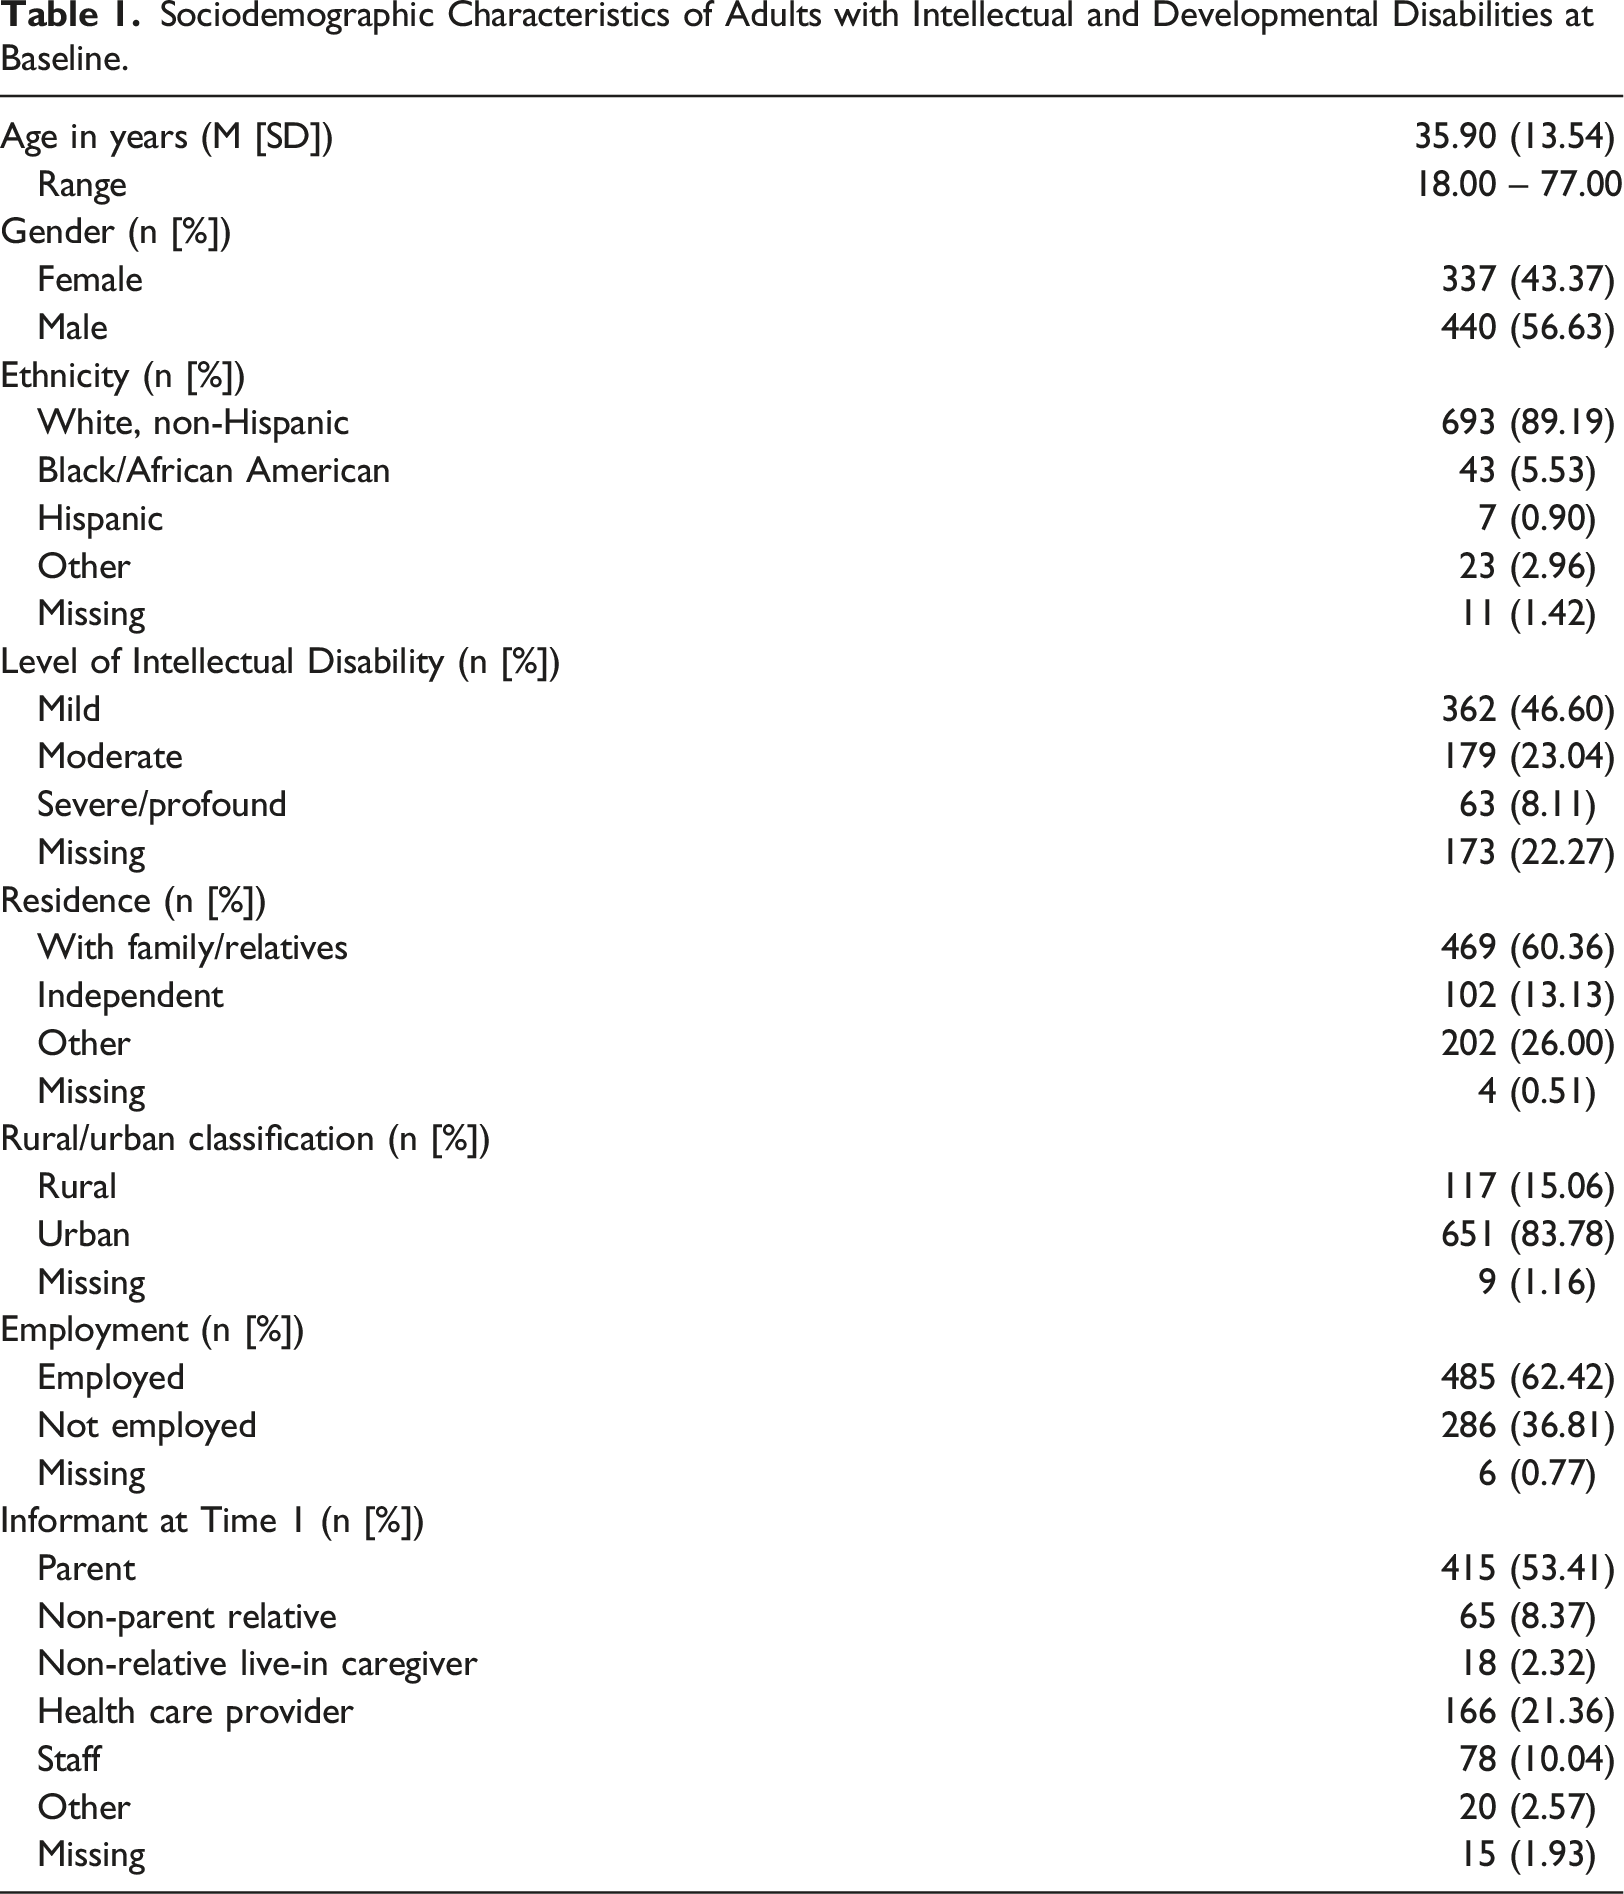
Sociodemographic Characteristics of Adults with Intellectual and Developmental Disabilities at Baseline.
Procedure
Each year, informants completed a 15-25-minute paper/online survey about the physical/mental health of the adults with intellectual and developmental disabilities and their participation activities. At the first time point, informants were largely parents (53.4%), healthcare providers (21.4%), or staff (10.0%). Roughly 31% completed the survey with assistance from the adult with intellectual and developmental disability (e.g., completed the survey together or asked the adult with intellectual or developmental disability to answer a question they were unsure about). For approximately half of adults with intellectual and developmental disabilities, the informant remained the same at all time points. Informants were compensated with a $10 gift card Years 1-3, and a $5 gift card Year 5.
Measures
Sociodemographic Variables
Sociodemographic variables were measured at Year 1 and included information on date of birth, gender (female = 0, male = 1), level of intellectual disability (mild = 1, moderate = 2, severe/profound = 3), residence (with family/relative = 1, on own = 2, other = 3), rural/urban classification (rural = 0, urban =1), and employment status (not employed = 0, employed = 1) of the adults with intellectual and developmental disabilities.
Social Participation
Four items were used to determine social participation each year. Informants reported how often in the last month the adults with intellectual and developmental disabilities: 1) talked to family members/friends on the phone, 2) visited with family members who do not live with him/her, 3) visited with friends who do not live with him/her, and 4) went to a movie, sports event, club meeting, religious service, or other social event outside of the home. Items were rated on a 4-point Likert scale (not at all = 1, 1-3 times/month = 2, weekly = 3, and 2+ times/week = 4). For each year, responses were summed to create a social participation frequency score (range: 4-16). Yearly scores were summed to create a cumulative social participation score describing overall social participation during the 4-year period (range: 17-64). Values 17-32 were categorized as “little or no social participation” and equated to less than monthly social participation (coded 0). Values 33-48 were categorized as “moderate social participation” and equated to monthly social participation (coded 1). Values 49-64 were categorized as “high social participation” and equated to weekly social participation (coded 2). Test-retest reliability using the intraclass correlation coefficient for each social participation item ranged from 0.78-0.93 and was 0.86 for cumulative social participation.
Physical Health-Related Correlates
Physical health-related correlates were measured at Year 1.
General Health Status
Measured by the item, in general, would you say his/her health is: excellent = 1, very good = 2, good = 3, fair = 4, or poor = 5.
Physical Function/Impairment
Six items were used to determine physical function/impairment: 1) does he/she use a cane, crutches, or walker? 2) does he/she use a wheelchair? 3) does he/she have difficulty liftin or carrying something more than 10 pounds, such as a full bag of groceries? 4) does he/she have difficulty climbing a flight of stairs? 5) does he/she have difficulty walking three blocks (approximately 1/8 mile)? and 6) how many falls has he/she experienced in the past 12 months. The first five items were coded as no = 0 and yes = 1. The sixth item was coded as 0 = 0, 1 = 1, 2 = 2, 3 = 3, ≥4 = 4, and don’t know/not sure = 5. If the informant reported the adult with intellectual and developmental disability had ≥1 falls, they were asked: if he/she has fallen in the past 12 months, did the fall require medical care? Their response was coded as no = 0 and yes = 1. Responses were summed to create a physical function/impairment score; higher scores indicate greater impairment.
Physical Activity
Three items were used to determine level of physical activity: 1) on average, how many days/week does he/she do moderate physical activities for ≥30 minutes? 2) on average, how many days/week does he/she do vigorous physical activities for ≥20 minutes? and 3) on average, how many days/week does he/she do physical activities to maintain or increase muscle strength? Items were coded as never/rarely = 0, 1-2 days/week = 1, 3 days/week = 3, and 4+ days/week = 4. Responses were examined to determine if physical activity guidelines of ≥150 minutes/week of moderate physical activity and ≥2 days/week of muscle strengthening activities were met (2018 Physical Activity Guidelines Advisory Committee, 2018) and grouped as follows: did not meet = 1, met some = 2, and met physical activity guidelines = 3.
Obesity
Informants reported on height (inches) and weight (pounds) of the adults with intellectual and developmental disabilities. Body mass index was calculated based on formulas/guidelines from the Centers for Disease Control and Prevention (2019). A body mass index of ≥30 was considered obese.
Physically Unhealthy Days
Informants were asked to think about the physical health, including physical illness and injury, of the adults with intellectual and developmental disabilities and indicate how many days during the past 30 days their physical health was not good.
Special Olympics Events Attended
Informants indicated whether the adults with intellectual and developmental disabilities participated in Special Olympics events (no = 0, yes = 1), and if yes, how many Special Olympics events they attended during the past year. Number of Special Olympics events was coded: none = 0, 1 = 1, 2 = 2, 3 = 3, 4+ = 4.
Behavioral Health-Related Correlates
Behavioral health-related correlates were measured at Year 1.
Anxiety
Informants reported on whether the adults with intelle (Hsieh et al., 2012) ctual and developmental disabilities had an anxiety diagnosis from a doctor, and whether they were taking medication for it. If the adult with intellectual and developmental disability had both a diagnosis and was taking medication, he/she was considered to have anxiety.
Depression
Informants reported on whether the adults with intellectual and developmental disabilities had a depression diagnosis from a doctor, and whether they were taking medication for it. If the adult with intellectual and developmental disabilities had both a diagnosis and was taking medication, he/she was considered to have depression.
Mentally Unhealthy Days
Informants were asked to think about the mental health, including stress, depression, and problems with emotions, of the adults with intellectual and developmental disabilities and indicate how many days during the past 30 days their mental health was not good.
Usual Activity Restricted Days
Informants indicated how many days, during the past 30 days, poor physical or mental health kept the adults with intellectual and developmental disabilities from doing usual activities such as self-care, work, or recreation.
Stressful Life Events
Number of stressful life events (range: 0-6) was calculated by summing the events experienced in the past year from the following list: 1) moved to new residence, 2) changed jobs, 3) changed primary caregiver, 4) changed service provider, 5) death of immediate family member, and 6) other.
Data Analysis
Descriptive statistics were used to examine the level of cumulative social participation during the 4-year period (categorized as little or no, moderate, or high). A one-way analysis of variance (ANOVA) model was used to examine the association between age at Year 1 and level of cumulative social participation. Chi-square models were used to examine associations between gender and level of intellectual disability at Year 1 and level of cumulative social participation. Then, one-way analysis of covariance (ANCOVA) models, controlling for age, gender, and level of intellectual disability at Year 1 (if significant), were conducted to examine associations between remaining sociodemographic variables and physical and behavioral health-related variables, at Year 1, and level of cumulative social participation. Bonferroni post-hoc comparisons were utilized to examine group differences by level of social participation.
Results
Roughly 83% of adults with intellectual and developmental disabilities had moderate (55.3%) or high (27.3%) cumulative social participation during the 4-year period. Social participation was found to be normally distributed. The average cumulative social participation score was 42.3 (SD = 10.0), indicating roughly weekly engagement. Among social participation items, “talk with family/friends on the phone” and “go to movie, sport event, club, religious service, or other social event outside of the home” were most frequently endorsed, with average scores of 11.5 and 11.0, respectively, indicating roughly weekly engagement. “Visit with friends who do not live with him/her” and “visit with family who do not live with him/her” had average scores of 10.0 and 9.8, respectively, also indicating roughly weekly engagement. A one-way ANOVA model indicated a significant difference in level of social participation by type (F(3,3104) = 45.3, p<.01). Bonferroni post-hoc comparisons indicated adults with intellectual and developmental disabilities had significantly greater endorsement of talking with family/friends on the phone than visiting with family (p<.01) or friends (p<.01) who do not live with him/her and going to movies, sport events, clubs, religious services, or other social events outside of the home (p = .04). Additionally, adults with intellectual and developmental disabilities had significantly greater endorsement of going to movies, sport events, clubs, religious services, or other social events outside of the home than visiting with family (p<.01) or friends (p<.01) who do not live with him/her. There was no significant difference in visiting with family versus friends who do not live with him/her (p = .99).
A one-way ANOVA model indicated a significant difference in age at Year 1, by level of cumulative social participation during the 4-year period (F(2,774) = 21.65, p<.01). Bonferroni post-hoc comparisons indicated that adults with intellectual and developmental disabilities with high cumulative social participation during the 4-year period were significantly younger at Year 1, on average, than adults with intellectual and developmental disabilities with moderate (p<.01) and little or no (p<.01) cumulative social participation. Similarly, adults with intellectual and developmental disabilities with moderate cumulative social participation, were significantly younger at Year 1, on average, than adults with intellectual and developmental disabilities with little or no (p<.01) cumulative social participation. Gender of the adults with intellectual and developmental disabilities at Year 1 was not significantly associated with level of cumulative social participation (χ 2 (2) = 0.23, p = .89).
Level of intellectual disability at Year 1 was significantly associated with level of cumulative social participation during the 4-year period (χ
2
(4) = 60.19, p<.01). Of the 362 adults with mild intellectual disability, the majority had moderate (53.3%) or high (36.5%) cumulative social participation. Of the 179 adults with moderate intellectual disability, again, the majority had moderate (56.4%) or high (29.6%) cumulative social participation. In contrast, high cumulative social participation was not endorsed for any adults with severe or profound intellectual disability (n=63
Sociodemographic Correlates
Analysis of Covariance Models Examining Relations Between Physical/Behavioral Health-Related Variables and Level of Social Participation.
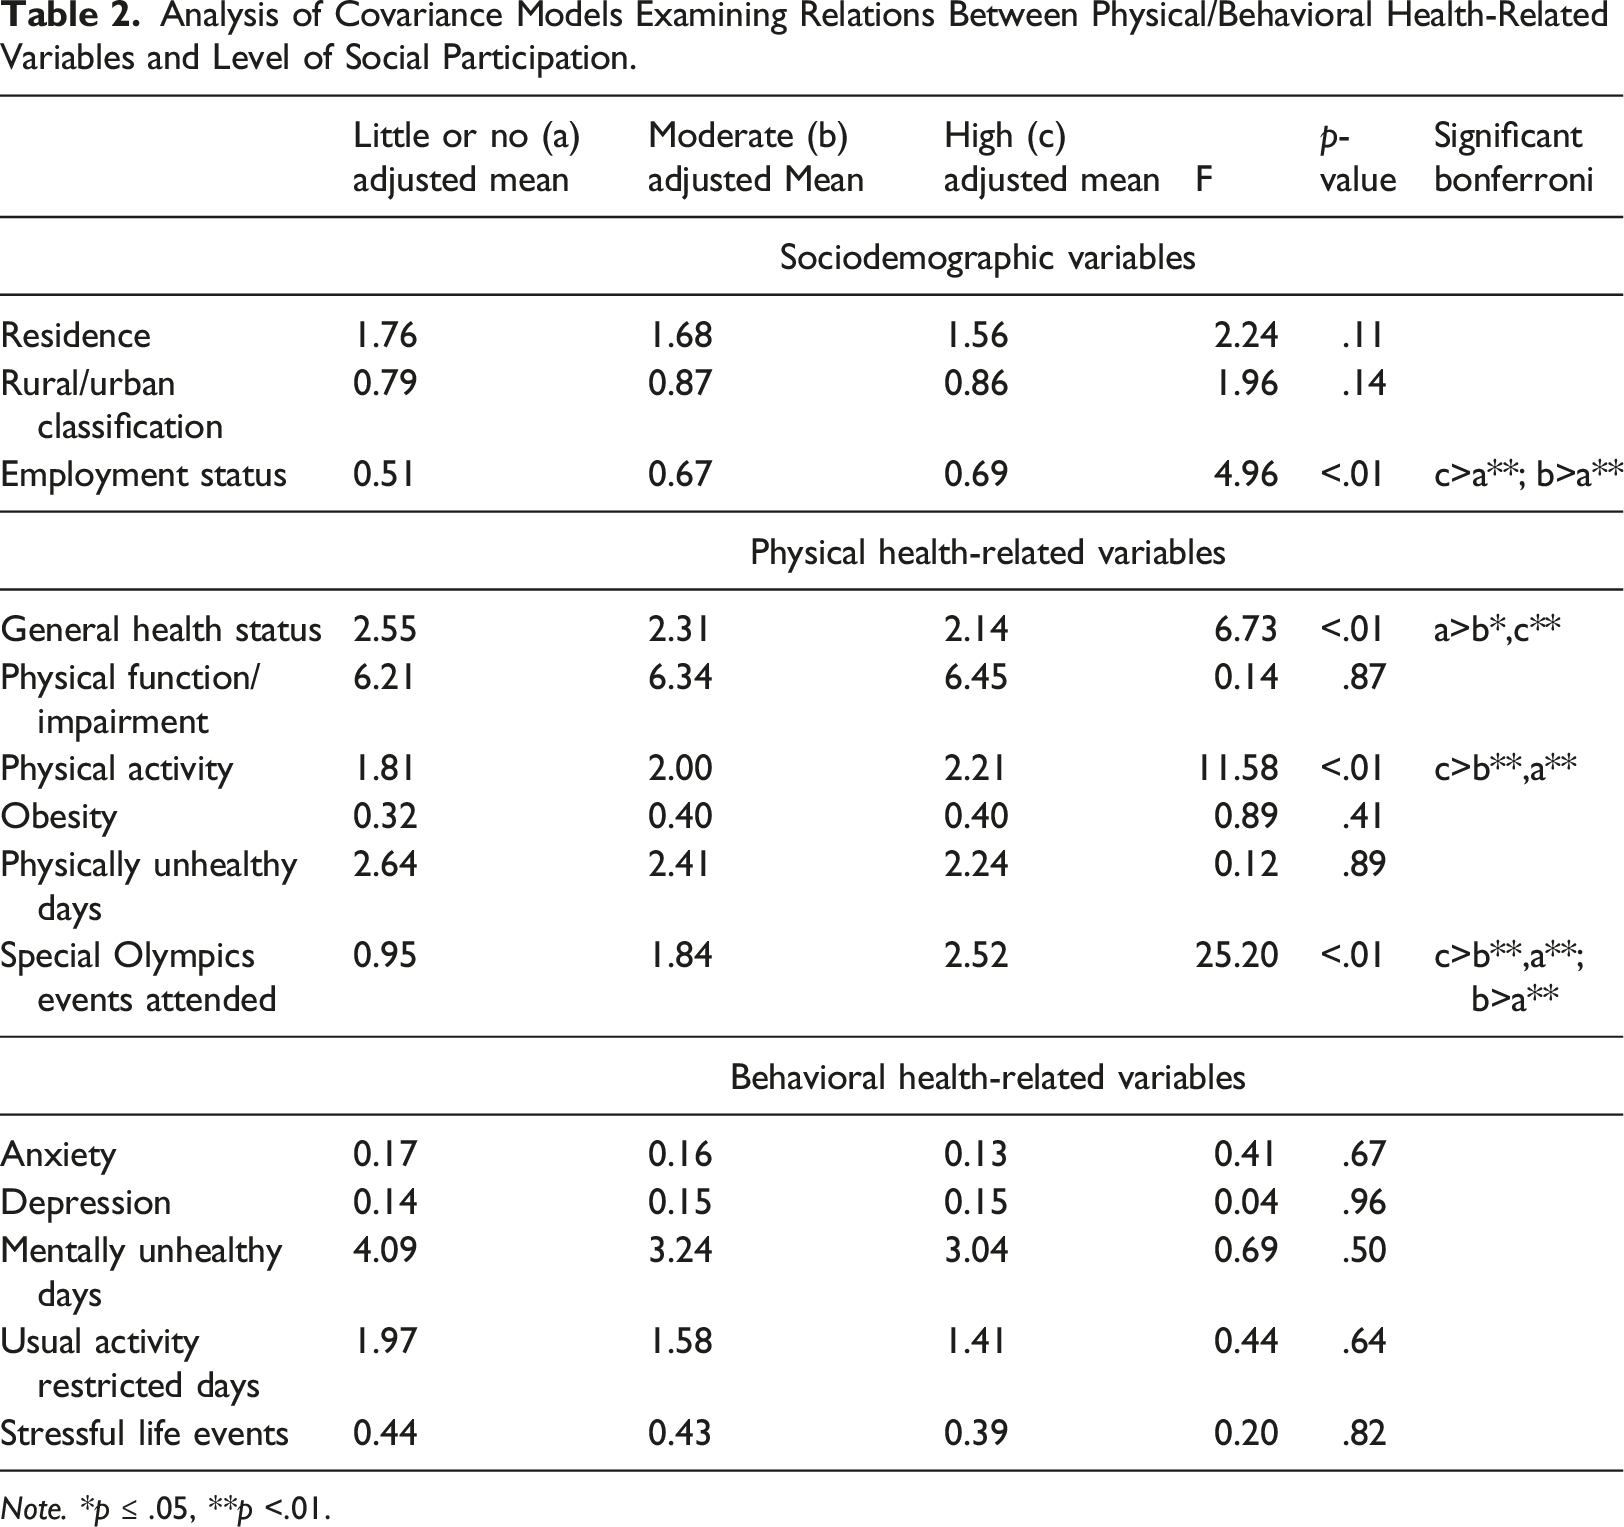
Note. *p ≤ .05, **p <.01.
Employment status at Year 1 was significantly associated with level of cumulative social participation. A larger percent of adults with intellectual and developmental disabilities (p<.01) who were not employed had little or no cumulative social participation (25.9%) compared to adults with intellectual and developmental disabilities who were employed (12.4%). More adults with intellectual and developmental disabilities (p<.01) who were employed had moderate (56.9%) and high (30.7%) cumulative social participation compared to adults with intellectual and developmental disabilities who were not employed (moderate: 52.4%; high: 21.7%).
Physical and Behavioral Health-Related Correlates
Results from the one-way ANCOVA models between physical and behavioral health-related variables at Year 1 and level of cumulative social participation during the 4-year period are presented in Table 2. There was a significant difference in general health status at Year 1 by level of cumulative social participation such that adults with intellectual and developmental disabilities with little or no cumulative social participation exhibited significantly poorer general health at Year 1 than adults with intellectual and developmental disabilities with moderate and high cumulative social participation. There was no significant difference in general health status at Year 1 between the adults with intellectual and developmental disabilities with moderate versus high cumulative social participation. There was also a significant difference in physical activity at Year 1 by level cumulative of social participation, such that adults with intellectual and developmental disabilities with high cumulative social participation met significantly more physical activity guidelines at Year 1 than adults with intellectual and developmental disabilities with moderate and little or no cumulative social participation. However, adults with intellectual and developmental disabilities with moderate cumulative social participation did not meet significantly more physical activity guidelines at Year 1 than adults with intellectual and developmental disabilities with little or no cumulative social participation. Finally, there was a significant difference in number of Special Olympics events attended at Year 1 by level of cumulative social participation, such that adults with intellectual and developmental disabilities with high cumulative social participation attended a significantly greater number of Special Olympics events at Year 1 (M = 2.6) compared to adults with intellectual and developmental disabilities with moderate (M = 1.8) and little or no (M = 0.9) cumulative social participation. Additionally, adults with intellectual and developmental disabilities with moderate cumulative social participation attended a significantly greater number of Special Olympics events at Year 1 compared to adults with intellectual and developmental disabilities with little or no cumulative social participation. There were no significant differences in physical function/impairment, obesity, number of physically unhealthy days, or in any behavioral health-related variables at Year 1, by level of cumulative social participation during the 4-year period.
Discussion
The present study provides the first examination of social participation during a 4-year period amongst adults with intellectual and developmental disabilities and identifies factors that predict greater cumulative social participation. We found most adults with intellectual and developmental disabilities had moderate or high levels of social participation; only 17% of adults with intellectual and developmental disabilities had little or no social participation during the 4-year period. On average, adults with intellectual and developmental disabilities engaged in each type of social participation at least weekly. Talking with friends and family on the phone and going to movies, sport events, club meetings, religious services, or other social events outside of the home had the highest endorsement. Together, these findings are consistent with previous research indicating adults with intellectual and developmental disabilities have regular (i.e., at least weekly) social participation (e.g., Dusseljee et al., 2011; Mihaila et al., 2017
Consistent with literature indicating that social participation may decline as adults with intellectual and developmental disabilities age (e.g., Badia et al., 2013b), we found younger adults with intellectual and developmental disabilities exhibited higher levels of cumulative social participation. Average age was 32.0 and 36.1 years for adults with intellectual and developmental disabilities who exhibited high and moderate cumulative social participation, respectively. In contrast, among those with little or no cumulative social participation, average age was 41.5. In part, lower cumulative social participation amongst older adults with intellectual and developmental disabilities may be due to declining availability of formal disability services as individuals age (Pruchno & McMullen, 2004) and transportation barriers to activities (Buttimer & Tierney, 2005). Also consistent with the literature (e.g., Duseljee et al., 2011), we found that adults with less severe intellectual disability exhibited higher levels of cumulative social participation. Services should seek to create social opportunities for adults with intellectual and developmental disabilities with a wide range of intellectual disability severity.
Residence and rural/urban classification were not associated with level of cumulative social participation, when controlling for age and level of intellectual disability. This finding is encouraging, particularly given evidence of health and service disparities (Zablotsky & Black, 2020) experienced by individuals with intellectual and developmental disabilities from rural (versus urban) areas. It is possible that social participation is easier to facilitate in group homes and rural areas (e.g., phone calls with family/friends and social gatherings among residents) in comparison to other types of leisure that necessitate transportation and community engagement. Future research should further examine whether individuals with intellectual and developmental disabilities not living with family or living independently in the community and individuals with intellectual and developmental disabilities living in rural areas are more at risk for lower participation in other domains of leisure.
Findings were also consistent with existing literature regarding employment and social participation (Mihaila et al., 2020). We similarly found that employment status was associated with level of cumulative social participation, such that employed (versus unemployed) adults with intellectual and developmental disabilities had higher rates of high cumulative social participation and lower rates of little or no cumulative social participation. One possibility is that engagement in employment provides opportunities to build friendships and relationships that spill over into after-work social opportunities (e.g., meeting after work with a friend from work or chatting with a friend from work by phone). Employment may be an important mechanism for broadening the social networks of adults with intellectual and developmental disabilities beyond family and support staff.
Several physical health-related characteristics distinguished between those who exhibited high versus moderate versus little or no cumulative social participation during the 4-year period. Adults with intellectual and developmental disabilities with better general health and who met physical activity guidelines exhibited higher cumulative social participation, suggesting that, to some extent, physical health may be important for social participation. At the same time, physical function/impairment, obesity, and number of physically unhealthy days in the past month were not associated with level of cumulative social participation. Thus, adults with intellectual and developmental disabilities may be able to continue social participation (e.g., phone calls with family/friends) when they are unable to participate in person because of poor physical health.
Notably, the number of Special Olympics events attended in the past year was associated with level of cumulative social participation during the 4-year period. Special Olympics activities may be important for social participation in two ways. First, they may promote greater physical health through engagement in sports, enabling adults with intellectual and developmental disabilities to maintain better health and participate in their communities. Secondly, they may encourage development of friendships and relationships that broaden the social networks of adults with intellectual and developmental disabilities (Crawford et al., 2015) and spill over into leisure outside of Special Olympics programming. It should be noted that despite being an avenue for physical activity, to an extent, Special Olympics participation may be viewed as a type of social participation. In the present study, whether the individual with intellectual and developmental disabilities participated in Special Olympics was assessed separately from the items utilized to describe social participation and not included in the cumulative social participation score, thus limiting potential confounds.
Interestingly, behavioral health-related characteristics did not distinguish between adults with intellectual and developmental disabilities who exhibited high versus moderate versus little or no cumulative social participation during the 4-year period. This contrasted with our hypothesis and may have been the result of limited variability in the behavioral health of the present sample. Indeed, only 15.6% and 14.8% of the adults with intellectual and developmental disabilities had a diagnosis and were taking medication for anxiety and depression, respectively. On average, the adults with intellectual and developmental disabilities had experienced only 0.4 stressful life events and reported only 3.3 mentally unhealthy and 1.7 usual activity restricted days in the past month. In particular, the limited number of usual activity restricted days resulting from poor physical or mental health indicates that the present sample was not experiencing change in social participation as a result of behavioral health. Future research should further examine the impact of behavioral health on social participation in samples that may be more at risk for poor mental health.
There were several limitations to the present study. The present sample was largely recruited through organizations that provide services to individuals with intellectual and developmental disabilities, and thus, likely did not include adults with intellectual and developmental disabilities who lacked access to such services. As a result of having access to intellectual and developmental disability services, the present sample may have inherently had greater opportunities for social participation than adults with intellectual and developmental disabilities not being served by agencies and without access to such services, limiting the generalizability of findings. Furthermore, as the present sample included a wide age-range at Year 1 (59 years), it is possible that cohort effects may have contributed to findings. For example, the older adults with intellectual and developmental disabilities at Year 1 may not have had the same service access in their youth as the younger adults with intellectual and developmental disabilities at Year 1, which may have limited later social participation opportunities. Additionally, our measure of social participation only captured frequency of participation as opposed to its quality and meaningfulness. Future research should capture qualitative data to better understand the impact of the quality of social participation and the satisfaction individuals experience with their social participation. For example, less frequent social participation, if meaningful, may be more satisfactory to individuals with intellectual and developmental disabilities than more frequent, less meaningful, social participation. Finally, at each time point, data was gathered from a single informant and was not cross validated with information from the adults with intellectual and developmental disabilities themselves and/or another informant. Notably, for half of the adults with intellectual and developmental disabilities in the sample, the informant varied at least once between time points. The perspective, knowledge, and consistency of the informant about the adults with intellectual and developmental disabilities may have influenced responses. We were also unable to conclude how caregiver characteristics may have played a role in the social participation of adults with intellectual and developmental disabilities as limited data was gathered regarding informants.
In summary, the present study is one of the first to examine level of social participation and correlates of social participation during an extended period for adults with intellectual and developmental disabilities. Findings indicated that the majority of adults with intellectual and developmental disabilities exhibited at least moderate levels of social participation during a 4-year period. Adults with intellectual and developmental disabilities with mild/moderate intellectual disability had greater social participation, indicating a need for adaptive social opportunities serving adults with intellectual and developmental disabilities with severe/profound intellectual disability. Employment, physical health, and participation in Special Olympics may also be important factors contributing to social participation. Findings have implications for programming seeking to enhance social participation for adults with intellectual and developmental disabilities and promote healthy aging.
Footnotes
Declaration of Conflicting Interests
The author(s) declared no potential conflicts of interest with respect to the research, authorship, and/or publication of this article.
Funding
The authors disclosed receipt of the following financial support for the research, authorship, and/or publication of this article: This work was supported by the United States Department of Health and Human Services, Administration for Community Living, National Institute on Disability, Independent Living, and Rehabilitation Research [grant numbers 90RT5020-03-00, 90AR5007], the Special Olympics Cooperative Agreement from the United States Centers for Disease Control and Prevention [grant number U01DD000302]; and the Health Resources and Services Administration [grant number T73MC11047-09-00]. Contents are solely the responsibility of the authors and do not necessarily represent the official views of the granting agencies.