
Abstract
This study was conducted to evaluate the BMI of the children with intellectual disability and the factors affecting their BMI. This descriptive and cross-sectional study was carried out between March 2016 and April 2016 in Turkey and consisted of 135 children. Children's anthropometric measurements were and their BMI values were calculated. Categorization of children by BMI percentile according to AAP reference values was performed. There was a significant difference between the BMI categories of the children (p < 0.05) and the education level of children’s father (x 2 = 8.960; p = 0.028), the degree of intellectual disability (x 2 = 16.113; p = 0.008), the presence of other disabilities (x 2 = 22.013; p = 0.000), type of disability (x 2 = 21.359; p = 0.001), the nutrient intake (x 2 = 38.935; p = 0.000) and the presence of nutritional problems (x 2 = 7.687; p = 0.042). Father's education level, children's degree of disability, child’s having presence of other disabilities, child’s being dependent in the view of nutrient intake, and child’s having nutritional problems were determined as factors affecting BMI.
Introduction
The World Health Organization (WHO) defines malnutrition as deficiencies or excesses in nutrient intake and imbalance of essential nutrients. It classifies malnutrition under two headings as undernutrition (a lack of important vitamins & minerals, wasting, stunting, and underweight) and overnutrition (overweight and obesity) (WHO, 2020). The Body Mass Index (BMI) is the most widely used tool to correlate the risk of health problems with weight. Although BMI is not a diagnostic tool, the Centers for Disease Control and Prevention (CDC) and the American Academy of Pediatrics (AAP) recommend using it for malnutrition screening in children and adolescents aged 2-19 (AAP, 2021; CDC, 2015). The worldwide prevalence of obesity in child population has had a tendency to increase in recent years (Králíková and Válková, 2020); however, the children with intellectual disabilities are at risk in terms of undernutrition and overnutrition due to their limited ability to understand and evaluate information about health maintenance (Mohamed et al., 2021).
In a systematic review study, it was reported that the children with disabilities were three times more likely to suffer from malnutrition and were twice as likely to suffer from wasting and stunting compared to typically developing children (Hume-Nixon and Kuper, 2018). This situation is associated with poverty (Banks et al., 2017), difficulty in accessing quality health services, nutritious food intake deficiency (Mohamed et al., 2021), physical barriers such as oral-motor dysfunction (Hasegawa et al., 2020; Kleinert, 2017) that make nutrient intake difficult and caregivers' inability to spare enough time to feed the child (Hume-Nixon and Kuper, 2018). On the other hand, there is also evidence for a high prevalence of overweight and obesity in children with intellectual disabilities (Amo-Setién et al., 2020; Ptomey et al., 2020; Rottermund et al., 2020; Sanner et al., 2021; Segal et al., 2016). Familial factors (Dempsey et al., 2017; Osaili et al., 2019; Polfuss et al., 2017), uncontrolled diet due to cognitive limitation (Marmouch et al., 2021), the ability to eat independently (Osaili et al., 2019), lack of physical activity (Marks, 2017; McGarty and Melville, 2018; Rottermund et al., 2020; Sutherland et al., 2021), and drug use (Croteau et al., 2019; Kleinendorst et al., 2020) are the triggering causes of overweight and obesity in children with intellectual disabilities. Overweight and obesity in childhood and adolescence have a high potential to maintain in adulthood (AAP, 2021; CDC, 2015). They also lead to comorbidities such as hypertension, hypercholesterolemia, increased insulin resistance, asthma and sleep apnea (Dodd et al., 2020).
Interventions should be performed as early as possible to ensure that the children with intellectual disabilities have a better quality of life (Doreswamy et al., 2020). New research data on the factors affecting BMI, especially the children with intellectual disabilities, need to be carried out in order to keep BMI within healthy values. These data will guide nurses in planning their nursing training for children with intellectual disabilities and their parents, in early detection and prevention of the problems that children with intellectual disabilities may experience and they will contribute to the literature. Therefore, this study was conducted to evaluate the BMI of the children with intellectual disabilities and the factors affecting their BMI.
Material methods
Design, setting and sample
This descriptive and cross-sectional study was carried out between March 2016 and April 2016 in seven special education centers affiliated to the Directorate of National Education in the province of Karabuk in the Western Black Sea Region of Turkey. The population of the research consisted of 146 children with intellectual disabilities under the age of 18 who received special education in these centers between the dates of the study. In the study, it was aimed to reach the entire population without the choice of a sample. Since 8 parents disagreed to participate in the study and 3 children did not cooperate during the measurements, the sample of the study consisted of 135 children. The rate of participation in the research was determined to be as 92.5%.
Data collection tools
Procedures
A room was arranged in each institution for the anthropometric measurements of children in cooperation with the administrators of the institution. It was ensured that the children were with one of their parents in the room during the anthropometric measurements. The measurement procedures were explained by the people who would make the measurement to the children and their parents by showing. The children were asked to take off their shoes during the measurements. The children were observed to be wearing light clothes. The body weight of the children was measured with a handheld digital scale (SECA 803, Hamburg). The height of the children was measured with a non-flexible measuring tape. During the anthropometric measurements, three trained students who had internships in these private education institutions within the scope of the nursing internship program accompanied the researcher. Measurements were made on average 1-2 hours before the children's lunch time. Parents were asked to help fill out the participant information form. Filling out the participant information form and anthropometric measurements of the children took an average of 15-20 minutes for each child. Afterwards, the children's anthropometric measurements were transferred to the computer environment and their BMI values were calculated. BMI table for Turkish Children prepared by Neyzi et al. (Neyzi et al., 2015) was used in the calculation of BMI of the children. Categorization of children by BMI percentile according to AAP reference values (less than the 5th percentile = underweight; 5th percentile to less than the 84th percentile = healthy weight; 85th percentile to less than the 95th percentile = overweight; equal to or greater than the 95th percentile = obese) was performed (AAP, 2021).
Statistical analysis
Data analysis was performed using the Statistical Package for Social Sciences program (SPSS-22) (IBM, 2016). Number, percentage, mean and standard deviation in the evaluation of descriptive data, chi-square analysis in the determination of the factors affecting BMI in nonparametric data and ANOVA test in parametric data were used in this study. Post hoc analysis was performed to determine the group that caused the difference. The results were evaluated at a 95% confidence interval and the value of p < 0.05 was considered to be significant.
Results
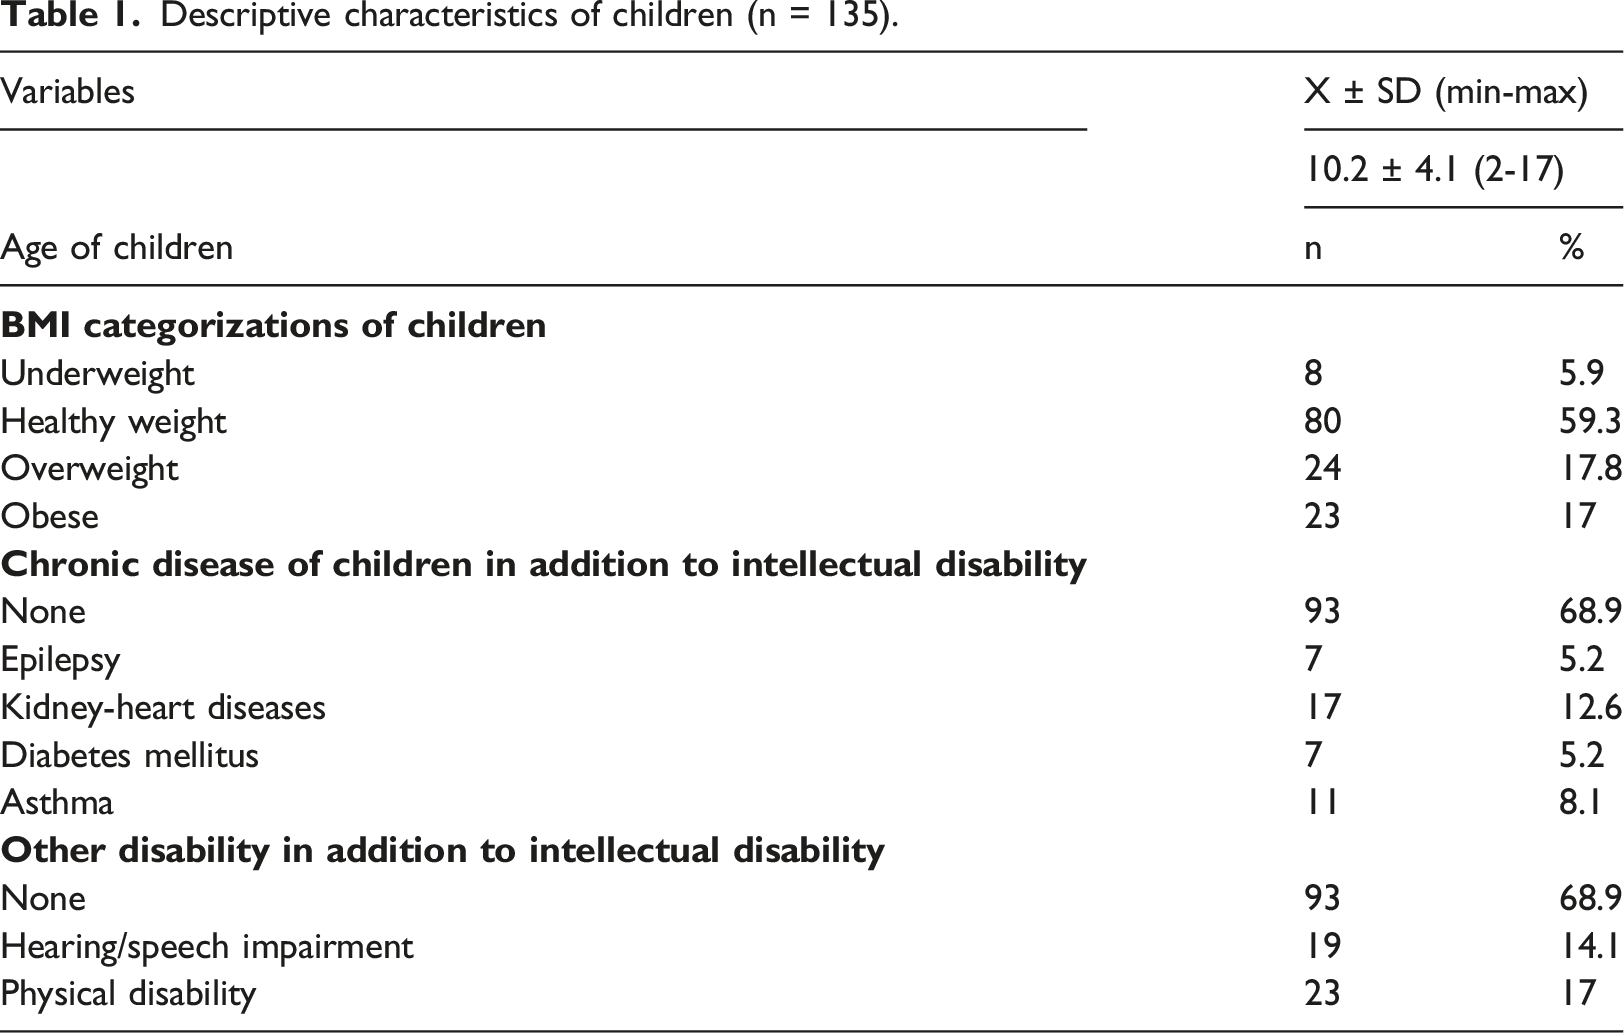
Descriptive characteristics of children (n = 135).
Various factors affecting BMI.
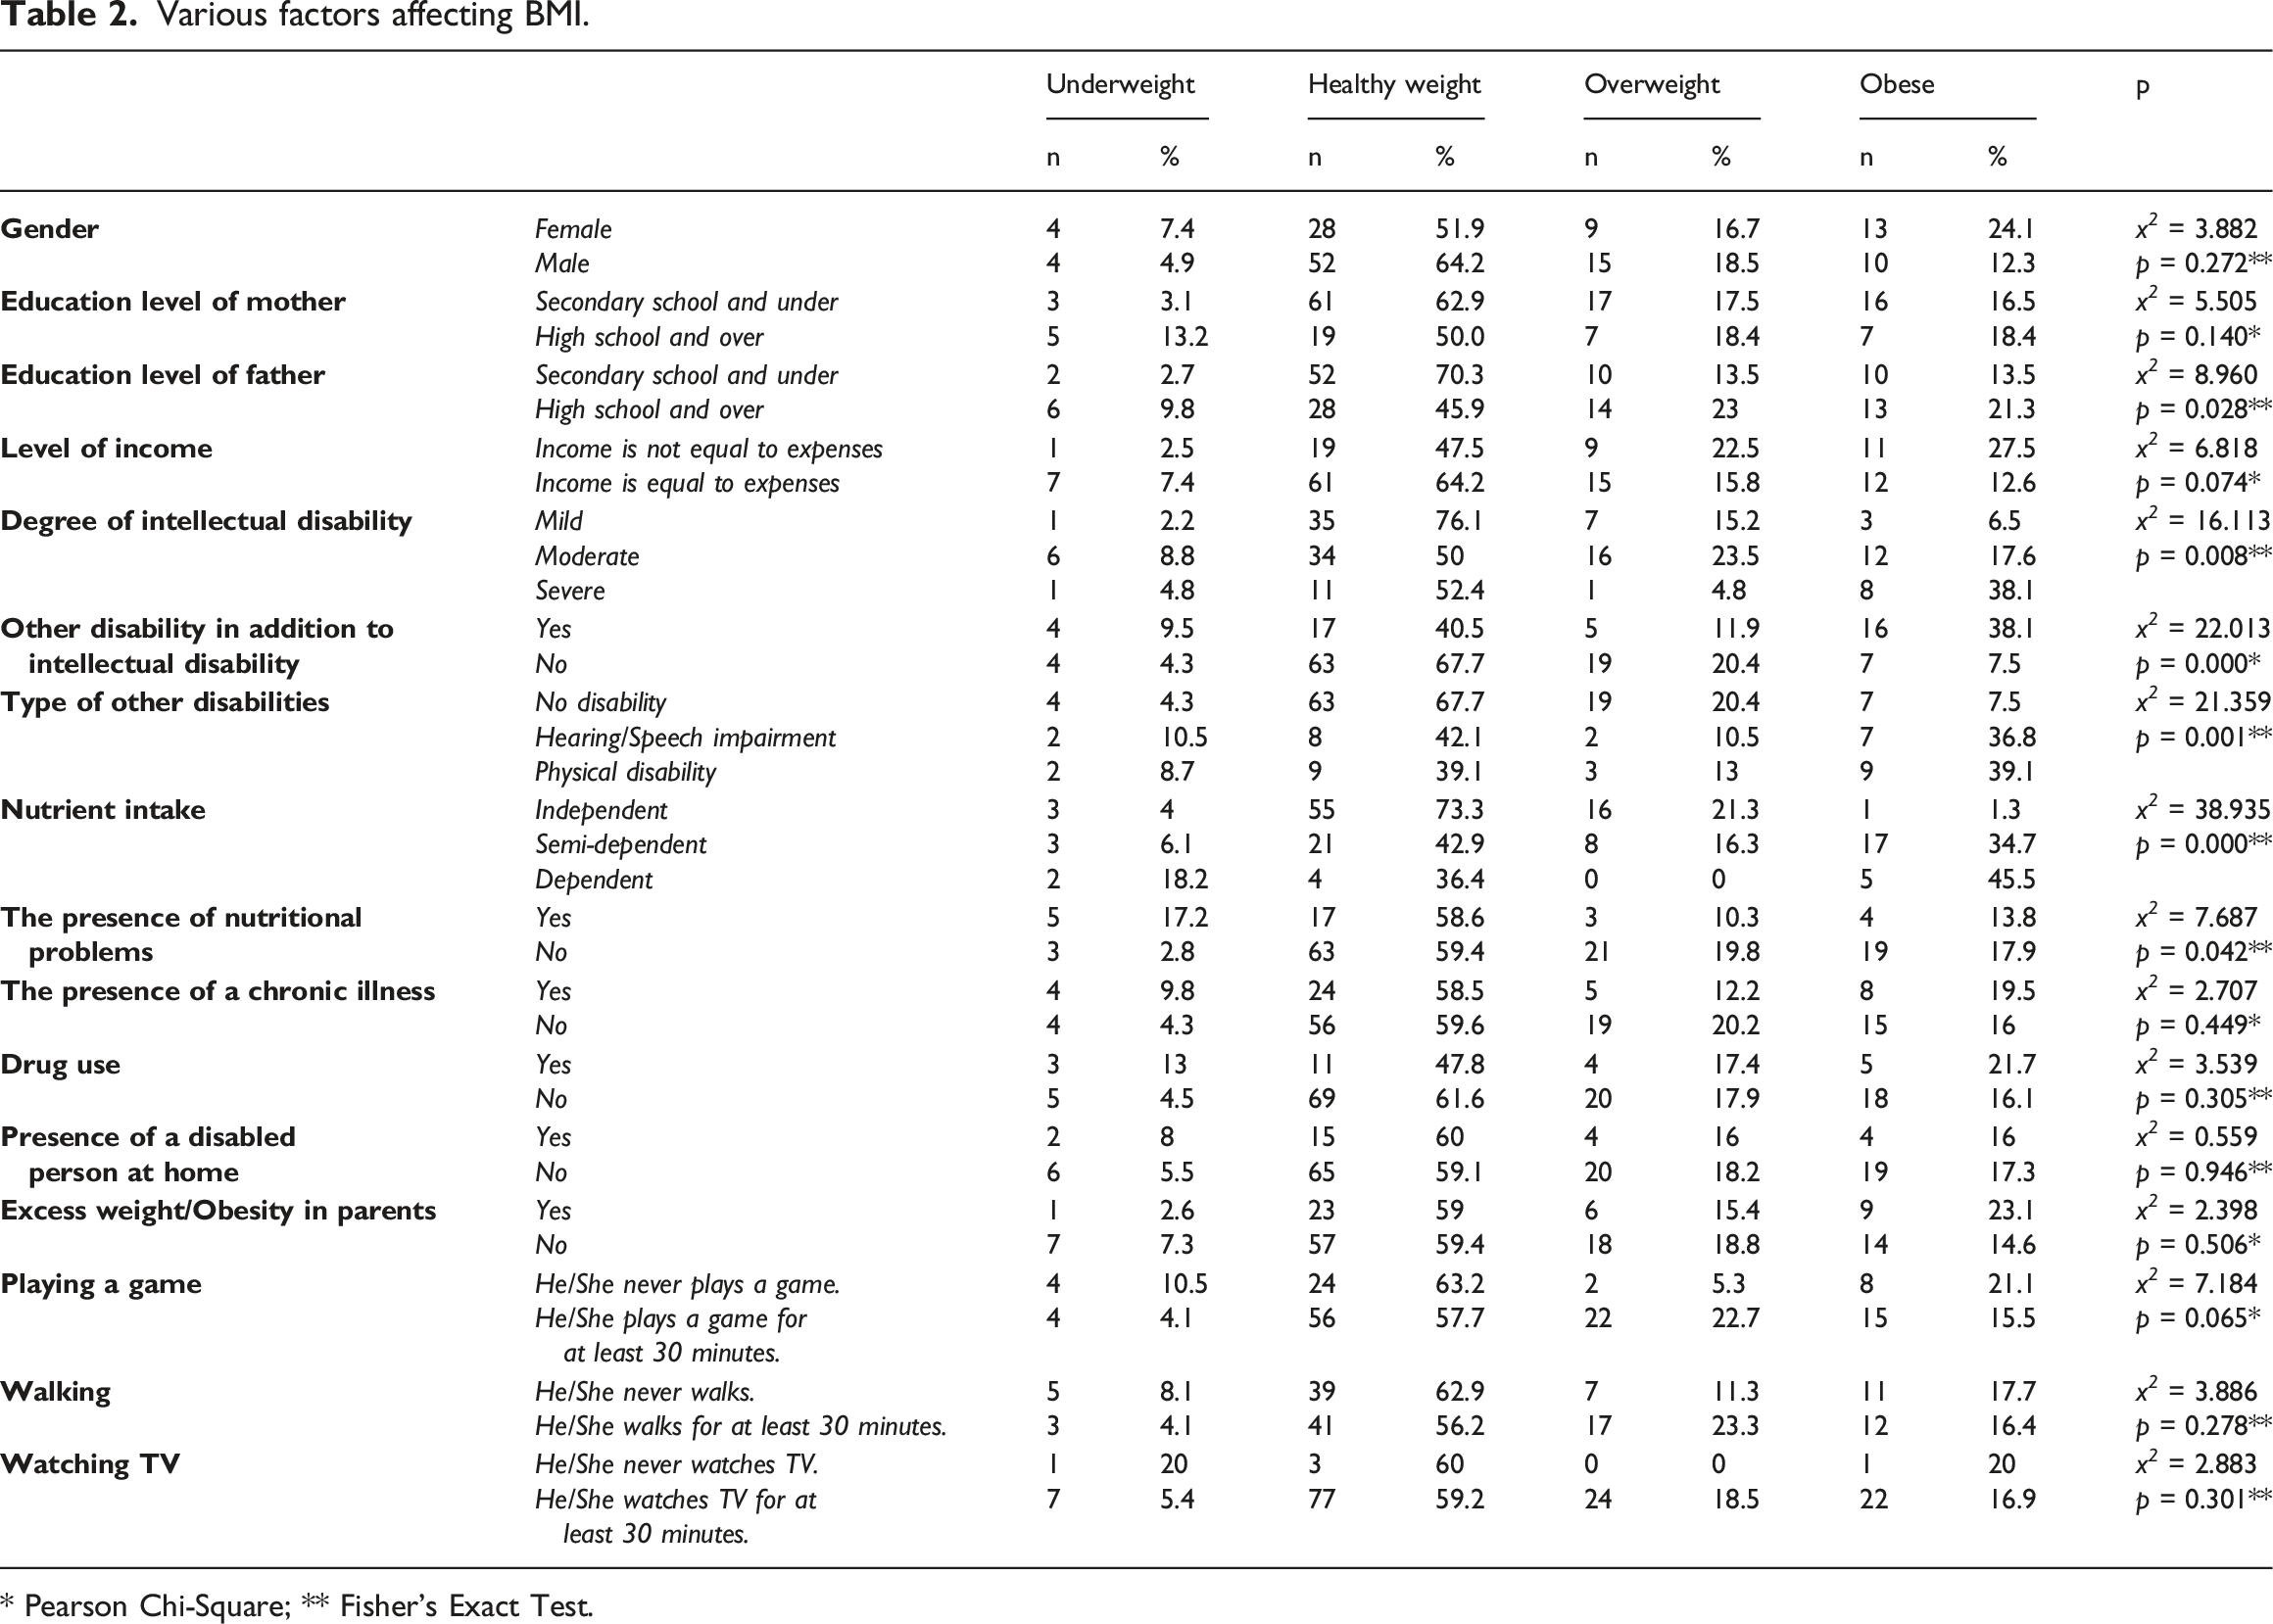
* Pearson Chi-Square; ** Fisher’s Exact Test.
There was a significant difference between the BMI categories of the children (p < 0.05) and the education level of children’s father (x² = 8.960; p = 0.028), the degree of intellectual disability (x² =16.113; p = 0.008), other disability in addition to intellectual disability (x² = 22.013; p = 0.000), type of disability (x² = 21.359; p = 0.001), independent nutrient intake (x² = 38.935; p = 0.000) and nutritional problems (x² = 7.687; p = 0.042) (Table 2).
No significant difference was found between the mean scores of the groups (p > 0.005) and the ages of the children included in the study (F = 2.265; p = 0.084), the duration of playing game (F = 1.605; p = 0.191), walking (F = 1.107; p = 0.349) and watching tv (F = 2.159; p = 0.096).
Discussion
The BMI is the most widely used tool to correlate the risk of health problems with weight. It is also used in the pediatric age group. Since the rates between weight and height in childhood and adolescence vary by gender and age, BMI in children is first calculated like adults, and then it is examined according to the child-specific BMI percentile values (WHO, 2021). CDC stated that children with intellectual disabilities were in the most risky group in terms of obesity due to movement restrictions and learning difficulties (CDC, 2019). In the literature, there are many studies in which BMI has been used to reveal the data on nutrition and physical activities of children with intellectual disabilities. In the view of the categorization of the BMI percentile values of the children aged 2-17 included in this study, the study results were not similar with any other study (Köse et al., 2021; Osaili et al., 2019; Pan et al., 2016; Pise et al., 2019; Polfuss et al., 2017; Sarı et al., 2016; Sayin and Ilik, 2017; Wang et al., 2018). In a meta-analysis study conducted in Turkey, the prevalence of obesity in typically developing children was found to be 7.3% (Alper et al., 2018); however, the prevalence of obesity in children with intellectual disability in our study was found to be 17% . Considering that children with intellectual disabilities have a higher rate of obesity in population-based studies, our study is compatible with the literature (Emerson et al., 2016; Krause et al., 2016; Segal et al., 2016).
In our study, parents' education and income levels were examined in terms of the factors that could affect BMI, and it was found that only father's education level affected the BMI. Due to the fact that the study design was not appropriate for multivariate analysis, the effect of father's educational level on BMI could not be evaluated precisely and it was thought to be coincidental. In a systematic review study conducted to determine the risk factors that belonged to parents and caused obesity, it was suggested that obesity in children and adolescents with disabilities should not be associated with the socioeconomic situation of parents (McGillivray et al., 2013). Although our results are compatible with the literature in the point that family income does not affect the BMI values of children (Krause et al., 2016), a study examining the effects of father's education on the BMI of children with intellectual disabilities has not been found.
Cognitive limitation and uncontrolled nutrient intake are closely associated with increased BMI (Marmouch et al., 2021). Our findings indicated that the degree of intellectual disability, the presence of additional disability in addition to intellectual disability, and nutrition-related conditions affected children's BMI. The prevalence of obesity was found to be higher in children with moderate/severe disability and in children with semi-dependent/dependent nutrient intake. We consider that this situation is closely related to the fact that children with increased disability are fed by their parents. In the literature, it was reported that unhealthy food choices of parents of children with intellectual disabilities, inability to manage feeding times of the children (Grondhuis and Aman, 2014), inability to understand that the child was full, the use of food as a reward (Bandini et al., 2015), perceptions and concerns about the child's weight (Eow et al., 2021) may trigger obesity prevalence.
The children with intellectual disabilities have more problems than typically developing children in terms of nutrient intake (Must et al., 2014). In our study, the underweight prevalence of children who had nutritional problems such as chewing/swallowing deficiencies, food choice and vomiting was higher. In the study conducted by Siddiqi et al. (Siddiqi et al., 2019), the rate of children experiencing chewing/swallowing problems (38%) was found to be almost twice higher than that of our results (21.5%), and the prevalence of underweight (< 15th percentile) children to be 26.1%. It was found in the study conducted by Osaili et al. (Osaili et al., 2019) that 5.2% of the children were underweight, which was similar to our findings, but it was also found that 47.5% of the children had problems with chewing, 70.7% with swallowing, 82.9% with choosing food, and 23.2% with vomiting. Although our results are not consistent with the literature, we consider that this situation is related to the differences such as age group, type/degree of disability and sample size of the children included in the sample.
It is known that physical activities contribute to the weight management of children with intellectual disabilities (Doreswamy et al., 2020). It was stated that children with intellectual disabilities had different physical activity behaviors compared to their typically developing peers (Sutherland et al., 2021). Contrary to the literature, it was found in our study that playing games, walking and watching TV, or the average duration of these activities were not effective on the BMI of the children with intellectual disabilities who constituted the sample of this study. It was found that accelerometer was used for an objective measurement in studies related to physical activities in the literature (Sit et al., 2019; Stanish et al., 2019; Wouters et al., 2019; Zhu et al., 2020). We consider that this incompatibility may be due to the fact that we used parental statements to determine the level of physical activities in our study.
Strengths & limitations
Studies in which children's BMIs were obtained from school records were found in the literature. One of the strengths of this study is that the measurements of all children included in our study were made by the researchers and three trained university students. However, our study has some limitations that need to be addressed. The generalizability of the study is limited due to its cross-sectional design and small sample size. Among our limitations, there is also the fact that factors related to nutrition and physical activities, which may affect BMI, are not evaluated with objective assessment methods (They were evaluated according to parental statements). Another limitation of our study is that multivariate analyses and confounding factors could not be examined since the data were collected categorically. Therefore, the variables affecting the results cannot be interpreted definitively.
Conclusion
The results of this study contributed to the existing literature in terms of the BMI values of the child population with intellectual disabilities and the factors affecting the BMI. In this study, father's education level, children's degree of disability, child’s having physical disability in addition to intellectual disability, child’s being dependent in terms of nutrient intake, and child’s having nutritional problems were determined as factors affecting BMI.
One of the important results of the study is that one in three children (34.8%) is overweight or obese. Like typically developing children, it is important to analyze and monitor the physical condition of children with intellectual disabilities. Further studies need to be carried out to provide a more in-depth examination of factors such as familial factors, nutrition and physical activities that trigger obesity in children with intellectual disabilities. Nurses should take a greater and more active role in the early detection of the problems of children with intellectual disabilities and in the development of interventions to promote and protect the health of children with intellectual disabilities and their families.
Footnotes
Acknowledgments
We thank İ.T., S.G., and T.T., who were undergraduate students at the time of the study, for their contribution to data collection and anthropometric measurements. We also thank the staff of the institution, parents and children included in the study for their contributions to the conduct of the study.
Declaration of conflicting interests
The author(s) declared no potential conflicts of interest with respect to the research, authorship, and/or publication of this article.
Funding
The author(s) received no financial support for the research, authorship, and/or publication of this article.
Ethical approval
The research was conducted within the framework of ethical considerations stated in the Declaration of Helsinki. Prior to the study, necessary permissions were obtained from the Non-interventional Research Ethics Committee of the Faculty of Medicine of Karabuk University (Protocol no: 2016/02-25) and the Karabuk Provincial Directorate of National Education (Protocol no: 41653020-605-E.2282280). Volunteering of both children and their parents was prioritized in the participation of children in the study. The parents of the children were informed about the procedure of the study and the confidentiality of the data and their verbal and written consents were obtained.