
Abstract
Pressurized corridor (PC) ventilation systems are a common method used in existing multi-unit residential buildings (MURBs) to deliver make-up air to individual units, and as a means of controlling inter-zonal odour/contaminant transfer. In PC systems, ventilation air is supplied directly to the common corridor and enters the units via intentional undercuts at the unit entry doors. In practice, the amount of ventilation air supplied to each unit is dependent on the air pressure differential between the two zones, which can be affected by occupant behaviours, such as window and unit exhaust fan operation; wind; or large indoor-outdoor temperature differentials. Accurately characterizing the impact of these variables on building pressure differentials is critical to not only identifying conditions when depressurization events may occur (which would result in a lack of ventilation to dwelling unit and the potential for contaminant movement from units to the corridor), but also understanding how operational changes can improve system operation. This paper will describe the development of an XGBoost regression model for predicting inter-zonal pressure differentials in a contemporary MURB with a PC system. The model was trained and validated using measurements collected as part of a 6-month field study in a 17-storey MURB located in Toronto, Canada, including corridor-to-unit and exterior-to-unit differential pressures, window/door operation, corridor supply air flow rates and interior/exterior temperature and relative humidity. Unit exhaust fan operation was inferred from the unit differential pressure data. This paper addresses feature selection, hyperparameter tuning and accuracy assessment, with a specific emphasis on evaluating the potential for the use of the model as a diagnostic tool and testing environment to evaluate ventilation system performance in multi-unit residential buildings.
Keywords
Introduction
Pressurized corridor (PC) ventilation systems have been used extensively to supply make-up air in existing multi-unit residential buildings (MURBs). In these systems, ventilation air is supplied directly to the common corridor. In theory, the supply air flow rate is sufficient to positively pressurize the corridor, relative to the dwelling unit, which drives the make-up air into the dwelling units via intentional undercuts at the entry doors. The positive corridor pressurization also helps to control inter-dwelling unit odour/contaminant transfer, which can occur via the corridor. In practice, these systems are sensitive to interference from occupant behaviours, such as window and exhaust fan operation (Maxwell et al., 2014; Proskiw and Phillips, 2008; Ricketts, 2014; Sheltair Scientific Ltd., 1998); wind and stack effect (Air Solutions Inc., 2005; Fine and Touchie, 2021; Proskiw and Phillips, 2008; Ricketts, 2014;) and interior leakage pathways (Enermodal Engineering Limited, 2002, 2003; Maxwell et al., 2014). This can cause uneven distribution of make-up air to the dwelling units and/or corridor depressurization, resulting in poor indoor air quality outcomes.
Previous studies assessing PC system performance have typically relied on simultaneous measurements of corridor supply air flow rates, inter-zonal differential pressures, occupant behaviours (e.g. window and/or exhaust fan operation) and/or weather variables over short or long periods (Air Solutions Inc., 2005; Lozinsky et al., 2023; Maxwell et al., 2014; Ricketts, 2014). In these studies, typical corridor-to-dwelling unit pressures ranged from −5 to +30 Pa, with lower pressure differentials found on floors near the bottom of the building (under this sign convention, a negative corridor-to-dwelling unit differential pressure indicates that the corridor is depressurized relative to the dwelling unit, that is, the PC system is not acting as intended). In-unit exhaust fan operation depressurizes dwelling units relative to the corridor, resulting in increased corridor-to-dwelling unit differential pressures; however, the magnitude of the effect is highly variable, with previous studies reporting changes in corridor-to-dwelling unit differential pressures ranging from +1 to +75 Pa, depending on the number of fans and their respective flow rates (Air Solutions Inc., 2005; Enermodal Engineering Limited, 2003; Ricketts, 2014; Sheltair Scientific Ltd., 1998). While these studies contribute to understanding PC system performance, analysing ventilation system performance using simultaneous measurements of differential pressure, occupant behaviours and weather conditions remains challenging. These interactions are complex and intertwined, making it difficult to isolate the influence of individual factors or to characterize their impacts accurately. To our knowledge, no prior studies have implemented a data-driven modelling approach to evaluate the effects of external factors – such as weather and occupant behaviours – on PC system performance. Machine learning models offer a novel solution by enabling flexible modelling of non-linear relationships and interactions without relying on predefined assumptions. While the current study focuses on data from a single building, this model provides a deeper understanding of PC system performance within that specific context. It allows for the systematic quantification of how key variables interact and influence performance within the building, which is not achievable with traditional analysis methods. Insights gained from even a single building are valuable for identifying critical factors and trends, offering a foundation for broader investigations in the future.
Scope of study
This paper describes the development of an extreme gradient boosting (XGBoost) regression model for evaluating the performance of a PC system in a contemporary MURB. The model was built using data collected from a prior field study Lozinsky et al., 2023. The main objectives of this paper are to: (1) evaluate the relative importance of different meteorological, building operation and occupant behaviour variables on dwelling unit-to-corridor pressure differentials (as an indicator of PC system performance) and (2) evaluate the potential utility of regression modelling for characterizing ventilation system performance.
Methodology
The following section describes (1) the case study building; (2) data collection procedures for the dwelling unit data used to build the model and (3) model development and assessment, including performance metrics, feature selection, hyperparameter tuning and feature importance assessment.
Case study building description and data collection
The case study building is a 17-storey, reinforced concrete MURB located in Toronto, ON, constructed in 2017. The building is a double-loaded corridor configuration running north-south, with most dwelling units facing either due east or due west. There are 343 dwelling units in the building, ranging from 35 to 85 m2 in floor area (377–915 ft2).
Ventilation air is delivered to the corridors via two supply grilles located at each end of the corridor. The make-up air units (MAUs) are operated on a set-back schedule, with reduced air flow rates between 9:00 and 11:00 am; and 1:00 and 4:00 pm; and 9:00 pm and 7:00 am. Average supply air flow rates for the normal and setback periods are 218 and 146 L/s, respectively (462 and 309 cfm), measured as part of the previous field study. Each dwelling unit is equipped with exhaust fans in the bathrooms (47 L/s/fan (100 cfm/fan)); kitchen (71 L/s/rangehood (150 cfm/rangehood)) and dryer (71 L/s/dryer (150 cfm/dryer)). The bathroom fan operates concurrently with the bathroom light, while the kitchen rangehood is occupant controlled. Dwelling unit heating and cooling is provided via recirculating fan-coil units.
Dwelling unit-level data was collected between February and September 2020 and included: indoor temperature and relative humidity; corridor-to-dwelling unit differential pressure; exterior-to-dwelling unit differential pressure; and sliding door, window and dwelling unit entry door operation. Six dwelling units were originally recruited to participate in the study: two each on the 3rd, 10th and 14th floors (one on each side of the building). This was done to evaluate differences in PC system performance based on elevation, that is, wind exposure, as well as location relative to the neutral pressure plane. Unfortunately, due to on-site conditions, we were unable to install the corridor-to-dwelling unit differential pressure sensors in the east-facing 10th floor dwelling unit and the 14th floor dwelling units. All other sensors were installed in these locations. Exterior weather variables including wind speed, wind direction, temperature and relative humidity were collected at 15-min intervals by a weather station installed on the roof of the building across the street. Air density was calculated using the MetPy package in Python (May et al., 2022), which employs equation (1) for the calculation.
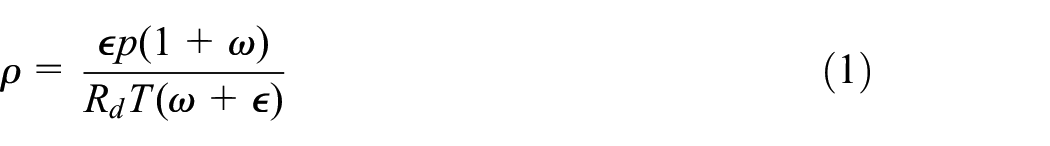
where ρ is the density of the air (Pa), ϵ is the molecular weight ratio – assumed to be 0.622 (Hobbs and Wallace, 2006), ω is the mixing ratio (dimensionless), Rd is the gas constant for 1 kg of dry air and T is the outdoor air temperature (K). The mixing ratio is a function of ϵ, the partial pressure of water vapour (calculated using outdoor temperature and relative humidity measurements) and the total air pressure.
Figure 1 shows a typical dwelling unit layout with equipment locations and Table 1 lists the equipment specifications. Dwelling units were recruited based on their location and residents’ willingness to participate in the study. Participating dwelling units were compensated with a smart thermostat. This research was approved by the Institution’s Research Ethics Board (protocol number: 38815).

Typical dwelling unit layout, with equipment locations.
Equipment specifications for dwelling unit monitoring.
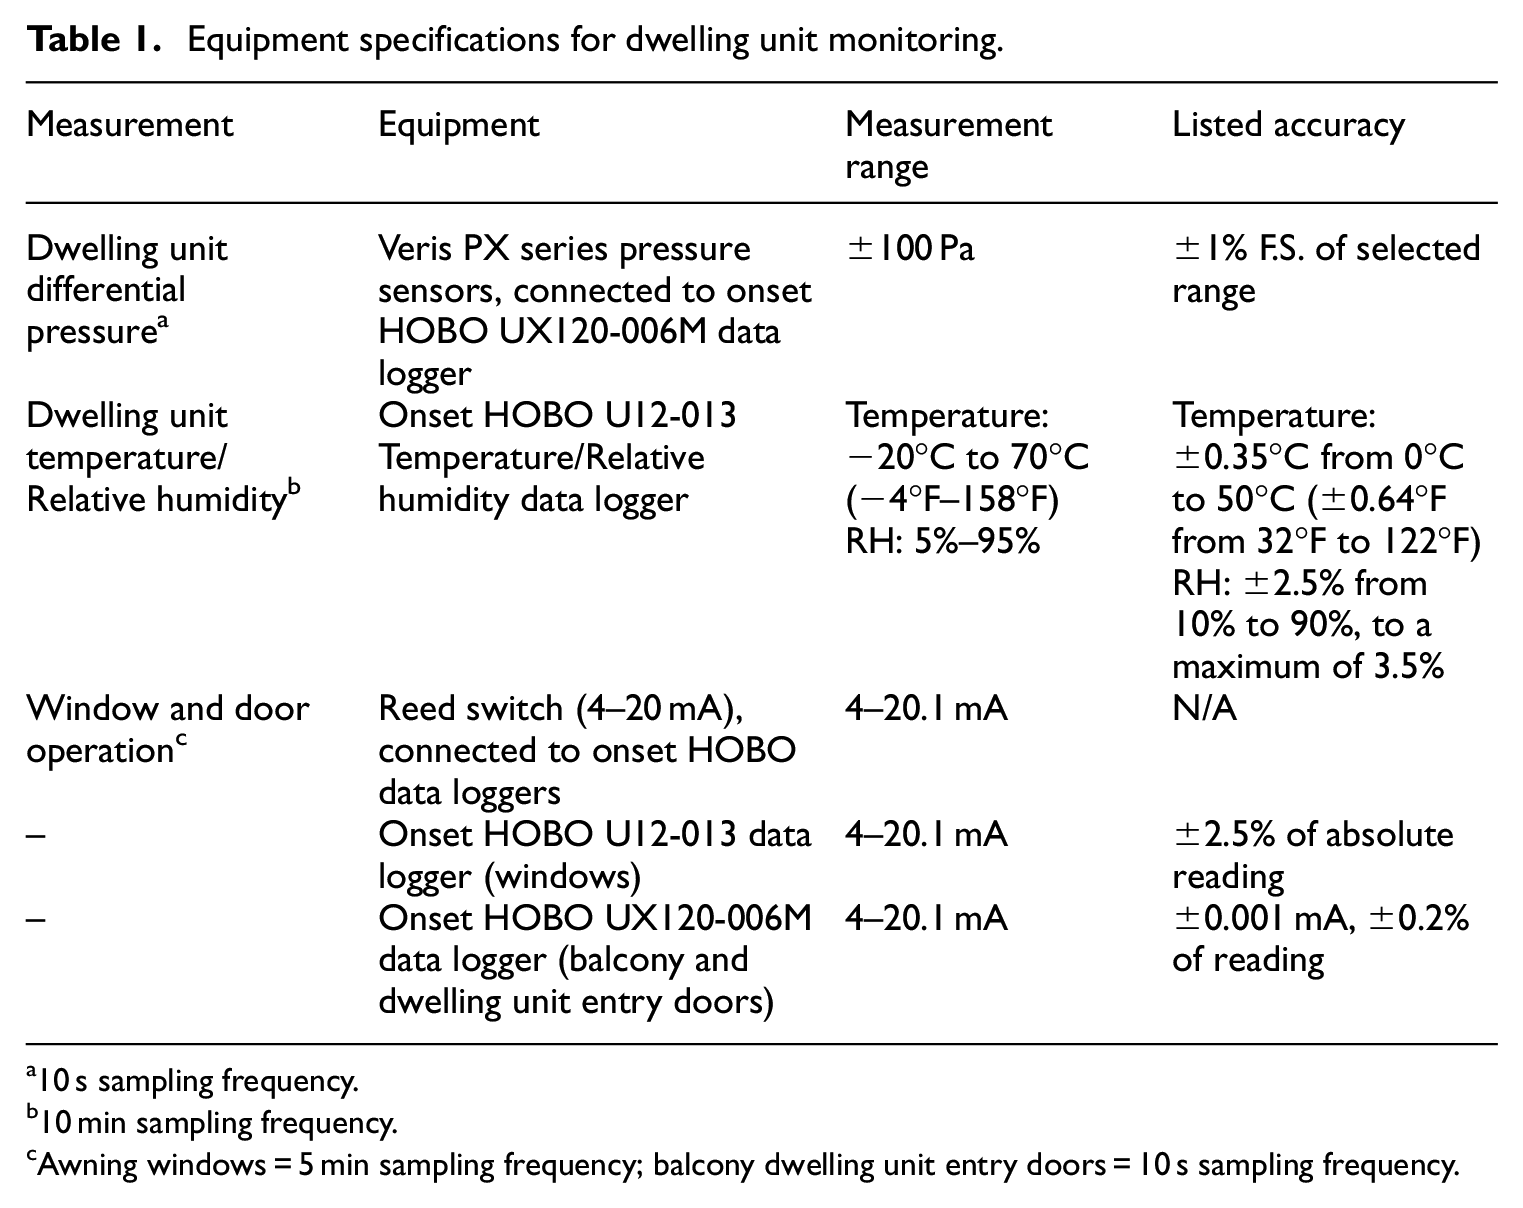
10 s sampling frequency.
10 min sampling frequency.
Awning windows = 5 min sampling frequency; balcony dwelling unit entry doors = 10 s sampling frequency.
While we did not measure dwelling unit-level exhaust fan operation explicitly, exhaust fan operation was easy to visually detect in the differential pressure data. Exhaust fan operation periods were first identified using heuristic classification models, which used the first and second derivatives of the differential pressure measurements (magnitude and direction of change) as well as the magnitude of the differential pressure measurement. First order, lowpass Butterworth signal filters were applied as necessary to reduce signal noise. These models were able to capture the majority of exhaust fan operations in the dwelling units. Exhaust fan operation data was then adjusted through visual inspection to correct both false positives and false negatives produced by the models.
Data preparation, model development and testing
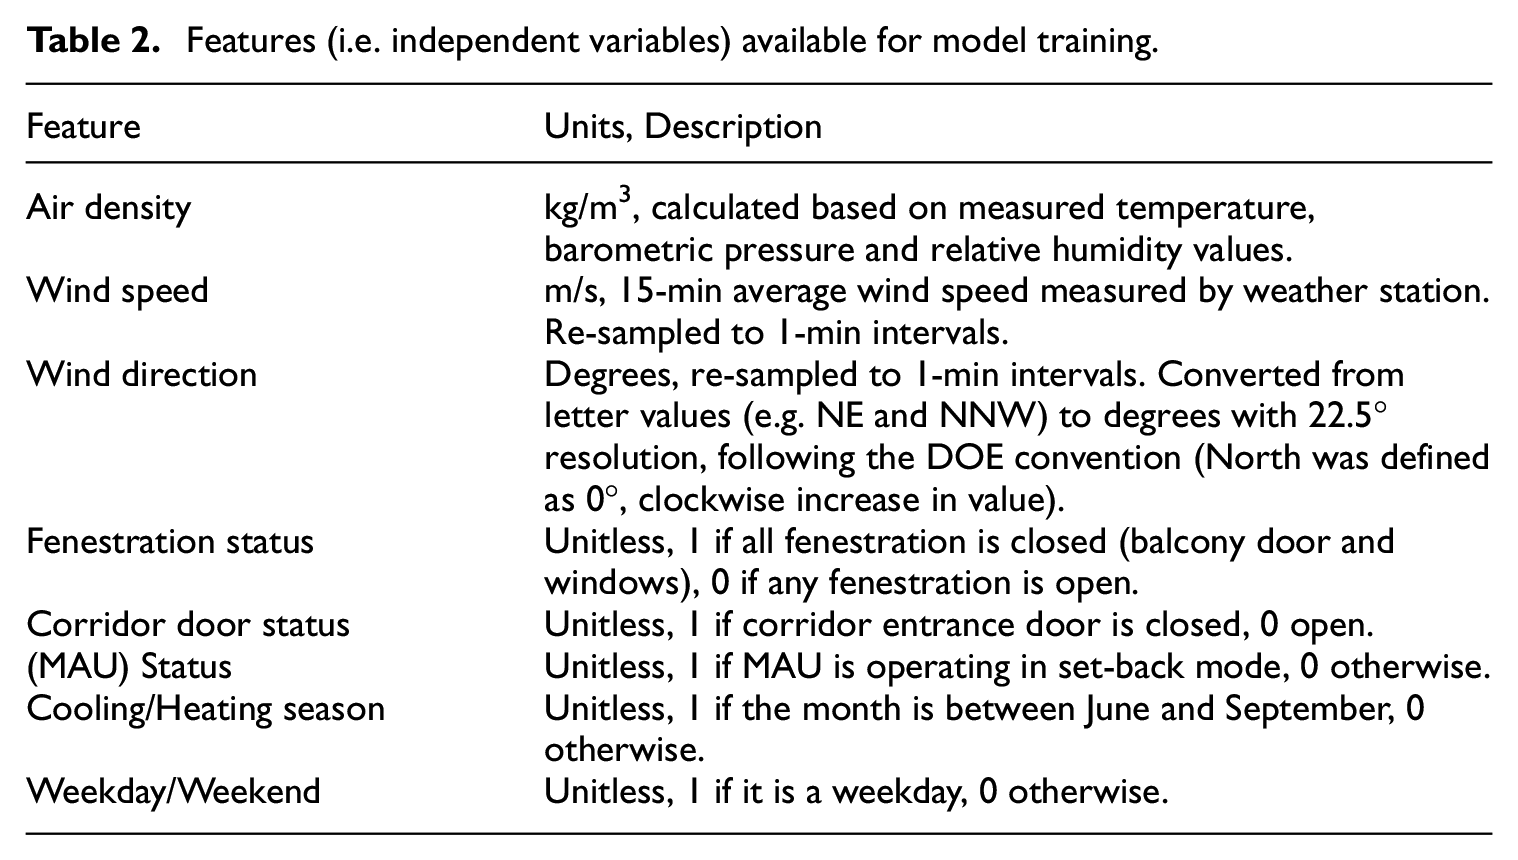
Extreme gradient boosting (XGBoost) regression models (Chen and Guestrin, 2016) to predict corridor-to-dwelling unit differential pressure for each individual dwelling unit were implemented in Python using Scikit-Learn (Pedregosa et al., 2011). The XGBoost algorithm is a supervised learning ensemble model. It was chosen as it has demonstrated strong performance in building energy use prediction (Ahmad and Chen, 2018; Ahmad et al., 2017; Candanedo et al., 2017; Divina et al., 2019; Lu et al., 2019; Robinson et al., 2017). Each dwelling unit was modelled individually, as the small sample size of dwelling units limited the information available for the model to learn the influence of dwelling unit characteristic data (e.g. building floor and orientation) on corridor-to-dwelling unit differential pressures. Table 2 shows the features available for model training. Table 2 includes a combination of meteorological, occupant behaviour and building operational variables. These variables were all measured during the field study (or were easily obtained after-the-fact). The variables were selected as potential features for model training based on previous work that has demonstrated their impact on PC ventilation system performance. Model features were linearly normalized between zero and one and categorical variables were transformed using one-hot encoding to create binary indicator variables for each category.
Features (i.e. independent variables) available for model training.
Prior to model training, available data were split into two subsets: 75% of the data were assigned to a training set for training and validation during model development and 25% of the data were assigned to a testing set for performance assessment. Additionally, 25% of the training dataset (i.e. 18.75% of the total data) was reserved for model validation during the training process, including to enable the use of the early stopping parameter in XGBoost. Early stopping was implemented for all models to enable the model to develop the necessary number of estimators to learn data trends, while limiting overfitting.
Model performance assessment
Model performance was evaluated on the testing data set using mean absolute error (MAE), mean absolute percentage error (MAPE) and root mean squared error (RMSE; shown in equations (2–4)),
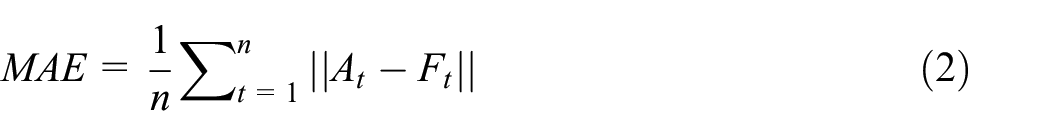
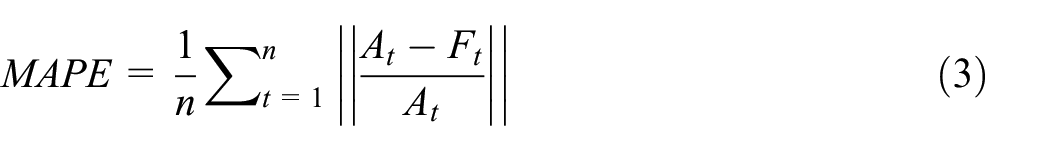
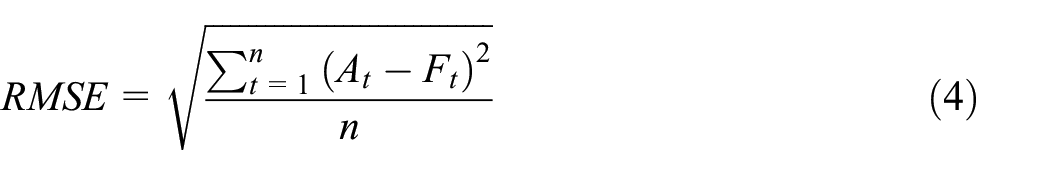
where n is the number of test values, At is the actual corridor-to-dwelling unit differential pressure and Ft is the predicted corridor-to-dwelling unit differential pressure.
Bland-Altman analysis (Bland and Altman, 1986), which is a standard approach to assess differences between clinical measurements methods, was used for visualization of model performance. This included plotting the residuals against the measured data, and calculating the upper and lower limits of agreement (LoA) using equation (5).

where
Feature selection
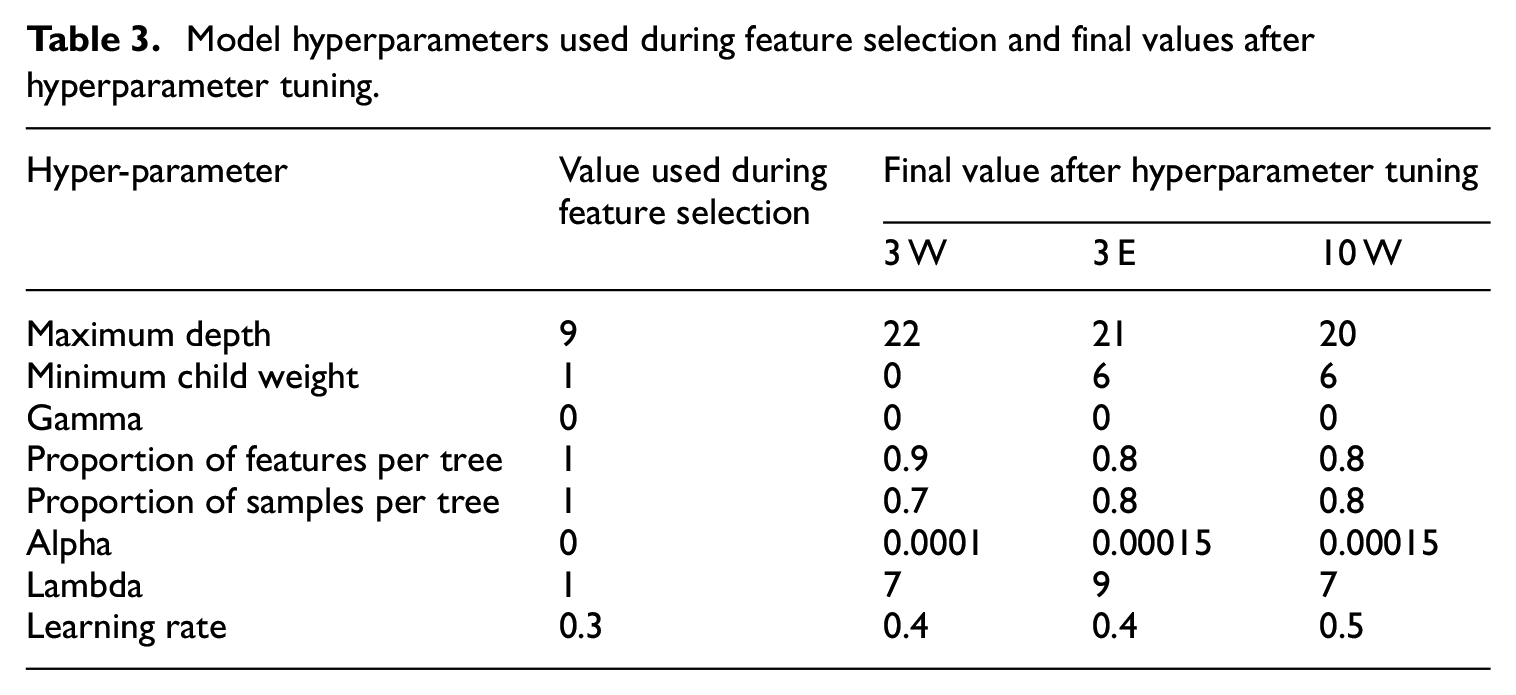
Due to the low computational intensity of the models, feature selection was completed using an exhaustive grid search. The hyperparameters used during model training are outlined in Table 3. Values are listed for the three dwelling units with corridor-to-dwelling unit differential pressure measurements. The dwelling unit labels indicate the floor of the dwelling unit, and its orientation (e.g. 3 W = the west-facing dwelling unit on the third floor). An XGBoost model was developed for each possible combination of features and the RMSE was calculated. The combination of feature sets that resulted in the lowest RMSE were selected for use in the final model. For all of the dwelling units, using all of the features outlined in Table 2 yielded the lowest RMSE.
Model hyperparameters used during feature selection and final values after hyperparameter tuning.
Hyperparameter tuning
Hyperparameters were selected using six stages of sequential tuning, using RMSE to assess model performance for each hyperparameter set. Parameters were tuned in the following order: (1) maximum tree depth and minimum child weight, (2) gamma (regularization), (3) proportion of total features and samples included in each decision tree, (4) alpha (regularization), (5) lambda (regularization) and (6) the learning rate. The final parameter values selected are shown in Table 3. Overall, hyperparameter tuning only produced a slight improvement in model accuracy in terms of MAE (between no change and 0.06 Pa). However, these changes were significant when corridor-to-dwelling unit differential pressures were small and led to notable improvements in the MAPE for 3E (MAPE reduction of 7%) and 3W (MAPE reduction of 50%).
In addition, the effect of the tree-building method (exact solution or GPU-enabled histogram approximation – gpu_hist) was tested. However, for one of the three dwelling units, using the ‘gpu_hist’ tree-building method resulted in significantly lower accuracy than the ‘exact’ method. This is worth noting, as gpu_hist is a commonly used tree-building method due to its improved computation efficiency. If increased model accuracy is needed, it may be worthwhile to conduct a sensitivity analysis to determine whether the exact method can improve model accuracy.
Feature importance assessment
After feature selection and hyperparameter tuning were completed, the relative importance of each parameter on model performance was assessed. Three approaches were used: (1) mean decrease in impurity (MDI), (2) permutation importance and (3) Shapley Additive explanations (SHAP) values.
MDI is commonly used to assess feature importance for tree-based models and is a function of the decrease in node impurity when a tree splits on an individual feature, averaged across all splits. While MDI is computationally efficient, this calculation of feature importance has several notable biases (Agarwal et al., 2023). These include bias towards variables with high cardinality, misleading importance of correlated features and skewing based on data distribution.
Permutation importance is calculated by first assessing a model’s performance on a dataset, then randomly shuffling each feature in the dataset one at a time and re-assessing performance. Each feature’s importance is determined by how much the performance metric decreases when that feature’s values are shuffled. This process does not have the same biases related to feature cardinality and dataset distribution; however, it can result in misleading importance values for correlated variables.
SHAP values adapt methods from cooperative game theory and accounts for interactions with other features (Lundberg and Lee, 2017). SHAP values offer a robust method for assessing feature importance; however, their calculation is computationally intensive.
Results and discussion
First, overall model performance is described, followed by a discussion of feature importance/model interpretation.
Model performance
Table 4 lists the feature importance metrics for the three modelled dwelling units for (1) the full data set, (2) time steps when the window and balcony door were closed and (3) time steps when the exhaust fans were turned off. While MAE values are small in absolute terms and physically meaningful within the context of differential pressure measurements, the MAPE values indicate that these errors represent a significant proportion of the measured pressures during certain periods of system operation, particularly when differential pressures are low. Based on the field measurements, the average winter-time corridor-to-dwelling unit differential pressure was 4.7, −0.1 and 13.2 Pa, for 3 W, 3 E and 10 W, respectively Lozinsky et al., 2023.
Model performance metrics across different evaluation subsets.
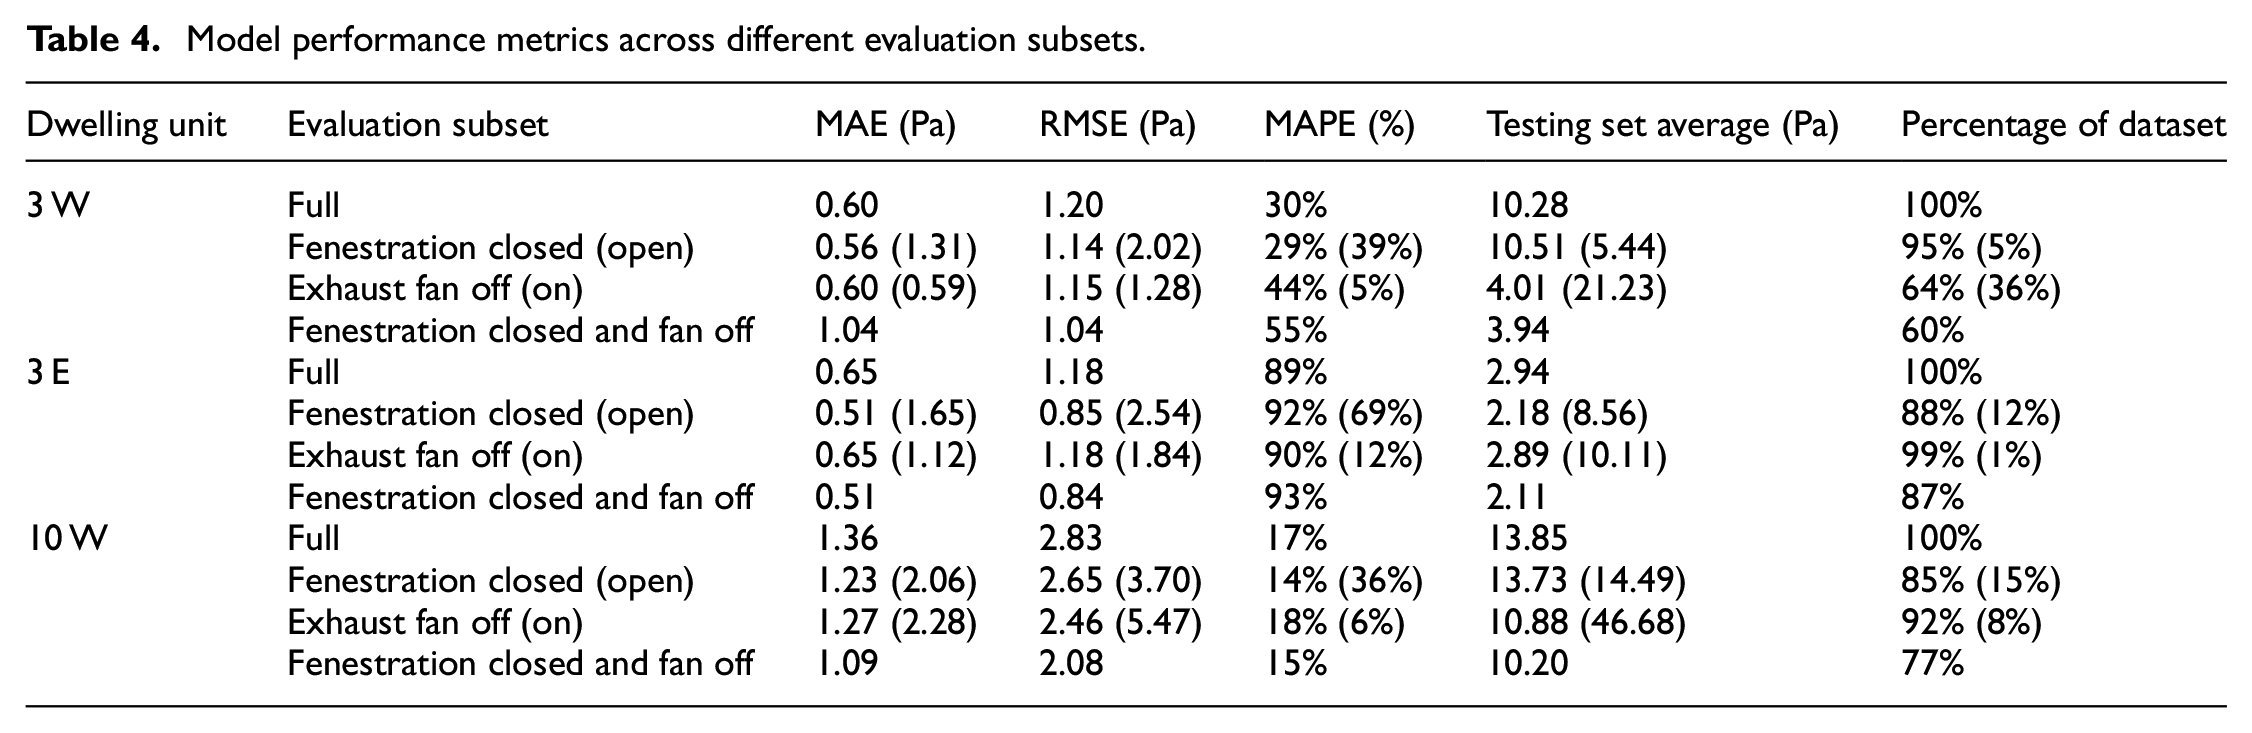
Figure 2 shows the Bland Altman residual plots for each dwelling unit model. Plots of the model residuals as compared to measured data showed a bias of 0.00 Pa for both third-floor dwelling units and a bias +0.01 for dwelling unit 10 W (i.e. the model predicted a differential pressure that was 0.01 Pa higher than the actual measured data on average). Based on the calculated LoAs, 95% of the residuals for the two third-floor dwelling units are expected to fall between the bounds of +2.36 and −2.35 Pa and 95% of the residuals of 10 W are expected to fall between +5.67 and −5.65 Pa. Visually, it is clear that there is little proportional bias (e.g. biases where the residuals/error increase or decrease with the magnitude of measurement), as the residuals for all plots are roughly evenly distributed around the bias line. Several graphs of model predictions versus measured data for 24-h periods in each of the dwelling units were also considered, to understand how model predictions trended with actual data. Two examples of these plots are shown in Figure 3. Visually, these graphs show that the models generally perform well at identifying trends, however they have challenges in accurately estimating the actual magnitude, particularly around spikes due to sudden changes in wind speed and/or direction. In part, this can be attributed to mismatches in data collection frequencies: differential pressures were measured at 10 s intervals, while weather variables were measured at 15-min intervals. Wind can exhibit high spatial and temporal variability, which was not fully captured by the 15-min weather measurements. During initial data post-processing, we aggregated differential pressure data to 1-min intervals, to remove some of the noise caused by variations in wind speed and direction. Aggregating the data to a larger interval may have improved model accuracy, however we would have lost significant temporal resolution.
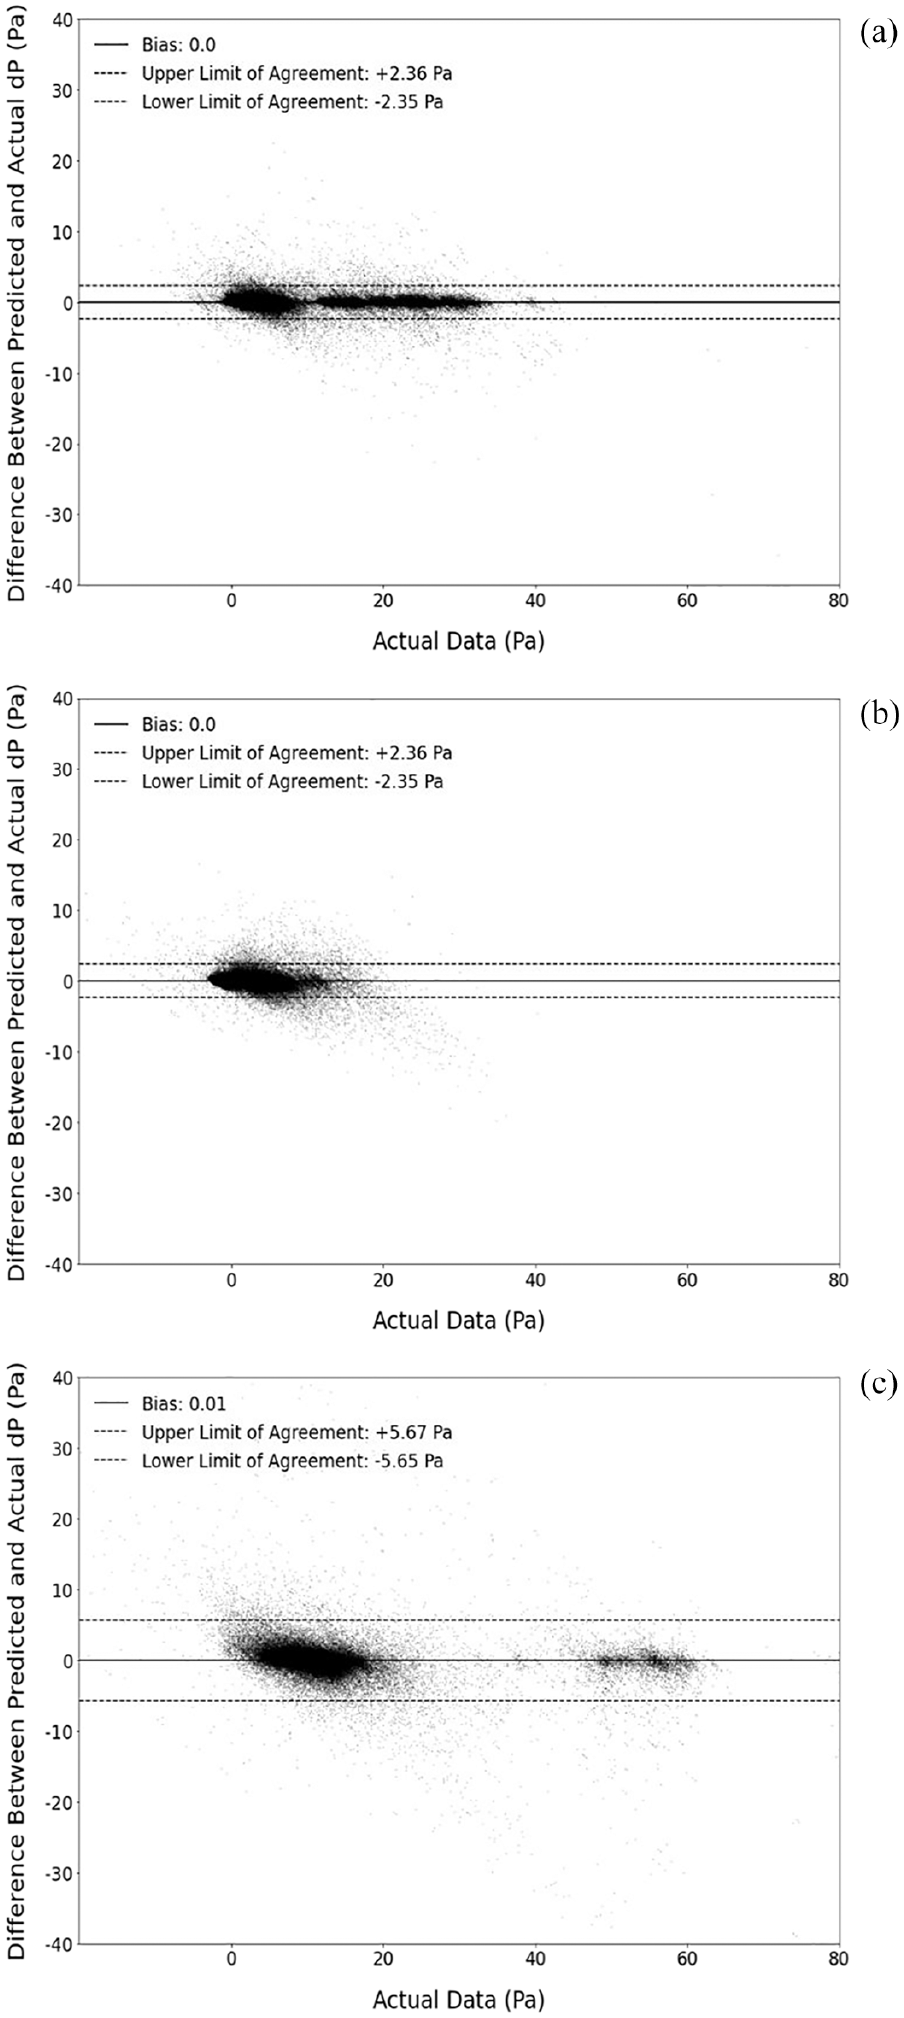
Plots of the differences between measured and predicted corridor-to-dwelling unit differential pressures for the test data sets for (a) 3 W, (b) 3 E and (c) 10 W.
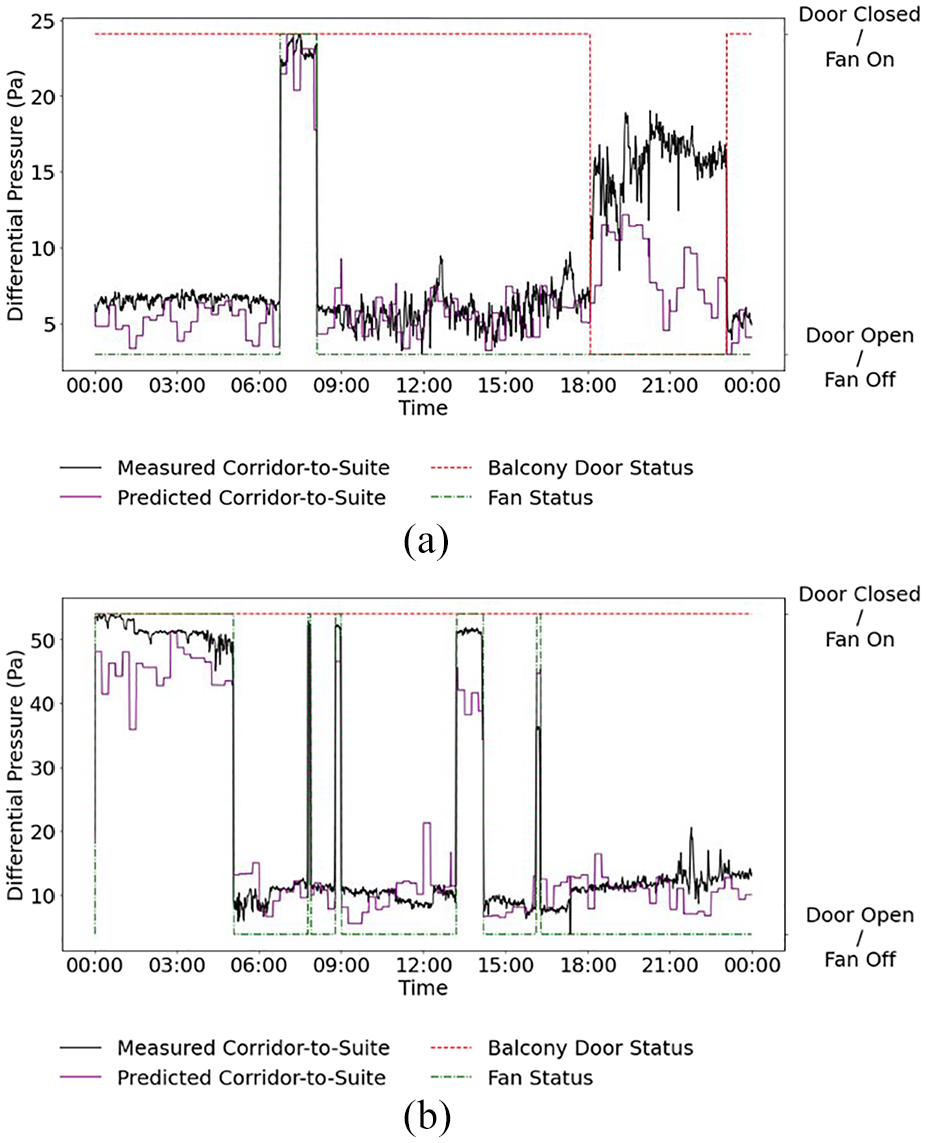
Plots of the measured and predicted corridor-to-dwelling unit differential pressures for (a) 3 W on June 29, 2020 and (b) 10 W on June 2, 2020, for a single day in June. The data for both dates were exlcuded from model training data.
Limitations of available data also contribute to accuracy limitations. For example, as shown in Figure 3, the predicted effect of exhaust fan operation shows poor agreement with the measured data. This is likely a result of different types and combinations of exhaust fans operating in the dwelling unit (e.g. kitchen rangehood, bathroom and dryer). As noted in the Methodology section, exhaust fan operation was not measured directly, but was inferred from the differential pressure data. This method was able to detect when an exhaust fan was operating, but could not identify which fan, or if multiple fans were operating. Depending on which exhaust fans were used, there would be differing impacts on corridor-to-dwelling unit pressure differentials. This information is not captured in the explanatory variables (which simply indicate if dwelling unit exhaust fans are on or off) and as such, it is not possible for the models to learn these subtleties.
Feature importance
Figure 4 shows the MDI, Permutation Importance and SHAP values for each feature in the models. Note: MDI is shown on a separate x-axis from the Permutation Importance and SHAP values as it is a unitless value between 0 and 1, whereas the other two metrics are represented in the same units as the model output (Pa). While MDI is commonly used for assessing feature importance in tree-based models, it does not show agreement with the overall feature importance suggested by Permutation Importance or SHAP methods (more rigorous methods of evaluation). MDI and SHAP values have relatively high agreement for exhaust fan status in dwelling units 3 and 10 W and, to a lesser extent, weekday/weekend in dwelling units 3 W and 3 E. This may be due to the low cardinality of these features. As discussed in the Methodology, MDI is biased towards features with high cardinality; however, this does not explain why other low cardinality features (MAU modulation, heating/cooling season, fenestration status and corridor door status) show poor agreement. Further analysis is required to determine the cause of this trend. The calculated feature MDIs suggest that many features that we know to significantly impact corridor-to-dwelling unit pressures based on physical models are not important in producing accurate predictions (e.g. outdoor air density, which together with indoor air density drives stack effect). SHAP values and, to a lesser extent, Permutation Importance, on the other hand, highlighted that these physical parameters do, in fact, impact prediction accuracy.
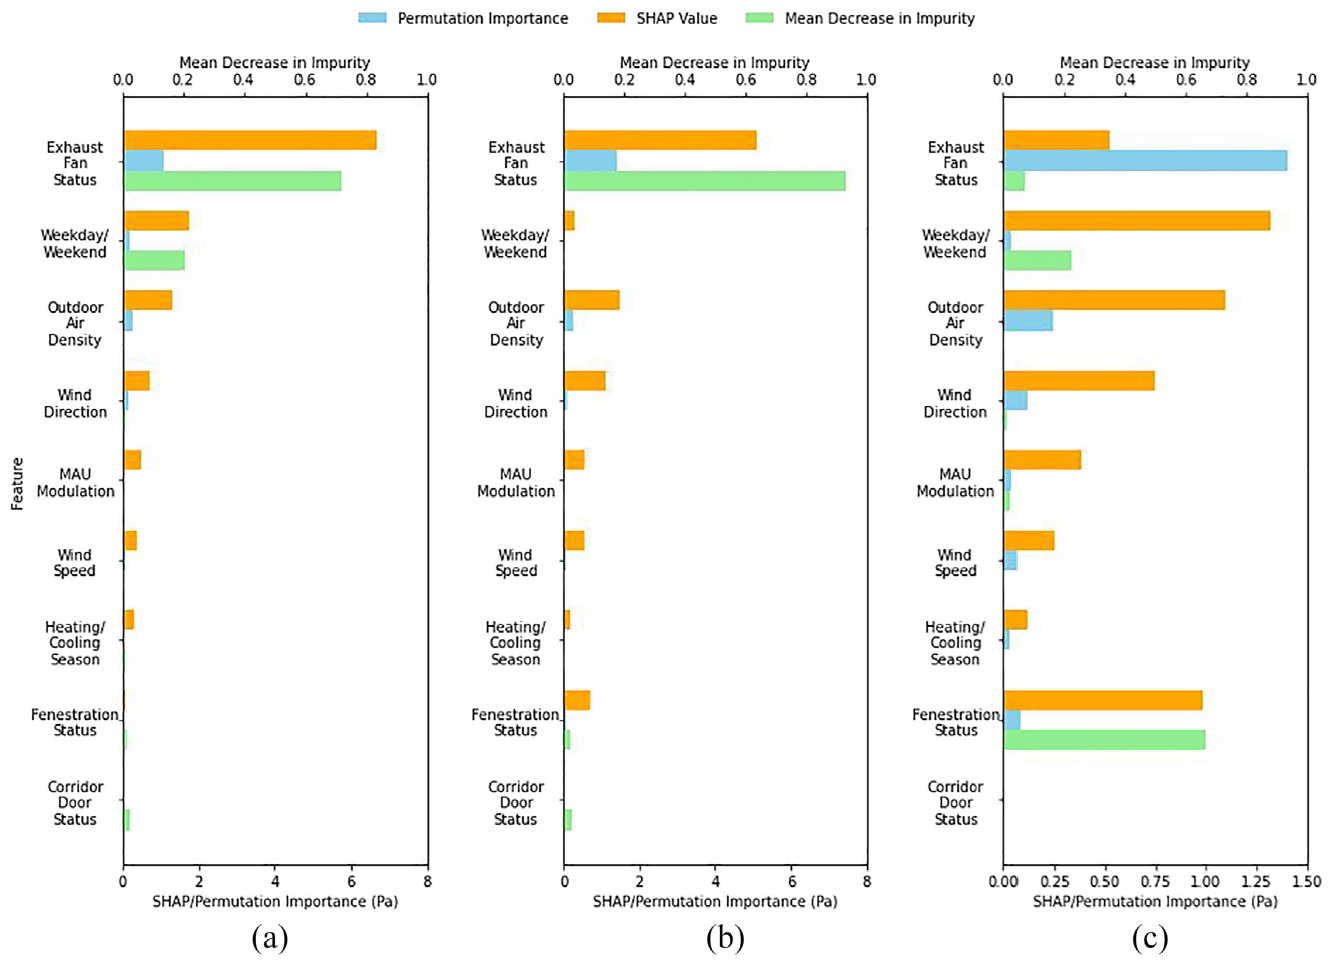
Feature importance metrics (MDI, SHAP and Permutation Importance) for (a) 3 W, (b) 10 W and (c) 3 E. Note the difference in scale for the x-axis in (c), in order to better visualize the relative importance of different SHAP and Permutation Importance values for 3 E.
Dwelling unit 3 E had low MDI and SHAP values for exhaust fan operation, compared to 3 and 10 W. This could be explained by 3E’s infrequent use of exhaust fans. When exhaust fans were used, the induced differential pressure changes were always very small in magnitude and range, suggesting a single fan used infrequently and in isolation. In contrast, 3 and 10 W used their exhaust fans more frequently, with larger ranges and magnitudes for the corresponding induced differential pressures, indicating that the occupants used multiple fans in different configurations. Unlike MDI and SHAP values, which are biased against rare events, Permutation Importance is not affected by event frequency, which could explain the difference between the three metrics. Wind direction was more important than wind speed for all models, with relatively similar Permutation Importance and SHAP values. This is consistent with previous studies, which found that wind has a largely local effect on inter-zonal differential pressures near the windward elevation (Ricketts, 2014). The relatively low importance of both wind direction and wind speed, compared to outdoor air density, is also largely consistent with physical models. Wind-induced inter-zonal pressure differentials are highly transient and localized, whereas the impacts of stack effect are larger in magnitude and temporally stable.
Interestingly, the effect of window and/or balcony door operation (‘Fenestration Status’) is inconsistent, both between the three metrics and the three models. Similar to the exhaust fan operation, this variability may be due to differences in fenestration operation patterns and the frequency of fenestration opening events in the datasets.
The feature importance analysis highlights that there is no ‘one-size-fits-all’ approach to evaluating feature importance in tree-based models. MDI demonstrated moderate bias towards high cardinality features and against rare events, often failing to detect the importance of features that physical models suggest are significant. By contrast, SHAP and permutation importance were mostly consistent with each other and aligned with physical models. These findings underscore the value of using multiple feature importance metrics in tandem with domain knowledge to derive meaningful insights.
Furthermore, while feature importance metrics provide valuable insights into the relative contributions of individual features within the model, they should be regarded as tools to guide understanding rather than definitive indicators of real-world significance or causal relationships. Different prediction goals (e.g. predicting average differential pressure versus differential pressure during infrequent events) can lead to variations in feature importance rankings. SHAP values emphasize overall contributions, including interactions, and are well-suited for understanding general model behaviour. In contrast, permutation importance directly measures the impact of individual features on model performance and is particularly useful for rare events, as it evaluates features without being biased by event frequency.
Conclusion
We developed an XGBoost model to assess the relative impact of various factors, including weather and occupant behaviours, on PC system performance. The model was trained and validated using measurements from a 17-storey contemporary MURB located in Toronto, ON. This paper summarizes the model development including feature selection, hyperparameter tuning and accuracy assessment, with a specific emphasis on evaluating the potential of using the model as a diagnostic tool and testing environment to improve ventilation system performance.
Feature importance for Units 3 and 10 W were relatively consistent, with exhaust fan operation rated as the most important feature by all three feature importance metrics (MDI, SHAP and Permutation Importance). Day Type (Weekday/Weekend), outdoor air density and wind direction were rated as moderately important, though there was some disagreement between the three importance metrics. Feature importance for Unit 3 E was highly variable and generally did not align with the other units. The SHAP and Permutation Importance metrics were also mostly consistent with physical models.
Dwelling unit-specific feature importance was influenced by the relative frequency of specific events, as the model did not have sufficient data on which to train. This could partially explain the inconsistent results for Unit 3 E, which rarely operated the exhaust fans and/or windows. This effect could be mitigated by increasing the data collection period in field studies. A more practical (and cost-effective) solution could involve the use of synthetic data, to ensure that feature events are more evenly represented. In general, SHAP and/or Permutation Importance metrics were more useful than MDI for evaluating feature importance: the use of MDI as the sole metric for assessing feature importance would have under-represented the impact of many features (e.g. wind direction) on differential pressures. Likely, this is due to the lower bias of SHAP values and Permutation Importance based on dataset distribution and feature cardinality as compared to MDI.
Differences in data resolutions between the differential pressure and weather data (wind speed and direction) also introduced model inaccuracies. We originally aggregated the differential pressure data to 1-min intervals. A larger bin size, closer to the data collection frequency of the weather data would likely reduce model inaccuracies caused by data resolution mismatch.
This model was trained and validated using data from a single building. Additional data would be required to improve the external validity. That said, we found that this was a useful way to characterize system performance, especially for hard-to-isolate variables like wind speed and direction, which do not lend themselves well to manual estimation techniques. This paper provides other researchers with guidance on model development and analysis techniques for similar applications. Future work will focus on using the model to predict corridor depressurization events and understand how we can better improve PC system performance.
Footnotes
Acknowledgements
The authors would like to thank the condominium board, residents, and operations and property management personnel for their co-operation during the study and their willingness to accommodate this research initiative.
Declaration of conflicting interests
The author(s) declared no potential conflicts of interest with respect to the research, authorship, and/or publication of this article.
Funding
The author(s) disclosed receipt of the following financial support for the research, authorship, and/or publication of this article: This work was funded by the Natural Sciences and Engineering Research Council of Canada (NSERC Discovery Grant RGPIN-2016-06234 and NSERC Post-Graduate Scholarship PGSD3-547141-2020), and ASHRAE’s New Investigator Award. The authors would also like to thank ecobee for their financial and in-kind support.