
Abstract
This study assesses the hygrothermal performance of the Photovoltaic External Thermal Insulation Composite System (PV ETICS), using a thick layer of mortar with Phase Change Material (PCM) granules as a passive heat sink. The experimental scenario involved the wall system exposure to real outdoor climate conditions during a 20-month long measurement period. Measured data were compared with results from the hygrothermal modelling. The findings reveal that with carefully designed diffusion channels the PV ETICS demonstrated no accumulation of moisture behind the vapour-tight PV panel. Long term hygrothermal modelling for PCM mortar moisture content with a previously calibrated model predicted stable moisture content around 0.03 m3/m3, significantly lower than the moisture content during first 2 years. Relative humidity behind the PV panel falls into the hygroscopic range on the second spring after the construction. The annual maximum temperatures for PCM mortar during two summers were 69°C, occurring in mid-August. Risk analysis was conducted with historic climate data to understand, whether higher PCM temperatures could be reached in the same climate for different years. Overall, the wall system showed no signs of extensive moisture damage during the testing period, but slight discolouring of the PCM mortar was recorded. This study contributes valuable insights into the practical viability of PV ETICS with PCM mortar, reaffirming its potential for application on larger scale on real building facades.
Keywords
Introduction
To mitigate global carbon emissions, there has been a significant surge in electricity production from renewable sources. The energy performance of buildings directive (EPBD (recast), 2021) requires that for future zero-emission buildings, their very low energy demand will be fully covered by energy from renewable sources that are generated on-site or nearby. According to estimates provided by (Defaix et al., 2012), building-integrated photovoltaic (BIPV) systems in 27 EU member states possess a technical potential of 951 GW and could produce 840 TWh of electricity. This amount equals 22% of the EU’s total electricity consumption projected for 2030. The study finds that 20% of south-facing facade areas were suitable for BIPV installation. For example, in Germany, residential buildings accounted for 67% of the total facade surface potential, far outnumbering non-residential potential (Defaix et al., 2012).
More than 25% of the global energy demand (Nejat et al., 2015) and 28% of the final energy demand of households in the EU (European Commission, Eurostat, 2020) is attributed to residential buildings. For multi-storey apartment buildings, the available roof area might not be sufficient to accommodate an adequate amount of photovoltaic (PV) capacity, necessitating the wider use of facade systems. It has also been described by (Díez-Mediavilla et al., 2019), how the facade PV diversifies the locally generated solar energy mix by producing high outputs during different months and hours compared to rooftop PV.
Typical BIPV facade applications available on the market have a ventilated air cavity. The air gap behind the PV influences electricity generation efficiency and contributes positively to hygrothermal performance of the whole wall system. A study conducted in Hong Kong determined that the optimal thickness of the air gap for PV facades in terms of thermal performance is 6 cm and maximum PV temperatures exceeding 65°C for ventilated facade occur in October (Peng et al., 2013). Further decrease in peak PV temperatures would be possible to achieve with force ventilated PV facades. For example, in India, mathematical correlations were recently developed to calculate the overall energy performance for semi-transparent PV facades with ventilated air-cavities ranging from 5 to 25 cm (Preet et al., 2024). However, in colder climates, less complicated passive cooling solutions could be more reasonable.
Durability of ETICS facades
It is crucial to not only incorporate PV technology into the facades but also ensure adequate thermal insulation and hygrothermal performance. The thermal transmittance of external walls for near-zero Energy Buildings (nZEB) varies between 5% and 50% of total energy loss depending on climate and member state regulation (Kalamees et al., 2016).
One widely used solution for facade insulation is the External Thermal Insulation Composite System (ETICS; Xu et al., 2023). In Europe, the market size for ETICS in 2017 was approximately 234 million m2/year (IPN, 2017). Compared to ventilated facades, ETICS is a more affordable option due to its reduced number of layers (IPN, 2017) and reduced mass. In comparison to a ventilated facade, the ETICS facade has a lower carbon footprint value in the material production and installation phase, although it increases significantly when system maintenance and lifespan are considered (Baptista et al., 2024; Kertsmik et al., 2023).
The lifespan of ETICS tends to be shorter than that of ventilated facades due to the higher risk of moisture-related damage. Unlike ventilated facades, ETICS relies solely on the facade plaster system for protection against climate loads. Inadequate workmanship can lead to various defects in each layer of the ETICS system, resulting in a loss of technical performance (Sulakatko et al., 2017). Using artificial neural networks, a study conducted in Portugal estimated the average service life of ETICS to be 21 years (Tavares et al., 2020). But climate loads and deterioration risk tend to be higher in cold climate. A thorough study in Estonia found that most defects, identified through visual inspections, tend to appear within 1–6 years and are mainly caused by high moisture and temperature loads, design flaws and application errors (Liisma et al., 2016).
PV temperature control with PCM
According to the definition, the ETICS system does not include a ventilation cavity. Therefore, it would be impractical to introduce a full ventilation cavity behind the PV panel. Consequently, an alternative solution must be employed to mitigate the overheating of the PV panels. One potential option to address this issue is the utilization of phase change materials (PCMs). In previous studies, using cement-based mortars containing encapsulated 11 wt% of PCM granules has led to energy savings of up to 33% for heating and 31% for cooling in hot-dry climates (Gbekou et al., 2024). By adding PCM to ETICS that contains BIPV we get an advanced building envelope solution – energy activated ETICS (En-ActivETICS; Heim et al., 2020) where the risk of surface overheating is lower (Heim et al., 2021).
For En-ActivETICS a PCM mortar was developed with pure PCM mass content of 20 wt%, consisting of a combination of three different PCM materials (RT25HC, RT28HC and RT35HC). These three PCMs were chosen based on comprehensive thermal modelling for various central and northern European climates and was considered the optimal combination (Heim et al., 2023b). The chosen approach involves the passive use of microencapsulated PCM granules mixed with cement-based mortar. This method eliminates the need to transfer the PCM from the facade to the indoor space, reducing the number of components that need to be moved and potentially minimizing the risk of leaks. Additionally, this approach offers a cost-effective solution. By encapsulating PCM wax inside small granules and incorporating them into the mortar, the quantity of pure PCM required is reduced, also limiting the use of materials with significant environmental impacts such as aluminium cases for PCM. Furthermore, in addition to the latent heat of the PCM, the thermal mass of the cementitious mortar is utilized.
Previous theoretical studies on the PV-PCM facade system have utilized calculations to demonstrate that the facade with a 30mm PCM mortar mitigates extreme temperature peaks ≈10 K and results in a ≈2% higher electricity production compared to the reference case without PCM (Talvik et al., 2021). Conversely, if PCM mortar were not employed behind the PV panel, temperatures would rise as high as 83°C in Tallinn and 91°C in Madrid (Talvik et al., 2021), in the latter case, surpassing the recommended operating temperature limit of 85°C (Hasan et al., 2015).
It is important to acknowledge that the temperature limit applies to the physical and material constraints of PV panels; thus, even PV panels that are not actively generating electricity should not exceed this threshold. To ensure a safety margin during experiments only with electricity-producing PV panels, the operating temperature threshold should be increased by a few degrees.
Experimental studies have previously been conducted in Poland on the same system under real climate conditions. These studies found that the maximum temperatures of the PV panels reached 63°C in August (Heim et al., 2023a). It was also revealed that without the PCM mortar behind the PV panels, the temperature would have been 74°C and with black-coloured facade plaster, the observed temperature reached 75°C. However, this PV-ETICS facade system has never been tested before in colder climates, and its hygrothermal behaviour has not been monitored.
Strategies to avoid moisture accumulation behind vapour tight PV
PV panel makes En-ActivETICS exterior surface vapour-tight (Ilomets et al., 2020), which can lead to moisture accumulation inside the thick PCM mortar layer and could result in moisture or frost damage and is not a suitable solution for cold climate areas. In this concept, there are two potential mechanisms to prevent excess moisture from diffusing into the facade and accumulating: either reducing the area covered by the PV panels to allow the moisture to dry out through the traditional facade plaster surface or creating an additional pathway for the moisture to be drained out. Previous research based on hygrothermal modelling also indicates that there is a risk of moisture accumulation in all five analysed locations if diffusion channels are not introduced (Heim et al., 2023b). Therefore, a solution without diffusion channels cannot be recommended for implementation. Taking this into consideration, this research focusses only on one cross section with diffusion channels.
Another critical factor in determining the durability of an ETICS facade is the potential for water leakage through cracks. ETICS systems are designed to function effectively only if there are no water leakages through the facade plaster system. However, facade cracking is relatively common due to various imperfections during the application (Sulakatko et al., 2017), and water leakages tend to result in the widening of cracks and the acceleration of the deterioration process. In the case of En-ActivETICS, the cracks could also be caused by the different deformations between the facade plaster and the PV panel. Through larger cracks, water could spread inside the insulation layer between the rigid insulation boards and within the partial cavity between the insulation and structural layer. It is important to consider the lateral spreading of water inside the cavity and the surface texture of the materials on the boundaries of the cavity (Van Linden et al., 2022). Due to the complexity of the water spreading processes, the most efficient solution is to drain the water near the outermost layer of the facade installation.
The risks associated with water leakages and high initial moisture content becomes even more critical if the facade surface is partially covered with a vapour-tight PV panel instead of a facade plaster system, which has relatively low water vapour diffusion resistance. A cross-section without diffusion channels behind the PV panel has also been previously tested in a climate chamber and performed relatively well until water leakage was introduced (Talvik, Ilomets, et al., 2023). Therefore, the diffusion channels must be incorporated behind the PV panel. These channels have been tested in a climate chamber under extreme conditions and were found to be sufficient for accelerating the drying out process of the PCM mortar behind the PV panel, both on expanded polystyrene (EPS) and mineral wool (MW) insulations. Furthermore, any water that may leak inside the wall system can drip out through these channels.
The aims of this study were the following:
(1) To determine the maximum temperatures of PV panels and PCM mortar in Estonia’s cold climate (humid continental, warm summer), ensuring the durability limits of PV panels are not exceeded;
(2) To demonstrate the absence of moisture accumulation in PCM mortar with diffusion channels through hygrothermal measurements and modelling;
(3) To evaluate durability of the thick PCM mortar behind the PV panels after being exposed to cold climate conditions.
Methods
Test wall installation
Test wall installation, combining a traditional ETICS facade with a novel PV panel and PCM mortar section, was built as a southern facade of the Tallinn University of Technology test facility between May and June 2021. Installation is the same En-ActivETICS facade system, that had been previously tested in climate chamber for hygrothermal performance (Talvik, Ilomets, et al., 2023) and in the climate of Poland for thermal performance (Heim et al., 2023a). The facade system utilizes vertical diffusion channels embedded within PCM mortar to manage excess moisture behind vapour-tight PV panels. A PCM mortar section behind the PV panel has four triangular diffusion channels with a cross-sectional area of 400 mm2 and spaced 120 mm apart. These channels are open at the bottom, allowing condensate to drip onto a sloped steel sheet beneath the PCM mortar, which then directs the water out of the wall system. A second steel sheet, attached to the back of the PV panel, extends vertically to protect the diffusion channels from wind-driven rain. The channels are sealed at the top, thereby limiting airflow to micro-convection. PCM mortar is anchored on the structural layer, and steel wire mesh is used to reinforce the thick mortar. There was a 2-week period in May 2021 for the PCM mortar to dry out before the application of the PV panel. Afterwards, traditional facade plaster was applied on the EPS insulation around the PV panel. Additional information about the construction process and initial dry-out process of the facade system could be found in (Talvik et al., 2022).
To make it possible to replace the PV panels, a solution was developed with steel sheet ribbons glued on the back side of the PV panel. The starting profile of the facade plaster is fixed on the steel ribbon instead of the PV panel itself, which makes it possible to replace PV panels without the need to repair the facade plaster system. Deformation profiles were installed along the boundary between the PV panel and facade plaster to mitigate the deformations caused by the joining of materials with different surface temperatures.
The load-bearing layer of the test wall was made of 150 mm of autoclaved aerated concrete (AAC). All of the facade was insulated with EPS (λ = 0.032 W//(m K), µ = 30), 160 mm for the PCM mortar and PV area and 200 mm for the traditional ETICS area (Figure 1). Inside the PCM mortar, the granules were chosen to be the combination of three different PCM waxes with nominal melting temperatures of 25°C, 28°C and 35°C.
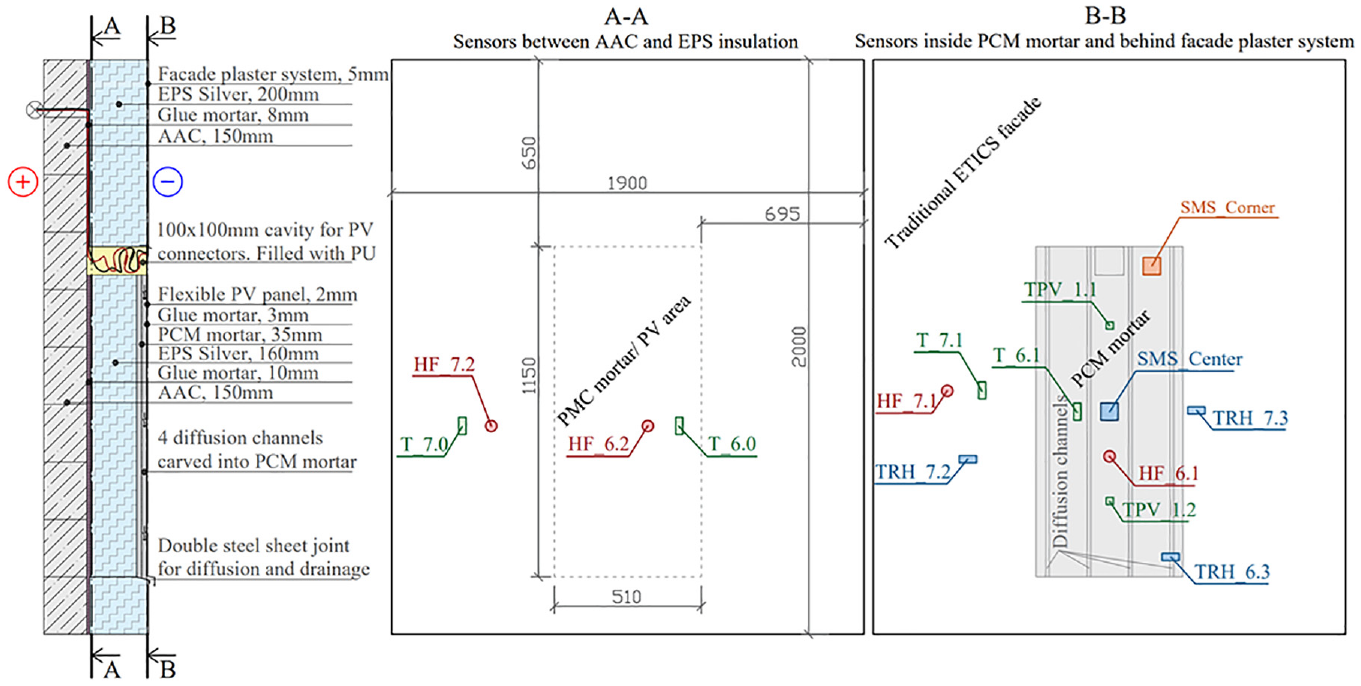
Cross section of the test wall and two sections with sensors.
Sensors inside the test wall
Inside the wall, different sensors were installed between the AAC structure and the insulation, inside the PCM mortar and behind the facade plaster to measure the temperature, relative humidity (RH), volumetric moisture content and heat flux inside the test walls (Figure 1). To measure the temperature within the PCM mortar and on boundary between the structural layer and the insulation, Onset Hobo TMC15-HD was used with data logger UX120-006M. To measure temperature just behind the PV panel, small Littelfuse KS103J2 NTC thermistors were used with the Grant Squirrel SQ2020 1F8 data logger. The RH and temperature inside the PCM mortar and behind the facade plaster were measured with a Sensirion SHT35 and custom-made logger based on Arduino Mega. These SHT35 sensors were installed 2 weeks after the construction was completed, to minimize the risk of very high initial moisture content damaging the sensors. To do that, measurement tubes were pre-installed into the wall during the construction process of the wall. This method also made it possible to replace the sensors during the measurement period if necessary. As the PV panel and PCM mortar temperatures were measured at similar locations with different sensors, there was always a backup sensor available in case one of the sensors was not logging due to technical errors.
To assess the crack resistance of the ETICS facade near PV panel area, temperature and relative humidity of the facade plaster was measured at 4 cm (TRH_7.3) and 25 cm (TRH_7.2) from the PV + PCM wall section (Figure 1).
Temperature and RH sensors were calibrated before and after the experiment. The largest drift after the 20-month experiment occurred with the sensor, installed inside the PCM mortar, resulting in an average of +8% increase in RH readings. Sensors inside the facade plaster had less than a +4% increase in readings after the experiment. In the following analysis, the errors are considered.
Volumetric moisture content inside the PCM mortar was measured with EC-5 soil moisture sensors. The sensors were calibrated to measure this specific PCM mortar. More about the calibration process and formulas for calculating volumetric moisture content and temperature corrections could be found in (Talvik et al., 2022).
The PV panel was producing electricity all the time, which represents the common conditions during the service life of the facade system. Electricity was converted to heat inside the test facility. However, it must be noted that the PV temperatures would have been higher if PV panels were not producing electricity, but moisture conditions would be less severe.
Measured outdoor boundary conditions
Outdoor boundary conditions (temperature, RH, wind speed, wind direction, rainfall, total and diffuse solar radiation on horizontal surface were measured on the roof of the test facility, 2.5 m above the test wall. All the measured outdoor conditions were compared to the data from the national weather station (Tallinn-Harku, 59.40°N, 24.60°E, elevation 34 m), located 8 km west from the test facility, to ensure that no measuring mistakes were occurring. As the pyranometer measuring diffuse radiation had a shading ring that needed to be corrected manually every 2 weeks, there were some short periods of time when diffuse radiation readings were equal to total radiation. These days were corrected in such a way that locally measured total radiation was used in combination with diffuse radiation values from Tartu, Tõravere weather station (58.27°N, 26.47°E, elevation 70 m; Figure 2).
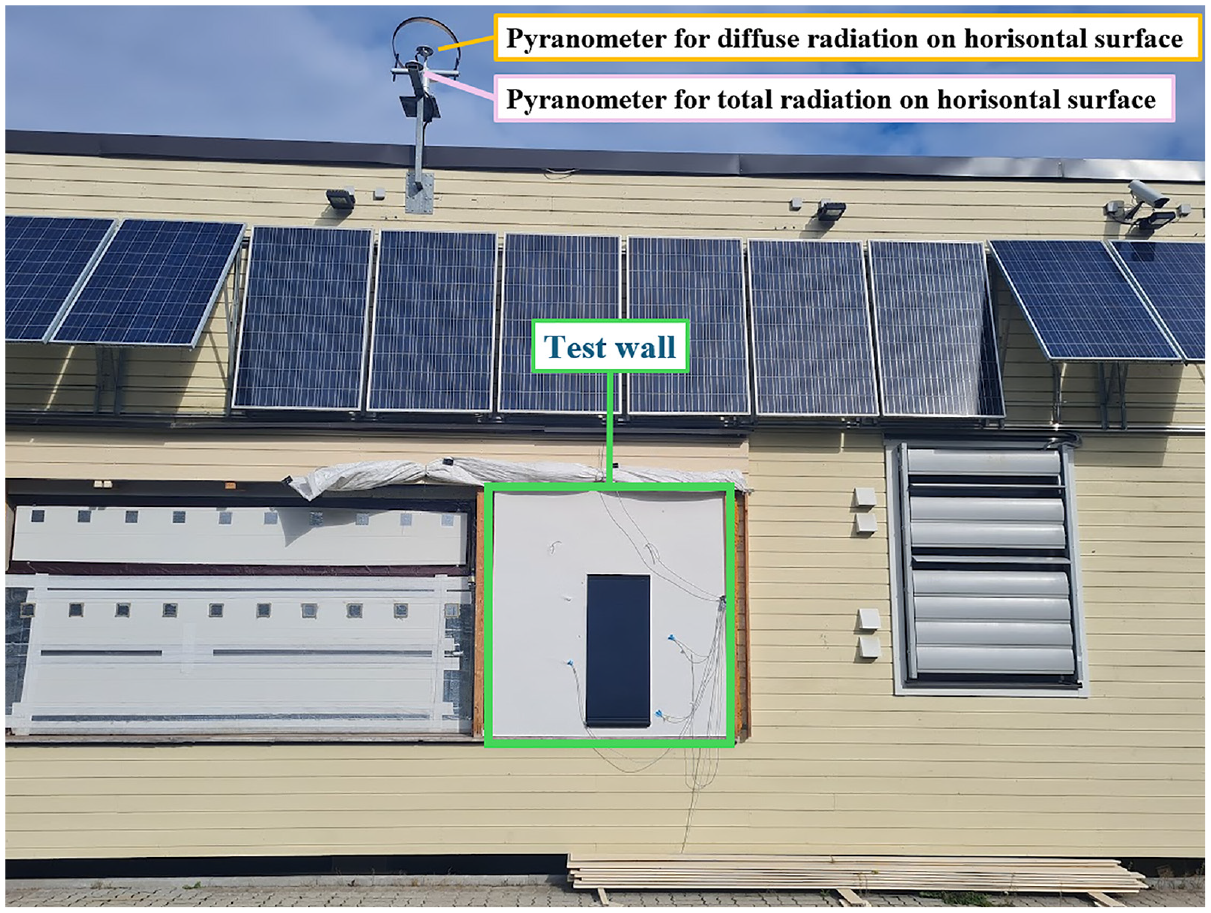
Location of the test wall on the south-facing facade and pyranometers on the roof of the test facility to measure direct and diffuse solar radiation separately.
Pre-analysis of the climate data
It is important to analyse the climate leading to high surface temperatures to predict PV temperatures for other climate zones without the need for detailed measurements or modelling. We compared climate data from the measurement period with historical climate data to determine if more extreme PCM temperatures could occur in the future. In Estonia (latitude 58.6°), the highest hourly solar radiation peaks on south-oriented vertical wall surfaces are in March and September. However, during the summer, the ambient air temperature and cumulative hours of solar radiation are higher, making August the worst month for PV facades. In August, air temperatures could be very high, there are relatively many hours of solar radiation and the solar angle is low enough to create solar radiation peaks of up to 800 W/m2 on wall surface.
In Tallinn, the maximum solar angle in August at midday is between 48° on the 1st of August and 39° on the 31st of August (TimeAndDate, 2024). Therefore, during midday, there would be approximately the same amount of solar radiation on horizontal surfaces as there is on south-oriented facades. During this 1-month period, solar radiation on horizontal surfaces would be a relatively accurate parameter for comparing different climate data with measured data.
Table 1 shows a comparison of the measured data from the month of August with historical climate data from the nearest weather station in Tallinn, Harku and Tartu, Tõravere (located 160 km southeast of Harku and with the highest quality radiation data). The comparison shows that the days with extreme PCM temperatures were between the 95th and 97th percentile in terms of total solar radiation during the day. The average air temperature was also warm, but still around the 90th percentile, indicating that the daily average temperature is not the most critical factor leading to overheating of the facade surface. Only midday and afternoon temperatures between 12:00 and 15:00 showed that critical days were more on the extreme side than the daily averages, which was also the expected result.
Summarized daily radiation and average air temperatures of 24h and 3 h for two critical days with annual maximum PCM mortar measured temperatures.
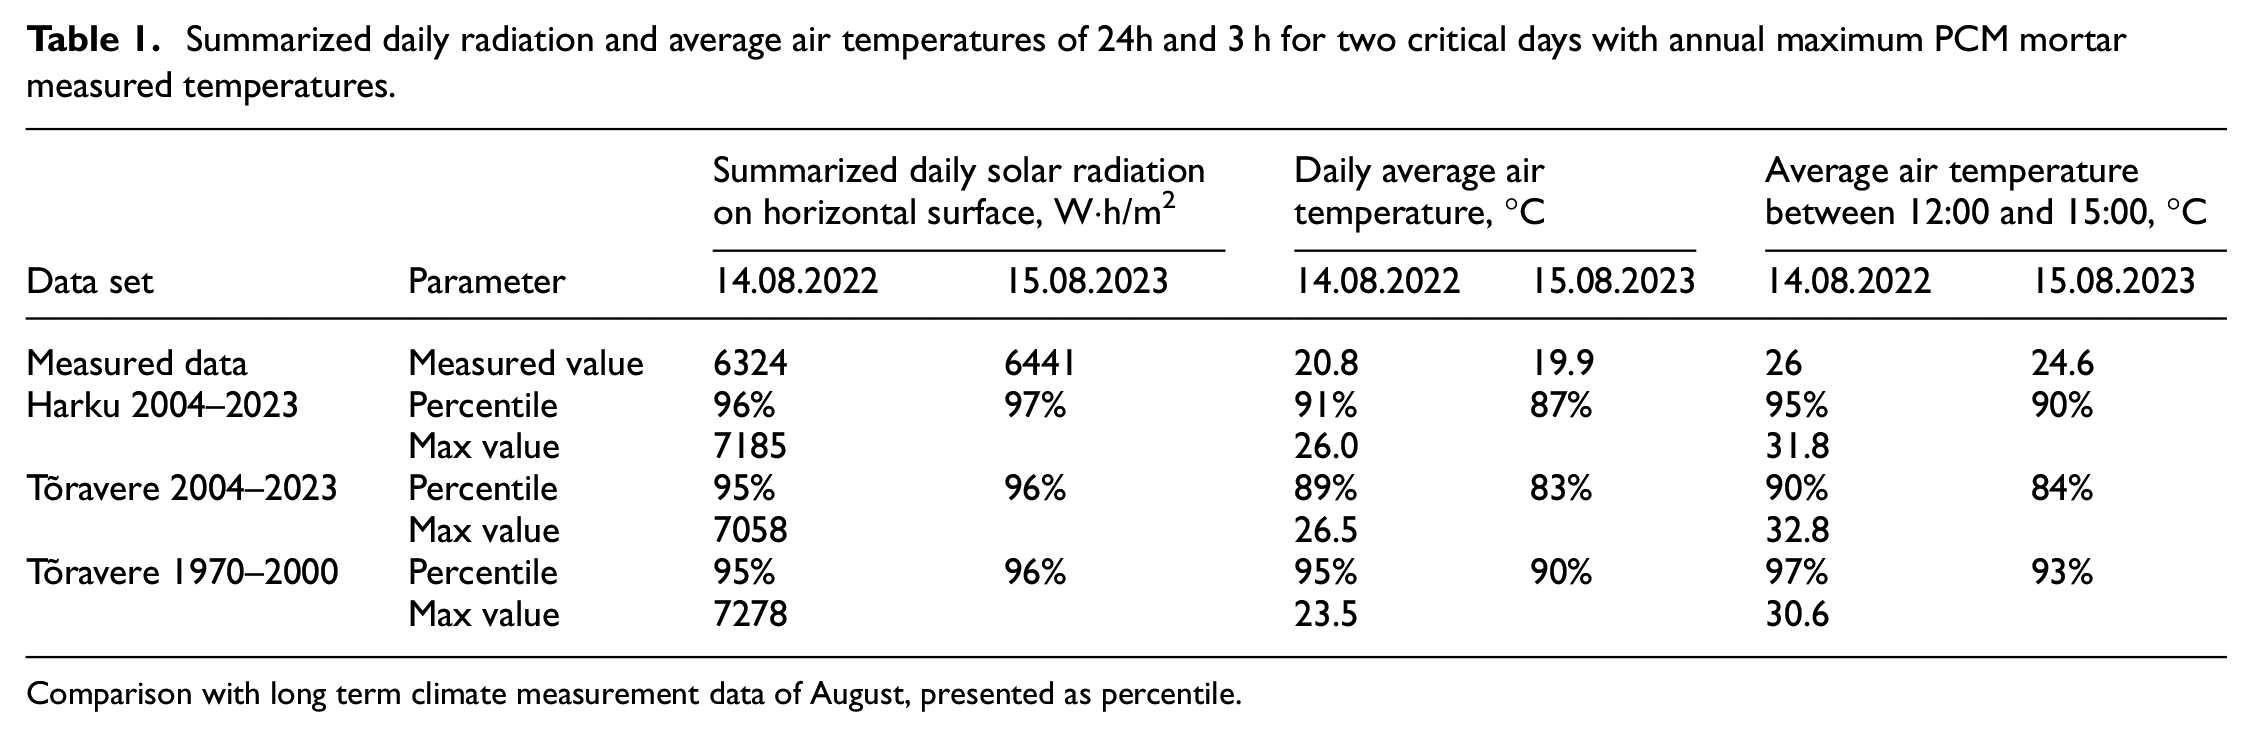
Comparison with long term climate measurement data of August, presented as percentile.
It must be emphasized that maximum solar radiation and peak temperatures were not on the same day. Solar radiation on a horizontal surface tends to peak at the beginning of August. However, the solar angle is higher and affects the wall surface less towards the end of the month.
Comparing the different long-term climate data sets, it turned out that there was no significant difference in the daily summarized solar radiation distribution curve between different climates. However, it appeared that both the daily average temperature and the 3-h average temperature after midday were significantly lower in the August months of 1970–2000 than they were in both locations measured in 2004–2023. This shows that although solar radiation (which depends mainly on cloud coverage) has remained relatively similar over the years, the air temperatures in August have become higher overall.
Indoor boundary conditions
Indoor climate conditions were measured inside the test building room with the experimental wall setup. The room was heated during winter, but not cooled during the summer. Heating setpoint was +23°C. The average indoor temperature was 24.4°C. Lowest temperature during the experiment was 22.3°C. Highest short-term peak was 29.6°C. Air humidifier was regulated to 50% RH all year around. The average moisture excess during the heating season was 6.0 g/m3. During the summer RH was periodically higher than the setpoint, reaching up to 60% RH. To further increase moisture load into the wall via diffusion, the indoor surface of AAC was not finished. The unfinished wall surface also enables AAC to dry out faster, but defining the exact time for the AAC wall to be unfinished would create another variable in equations.
Gravimetrical measurement of PCM mortar moisture content
After the designated 20-month measurement period, physical samples were obtained from the wall in February 2024. To minimize moisture loss during the process, the samples were cut during a relatively cold period with temperatures below freezing point. During the cutting, the internal temperature of the PCM mortar was measured to be −5°C. This resulted in the majority of the humidity within the PCM mortar being in the form of ice at the time of cutting. The moisture content of the PCM mortar was determined through gravimetric measurement.
To ensure that the peak temperature of the PCM mortar in the wall was not exceeded, the drying process was conducted at an oven temperature of +70°C. Drying continued until the change in mass readings between two consecutive measurements was less than 0.1%. The obtained results were then compared to those obtained from the soil moisture sensors. The presence of moisture in the form of ice also facilitated visual inspection of the moisture distribution within the wall.
Modelling hygrothermal performance of test wall
Hygrothermal modelling was carried out using Delphin 6 software (Grunewald, 1996; Nicolai, 2008). The model was calibrated using climate chamber experimental data (Talvik, Ilomets, et al., 2023). The aims of the modelling were to verify the modelled results by field measurements during the 20-month period and to model the hygrothermal performance in the future with more extreme outdoor climate conditions. The material properties used in the model, as well as the cross section of the calculation model and all the boundary conditions, are described in detail in (Talvik, Ilomets, et al., 2023).
Hygrothermal modelling with a test wall was conducted using the measured boundary conditions. The boundary conditions included the outdoor temperature, RH, direct and diffuse solar radiation, wind speed and direction and rainfall, as well as the indoor temperature and RH. Wind and rain data were combined to calculate the wind driven rain (WDR) load on the southern facade according to (EVS-EN ISO 15927-3, 2009). The initial moisture content of the PCM mortar was set to 0.27 m3/m3. Initially, there was no PV in the calculation model until the date it was installed on site.
Additional modelling was carried out using the Estonian moisture reference year (MRY; Kalamees and Vinha, 2004). A 10-year period was used for this modelling, creating extremely harsh conditions for the system to operate in. These conditions are not likely to occur in real climate situations. The indoor climate had a moisture excess of 6 g/m3, which describe indoor humidity load with high occupancy (Ilomets et al., 2018). WDR data was applied to the facade surface without water leakage locations (unbroken facade).
Results
PCM temperatures during the whole measurement period
Both daily and monthly average extreme PCM internal temperatures are shown in Figure 3. The minimum PCM temperatures during the night are also visible to illustrate the daily fluctuation in different seasons. All the measured results are compared to the modelled ones.
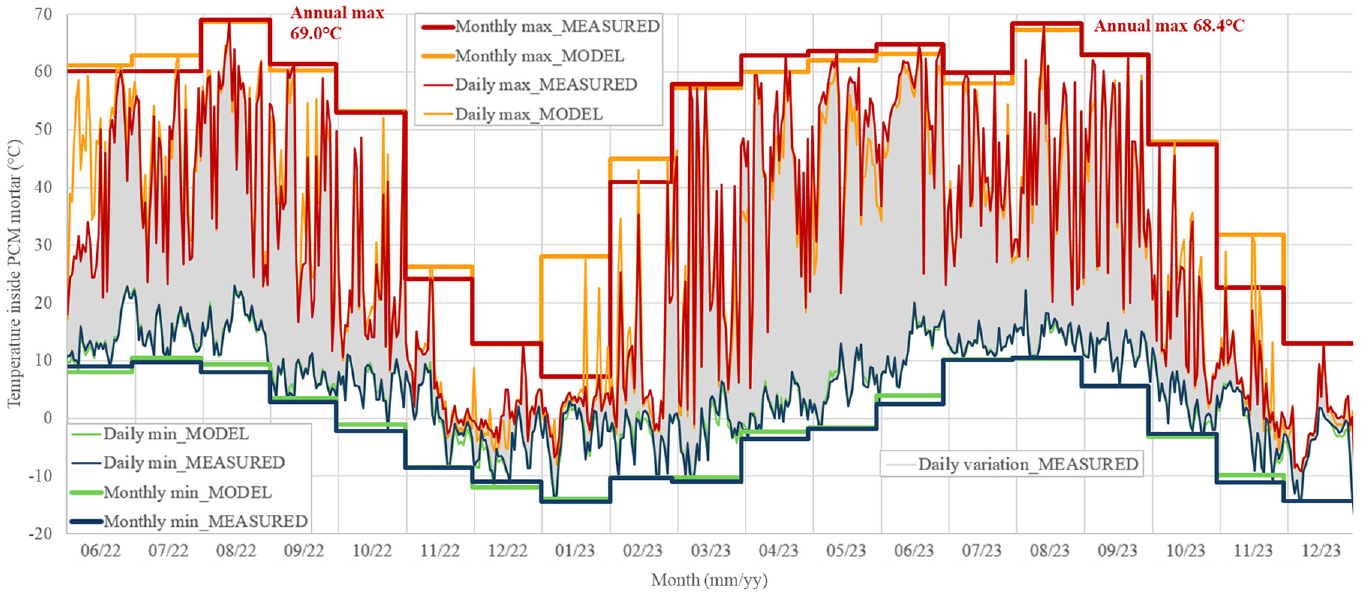
Comparison between measured and modelled daily temperature fluctuations and extreme values of PCM mortar at corresponding month. Shaded area stands for measured variation between the minimum and maximum temperature that occurred within 24 h period.
In Figure 3, the measured daily fluctuation of PCM temperature is highlighted in grey – it demonstrates well the impact of solar radiation on the dark-coloured southern PV facade temperature. The highest daily temperature variation measured in March 2023 was 67°C, fluctuating between −9°C and 58°C. Overall, highest daily fluctuations tended to occur in March and April.
From Figure 3 it can also be seen that the critical period for high PV temperatures was longer than expected – temperatures above 57°C were reached from March to September, as solar radiation on the wall surface is highest in spring and early autumn in Estonia. In contrast to March and April, the ambient air temperature in summer months is higher, and also the number of hours with solar radiation is higher.
Figure 3 shows that, overall, the PCM mortar exterior layer temperature did not exceed 70°C during the two summers of the measuring period. The annual peaks occurred in mid-August for both years. The correlation between the measured and modelled results is relatively good, except for some days in November and late January. These discrepancies can be explained by the site location, as there are trees and neighbouring buildings at an intermediate distance from the test facility. Solar radiation was measured with pyranometers on the rooftop of the building, while the test wall was located 3 meters below (Figure 2). As a result, on a few days in November and January, when there was high direct solar radiation, the pyranometers were exposed to the direct radiation while the wall installation itself was not. In contrast, in December, when the solar angle is very low (about 8°), both the pyranometer and the wall are shaded by the trees, and only diffuse radiation creates the peak temperature values, which are accurately predicted by the model. Overall, these few days with shaded facade surface and exposed pyranometers did not create significant difference between measured and modelled hygrothermal performance of the facade.
Another period where the modelled results differ from the measured ones is at the beginning of the measurement period. This is because in early June 2022, the facade plaster and the sensors behind the plaster were being applied to the test wall, but sensors inside PCM were already measuring. During this period, scaffolding coverings were used to protect the facade. In hygrothermal modelling this period was modelled with just diffuse radiation on the wall surface.
Analysing the daily minimum temperatures, it could be seen that during the entire measurement period, the daily minimum temperature inside PCM mortar was never higher than 23°C. Since the PCM encapsulated inside the mortar was a combination of three different PCM materials, with the lowest having a nominal melting temperature of 25°C, it can be stated that the PCM probably managed to solidify during all the nights throughout the 20-month period. Therefore, the full potential of the PCM mortar was able to be utilized during the day.
Temperature dynamics inside the test wall and PCM mortar
The temperature dynamics inside the EnActivETICS wall are illustrated in Figure 4. Temperature measurements within the PCM mortar and on the rear surface of the PV panel demonstrate a close resemblance (with the maximum temperature on the back side of the PV panel being only 0.6°C higher than that in the middle of the PCM). It serves as evidence for a strong thermal connection between the PV panel and the PCM mortar. The Figure 4 also shows how the heated up outer layer of the facade affects the load bearing layer behind the insulation layer. Notably, there exists a 5.5-h delay between the temperature peaks observed within the PCM mortar and the region behind the insulation.
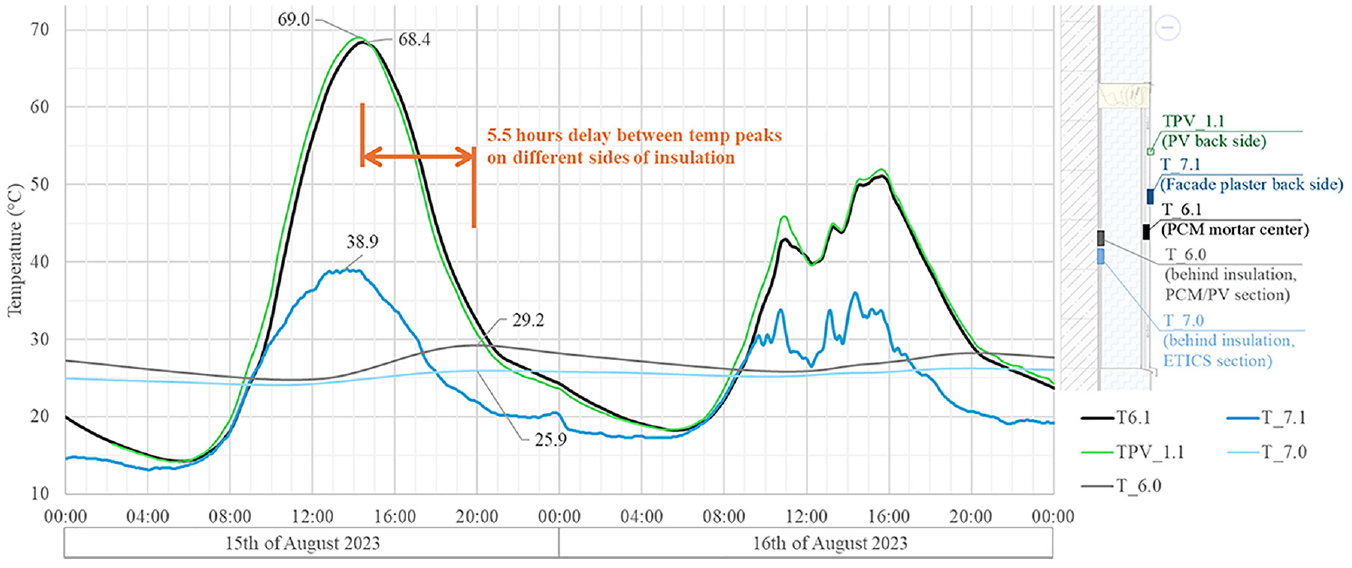
The measured temperature inside the EnActiveETICS wall during the day with the most extreme PCM temperatures of the measurement period and the following day with moderate cloud coverage. Cross section of the test wall with relevant sensor locations on the right.
Figure 5 presents the comparison of measured and modelled temperatures. It could be seen that the model was able to predict measured temperatures better on days with undisturbed solar radiation (15th of August 2023) than on days with some cloud coverage (16th of August 2023). The black lines represent the PCM mortar centre layer temperatures, and the red dotted line represents the modelled situation with a PV panel applied directly on the EPS insulation, without any thermal mass behind the PV. The added thermal mass creates a significant delay in the temperature increase and lowers peak value. Since the PCM granules inside the mortar consist of PCM wax with nominal melting temperatures between 25°C and 35°C, this region increases the delay from 0.75 to 1.5 h, proving that the reduction in temperature increase speed is influenced by both the thermal mass of the thick mortar itself and the PCM granules inside.
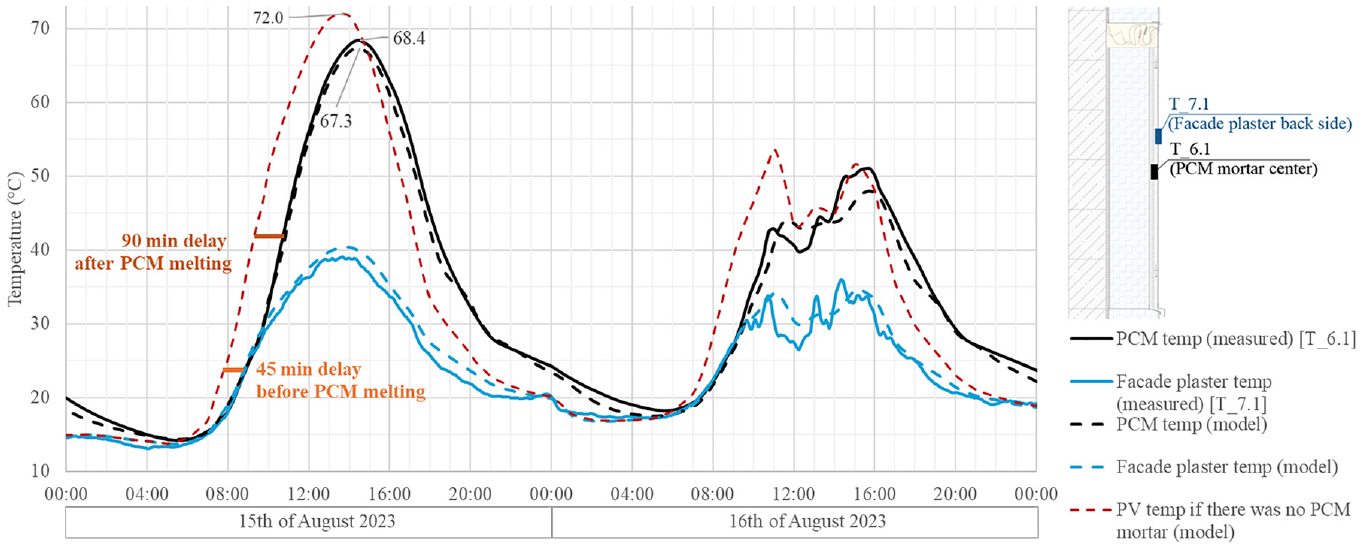
Comparison of measured and modelled temperature inside the En-ActivETICS, behind the light-coloured thin facade plaster, and in case without additional layer to buffer the excess heat. Cross section of the test wall with relevant sensor locations on the right.
On the 15th of August 2023, as depicted in Figure 5, the highest recorded PCM temperature during the measurement period was observed. When modelling without the PCM mortar, there was only a modest increase of 4.7°C on this particular day. However, when considering the entire measurement period under a hypothetical scenario without the thermal mass behind the PV panel, maximum PV temperatures reached up to 75°C on various days. In the absence of PCM mortar, with very small thermal mass, the PV panel can lose its heat energy faster during short wind events, compared to the case with PCM mortar.
Facade plaster temperatures and RH at close proximity from PV panel
Since thermal and hygric expansion are parameters that influence increased risk of crack occurrence, temperatures and relative humidity of the facade plaster was studied by measurement at 4 cm and 25 cm and modelled at 1 cm, 4 cm, 25 cm and 100 cm distance from the PV+PCM wall section. It appeared that there was no significant difference between the 100 cm and 25 cm distances, as they were both sufficiently far from the different material. Therefore, the graph for the 100 cm distance is not shown in the figures below, and the 25 cm distance represents the entire homogeneous facade plaster surface.
Sensor measurement data for the critical day with the highest PCM temperatures shows similar trend with the modelled temperatures of the facade plaster (Figure 6). Calculations show that on 15th of August, facade plaster had a temperature 7°C higher at 1 cm distance from the PCM area than it was on 4 cm and ≥25 cm distance from the PCM area.
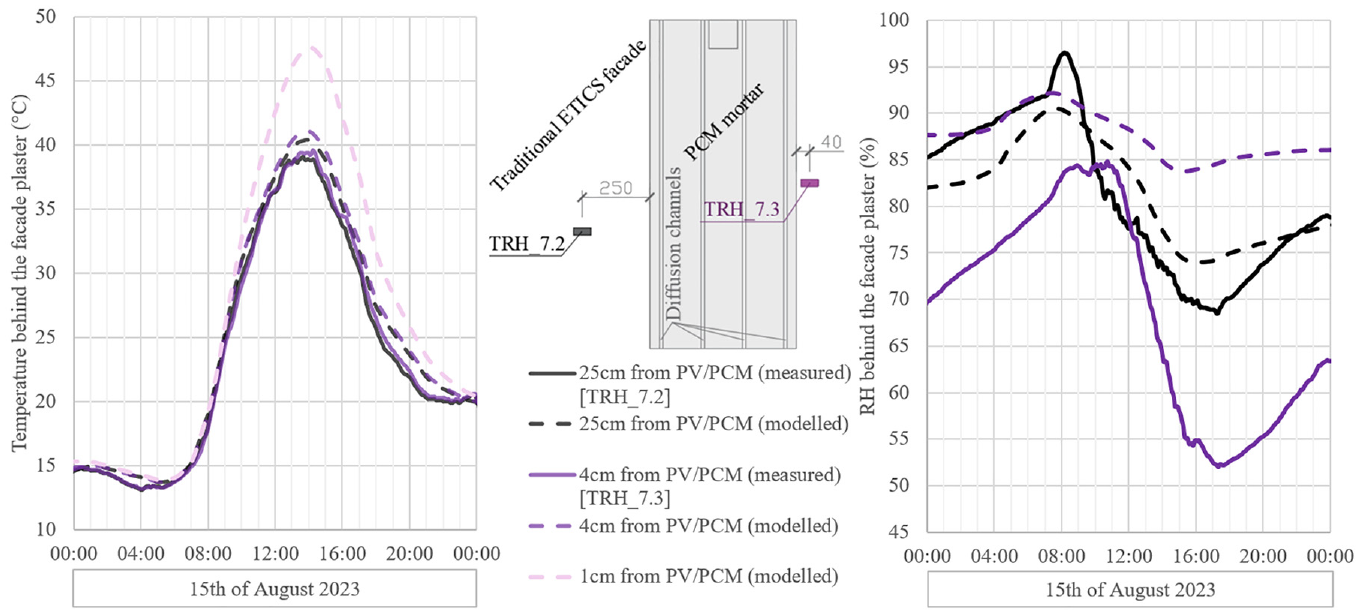
Temperature and relative humidity of facade plaster on different distance away from the PCM mortar and PV panel. Comparison between modelled and measured results during 24 h period.
When analysing the recorded data over 20 months, it was observed that the facade plaster temperatures increased by a few degrees during summer days, moving closer to the PV panel. The maximum difference in the modelled results between the facade plaster 1 cm away from the PV section and the rest of the facade surface was 19.2°C, while the difference between the location 4 cm away and the rest of the facade was only 1.4°C. The measured results showed a maximum difference of 4.5°C between the location 4 cm away and the rest of the facade. Overall, the temperature gradients were localized to the close perimeter of the PV panel.
An example of the RH dynamics of the facade plaster on August 15 is also shown in Figure 6. The modelled results indicate that the facade plaster should have slightly higher RH, closer to the PCM mortar area, caused by the moisture from the PCM mortar drying out through the facade plaster. However, it should be noted that the measured results show the opposite – the sensor closer to the PCM mortar (TRH_7.3) displays lower RH readings than the one in the middle of the facade plaster area (TRH_7.2). This could be due to the diffusion channels speeding up the drying process in the real wall more than expected in the model without micro-convection, resulting in less moisture flow from the PCM mortar to the facade plaster. It could also be a measurement error caused by the exact positioning of the sensor, the varying thickness of the facade plaster layer above the sensor capsule or the fact that the application tube was longer for the sensor further away from the PV. Sensor error is ruled out as both sensors were calibrated before and after the experiment and showed similar readings.
Measured results from the two different locations of the facade plaster area show increased moisture inertia closer to the PCM mortar. It could be seen from Figure 6 that after the sunrise on 15th of August, in the middle of the plaster area, the RH decreases rapidly at the morning as facade plaster temperature increases. However, next to the PCM mortar with greater moisture inertia, the RH reaches a plateau at 8:00 and starts to decline only at 11:00. It can be observed that when the facade temperature starts to increase during the day, the RH of the facade plaster 25 cm away from the PCM mortar decreases faster than in the point closer to the PCM mortar. During the night, moisture flow can be seen within the facade plaster layer.
If the modelled and measured RH in the facade plaster area further away from the PV panel section was analysed during the entire period. It appeared that the correlation between the two was mostly satisfactory. From October to March, the facade plaster sensors showed readings of 100% RH. The modelled results showed lower values, which is probably caused by inaccuracies in the material properties (especially at higher moisture contents) of the facade plaster and errors in measuring humidity close to the dew point with RH sensors. The main hygrothermal properties of this particular facade plaster were measured in the laboratory. However, it is much less accurate to define the moisture storage and transport parameters under high moisture conditions. Therefore, the calculation model rarely increased the RH of the facade plaster above 97.5%.
PCM mortar moisture content during measurement period
During the project, two soil moisture sensors were used to monitor the moisture content of thick PCM mortar. There were no significant differences between the two sensor readings after the initial dry-out process (Figure 7). This is probably because the diffusion channels equalized the moisture content all over the cross-section behind the vapour-tight PV panel.
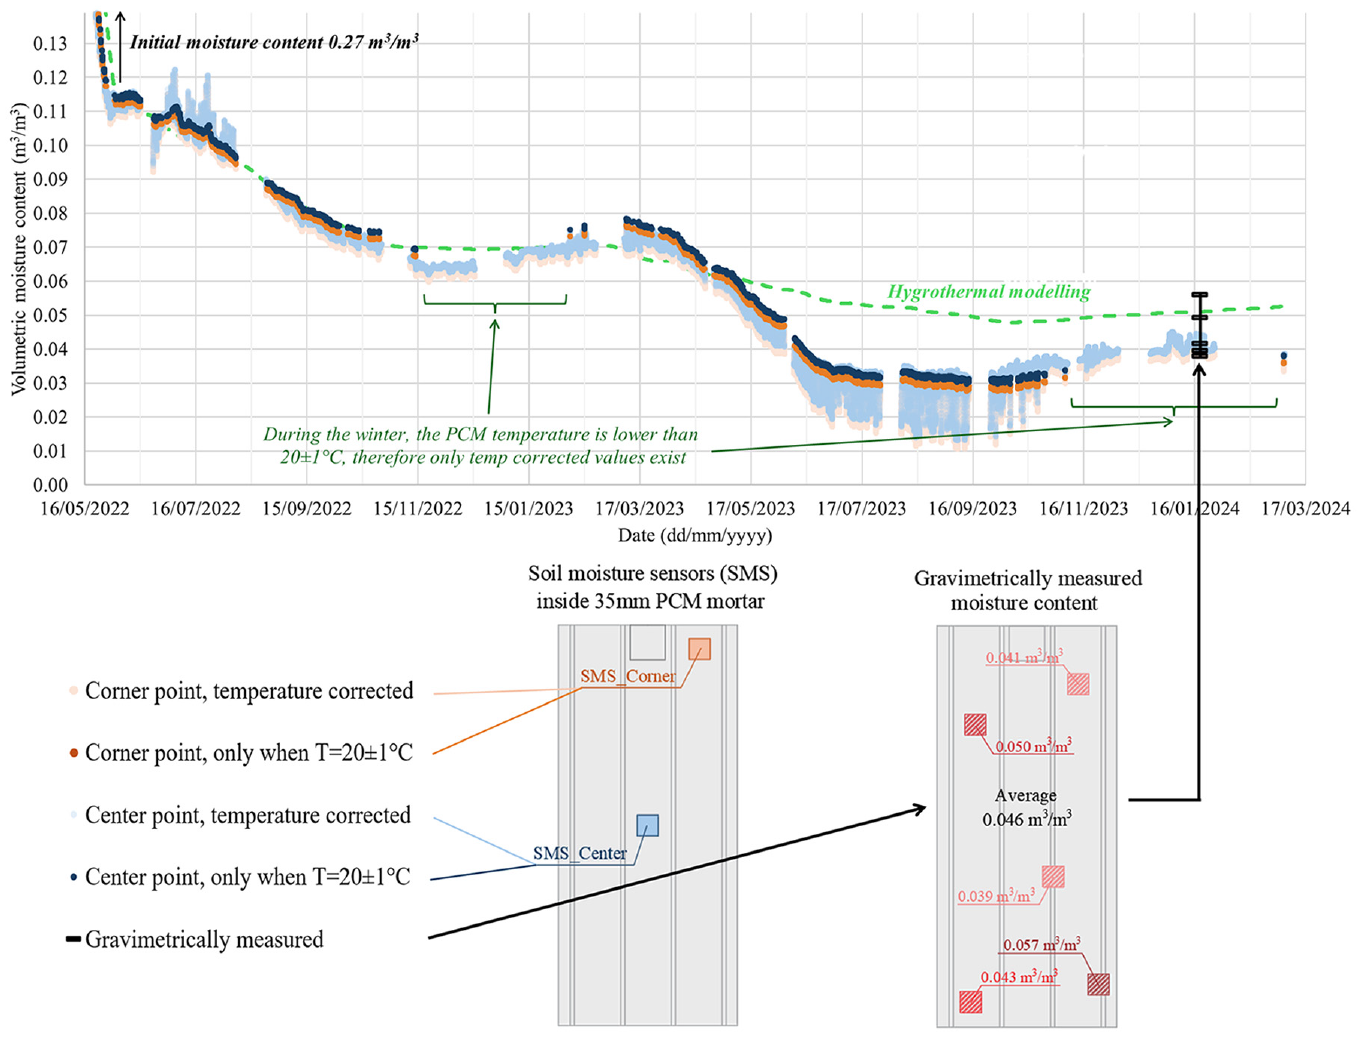
Moisture content of PCM mortar, measured with soil moisture sensors and comparison with modelled results. Lighter coloured points represent all the measured values, temperature corrected according to (Talvik et al., 2022). Darker coloured points represent timestamps when PCM is on the same temperature which the sensor calibration was conducted and are therefore more accurate. Black points represent the results of destructive gravimetrical measurement on 18th of January 2024.
It has been previously stated that soil moisture sensor readings are temperature-dependent. For this particular PCM material, temperature correction formulas were developed during the sensor calibration phase (Talvik et al., 2022). However, especially under low moisture conditions, these formulas underestimated the moisture content by up to 0.02 m3/m3 (Figure 7). Therefore, for more accurate results, only the sensor readings obtained around the sensor calibration temperature of 20°C±1°C were filtered out. Most of the measurement days had at least two periods when the PCM temperature was in that range – in the morning and in the evening. However, during the winter months, there are longer periods when the PCM temperature never exceeds 19°C. Nevertheless, the temperature corrected graphs make it possible to predict the moisture content during the winter. In the data, there are also some gaps in both the temperature corrected and isothermic values, caused by temporary technical issues with the logging device.
At the end of the experimental period, moisture content of PCM mortar was also measured gravimetrically. The results are shown on the graph and in the drawings in Figure 7. In general, the gravimetrically measured moisture content is in the same range as the soil moisture sensor readings. However, two measurement points showed slightly higher moisture content – in the lower right corner of the PV and in the middle left. As the gravimetrical measurement was carried out in January, to obtain the sample pieces while frozen, it could be that the lower right corner sample, situated just at the boundary with diffusion channel, had increased moisture content because of the increased moisture entering the wall system at the winter via the diffusion channel. There is some snow on the lower steel sheet after the snow blizzard events, which could temporarily increase the moisture content of the PCM mortar closer to the lower end of the diffusion channel.
If all the measured results are included, the average gravimetrically measured moisture content is 0.046 m3/m3 with a standard deviation of 0.0076 m3/m3. However, if the highest reading from the lower right corner is excluded from the data set, the average would be 0.043 m3/m3 with a standard deviation of 0.0050 m3/m3. Temperature-corrected moisture content from the soil moisture sensor was on the same day 0.041 m3/m3 on average. Hygrothermal modelling showed a moisture content of 0.052 m3/m3 on the same day.
Besides measuring the moisture content inside the PCM mortar, relative humidity was also measured inside the mortar (TRH_7.3 on Figure 1). The RH sensor inside the PCM mortar also showed a constant 100% RH during the first year of the measurement period.
A comparison of measured and modelled moisture content (Figure 7) showed that measurements had a faster decrease in moisture content during the second summer than the modelling predicts, however, the overall trends are similar to the measured results. The discrepancy between measured and calculated moisture contents could be explained by the increased moisture dry-out speed in the real wall compared to the conservative model, as the latter did not consider micro-diffusion inside the diffusion channels. Another aspect is that although the PCM mortar material properties were measured over a wide range of humidity conditions, the hygrothermal model was calibrated in the climate chamber test, which lasted a relatively short time and did not reach lower moisture contents.
Long term hygrothermal modelling of PCM mortar moisture content
Therefore, the same calculation model was used to make long-term calculations to evaluate the long-term durability of the system. Figure 8 shows measured and modelled PCM mortar moisture content dynamics during measurement period and following modelled results by using the Estonian moisture reference year for condensation. The moisture content of PCM mortar was relatively stable after the construction moisture was dried out. Moisture accumulation did not occur. From calculation year 4 onwards, the moisture level fluctuated between 0.028 and 0.034 m3/m3, being higher during the winter period and lower during the summer. This indicates that the initial moisture content dried out with two summers. Further modelling with condensation test years showed a slight decrease in moisture content during the next 4 years, after which a stable moisture regime was achieved.
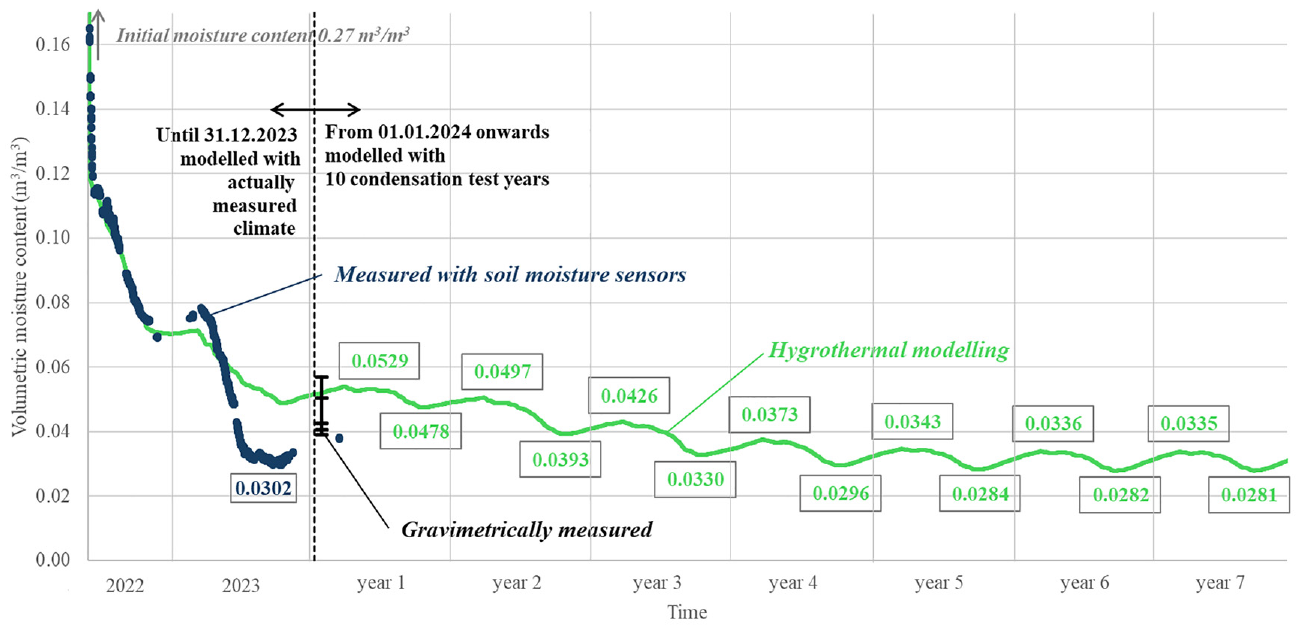
Long term prediction for PCM mortar moisture content dynamics. Modelling began with measured boundary conditions. After experimental programme, extreme climate conditions (temp, RH, solar radiation and WDR to surface) of moisture reference year of Estonia were applied.
The moisture content of PCM mortar increases every year from November to March and decreases from June to September – this phenomenon is also visible in the measured results. If the measured results from the second year were compared to the modelled results from year 6 onwards, it could be seen that the summer lows tend to have the same moisture content around 0.03 m3/m3. This means that the dry-out process during the second year was faster than predicted by the model.
There were no cracks in the facade plaster on the test wall. Also, the hygrothermal model does not consider water leakage from potential cracks. It has been shown in (Talvik, Ilomets, et al., 2023) that excess water from leakages would find its way out of the wall system via diffusion/drainage channels. Locally elevated moisture content of the PCM mortar, caused by possible leakages, was able to dry out relatively quickly with solar radiation through the diffusion channels. Therefore, modelled results without water leakage but with WDR applied on the facade plaster surface, a high indoor moisture load, built-in moisture of the structure and PCM mortar and extremely cold outdoor conditions for the condensation test year should predict the long-term durability relatively well.
Destructive opening of the test wall
A visual inspection was conducted to detect any possible defects inside the critical layers. It turned out that there were no visible ice crystals in the mortar structure, nor on the boundary between the PCM mortar and PV panel, or between the PCM mortar and insulation. If the PV panel was removed, in most places, the first layer of coating remained on the glue mortar, indicating that all the installed layers were well-bonded (Figure 9, left).
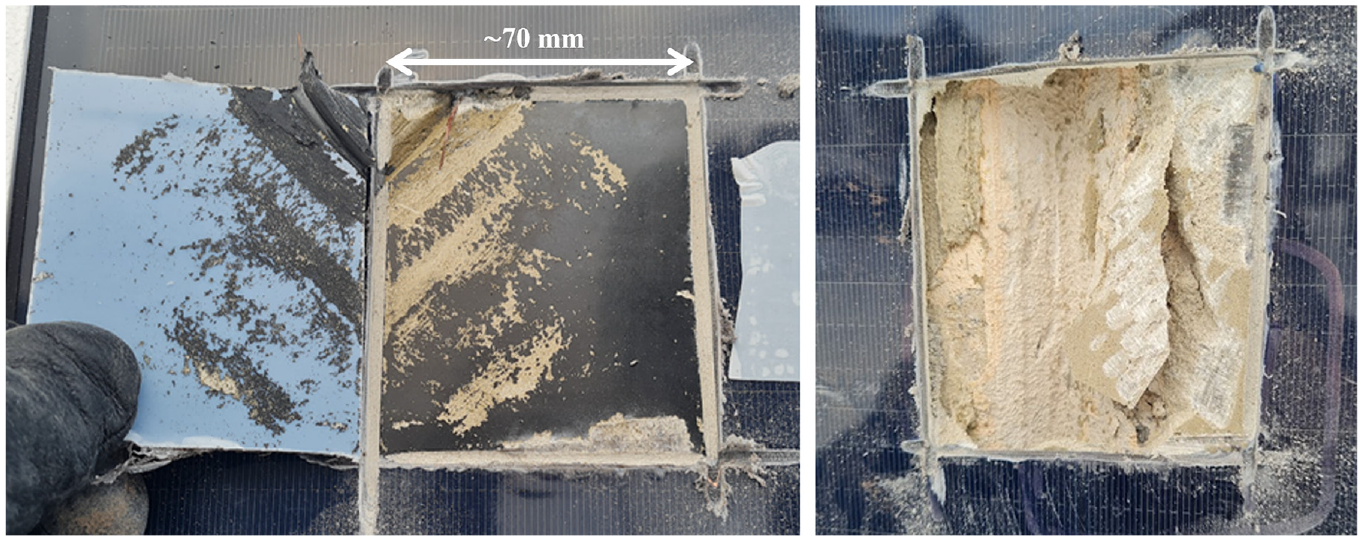
In places where there was full-surface bonding between PV panel and PCM mortar, delamination happened between the two coating layers of the PV panel product (left); slight colour change had occurred on the outer layer of the PCM mortar, on places without 100% bonding between PV and PCM mortar (right).
There was visual evidence, however, that during the experimental period, there was elevated moisture content on the outer surface of the PCM mortar. In one specific location where there was no full-surface bonding between the PCM mortar and PV, the outer surface of the PCM mortar was discoloured from grey to light orange (Figure 9, right). This location was also near the diffusion channel. It could be due to the long-term presence of liquid water behind the PV panel, causing some pigments to travel to the surface. One possibility is that these pigments come from the PCM material that has penetrated the walls of the granules. Further studies are needed to determine the origins of this pigmentation and whether it has affected the latent heat properties of the PCM mortar.
Discussion
In some areas, there was visible discolouration on the outer side of the PCM mortar. This discolouration could be caused by the PCM wax, which is encapsulated into small granules, penetrating the walls of the granules and traveling to the outer layers of the PCM mortar along with moisture transport. The possibility of PCM wax escaping the system should be studied in the future, despite the current experiment showing no signs of PCM thermal capacity reduction during the 20-month period.
The factors that were not entirely ensured during this one-story-scale experiments that could increase the hygrothermal load were as follows:
(1) The facade was facing south as traditional PV orientation and because of the test facility limitations for test wall orientations (only 0° and 180° orientations are available). South-west or south-east facing walls could be also worth studying the severity of PV overheating in future studies. WDR loads should also be considered in the critical orientation selection;
(2) The location of the test facility is not on open terrain, therefore the wind speeds are not as extreme, resulting in less WDR;
(3) The test wall had relatively small dimensions, so critical temperature and humidity deformations could not occur;
(4) The 20-month test period is too short to evaluate the aging effect of the materials.
In this test wall, diffusion channels were carved into the thick PCM mortar behind the PV panel. The study showed that, the diffusion channels performed well also in field conditions and are needed for at least for two reasons. Firstly, the channels work as drainage channels if a significant amount of water leaks in. This has been proven previously in (Talvik, Ilomets, et al., 2023). Secondly, they facilitate faster drying during periods with higher solar radiation. The necessity of diffusion channels was proved also by long-term hygrothermal modelling, conducted with the MRY climate, where moisture accumulation did not occur.
The measured results reached a stable moisture content in the second autumn, while the modelling showed that this moisture level should be reached in the fifth autumn. Additionally, the measured drying out process was faster during the second year, compared to the model. This could be explained by the fact that micro convection is not considered in the calculation model. The cross-section of the real diffusion channel was approximately 400 mm2, which should be enough to allow air circulation inside the channel, amplified due to significant daily temperature changes. On the other hand, the diffusion channel was modelled as a boundary condition with a constant equivalent vapour diffusion thickness of Sd = 0.8 m, which corresponds to 3/4 of the length of the whole diffusion channel. In the final model, no geometry was assigned to the diffusion channels, as micro convection is challenging to include in the Delphin models. Several variations of how to model the diffusion channels were tried out earlier, and it was concluded that it would be better to create a more conservative computational model. Overall, this hygrothermal calculation model could be used to evaluate the long-term performance of PV-ETICS facades in different climates.
One crucial key performance indicator for this ETICS facade system with integrated PV panels is the PV panel temperature. In case of overheating, the PV panels reduce in efficiency and could physically deteriorate. It is necessary to keep the PV temperatures under 85°C (Hasan et al., 2015) during the entire service life of the facade; therefore, PV should not be applied directly on the insulation layer. In this test wall, thick mortar with PCM granules was used as a heat sink. The PV backside temperature was approximately 0.6°C higher than the PCM mortar temperature, indicating good thermal conductivity between the PV panels and the heat sink.
The long-term experiment also revealed that the period with high PV panel temperatures lasts from spring to autumn, and the most extreme temperatures in Estonia occur in August. Sensitivity analysis with historical data from 1970 to 2023 revealed that the climate in August 2022 and 2023 was on the critical side in terms of high temperatures and high solar radiation. However, there were more critical days in the historical dataset. The experimental period included two summers, and for both years, the maximum PCM temperature was 69°C. This correlates well with the first indicative calculation models carried out with Estonian MRY test year, showing peak temperatures for the solution with 30 mm of PCM mortar with different PCMs ranging from 67°C to 73°C (Talvik et al., 2021). The same study shows that if the same facade system were introduced in Madrid, the peak temperatures with 30 mm PCM mortar would be in the range between 79° and 82°C, which is just below the performance limit.
Experimental results from Lodz, Poland, previously measured the maximum temperatures of the PV panels to be 63°C (Heim et al., 2023a). Similarly, the peak results were measured in August. The study also revealed that without the PCM mortar behind the PV panels, the temperature would have been 74°C, and with black-coloured facade plaster, the temperature was measured at 75°C (Heim et al., 2023a).
The temperature measurements also show that having a dark surface on the facade with significant thermal mass causes the structural layer to warm up through 160 mm of EPS Silver insulation. It should be studied in the future how significantly the dark-coloured facade with significant thermal mass on the external side effects the heating and cooling demand of a building.
To investigate the hypothesis regarding whether the discolouration of PCM mortar is attributable to the escape of PCM from the wall system, a comparison of the temperature dynamics of PCM mortar in 2022 and 2023 was conducted. This analysis revealed no significant loss of thermal mass in proximity to the nominal melting temperatures. Nonetheless, this methodology lacks the precision necessary to draw definitive conclusions regarding the potential escape of small quantities of PCM wax from the system. In the preliminary phases of PCM mortar material development, the potential leakage of PCM through the PU coating was examined under high-temperature conditions, and the observed mass loss was deemed insignificant. However, the potential long-term escape of PCM, exacerbated by freeze-thaw cycles in conjunction with elevated temperatures, has yet to be studied. Future investigations should aim to produce a precise latent heat distribution graph in the laboratory for both the new material and the aged material retrieved from the test wall.
Another important aspect that was realized after the opening of the facade PV was that unless manufactured in the factory, the outer surface of the PCM mortar would not be perfectly flat. Therefore, the glue mortar applied between the PCM mortar and PV panel would most probably not have full surface bonding everywhere. From a hygrothermal point of view, it would be better if the glue mortar grooves were orthogonal to the main diffusion channels, creating a network of diffusion where small glue-mortar channels lead to the main diffusion channels in the PCM mortar.
In the future, more resources should be allocated to increase the level of prefabrication of the PCM-mortar and PV panel cross section to increase the application efficiency on the construction site. But during this future development process, it must be kept in mind that the main principles of using the diffusion channels behind the PV panel, protecting these channels with double steel sheets and the possibility to replace the PV panel without damaging the facade plaster surface must be followed.
When designing an ETICS facade with integrated PV, it is important to consider that ETICS has a tendency to deteriorate prematurely if the initial moisture content of the structure is high and the construction process is too fast, preventing the layers from drying out sufficiently (Talvik et al., 2023). Therefore, it is necessary to take into account structural layers with high initial moisture contents, especially when a part of the facade is insulated with mineral wool.
Conclusions
Results from the 20-month experiment with a test wall under outdoor climate conditions of south-oriented facade in Estonia showed a decrease in moisture content in the critical layer of the PV-ETICS wall system inside the thick layer of PCM mortar behind the vapour tight PV panel. After the experiment, no cracks were identified, and the PV panel was still generating electricity. During the destructive opening of the facade to measure the moisture content of the PCM gravimetrically at the end of the experiment, no signs of physical deterioration inside the wall was identified. However, certain regions exhibited observable discolouration on the exterior surface of the PCM mortar.
Based on the experimental programme, following conclusions can be made:
Phase change material (PCM) mortar behind the PV panel managed to avoid extreme temperature peaks, during the test period. Maximum measured temperature of BIPV was +69°C, that was lower than the performance limit of the thin PV system (+85°C);
Maximum PV panel temperatures for south oriented facade occurred in mid-August, when solar angle is already lower than at the solstice, but ambient air temperature is still high enough;
PCM was able to solidify during all the nights during the measurement periods, therefore full potential of the PCM could be used every day when there was high enough solar radiation. A combination of PCMs RT25HC, RT28HC and RT35HC proved to be efficient;
It took two summers for the wall system to dry out most of the built-in moisture from the thick PCM mortar;
Calibrated soil moisture sensors proved to be enough accurate method to evaluate moisture content of thick, porous material at high moisture levels, as the results coincide with gravimetrically measured results. Most accurate readings were obtained under isothermal conditions, although temperature correction was also possible to conduct relatively accurately;
Both measured and calculated results show that there would be no moisture accumulation behind the vapour-tight PV panel if diffusion channels are applied inside the PCM mortar;
Facade system and PV panels did not have any physical defects, cracks, delamination of layers etc at the end of the experimental programme. Therefore, large scale testing and long term implementation could be encouraged;
PCM mortar had some discolouring effects after the 20-month test period. Despite temperature dynamic graphs showing no smaller thermal mass in 2023 compared to 2022, latent heat properties of old PCM mortar from the wall should be measured in the future.
Overall, the En-ActivETICS facade system proved to be sufficiently performing and durable during the 2-year guarantee period. Moreover, hygrothermal modelling showed that there should be no significant moisture-related problems throughout the remaining service life of the facade system if diffusion channels are implemented as shown on Figure 1. After the experiment, the PV panel was still generating electricity. Therefore, PV-ETICS could be considered as a potential option for integrating on facade surfaces exposed to solar radiation in order to increase on-site green electricity production. This technology should be encouraged to implement in larger demonstration buildings in the future.
Footnotes
Declaration of conflicting interests
The author(s) declared no potential conflicts of interest with respect to the research, authorship, and/or publication of this article.
Funding
The author(s) disclosed receipt of the following financial support for the research, authorship, and/or publication of this article: This work has been supported by the Estonian Centre of Excellence in Energy Efficiency, ENER (grant TK230) funded by the Estonian Ministry of Education and Research, by personal research funding (grant PRG2732), by the European Commission through LIFE IP BUILDEST (LIFE20 IPC/EE/000010). The study utilizes measured data from the project En-ActivETICS: funded by ETAG in a framework of ![]() (grant No. 3-4/MOBERA1719029), NCBiR (grant No. M-ERA.NET2/2018/2/2019), and SAS (grant No. M-ERA.NET 2 /2018 /786/En-ActivETICS).
(grant No. 3-4/MOBERA1719029), NCBiR (grant No. M-ERA.NET2/2018/2/2019), and SAS (grant No. M-ERA.NET 2 /2018 /786/En-ActivETICS).
Ethical considerations
Not applicable.
Consent to participate
Not applicable.
Consent for publication
Not applicable.