
Abstract
Reliable modelling of the solar potential of urban surfaces (i.e. roofs, facades and ground) in the built environment can contribute to boost the exploitation of solar energy. Empirical and quasi-physical models are combined into model chains for this scope. Among these models, the decomposition models are used to separate the direct from the diffuse solar irradiance. Such variables are rarely measured, thus making necessary their computation. Studies in literature pointed out that Yang4 is the best-performing decomposition model globally. However, in geographically limited applications, quasi-universal decomposition models like Yang4 and Engerer4 can be outperformed by local models (i.e. models parametrized with climate-specific data) such as Skartveit3 and Starke3. This makes necessary to perform local validation studies to verify the findings from worldwide validation studies. In this study, the four best-performing decomposition models are implemented in Python and experimentally validated against 1-min solar irradiance data (i.e. direct and diffuse irradiance) of Trondheim (Lat. 63°26′N, Norway). More than 1-year long data are considered. The study confirms that the Yang4 model performed the best for high-latitude applications, but Starke3 can achieve a level of performance close to Yang4.
Keywords
Introduction
In the last few years, the installed solar power capacity in Norway has experienced significant growth, escalating rapidly from 15 MW in 2015 to 150 MW in 2021, reaching 300 MW in 2022 and surpassing the 500 MW milestone by October 2023 (Noregs vassdrags-og energidirektorat, 2023). This expansion can be attributed to various factors, including the decreasing costs of photovoltaic (PV) installations, the recent increasing electricity prices and the implementation of new financing schemes and subsidies (Hjelme et al., 2022). Still, despite this recent expansion, the growth happened later than other countries in Europe, primarily due to the common perception that the Nordic countries exhibit a considerably lower solar resource potential compared to Continental Europe (Formolli et al., 2021; Hjelme et al., 2022).
Contrary to this belief, the Nordic countries, including Norway, have abundant solar availability for PV exploitation when the whole year is considered, but the distribution is different from Continental Europe. While challenges such as lower sun elevation, shorter days and potential snow coverage on panels limit yields in winter, the enhanced daylight availability, favourable outdoor temperature conditions and snow reflections create optimal conditions for harvesting solar energy from tilted surfaces starting from early spring (Babar et al., 2020; Good et al., 2014). These distinctive seasonal variations, combined with the complex coastline and topography of Norway that influence weather conditions and cloud formation (Parding et al., 2014), highlight the need for a nuanced understanding of solar energy at high latitudes. Accurate estimation of solar potential on buildings becomes crucial for optimizing solar energy use in Nordic conditions.
Although models using satellite-imaging or reanalysis systems (merging physical consistent modelling and observations) have become essential tools for solar planning in the latest decades, these products show model bias and significant differences between products occur in the Nordics (Babar et al., 2019; Urraca et al., 2018). For instance, using the Joint Research Center’s PVGIS tool, which incorporates data from both European Centre for Medium-Range Weather Forecasts’ ERA5 global reanalysis and Heliosat SARAH2 (below 65° North), the calculated annual mean differences in solar irradiance on south-facing surfaces between the two databases can be as much as 20% at many coastal locations in Norway like Bergen and Trondheim (Huld et al., 2012). To establish a reliable ground truth, high-quality measurements and modelling techniques are necessary for gaining a better understanding of the solar resource potential.
To assess insolation on a sloped surface without local measurements of solar irradiance (at the same surface tilt and orientation), the amount of solar direct normal irradiance (E bn ) and diffuse horizontal irradiance (E dh ) needs to be known. However, obtaining on-site ground measurements of E bn and E dh is costly and, therefore, not commonly available. Instead, these quantities are usually estimated from global horizontal irradiance (E gh ) using empirical decomposition models. Despite continual advancements in decomposition models, especially to cater to minute-scale irradiance applications, they remain susceptible to location-specific influences as they rely on site-specific data (Gueymard and Ruiz-Arias, 2016; Li et al., 2017). Therefore, local models (i.e. models parametrized with climate data from a restricted geographic area) can outperform models presented as quasi-universal when applied to the location where the data originates (Starke et al., 2021). This also applies to many models based on data-driven machine learning methods, which are also trained on data from specific sites (Babar et al., 2020).
Previous works recommended Yang4 as the quasi-universal decomposition model with the best overall performance. In this study, this model is experimentally validated and compared with alternatives models such as the Engerer4 (quasi-universal), the Starke3 and the Skartveit3 (both climate-specific) models, using solar irradiation data collected in Trondheim (Lat. 63°26′N, Norway). The research goal is to determine which decomposition model performs best locally (i.e. restricted geographic area) at high latitudes, focusing on the variability of model performance under diverse sky conditions (i.e. clear-sky and overcast). Moreover, this work contributes to boost the transition from the currently used two-dimensional solar maps (Brito et al., 2012; Desthieux et al., 2018b), where the visualization of solar potential is limited to the rooftop surfaces, to the three-dimensional solar cadastres, where buildings’ façades are also assessed (Brito, 2020; Desthieux et al., 2018a).
Materials and methods
Workflow
The validation process of this article is based on a four-stage workflow. The four stages consist of (stage i) data acquisition, (stage ii) data quality check, (stage iii) solar decomposition and (stage iv) experimental validation (Figure 1). The core of stage i is the solar irradiance data acquisition from both a sun tracker system, described in section 2.2, located in NTNU Gløshaugen Campus in Trondheim (Norway) and the Solar Radiation service from Copernicus Atmosphere Monitoring Service (CAMS). Additionally, the case study location (e.g. latitude, longitude), and the analysed time interval (i.e. from July 2022 to September 2023) are defined.
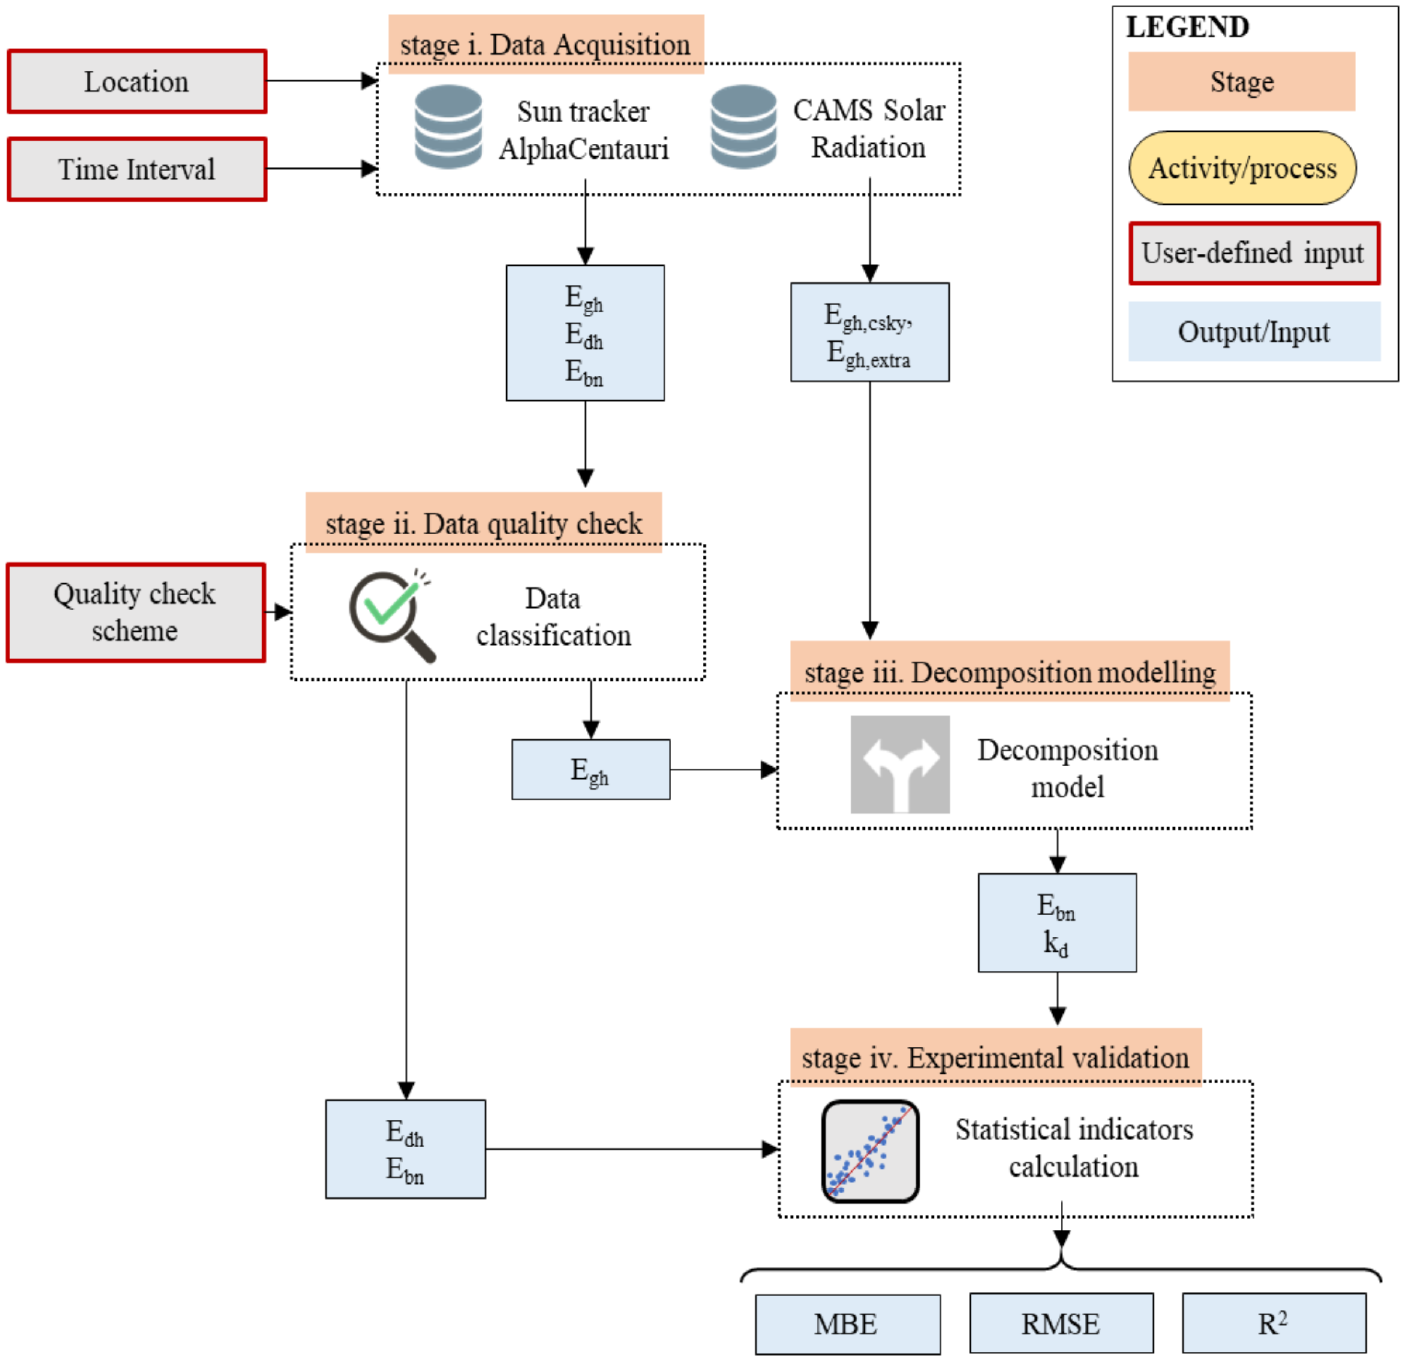
Overview of the workflow followed in this study. The (i) data acquisition, (ii) data quality check, (iii) decomposition modelling and (iv) experimental validation stages are highlighted together with the dataflows.
Stage ii includes the quality control of the measurement data. Each datapoint is labelled according to the quality check scheme described in section 2.4 and is marked (in the dataset) with a quality flag (QF). The QF is used to filter out potentially unreliable measurements.
In stage iii, the decomposition models in section 2.3, are applied to separate the E bn from the E dh . The four decomposition models investigated in this study (i.e. Skartveit3, Starke3, Engerer4 and Yang4) are initialized with data retrieved during stage i. The diffuse fraction (k d ) is calculated with 1-min time resolution and then used to estimate the E bn . In particular, the irradiance.dni function from pvlib is used to quantify the E bn .
During stage iv, the modelled k d is validated against the observed k d . Similarly, the modelled and observed E bn quantities are compared. Three statistical indicators are used to evaluate the accuracy of the k d and E bn estimations: the Mean Bias Error (MBE), the Root Mean Square Error (RMSE) and the coefficient of determination (R2).
Alpha Centauri pilot at NTNU-SINTEF SolarNet
The case study considered in this project is the outdoor experimental facility Alpha Centauri (SINTEF AS, 2022), located in the NTNU Gløshaugen Campus in Trondheim (Lat. 63°26′N, Norway) and part of the NTNU-SINTEF SolarNet (Manni et al., 2023). The solar facility makes use of four dual-axis system to test different orientations of PV panels, or to follow the sun path thanks to a tracking system enhanced with a programmable logic controller (Figure 2). The facility is similarly applied to the test of bi-facial PV modules. Besides the solar active systems implemented in the testing platform, the Alpha Centauri is equipped with advanced measurement system for solar irradiance and weather variables on site. In this regard, a SOLYS2 sun tracker and a weather station measure E gh , E bn , E dh , wind speed and ambient temperature.
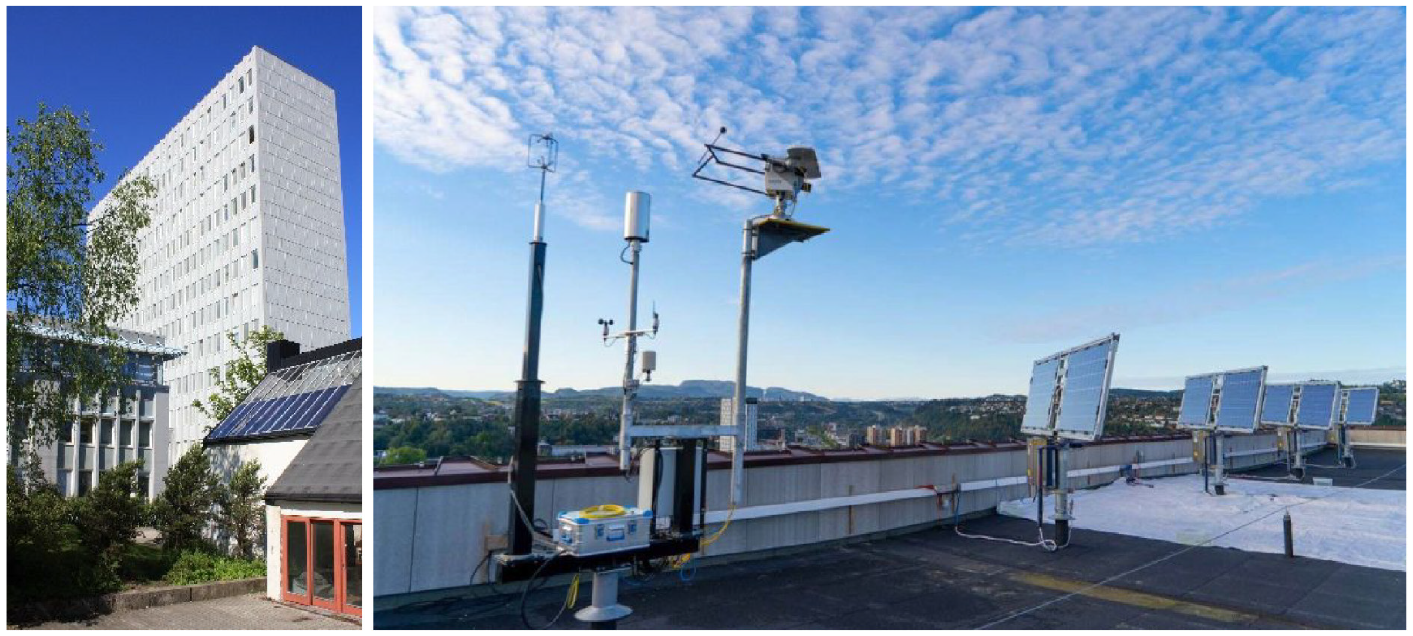
Alpha Centauri outdoor experimental facility installed on rooftop of the Sentralbygg 1 (on the left) at the NTNU Gløshaugen Campus in Trondheim, and the experimental monitoring apparatus (on the right).
Decomposition models
The Skartveit3 model is a decomposition model parametrized with solar irradiance data from Bergen (Skartveit et al., 1998). Although implemented for hourly data, the model can be applied to 1-min solar analysis considering the issues related to cloud enhancement phenomena which have been highlighted by Gueymard and Ruiz-Arias (2014). The k d estimated by the Skartveit3 model is calculated as:
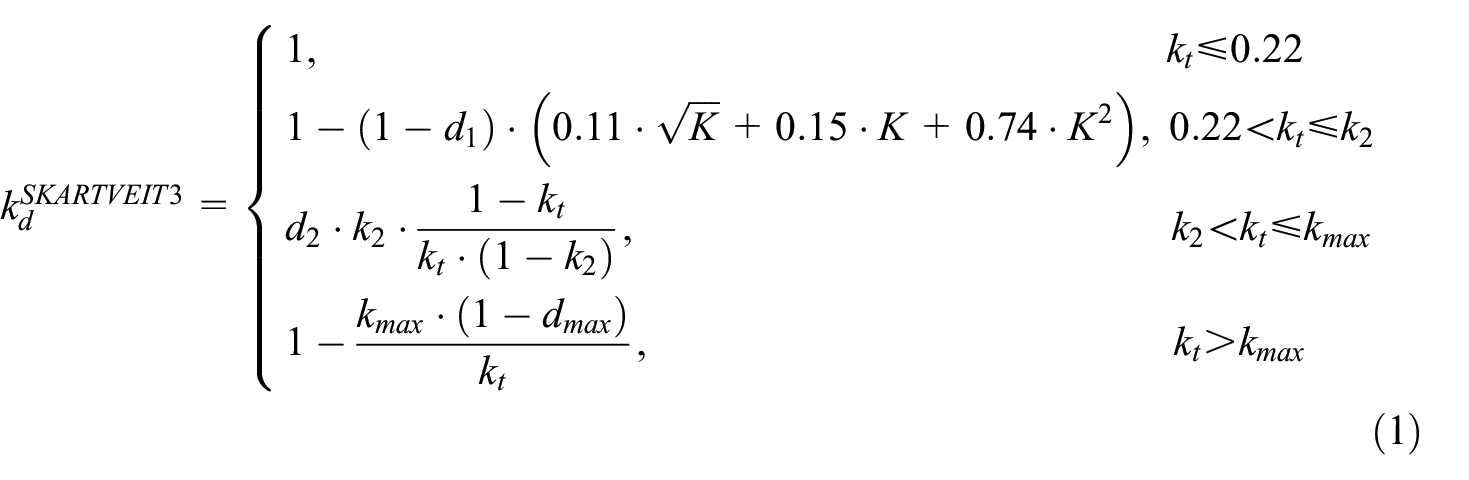
Where k t is the clearness index and the other coefficients (e.g., d1, K, k2, d2, kmax and dmax) are defined as described in (Skartveit et al., 1998). Such coefficients are mostly derived from the solar elevation (h) in degrees and the kt.
Furthermore, the term
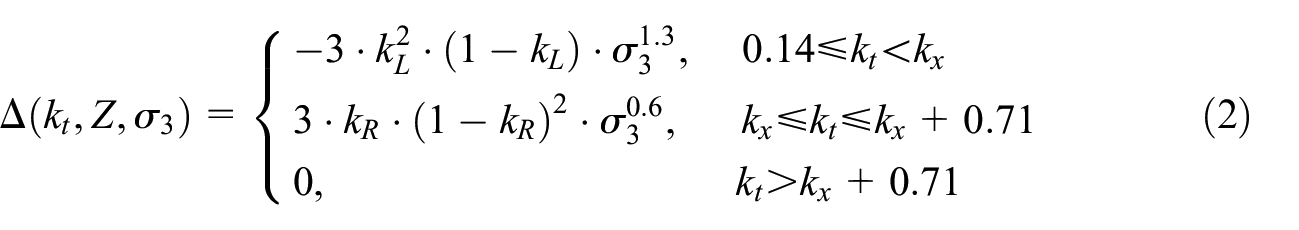
Where k x depends on h and both the k R and k L are function of the k t . These coefficients are determined according to (Skartveit et al., 1998).
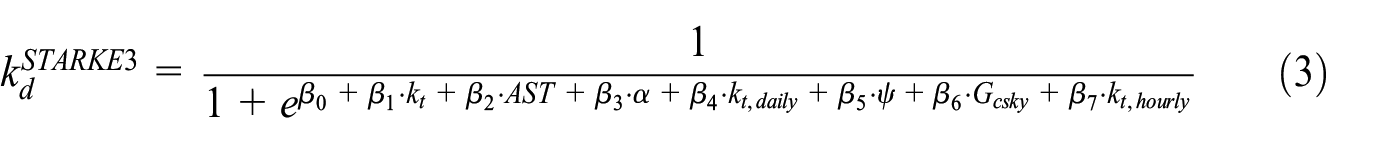
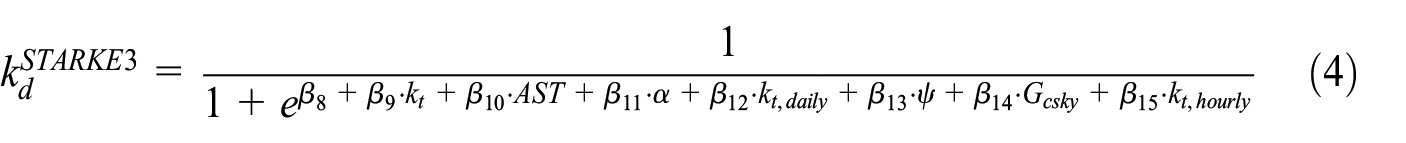
The Starke3 model (Starke et al., 2021) is based on a logistical function and consists of an exemplary application of climate-specific fitting (i.e. exploiting a set of coefficients specifically determined for each climate zone) using 1-min data. The model was developed for the diverse climate zones that were identified by the Köppen Geiger classification (Beck et al., 2018). The set of coefficients for the continental sub-artic climate (Dfc) climate zone (i.e. the climate zone of Trondheim according to Köppen Geiger classification, Beck et al., 2018) is used in this study. To calculate the k d , the equation (3) is utilized when the K csky , which is the ratio of the measured E gh and the modelled global clear-sky irradiance (Egh,csky), is higher than 1.05 and k t is higher than 0.75. Otherwise, equation (4) is followed for the calculation.
The Engerer4 model is a quasi-universal model which was implemented by Bright and Engerer (Bright and Engerer, 2019) who updated the Engerer2 (Engerer, 2015) model by recalculating the parameters with datasets from 75 different stations worldwide (i.e. global model refitting process). It calculates the k d accordingly to the equation:
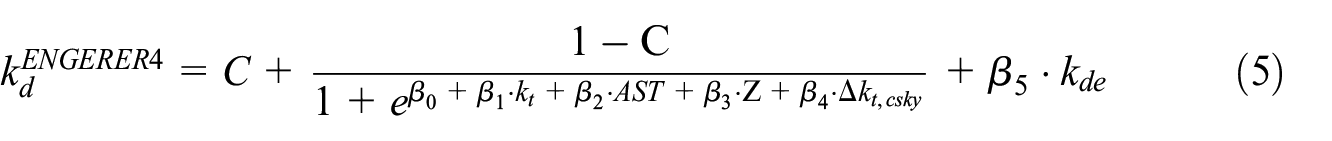
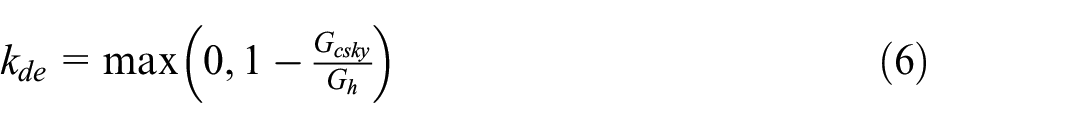
Where AST is the apparent solar time, Z is the solar zenith angle and Δk tc is the deviation of k t from the clear-sky value of the clearness index (k t,csky ). The C and the β-coefficients are the same presented in (Bright and Engerer, 2019). Finally, the k de , which quantifies the portion of the k d that is attributable to cloud enhancement events, is calculated as:
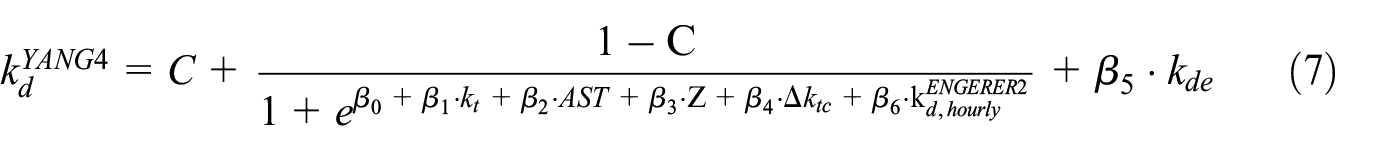
The Yang4 model was introduced in (Yang, 2022) as an application of temporal-resolution cascade, hence a cascading of two separation models with different temporal resolutions. The model can replace Engerer2 as the new quasi-universal model. The model consists of an enhanced version of Yang2 model where the satellite-based k d is replaced by the hourly k d estimated by the Engerer2 model. This improvement enables the real-time application of the Yang4. The k d is determined accordingly to the equation:
Solar radiation dataset
Solar irradiance data used in this work refer to Trondheim (63°N, 10°E). The solar irradiance data are acquired from the SOLYS2 sun tracker installed on the Sentralbygg 1 at NTNU Gløshaugen Campus as part of the NTNU-SINTEF SolarNet (Manni et al., 2023). The dataset includes E gh , E dh and E bn , which was recorded from July 2022 to September 2023 with a time resolution of 1 min.
Other solar radiation parameters such as the global horizontal extra atmosphere irradiance (Egh,extra) and Egh,csky are retrieved from CAMS to be used as model predictors. In addition, the direct normal irradiance extra atmosphere (Ebn,extra) is estimated by mean of the function irradiance.get_extra_radiation in pvlib, applying the Spencer method and using, as input, an array of timestamps and a solar constant of 1366.1 kW/m2. These variables are estimated for the same time interval, with 1-min time resolution.
Data quality check
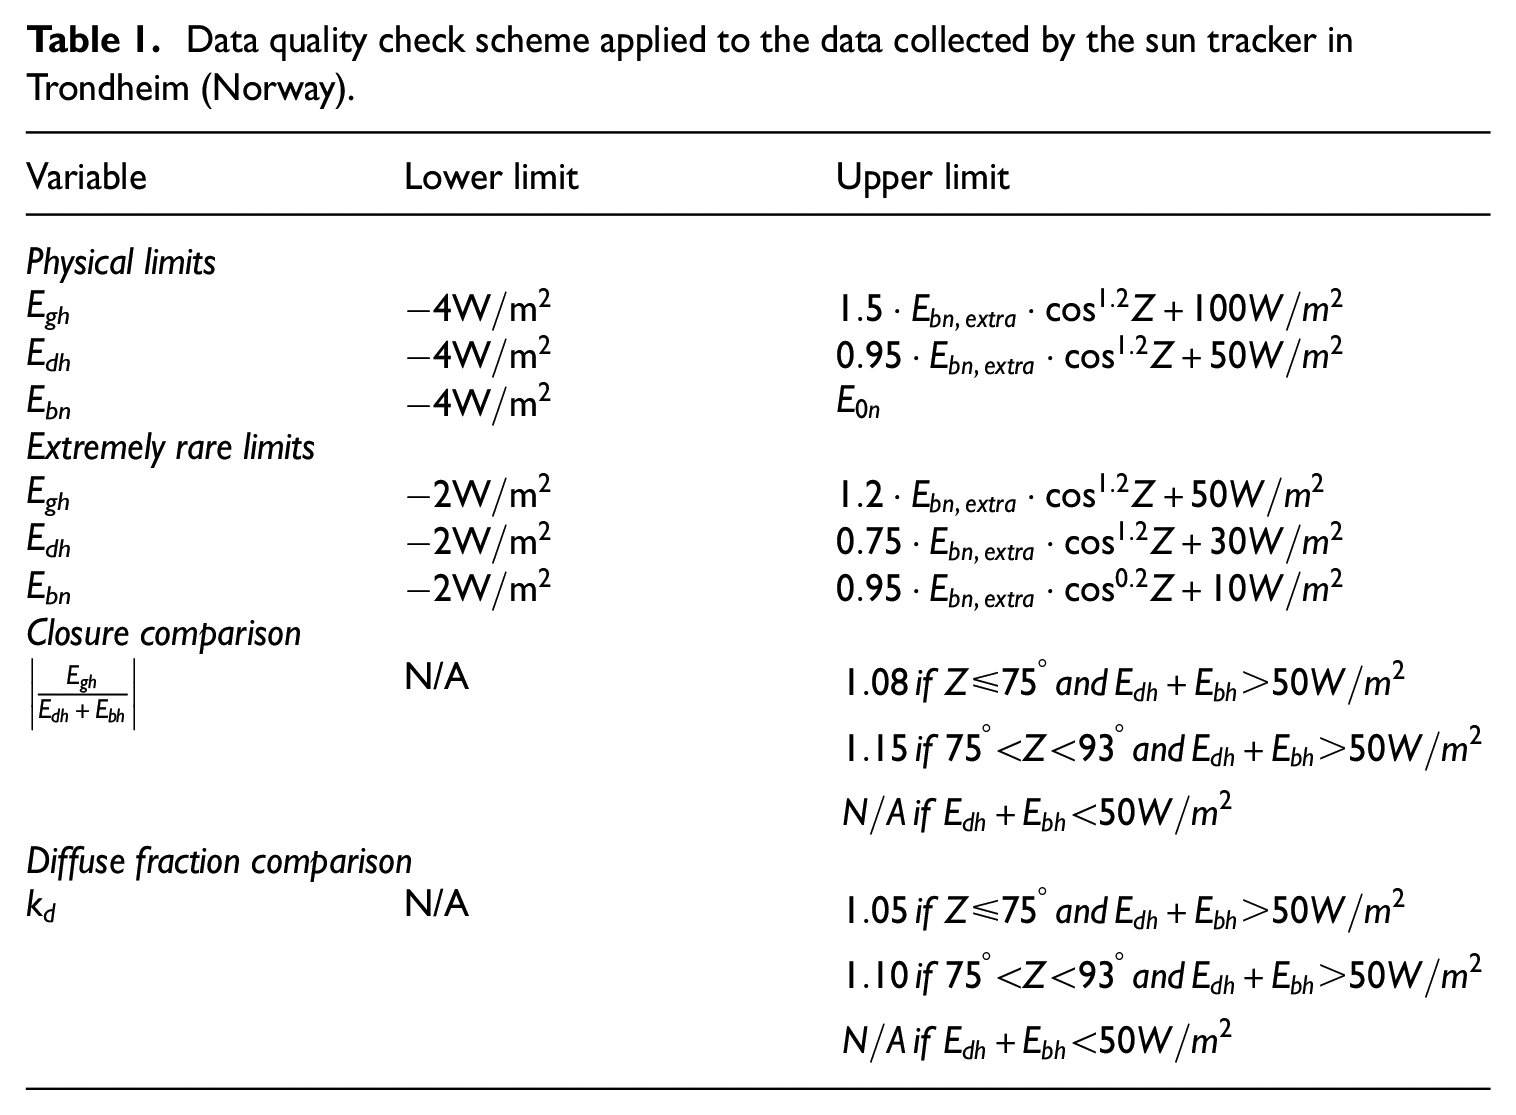
Although there is a lack of universally recognized processes for data quality control when it comes to solar irradiance (Starke et al., 2021; Yang and Boland, 2019; Yang et al., 2018), the one proposed by Long and Shi (Long and Shi, 2008) and more recently used by the Baseline Surface Radiation Network (BSRN), is the most popular among scholars and experts. In this study, this protocol is firstly used to classify each datapoint, and then to determine which data need to be excluded due to a low level of accuracy. To filter out the measurements, the data acquired by the sun tracker during the daytime (Z lower than 90°) is compared to both the global physically possible limits and the extremely rare limits (Table 1) determined according to Long and Shi (Long and Shi, 2008). Furthermore, other two tests (Table 1) are performed to detect low-quality measurements (i.e. observations that can be unreliable) from the equipment. The deviation of the observed E gh from the sum of the direct horizontal irradiance (E bh ) and the E dh is assessed together with the k d . However, when measured or calculated E gh is less than 50 W/m2 or Z is higher than 93°, these tests are not possible since the sensors show a lower accuracy when the sun is very low on the horizon and the solar radiation amounts are minimal.
Data quality check scheme applied to the data collected by the sun tracker in Trondheim (Norway).
Statistical indicators
Several studies present performance indicators that can be used in radiation models for validations purposes (Gueymard, 2014; Taylor, 2001). Among those, three statistical indicators were chosen: the RMSE, the MBE and the R2. The MBE consists of the average of the errors of a sample space thus allowing comparative analyses among different models. When these values are positive it means that the numerical model tends to over-predict the measured parameter, and vice versa. It is worth highlighting that the use of MBE alone is not recommended since this index can be subject to cancellation errors.
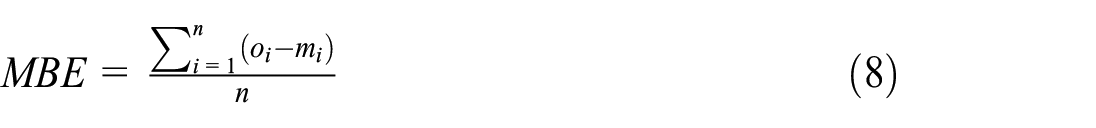
Where o i is the i-th observed value, m i is the i-th modelled value and n is the total amount of values.
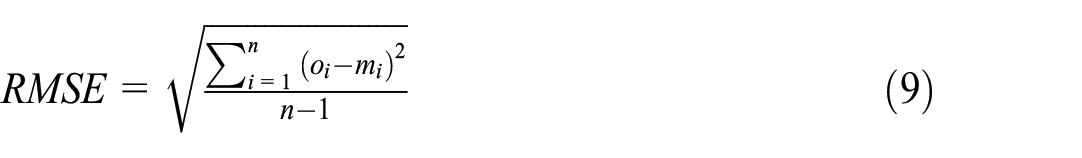
The RMSE measures the variability of the errors between observed and modelled values. The RMSE is not subject to cancellation errors; thus, the AHSRAE Guidelines (ASHRAE, 2002) couples it with the MBE index to verify the models’ accuracy.
In addition, both the normalized MBE (nMBE) and the normalized RMSE (nRMSE) are calculated by normalizing, respectively, the MBE and RMSE to the mean of the observations. This enables a better comparison with dataset from other studies.
The R2 provides information on how close the simulated values are to the regression line of the observed values. It ranges from 0 to 1, where 0 indicates a complete mismatch between observed and simulated values and 1 a perfect match.
Results
Data quality check
The quality check of solar irradiation data recorded by the sun tracker between July 2022 and October 2023 is performed by assigning a QF to each observation. Figure 3 presents an overview of these flag values.
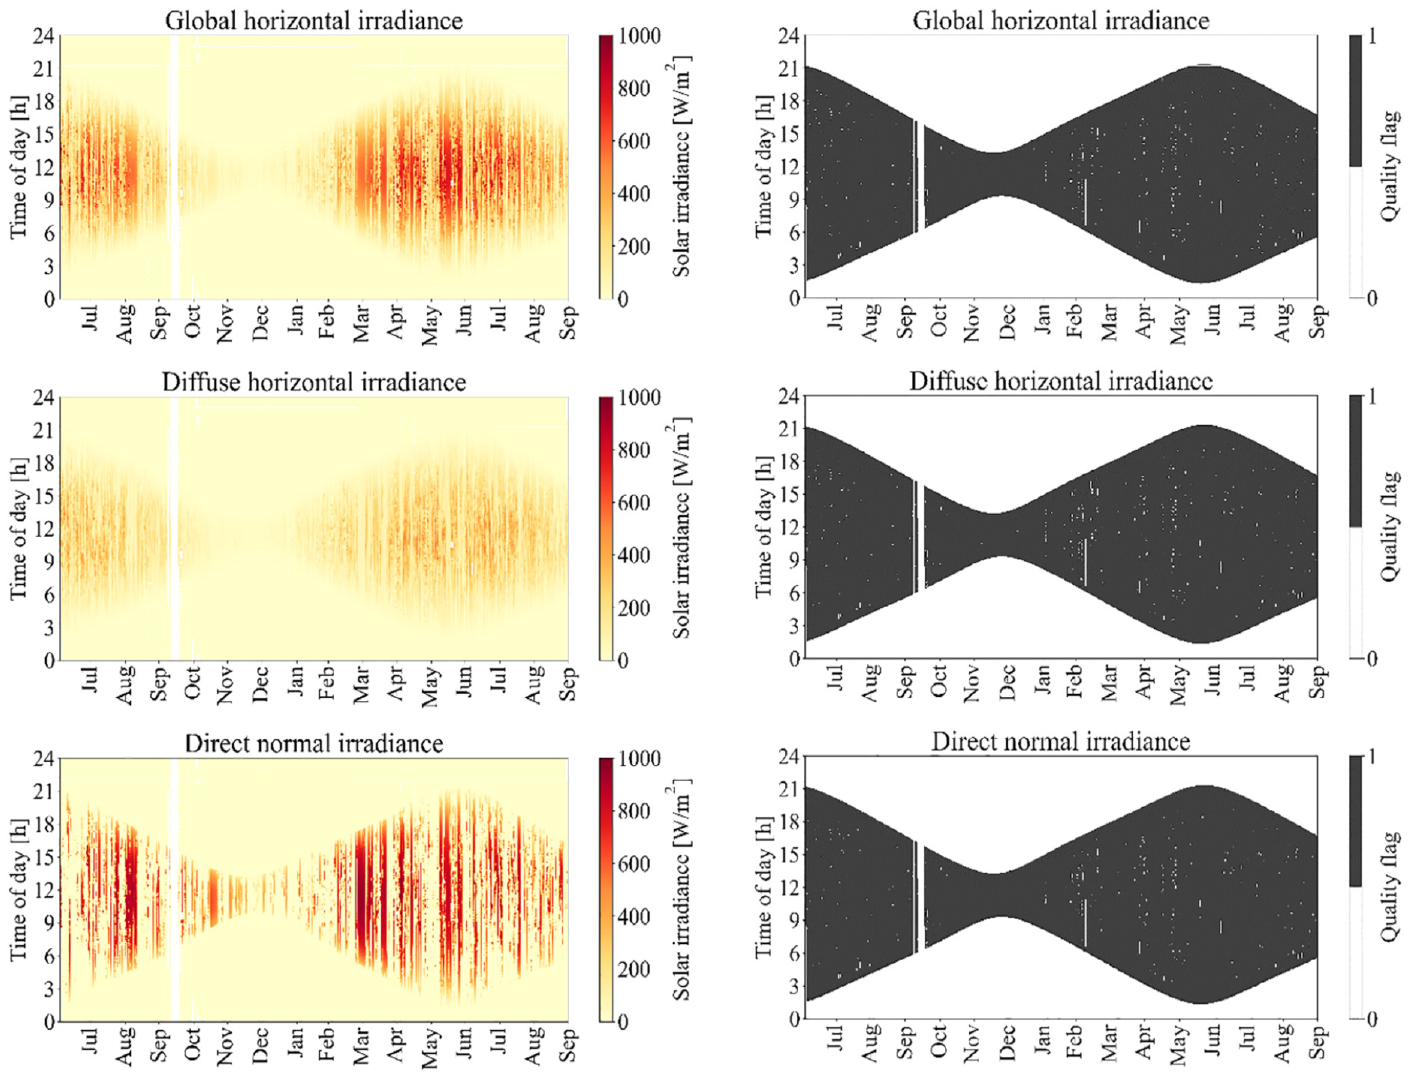
Overview of the solar irradiance data (E gh , E dh and E bn ) recorded from July 2022 and September 2023 in Trondheim (left), and the corresponding quality flags (right).
The analysis highlighted that most of the datapoints during the daytime are filtered out because of the closure comparison and the diffuse fraction comparison (see Table 2). Conversely, a few hundred datapoints (from 100 to 254) are excluded due to the physical limits.
Number of excluded datapoints for each test in the quality check scheme.
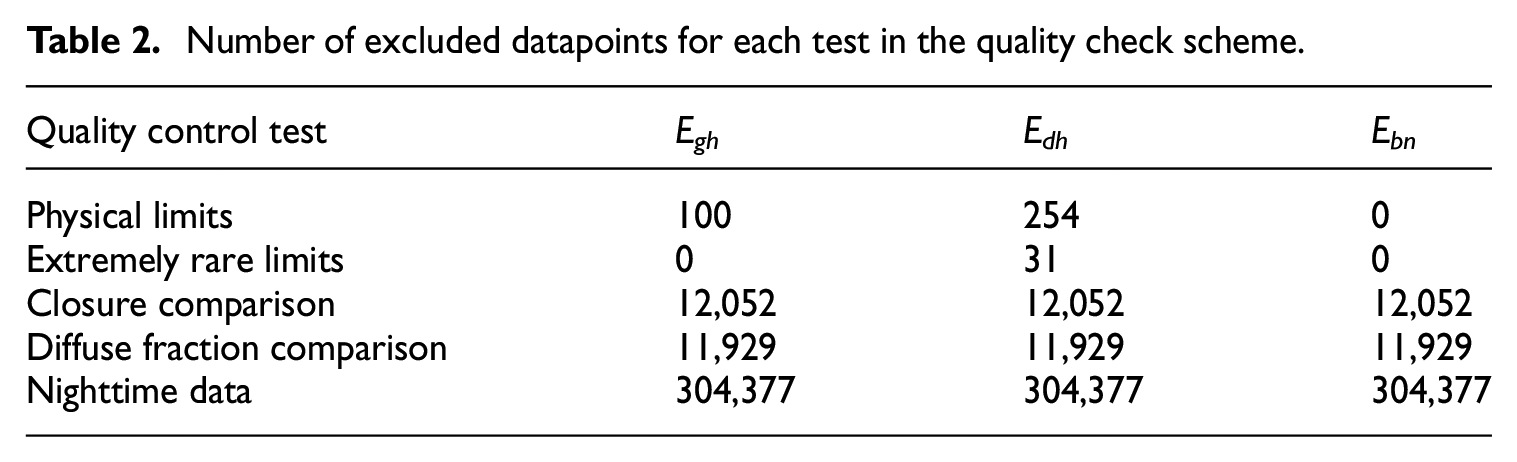
After the quality control routine, the length of the dataset containing the observed solar irradiance variables was reduced from 653,126 to 342,479 rows. Circa half of the datapoints (47%) were discarded. It is worth mentioning that datapoints representative of night hours are also included in this amount.
Decomposition modelling
Diffuse fraction
In Figure 4, the calculated k d is plotted against the k t for each investigated model. On the background of the plots, the observations are depicted with a light blue colour. The outcomes from all decomposition models are distributed similarly to the observed values, although only the Starke3 and Yang4 models show a similar spread of the datapoints.
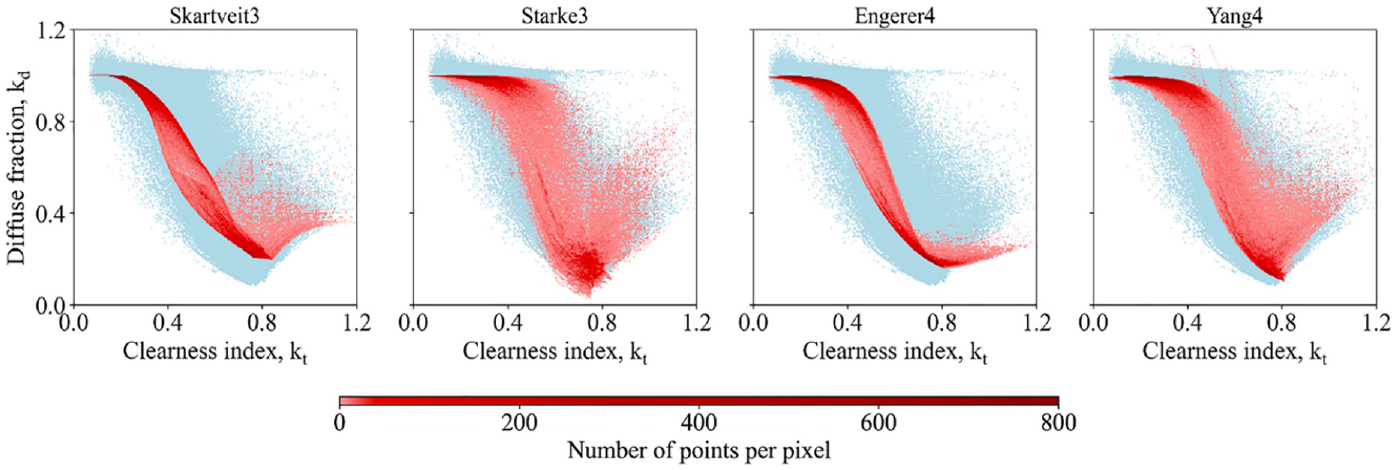
Observed kt–kd relationship (light blue dots) and modelled kt–kd relationship (red dots) throughout the investigated time interval.
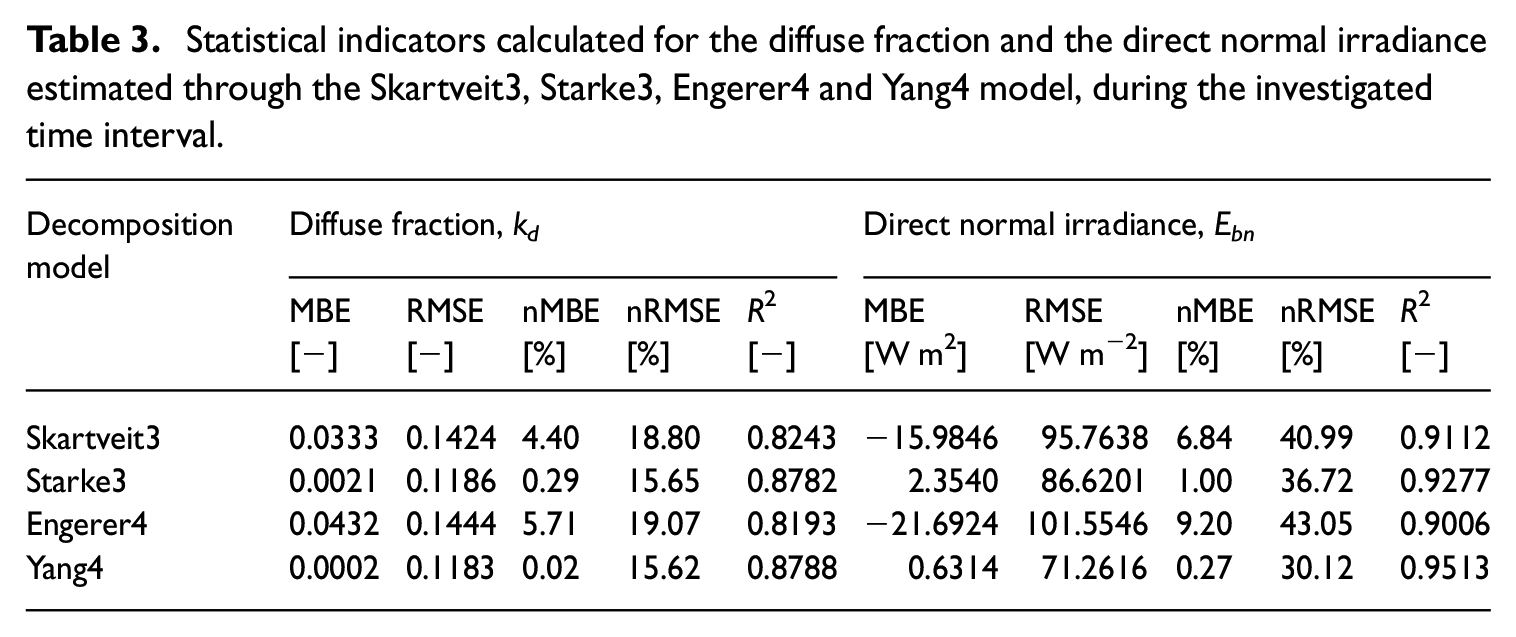
The assessment of the calculated statistical metrics (Table 3) highlights that the Yang4 is the most accurate model to estimate the k d . In fact, the MBE, RMSE and R2 indicators calculated for Yang4 are significantly low, respectively 0.0002, 0.1183 and 0.8788. However, the performances of Starke3 (MBE = 0.0021, RMSE = 0.1186 and R2 = 0.8782) are close to the Yang4. Finally, the Skartveit3 and Engerer4 models behaves similarly. Their MBE values highlight the tendency of the two decomposition models to overestimate the k d by circa 5% (MBE is 0.0333 for Skartveit3 and 0.0432 for Engerer4). These models also show the worse R2 values (around 0.820).
Statistical indicators calculated for the diffuse fraction and the direct normal irradiance estimated through the Skartveit3, Starke3, Engerer4 and Yang4 model, during the investigated time interval.
Direct normal irradiance
The E bn calculated from the E dh by applying the four decomposition models are plotted against experimental data in Figure 5. In terms of model performance, the Yang4 is confirmed as the most accurate (MBE = 0.6314 W/m2, RMSE = 71.2616 W/m2 and R2 = 0.9513), while the Starke3 can achieve performance levels like Yang4. The large overestimations of the k d that are determined for the Skartveit3 and Engerer4 result into underestimations of the E bn (MBE ranges between −15 and −20 W/m2). Similarly, the other statistical indicators (i.e. RMSE and R2) allows to consider the Skartveit3 and Engerer4 as the least accurate options among the four investigated models.
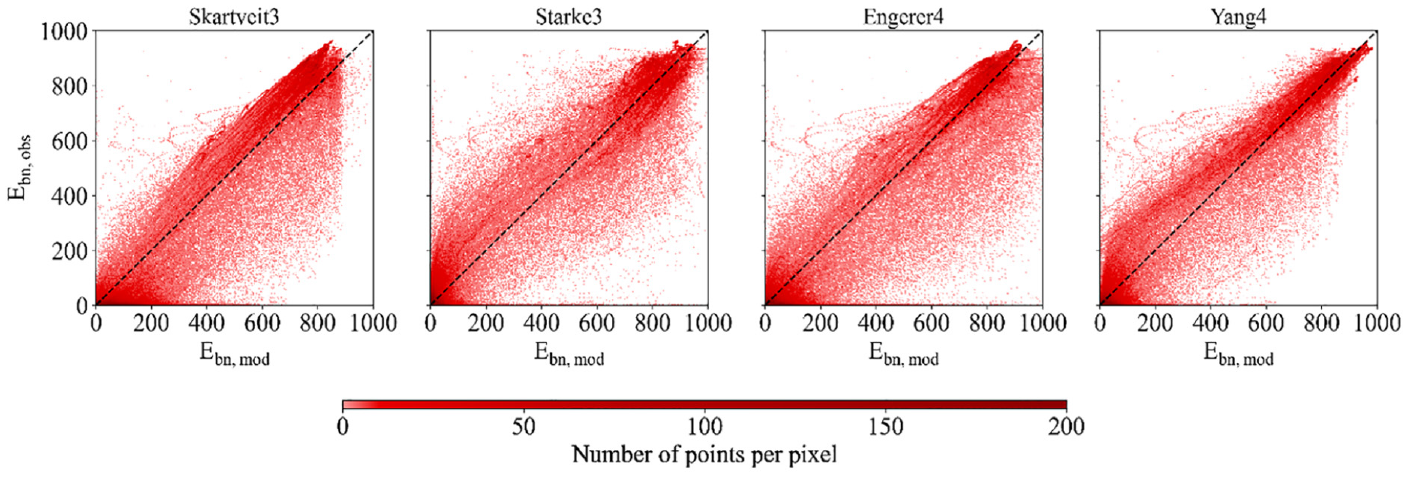
Modelled direct normal irradiance (Ebn,mod) versus observed direct normal irradiance (Ebn,obs) in Trondheim with the four investigated models.
Performance variability under clear-sky and overcast conditions
This section focuses on the evaluation of the accuracy of the four decomposition models to estimate the E bn and E dh . Their simulation performances are assessed considering respectively clear-sky and overcast conditions on an annual basis. In addition, a focus on three exemplary clear-sky days (daily k t is always higher than 0.65) between the 5th and the 8th of September 2022 and three exemplary overcast days (daily k t is circa 0.20) between the 14th and the 17th of July 2022 is presented.
Clear-sky conditions
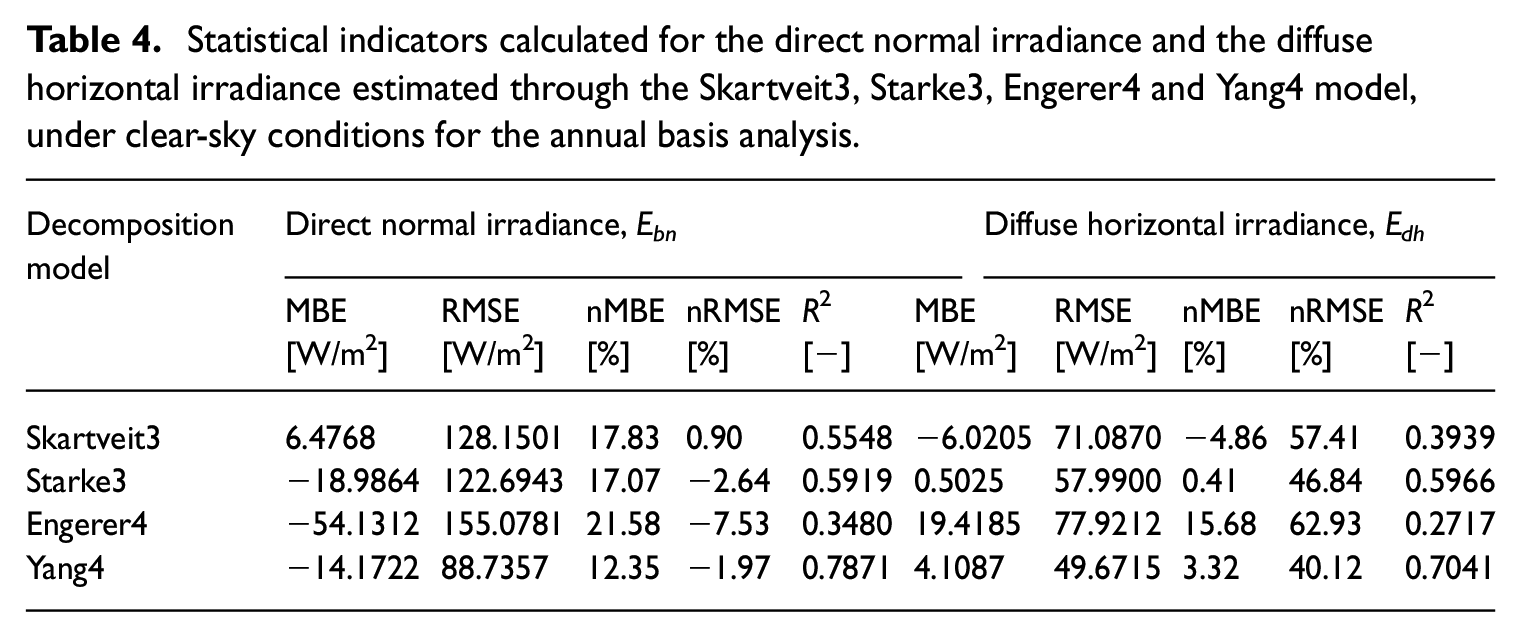
The analysis of the model performance under clear-sky conditions throughout the year highlights how the four models are more accurate when estimating E bn rather than E dh . Indeed, the models have the highest R2 values for the E bn as shown in Table 4. Moreover, the largest difference in R2 values between the E bn and E dh is found in Skartveit3, while the Starke3 is the most consistent model in terms of simulation performances. However, the Yang4 model is the one performing better for both E bn (R2 = 0.7871) and E dh (R2 = 0.7041).
Statistical indicators calculated for the direct normal irradiance and the diffuse horizontal irradiance estimated through the Skartveit3, Starke3, Engerer4 and Yang4 model, under clear-sky conditions for the annual basis analysis.
When considering the three days of clear-sky conditions, the four decomposition models can estimate the E bn with a high accuracy (Figure 6). Although the modelled quantities are always higher than the observations, the two timeseries show a robust correlation with the R2 indicator that ranges from 0.9483 (Starke3) to 0.9818 (Yang4). Conversely, the four decomposition models exhibit a tendency to significantly underestimate the E dh during the three clear-sky days (Figure 7). In this case, the R2 varied from 0.2811 (Skartveit3) to 0.8483 (Yang4).
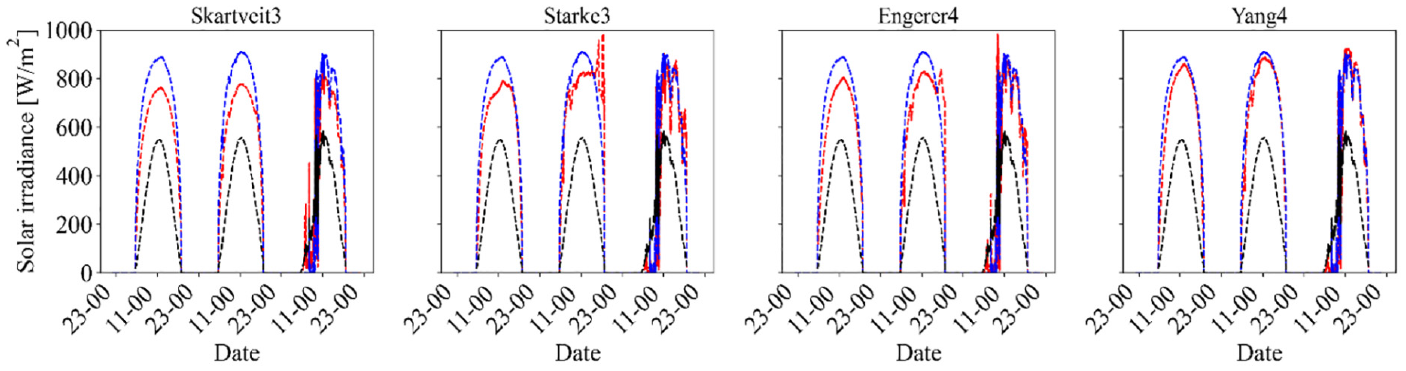
Modelled E bn (dashed red line), observed E bn (dashed blue line) and observed E gh (dashed black line) in Trondheim during the three consecutive clear-sky days between the 5th and the 8th of September 2022.
Modelled E dh (dashed red line), observed E dh (dashed blue line) and observed E gh (dashed black line) in Trondheim during the three consecutive clear-sky days between the 5th and the 8th of September 2022.
Overcast conditions
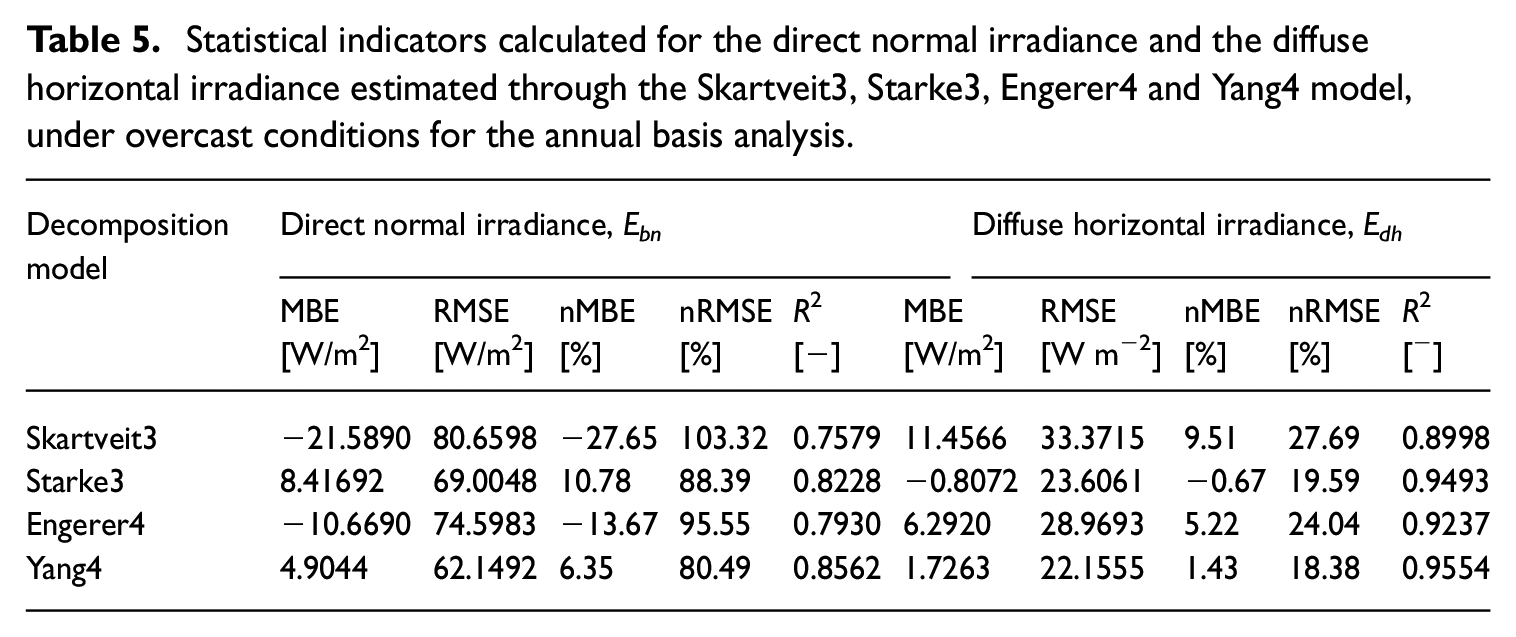
The statistical indicators in Table 5 show that for the annual basis analysis the four decomposition models can better estimate the E dh than the E bn , when considering overcast conditions. In particular, the E dh outputs from the diverse models demonstrate to be strongly correlated with the E dh observations as the R2 values are close to or higher than 0.900. Lower R2 values are quantified for E bn , although the model ranking is the same as in E dh estimations, with the Yang4 (R2 is 0.8562 for E bn and 0.9554 for E dh ) and Starke3 (R2 is 0.8228 for E bn and 0.9493 for E dh ) in the first and the second position, respectively.
Statistical indicators calculated for the direct normal irradiance and the diffuse horizontal irradiance estimated through the Skartveit3, Starke3, Engerer4 and Yang4 model, under overcast conditions for the annual basis analysis.
When the analysed time interval is restricted to the three overcast days, the capability of the four decomposition models to estimate the E bn worsen remarkably (Figure 8). The sole Starke3 model can provide accurate E bn estimations (R2 = 0.5764). This is due to the low capability of the models to predict instantaneous peaks of solar irradiance that may take place during overcast days (e.g. during the first day). Such difficulties are more evident in Skartveit3 and Engerer4 than in Starke3 and Yang4. On the other hand, all the models are capable to accurately simulate the E dh (Figure 9), as demonstrated by the R2 values that are always higher than 0.960.
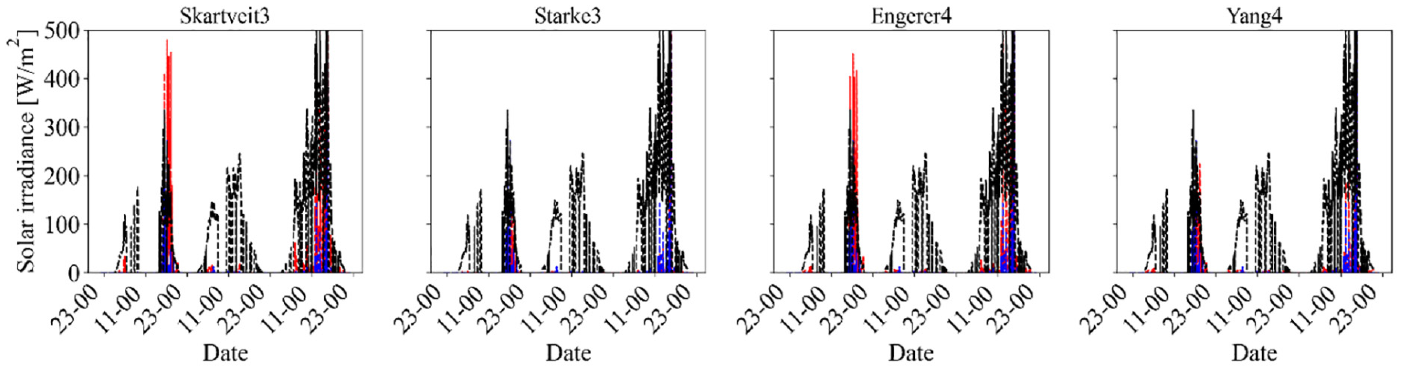
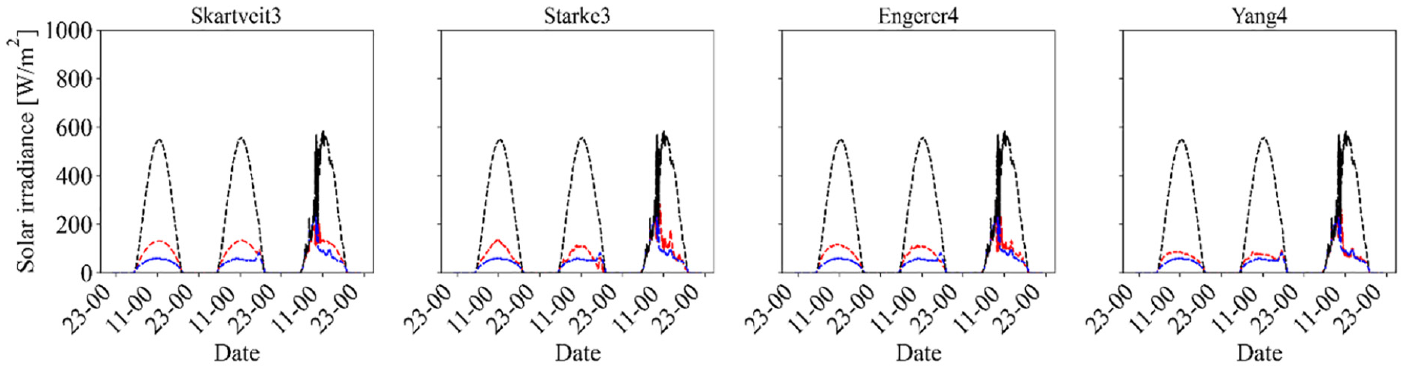
Modelled E bn (dashed red line), observed E bn (dashed blue line) and observed E gh (dashed black line) in Trondheim during the three consecutive overcast days between 14th and 17th of July 2022.
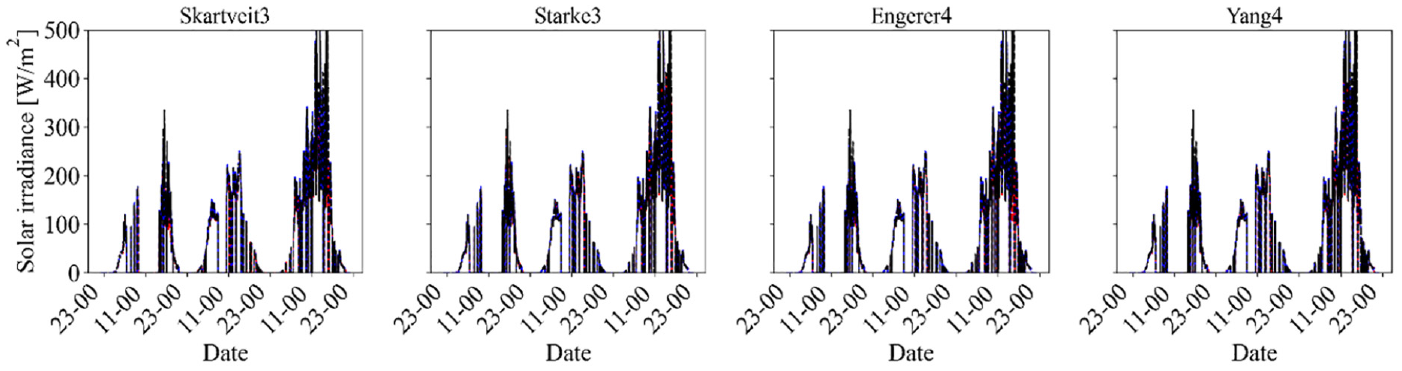
Modelled E dh (dashed red line), observed E dh (dashed blue line) and observed E gh (dashed black line) in Trondheim during the three consecutive overcast days between 14th and 17th of July 2022.
Recommendation for solar decomposition at high latitudes
The outcomes from the experimental validation carried out in this study confirm that the Yang4 model is the most accurate when applied in Trondheim (Table 3). The model is found to perform better than the other climate-specific and quasi-universal models. In fact, the lowest values of MBE and RMSE are associated to the Yang4 model in case of k d (MBE = 0.0002 and RMSE = 0.1183) and E bn estimation (MBE = 0.6314 and RMSE = 71.261). Regarding the R2 correlation, the Yang4 shows the highest value only for the E bn (0.9513).
When it comes to climate-specific model (i.e. Starke3) and model parametrized with data from Norway (i.e. Skartveit3), the Starke3 model achieves performance levels close to the Yang4 and outperformed the Engerer4 and the Skartveit3. In fact, the MBE, RMSE and R2 indicators are equal to 0.0021, 0.1186 and 0.8782 for k d estimations, and 2.3540 W/m2, 86.6201 W/m2 and 0.9277 for the modelled E bn quantities.
To extend the validity of the results beyond the specific case of Trondheim location, the validation workflow is repeated using solar irradiance data from Ny Ålesund (Lat 78°55'N). The dataset, which contains observations about E bn , E dh and E gh , is retrieved from the BSRN portal (Maturilli, 2020). Validation results confirmed the Starke3 and Yang4 as the best-performing models at high latitudes, but the Skartveit3 and Engerer4 are still reliable models. In k d estimations, Starke3 (MBE = 0.0006 and R2 = 0.849) outperforms Yang4 (MBE = 0.0112 and R2 = 0.767). Conversely, Yang4 can simulate the E bn with a higher accuracy (MBE = −13.4985 W/m2 and R2 = 0.939) than Starke3 (MBE = −3.9945 W/m2 and R2 = 0.882). However, it is worth noting that further analyses in other high latitude locations are needed to robust these recommendations.
In conclusion, the use of Yang4 model is recommended for applications at high latitudes being the most reliable decomposition model. However, the Starke3 model can also be exploited with comparable results in terms of accuracy, while the Skartveit3 model can be an adequate solution when all the information regarding the predictors of the Yang4 and Starke3 models (e.g. E gh , E gh,extra , E gh,csky , AST, Z and k d,hourly estimated with the Engerer2 model) are unavailable. In fact, the Skartveit3 model requires only the k t and the Z as predictors, making the model the simplest among the investigated ones.
Conclusions and future developments
Starting from the finding from worldwide validation studies (Gueymard and Ruiz-Arias, 2016; Yang, 2022), a validation with local data is performed in this paper. In addition, the article aims at identifying the most reliable decomposition model among the ones considered (i.e. Skartveit3, Starke3, Engerer4 and Yang4). The decomposition models are experimentally validated against solar irradiance data collected between July 2022 and October 2023, in Trondheim. Furthermore, insight into performance variability under clear-sky and overcast conditions is provided.
The main findings of this study are the following:
Yang4 model, which demonstrated to be the most reliable quasi-universal model, it is also the most reliable for Trondheim climate and high latitudes in general.
Starke3 model (climate-specific) can perform similarly to Yang4, despite of a lower accuracy when simulating clear-sky conditions.
Skartveit3 model is also reliable, particularly under overcast conditions, and at the same time it requires a lower number of predictors as input parameters.
All models perform better under overcast conditions than clear-sky conditions, particularly when estimating E dh .
Validation results for Ny Ålesund confirmed the analysis results for the case study of Trondheim.
Future developments of this study include: (i) to extend the use of the same to other case study locations and (ii) to perform the validation of other decomposition models at high latitudes.
Footnotes
Appendix
Acknowledgements
The authors also wish to acknowledge the Faculty of Engineering, the Department of Civil and Environmental Engineering for their support in terms of resources and infrastructure.
Declaration of conflicting interests
The author(s) declared no potential conflicts of interest with respect to the research, authorship, and/or publication of this article.
Funding
The author(s) disclosed receipt of the following financial support for the research, authorship, and/or publication of this article: The authors gratefully acknowledge the support from the Norwegian Research Council (research project FRIPRO-FRINATEK no. 324243 HELIOS - eHancing optimal ExpLoitation of Solar energy in Nordic cities through the digitalization of built environment).