
Abstract
Smart sensor technologies to monitor temperature and moisture conditions in building components can be used to give automatic warnings for abnormal high levels of moisture. Flat compact roofs are of particular interest in this context, especially due to their vulnerability to rain leakages through the roofing membrane. Installing moisture sensors in such roofs measuring relative humidity (RH) and free water may give an early warning of rain leakages or condensation owing to air leakages from indoors before damage occurs. One challenge is, however, that normal moisture redistribution in the insulation layer over the season or a day may give very high levels of RH in the top or bottom part of the insulation. A sensor system must be able to distinguish between these normal RH levels and leakage events. Together with a sensor technology and control system producer, a semi-quantitative system that defines typical or normal RH levels in the insulation layer of the roof during the year has been developed. To investigate the applicability of such a system, measurements from the compact roofs of two pilot buildings located in Norway have been analysed. The objective has been to identify connections between measured data, occurring climate conditions and seasonal variations. Results may be used to further develop and improve the algorithms of the leakage warning system.
Introduction
The building sector has been increasingly using sensor and monitor technologies to provide owners, designers, and occupants with important information concerning the performance, safety and cost-effectiveness of the building. Common parameters of interest are, for instance, temperature, carbon dioxide, and humidity (Hayat et al., 2019). The latter can be measured through several types of sensors that are suitable for installation in building components (Saïd MNA, 2007). Smart sensor technologies to monitor temperature and moisture conditions are under constant development nowadays. Such sensors, when installed during the erection of a building, may be used to give automatic warnings for abnormal high levels of moisture. There are, however, few studies focusing on warning systems for leakages in building components in the literature. Some studies cover warning systems in buildings but focus on degradation of load-bearing elements for example (Mora et al., 2021; Wu et al., 2022).
According to future scenarios, climate change may result in an increase of daily land rainfall extremes up to 30% for annual events, by the end of this century (Gründemann et al., 2022). Since extreme rainfall will occur more often, the building envelope must be able to withstand greater stresses both in new and existing constructions.
Flat (or low-sloped) compact roofs are particularly interesting to monitor, owing to their vulnerability to rain leakages through the roofing membrane (Bunkholt et al., 2021; Geving and Holme, 2010; Kalamees et al., 2020; Kordziel et al., 2020; Time et al., 2008). Flat roofs are increasingly being used for purposes like energy generation with photovoltaics and buffering of heavy rain events (blue-green roofs), making the roofing membrane more exposed to rain leakages and any repairs after leakages more expensive (Andenæs et al., 2021). Installing moisture sensors in such roofs to measure relative humidity (RH) or free water may give an early warning of rain leakages – before they start to get problematic and while the repair costs are low. In compact roofs, moisture damage can also occur in relation to air leakages from the indoor air through perforations and insufficiently tightened joints, such as those between roof and external walls. Moreover, condensation due to air leakages from indoors may also be discovered, and this is particularly interesting in buildings with high indoor humidity like swimming pools. During the heating season, the difference between indoor and outdoor air density leads to overpressure in the upper parts of the building and might cause moisture transport by exfiltration through the roof construction. Then, condensation occurs when saturated indoor air flows up into the roof and is cooled by the low outside temperature (Gullbrekken et al., 2016). For some building owners the risk of major leakages that leads to downtime for their business cannot be accepted. For museums, archives and galleries such sensor systems may help to avoid damages on their exhibition or stored items.
One challenge with moisture measurements in roofs is that normal moisture redistribution in the insulation layer over the season or day may give very high levels of RH in the top or bottom part of the insulation, without this representing a problem. Thus, a sensor system designed to give warnings or alarms must be able to distinguish between these normal levels and leakage events. Knowledge of these normal moisture levels is therefore important and can be found either through moisture measurements in real roofs (Bludau et al., 2010) or through numerical simulations with combined heat, air, and moisture models (Langerock et al., 2017; Szagri and Nagy, 2021). However, a major challenge for current sensor technologies lies in the proper integration of building physics expertise into the sensor system development, so that a correct leakage warning can be sent in relation with what moisture levels can normally be expected and where the highest moisture levels typically occur.
In a previous study, the authors performed hygrothermal simulations of compact roofs under different climate conditions, as a first attempt to identify expected moisture levels in compact roofs throughout the various seasons (Moschetti et al., 2023). This study was performed within a Norwegian research and development (R&D) project, where the authors were involved together with a sensor technology producer (Sensor Innovation, 2023). The latter has been developing a commercial control system to monitor the moisture conditions in compact roofs and detect possible rain leakages through early warning. The system is based on a relatively high number of wireless sensors that are placed in a grid pattern over the whole roof during construction, typically placed on top of the vapour barrier. The sensors measure the RH, temperature and free water. Together with continuous readings of meteorological data from public sources, the system is designed to give warnings or alarms to the operator when free water or abnormal high RH levels occur on top of the vapour barrier or any other places where the sensors are located. Through the help of algorithms that combine moisture measurements and meteorological data, it is expected that the system should be able to distinguish between expected moisture levels and rain leakages.
The main objective of this study has been to gain experience with the applicability of the sensors and the above-mentioned sensor system. More specifically, the objective has been to identify connections between measured data, occurring climate conditions and seasonal variations and to use this information to further determine the type of sensors to use in future projects and improve the algorithms of the leakage warning system.
The research question addressed in this article is:
How can leakages in compact roofs be detected using a smart control system?
How well suited are the selected sensors for use in a leakage system?
How can the smart control system be improved?
To answer these questions, the paper presents the results from a detailed analysis and processing of measured data from the compact roofs of two pilot buildings located in Norway. Connections between measured data, occurring climate conditions, and variations over different seasons, were identified and illustrated, which may be used to improve the sensor system.
The remainder of the paper is organized as follows. Section “Method” presents the methodological approach followed in this research, with the description of the pilot buildings and the data analysis. The main findings are then presented in Section “Results,” where the processing of the measured data is presented, including leakage detection/warning and seasonal variations. Then, the main findings of this article are discussed in Section “Discussion,” while conclusions and future outlooks are drawn in Section“Conclusion and future outlooks.”
Method
General approach
Time series data on temperature, RH, and free water from the sensor system on two compact roofs has been obtained from the sensor technology and control system producer. This information was analysed and compared to weather data from nearby weather stations, which included details on normal rain, outdoor air temperature and global radiation.
Pilot buildings
The sensor technology producer has installed smart control systems for leakage warning in many buildings in Norway. The two buildings analysed in this study were selected based on an assessment of roof design, date of erection, building type and location. Both pilot buildings were erected in 2021 and are located in Norway. The first analysed roof (Roof 1) is located above an office building in Drammen and the second (Roof 2) is located above an unheated workshop hall in Porsgrunn. The analysed roofs have a similar design, with a concrete load-bearing structure, a vapour barrier, a main insulation layer made of expanded polystyrene (EPS) with a thickness varying with the slope, and an asphalt roofing membrane, see Figure 2. The sensors were installed in both roofs in February 2021 and the roofing membranes were installed during the first 3 weeks of March. Data from the period 22.02.2021–15.06.2022 (∼1 year and 4 months) and 23.02.2021–06.07.2023 (∼2 years and 4 months) has been analysed for Roof 1 and Roof 2, respectively.
Position of sensors
Roof 1 contains 46 sensors positioned at the warm side of the thermal insulation, specifically on top of the vapour barrier. The sensors along the roof edge are installed at a distance of 0.6 m from the parapets. The rest of the sensors are placed symmetrically and with a distance as close as possible to 5 m (depending on the extent/size of the roof). Along the parapets and around drains, mineral wool is applied instead of EPS with an extent of 0.60 m for fire safety reasons, thus sensors 1–8 are positioned near the interface between mineral wool and EPS. The total thickness of the thermal insulation is equal at the middle of the roof (∼500 mm) and decreases toward the parapet (∼280 mm).
Roof 2 contains 52 sensors, of which 42 sensors are positioned on the warm side of the thermal insulation and 10 sensors are positioned on the cold side of the thermal insulation (close to the roof membrane). As for Roof 1, only mineral wool is applied along the edges and around transitions and drains owing to fire concerns.
For both Roof 1 and Roof 2, data from two groups of sensors are highlighted: sensors in Group 1 have the same distance to the parapet, the same insulation thickness, and are positioned near the transition between EPS and mineral wool. Sensors in Group 2 are located in the middle of the main roof. Note that the slopes of the two roofs are opposite. For Roof 1, the thermal insulation is thickest in the middle. For Roof 2, drains are positioned in the middle and the thermal insulation is thickest along the parapet. The two groups of sensors in Roof 1 and Roof 2 are illustrated in Figure 1. The sensors position within the roofs is illustrated in Figure 2.
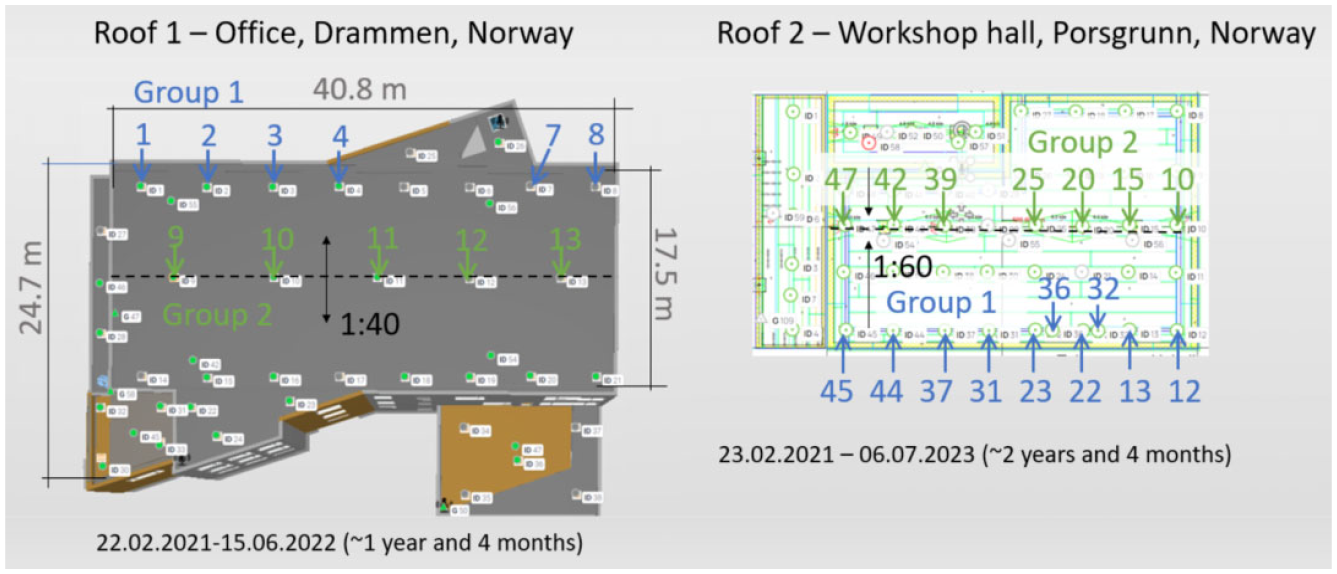
Illustration of Roof 1 and Roof 2, including the layout of the sensors in Group 1 and Group 2.
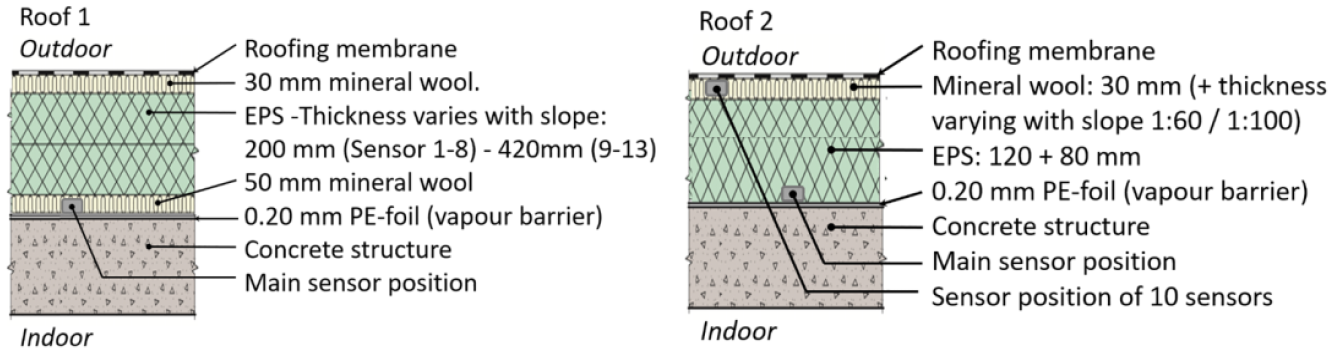
Illustration of position of sensors within the thermal insulation in Roof 1 and Roof 2.
Data analysis
The measured data were first processed for the entire measurement period and for all the sensors in the two compact roofs. The weather data were also processed, with focus on normal rain, outdoor air temperature and solar radiation. Then, the positions of the sensors were evaluated to consider: (1) the size and layout of the roof, (2) the design/build-up of the roof structure (including position of drains and transitions), (3) the thickness and type of thermal insulation and (4) the slope of the roof. Based on this evaluation, the sensors were divided into smaller groups (4–8 sensors) with common denominators, such as equal thickness, type of thermal insulation, and distance to the parapets. Variations within smaller sensor groups were then created and compared for different periods. Based on this preliminary examination, the two mentioned groups of sensors from the two roofs (Group 1 and 2) were selected and further analysed.
Daily fluctuations of temperature and RH were investigated for specific periods from different seasons (summer, autumn, winter, and spring) and compared to weather data. First, four different periods of 1 month each were selected from the annual overview that is, autumn, winter, spring, and summer. Based on this overview, 1 week was selected from each period of the year with somewhat different outdoor temperatures and RH variations. The overall comparison showed that during the first 7–8 months, the measurements were largely influenced by built-in-moisture (moisture in the insulation layer from precipitation during installation). Built-in-moisture causes very unstable and unreliable RH-readings, thus the abovementioned selection started first in October 2021. Based on this comparison, 3-day periods from the four seasons with varying solar radiation were selected and included in the analysis to show the impact of solar radiation on the RH.
Microsoft Excel was used to process the measured data. Climate data for both Drammen and Porsgrunn were retrieved from the “ERA5 reanalysis” dataset (Hersbach et al., 2020).
Sensors and data system
The sensors in the analysed roofs, called into® Sensor, measure the surrounding temperature, RH, and free water and transmits the data wirelessly through a gateway to a cloud application (iCS). In iCS, the data is processed and, if the system finds an abnormal moisture value or an immediate leakage, it warns the involved users. The into® Sensor is configured as a data logger reading the measured values in specified intervals and transmits the reading in intervals depending on chosen model. The logging interval can be configured from every 1 min to up to 15 min. The into® Sensor is depicted in Figure 3.
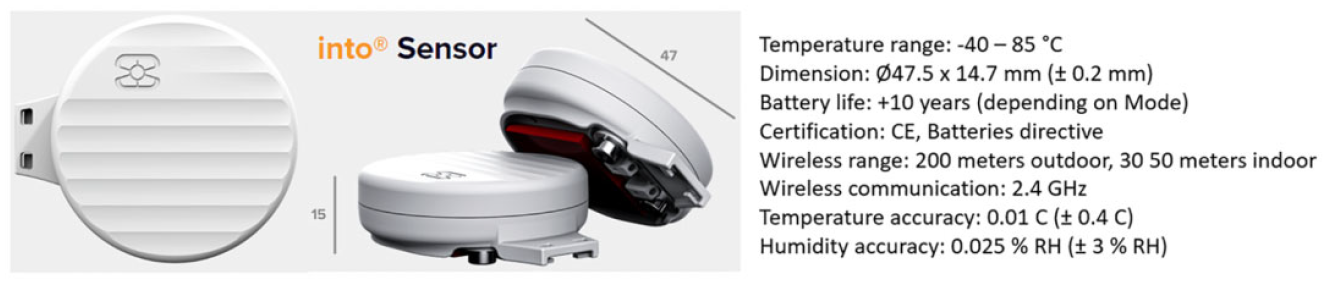
The into® Sensor analysed in this study. Sensors are installed in building components such as a roof and measures the surrounding temperature, RH, and water leaks (Sensor Innovation, 2023).
Normal moisture redistribution in the insulation layer over the season or day may give very high levels of RH in the top or bottom part of the insulation in compact roofs (De Meersmann et al., 2015; Geving and Holme, 2010; Hens et al., 2003; Langerock et al., 2017). The cloud application (iCS) uses an algorithm which enables a combined assessment of weather data automatically collected from public sources and measurements of RH, temperature, and free water to determine potential leakages. The algorithm must be able to distinguish between these normal levels and leakage events and is under continuous development.
The water sensor measures the electrical voltage (V) between two electrodes located in the bottom of the sensor casing. The water sensor transmits a tensor of 3 volt and thus measures a voltage between 0 and 3. High values indicate that water is present between the two electrodes as a result from either a leakage or condensation, thus generating warning or alarm. When no water is present, the voltage is low or zero. Based on experience, warnings are issued for readings >0.36 V and alarms for reading >1.76 V.
Accuracy of sensors and corrections
While the temperature and free water sensors are relatively stable and insensitive to drift, the RH-sensors can be more unstable. The accuracy of the studied RH-sensors is according to the product data sheet ±3% RH (Sensor Innovation, 2023). However, when the RH in the roof gets high, the sensors become unstable and the measured RH values are inaccurate. The error increases with higher RH values. When exceeding 95% RH, the measured data show values between 95% and up to above 100% (readings up to 120%). Condensation or free water occurring on the sensors may also cause the measured data value to shift rapidly from high (>100%) to very low (<20%) or even to stop functioning for periods. This unstable behaviour is problematic when data from several sensors is to be viewed simultaneously. Latest data sets are therefore compensated for this behaviour by correcting the logged data to 100% when readings above 100% occur.
It should be noted that the purpose of the RH-sensors is to identify typical seasonal and daily moisture redistribution patterns and not to measure the RH variations precisely. This means that the type of RH-sensor embedded in the into® Sensor was chosen as a payoff between the cost of sensor and robustness and reliability. The impact of sensor failures on the reliability of the whole system depends on the complexity (size, layout, implementations) of the roof that is investigated together with the amount and position of the sensors.
Testing of RH-sensors
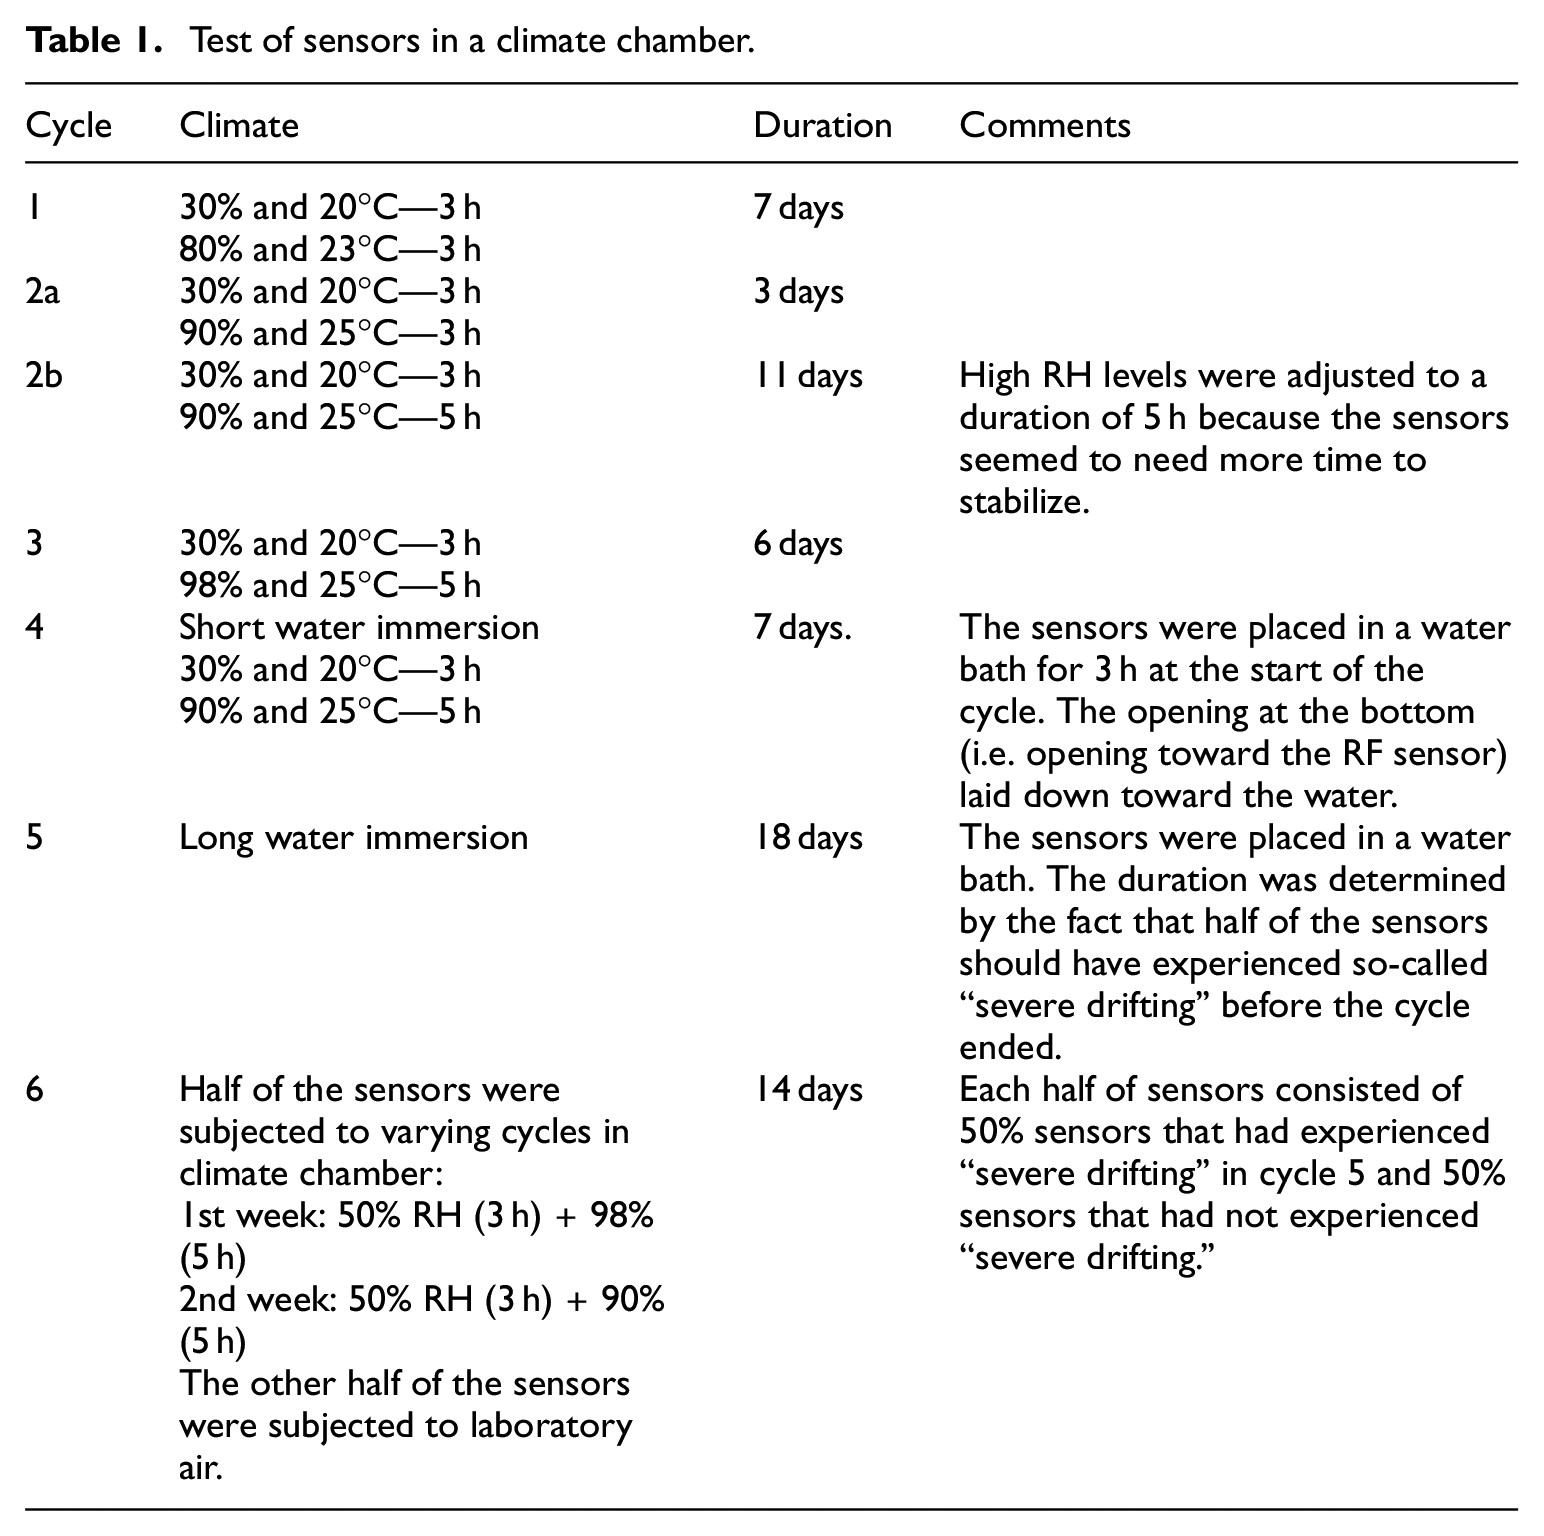
The RH-sensors were tested in a climate chamber (ClimeEvent C/340/0) before the analysis. The sensors were subjected to several shortened diurnal cycles with varying RH, and to water immersion according to Table 1. The RH measured by the sensors were compared to the measured RH of calibrated RH-sensors (TinyTag). The test showed that the sensors displayed a delay compared to the TinyTag-sensors and thus needed more time to stabilize. Sensors exposed to only a short-term water immersion (3 h in cycle 4) did not portray special errors beyond what had been observed, for example, in cycle 3. However, after prolonged submersion (cycle 5) we see a greater effect on the readings in cycle 6. All 18 sensors begin to show reasonable readings when removed from the water, that is, they do not show signs of severe drifting and the reading drops below 120% RH. The sensors placed in a constant dry environment (laboratory air) appear to approach a stable level during cycle 6 (14 days). The results indicates that the sensors need some time to dry after immersion.
Test of sensors in a climate chamber.
Results
Assessment of the measured data
The time series data from the roofs of the two pilot buildings have been analysed and compared to local weather data. For both pilot buildings, two groups of sensors are highlighted. Sensors in Group 1 were positioned near the parapet, at the transition between mineral wool and EPS, and have the same thickness in thermal insulation. Sensors in Group 2 were positioned in the middle of the two roofs. Data from all the sensors in Group 1 and 2 in the two buildings and the related climate data are provided in Appendix A (Figures A1-A9).
For both Roof 1 and Roof 2, high levels of built-in moisture were present during the first 7–8 months owing to rain events during the installation of the insulation. During these months, the RH was very high, making the sensors unstable (rapidly shifting from high to low values) for periods. The readings of the water sensors were also high in the first period owing to the high built-in moisture. Lack of electricity on the construction site also led to a lack of logging for some shorter periods in March, May, July, and August 2021. Note that the data from the measurements of free water are displayed in voltage (V) as explained in Section “Sensors and data system.”
Comparing Group 1 and Group 2
Examples of data from one sensor in Group 1 and Group 2 in Roof 1 are shown in Figure 4. Data from the other sensors in the respective groups portrays similar trends but with some minor variations between the sensors (see Figures A4 and A5). The sensors in both groups were located on the warm side of the thermal insulation. The sensors in Group 1, which were positioned near the parapet, close to the transition between mineral wool and EPS, portray larger fluctuations in temperature and RH compared to the sensors in Group 2, owing to the difference in type and thickness of the thermal insulation. The sensors in Group 2 were positioned at the middle of the roof, where there was only EPS and the total thickness was nearly the double of that of Group 1.
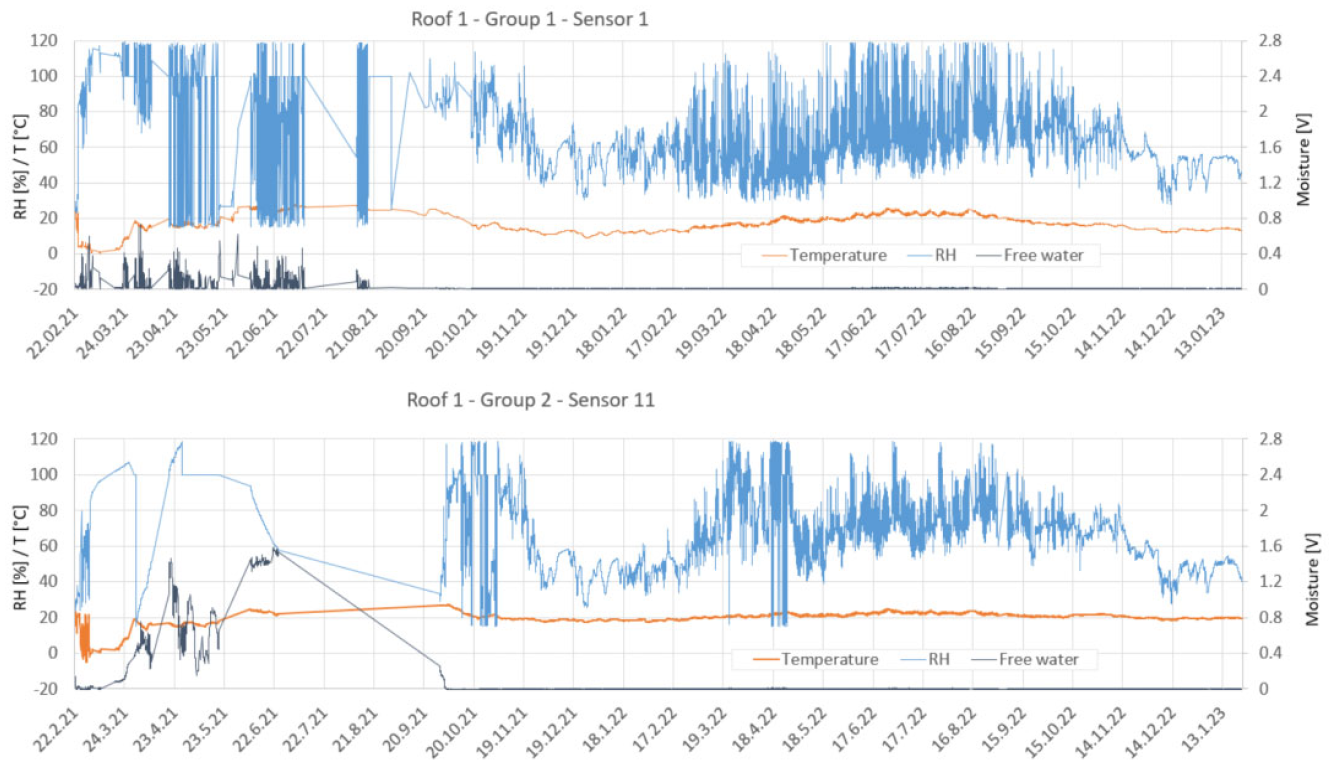
Example of data from two sensors in Roof 1. Sensor 1 representing Group 1 close to the parapet where the thermal insulation is quite thin (upper) and sensor 11 representing Group 2 at the middle of the roof where the thermal insulation is quite thick (lower). Both sensors are positioned on the warm side of the thermal insulation, as illustrated in Figure 2.
Differences can also be seen when comparing sensors from Group 1 and 2 in Roof 2, as shown in Figure 5. Note that, drains are positioned in the middle of Roof 2, whose slope is opposite than that of Roof 1. Furthermore, in Roof 2, sensors in Group 1 were positioned near the parapet, at the transition between mineral wool and EPS. Sensors in Group 2 were positioned at the middle of the roof, where the thermal insulation layer is mainly thinner than at the parapet but varies slightly owing to the drains slop between them.
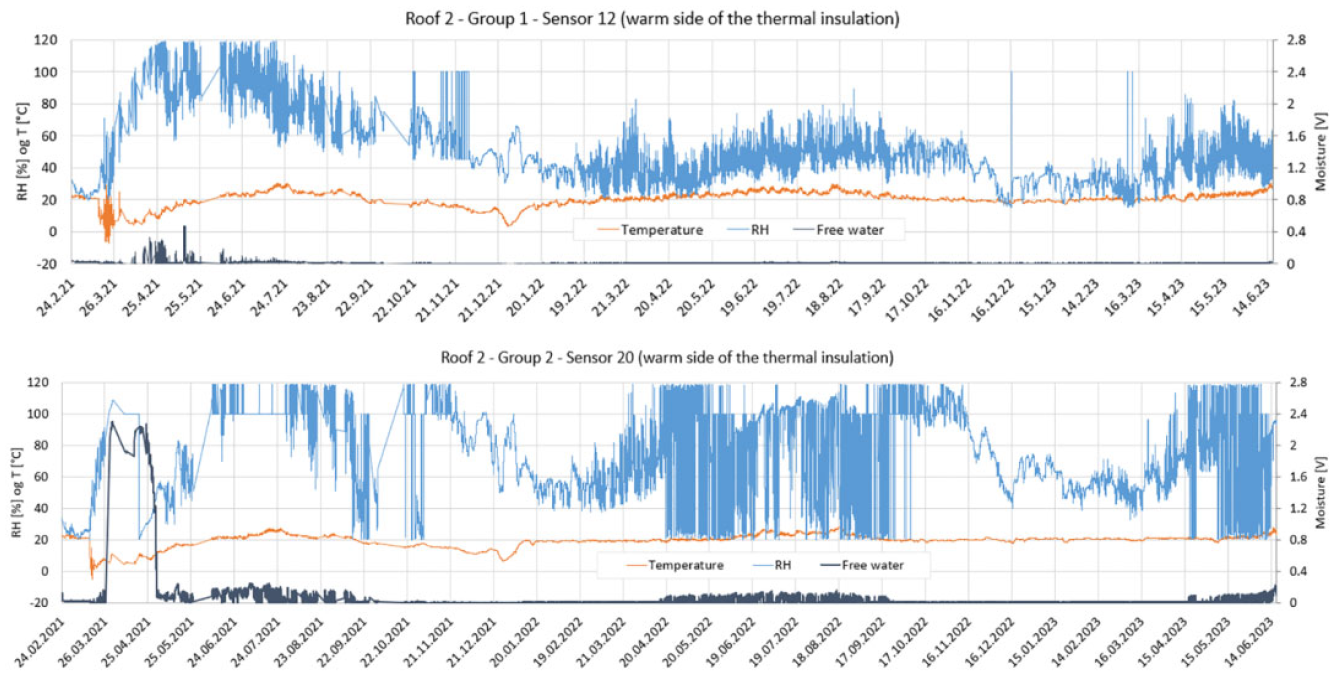
Example of data from two sensor in Roof 2. Sensor 12 represents Group 1, close to the parapet (at the transition between mineral wool and EPS). Sensor 20 represents Group 2 at the middle of the roof. Both sensors are positioned on the warm side of the thermal insulation, as illustrated in Figure 2.
For both Group 1 and 2 the RH were high during the first 7–8 months. In this period there were also large readings on the water sensors. The readings were moderate for sensors in Group 1, but significant for sensors in Group 2. Looking at the following two summer periods, the RH values were quite low for Group 1 that is, mainly below 80%. The sensors in Group 2, on the other hand, portray high RH values, with resulting unstable and unfunctional readings. The high RH also results in minor readings on the water sensors during these periods, but anyways below the limits for leakage warning (>0.36 V).
Positions of the sensors
In Roof 2, sensors were located both on the warm side of the thermal insulation and on the cold side (beneath the roofing membrane) as shown in Figure 2. Figure 6 shows examples of two sensors from Group 1 (above and below the thermal insulation). Data from the other sensors in the respective positions portray similar trends but with some minor variations between the sensors, as shown in Figures A10 and A11. Beneath the roofing membrane, the measured temperature fluctuates significantly during the summer, more as expected. The measured RH values, as opposed to the sensors positioned on the warm side of the thermal insulation, are high during the winter and low during the summer.
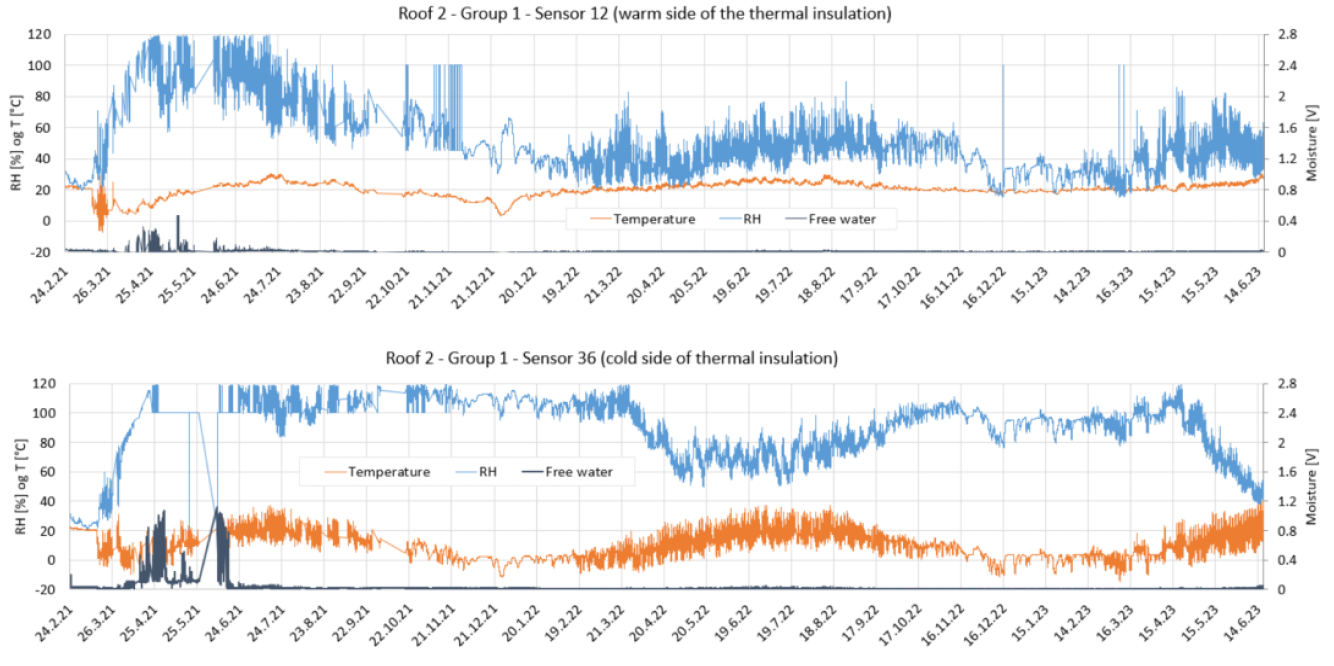
Data from two sensors in Roof 2 positioned both on the warm and on the cold side of the thermal insulation. (Sensor positions are illustrated in Figure 2).
Leakage detection—Roof 1
Figure 7 shows the measured RH and free water compared to weather data for Group 1 in Roof 1 during the whole measurement period of 1.5 years. The measured RH values are very unstable during the first 7 months, jumping from RH readings above 100% to below 20% and up again in short time intervals. Unstable readings of RH are usually caused by the RH being somewhere above 95%. The sensors in Roof 1 were installed during rainy weather, thus the RH-sensors could have experienced free water, which also makes them unstable. The unstable behaviour is, according to the system producer, expected for the RH during the 1st months after installation owing to high levels of built-in moisture. Consequently, the system producer does not send automatic warnings or alarms to the operator in the 1st months owing to high RH readings. Instead, they perform manual analysis of the water sensor readings to detect leakages. After some months (in this case 7 months), the RH readings become more reasonable, and automatic warnings/alarms can be applied.
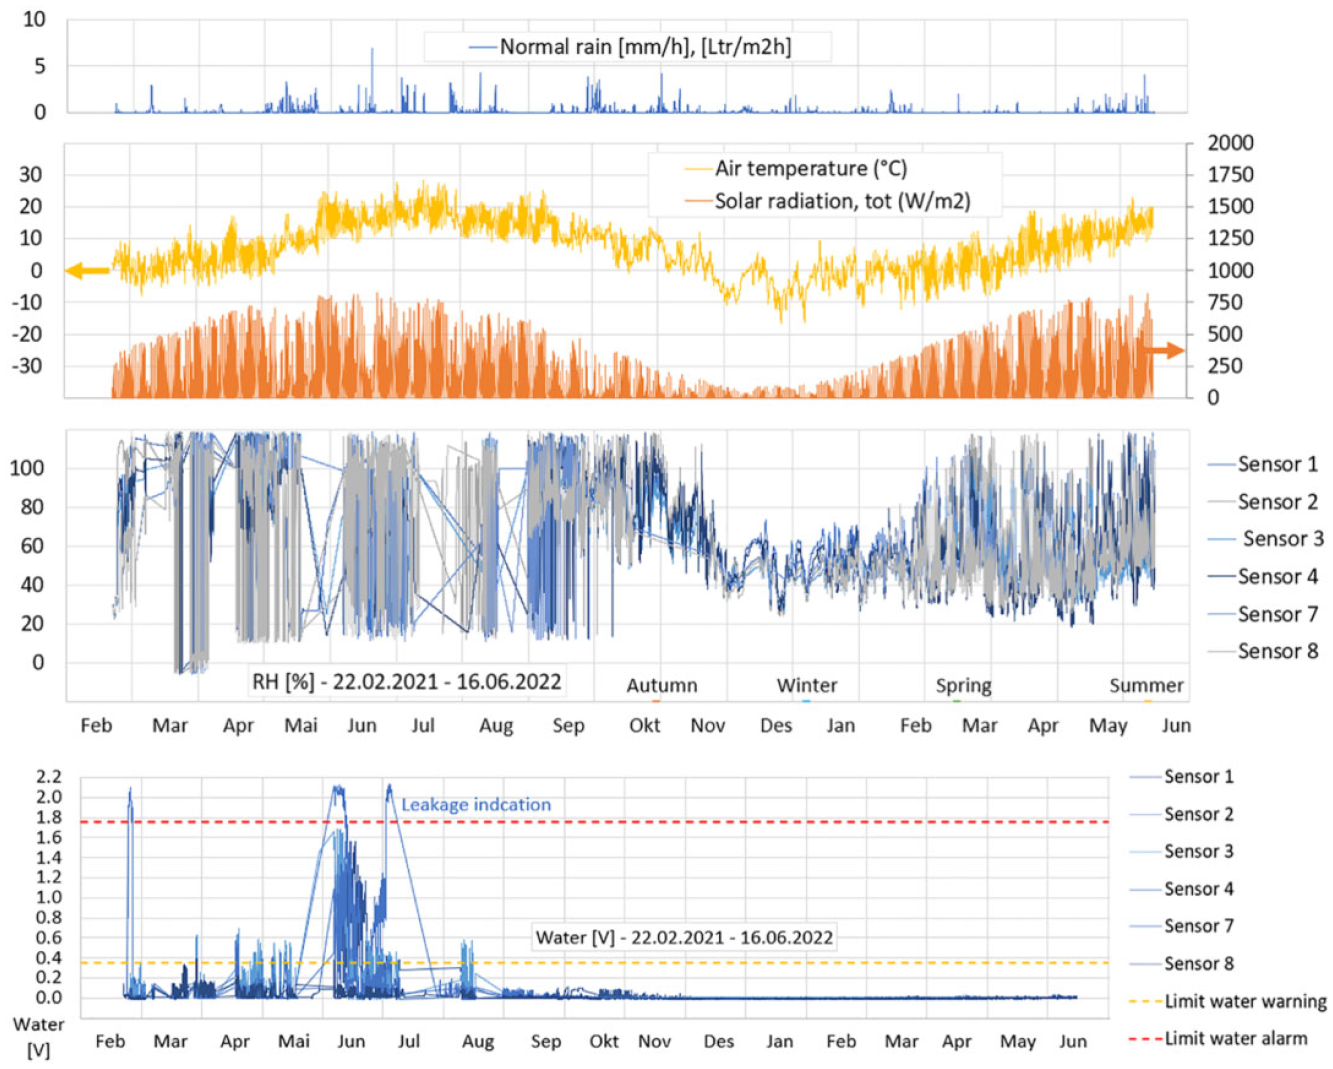
Normal rain, outdoor air temperature and solar radiation (upper three graphs), and RH and water sensor readings at the interface between vapour barrier and insulation (lower two graphs).
The water sensor readings shown in Figure 7 also fluctuated quite a lot during the first 7 months. High water sensor readings are expected initially, owing to built-in moisture. Since there is little meaning in giving warnings or alarms for free water due to built-in moisture, the water sensor readings are typically analysed manually in this first period. High readings such as those for sensor 2 in June and July, could however indicate a rain leakage. It could also possibly be explained by built-in moisture in the insulation layer being redistributed downwards to the vapour barrier during the summer. Based on experience, a warning level at 0.36 V (yellow line) and an alarm level at 1.76 V (red line) has been used. Values above the warning level indicate that there is some condensation or free water present, but not necessarily a water leakage. Values above alarm level indicate free water and minimum a water film present, that is, a strong indication for a leakage. In this case, the high readings of the water sensor in June resulted in an inspection of the roof. The inspection revealed that the high readings were caused by a leak through a hole in the roofing membrane, which was immediately repaired.
Seasonal variations—Roof 1
To illustrate the impact of solar radiation on the RH variations, examples of three-day periods from four seasons with varying solar radiation are shown in Figure 8. During the autumn, the RH-readings were still relatively high owing to the built-in moisture, and the automatic warnings were deactivated. During the winter, however, the RH was rather low, indicating that the main portion of the built-in moisture has dried. Automatic warnings and alarms for the RH were activated, with the warning set at 90% RH and the alarm set at 95% RH were used respectively.
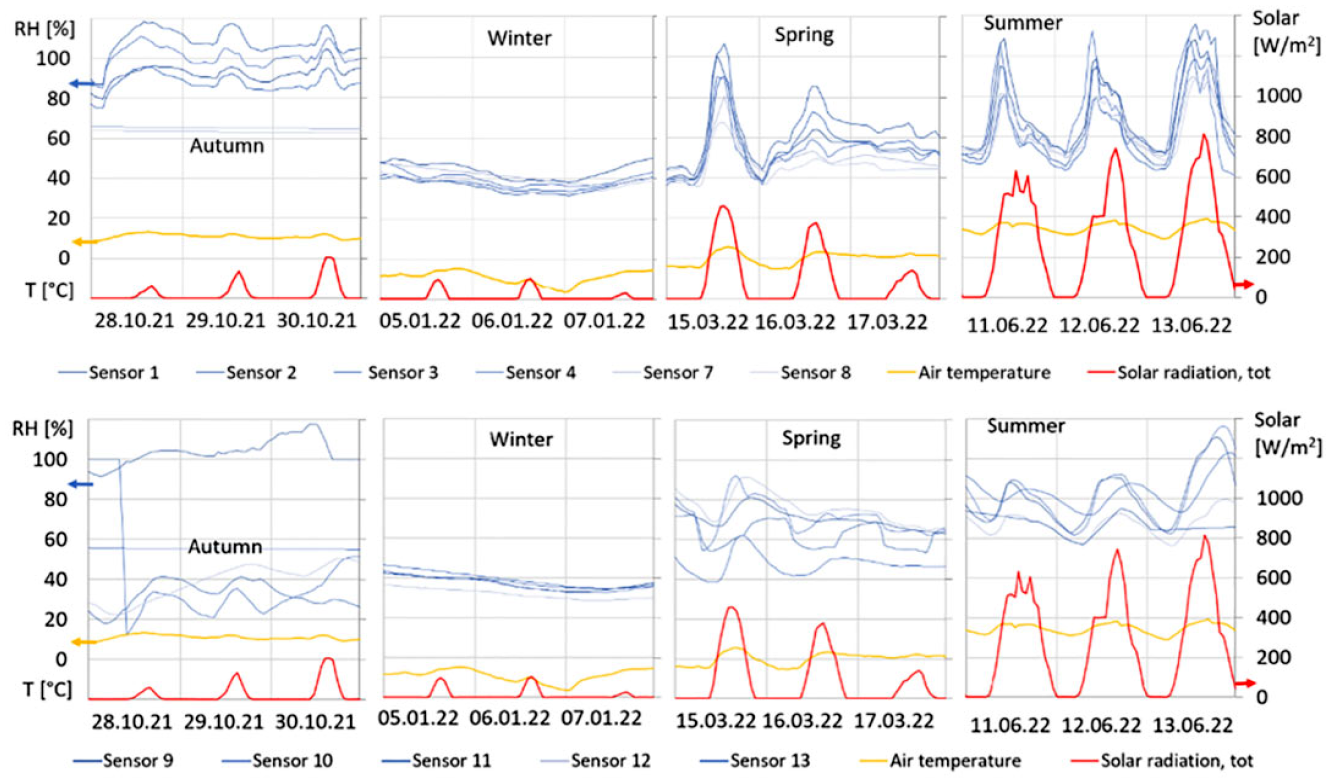
Variation in RH at the warm side of the thermal insulation for 3 days during autumn, winter, spring, and summer, shown together with global radiation and outdoor air temperature. The upper graphs show sensors 1–8 which are positioned near the interface between mineral wool and EPS, and the thermal insulation thickness is ~280 mm. The lower graphs show sensors 9–13 where the thickness is ~500 mm and EPS is used. The four periods are shown in the RH-diagram in Figure 7.
In spring and summer, the daily RH-cycles during sunny days result in RH-level above 95% at midday for Group 1 (sensors 1–8). To account for this, the algorithm specifies that no warnings or alarms are given based on the RH-readings under the following conditions: between 6 AM and 10 PM from April to August, if, at the same time, the meteorological data show that there has been less than 1 mm rain in the last 6 h and the outdoor temperature is above 10C°. As a part of this project, this algorithm is under continuous development, and it is intended to apply machine learning to enhance and fine-tune its performance.
The second group of sensors (Group 2) do, however, not experience the same high RH levels as Group 1, during sunny days in spring and summer. This is most likely because the sensor in Group 1 were located close to the 0.6 m band of pure mineral wool along the parapets, meaning that the daily redistribution of moisture between the top and bottom of the insulation is faster than for the part of the roof with more vapour tight EPS. In addition, the insulation thickness for Group 2 is almost double of that at sensor in Group 1. The comparison in Figure 8 illustrates that roofs with different build-up may need different adaptions of the warning and alarm algorithms.
Leakage warning—Roof 1
Figure 7 shows the measurements of free water for the sensors close to the parapet in Roof 1 (Group 1). Figure 7 clearly illustrates how the high built-in moisture results in high RH during the first 7 months. During this period, many small readings (<0.37 V) and some medium readings (0.37–1.75 V) were measured on the free water sensors, except for one sensor (sensor 2) which showed high readings repeatedly (>1.75 V). Among the sensors in the group on the middle of Roof 1 (Group 2), there were also two sensors resulting in high readings (9 and 12), see Figure 9. Owing to the high readings, the roof was inspected in June and leakages were detected close to sensor 2, 9, and 12. The damage was repaired and “ventilation caps” were mounted on the membrane in the beginning of July to speed up drying. As shown in Figures 7 and 9, the roof surrounding sensor 2, 9, and 12 dried effectively and remained dry throughout the remaining measured period. Figures 9 and 10 illustrate how the measured data resulted in warnings and alarms for sensor 9, 12 (where leakages occurred), and 13 (where no leakages occurred). Note that the alarms and warnings the first 7 months were not sent directly to the operator but analysed manually by the control system producer.
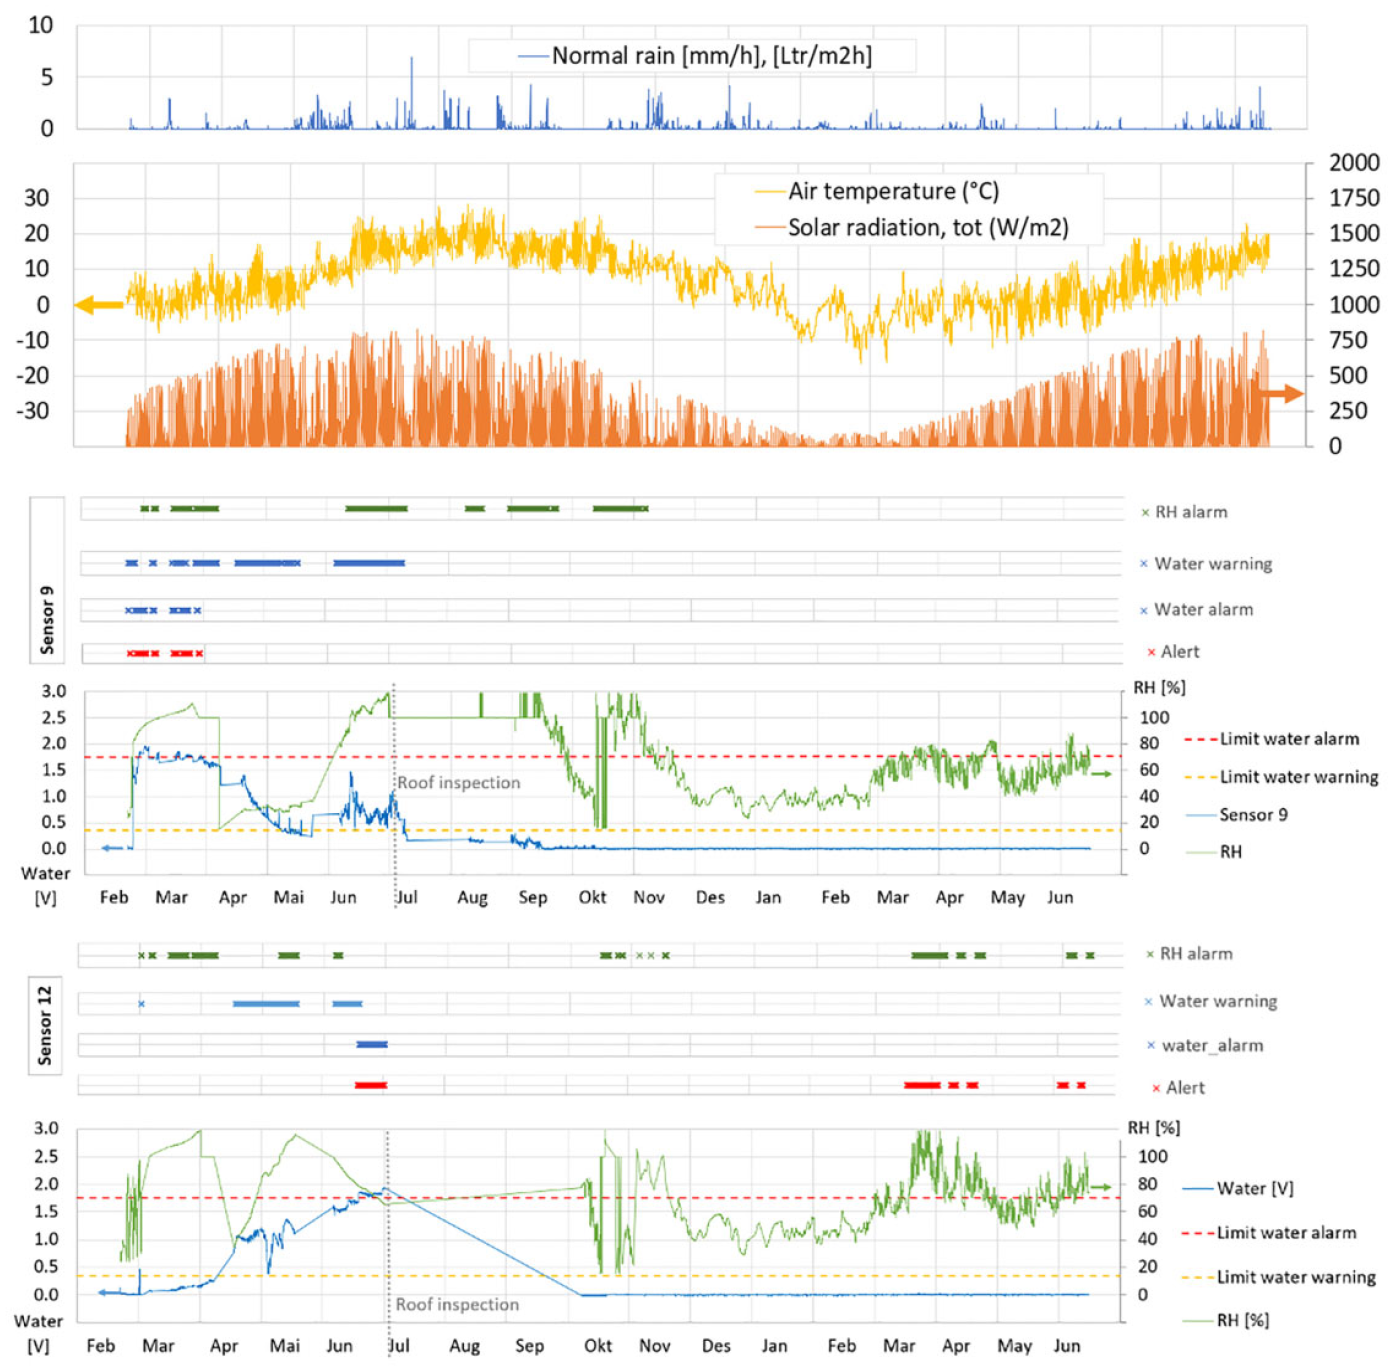
Illustration of how the free water and RH sensors resulted in warnings and alarms which lead to the detection of the leakages for the sensors 9 and 12.
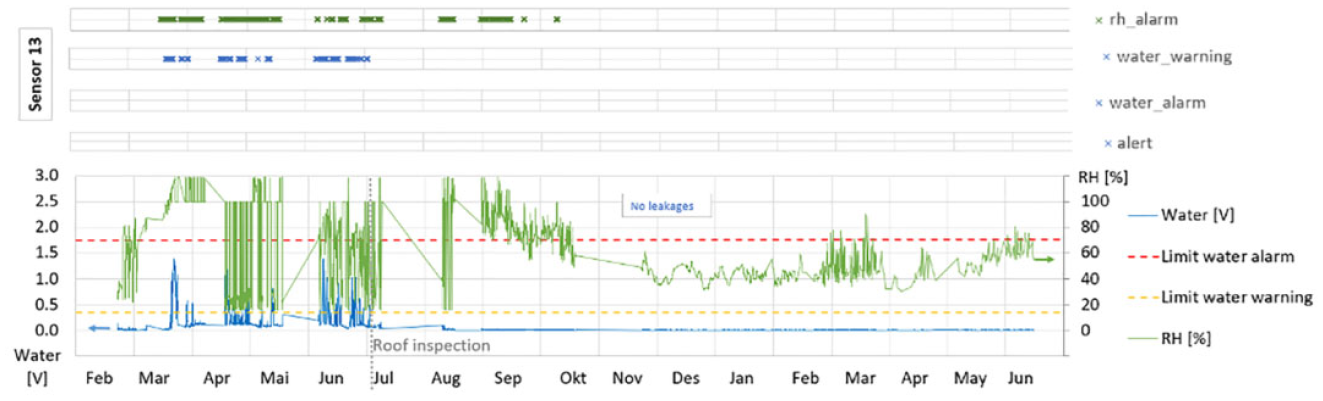
Illustration of measured data, warnings, and alarms for one sensor were there were no leakages. The high values of built-in moisture result in RH alarms during the first 7 to 8 months.
Variations in measured RH
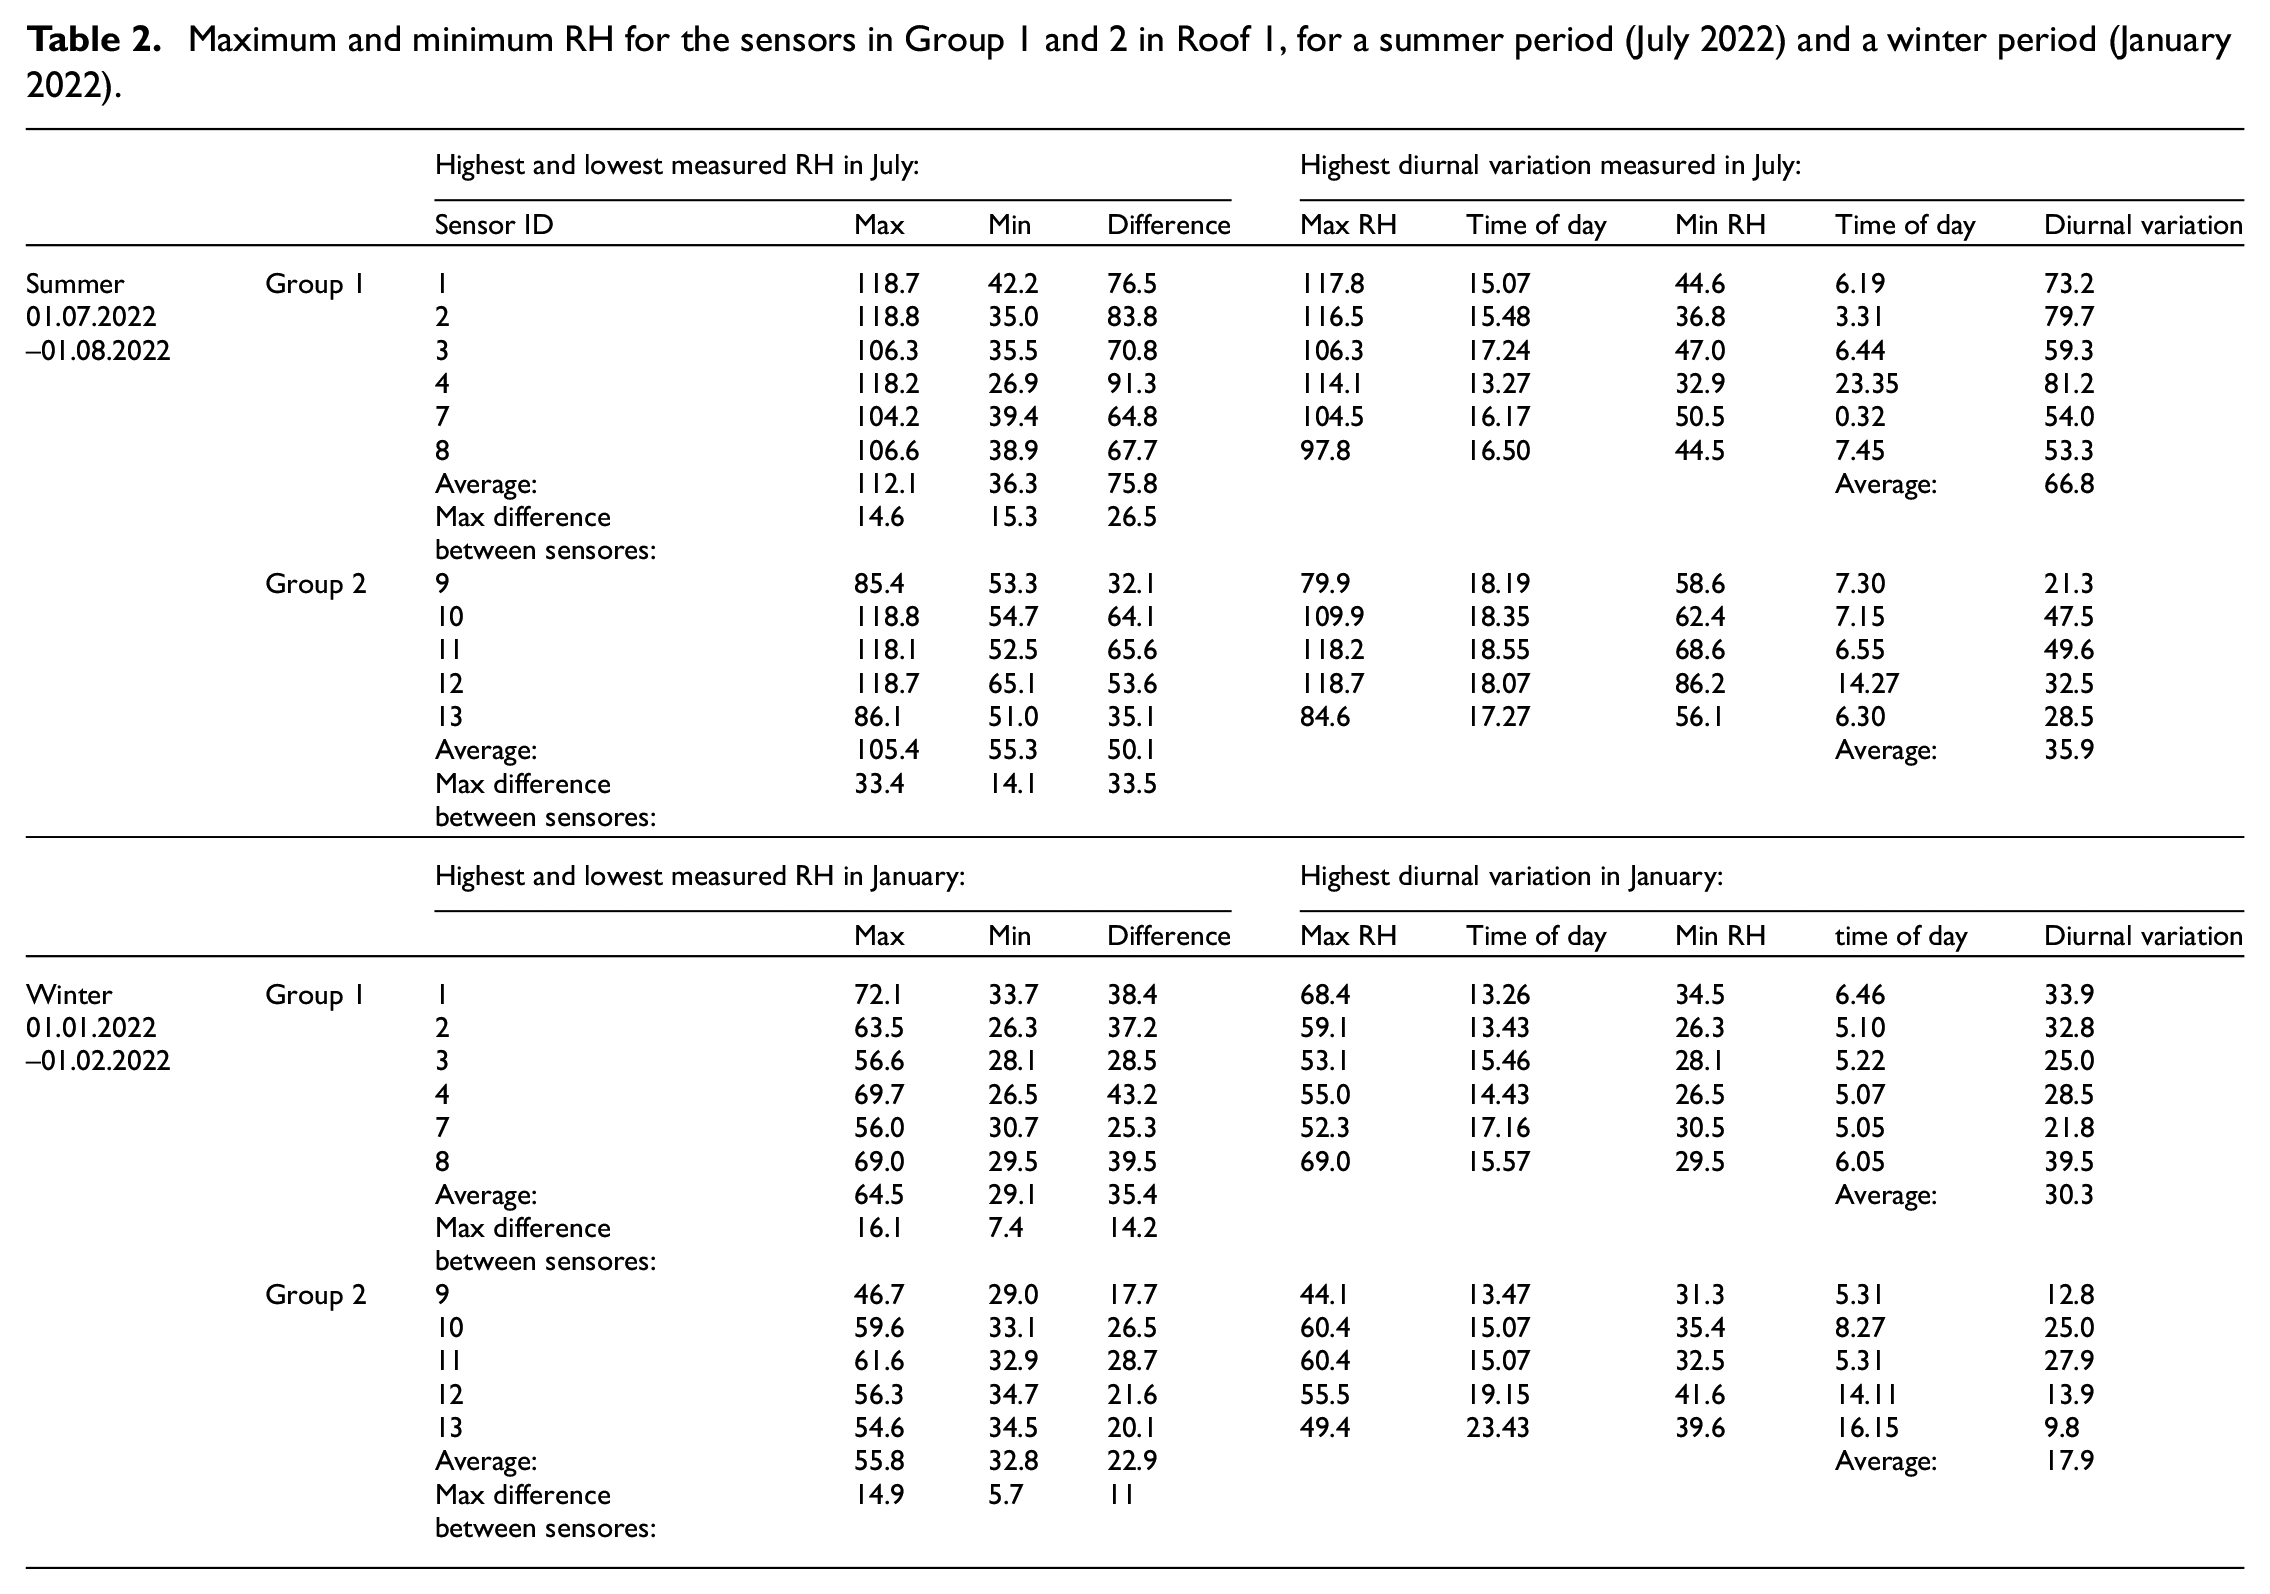
The differences in measured RH between sensors with equal position within the roofs have been assessed. Table 2 show the maximum and minimum RH for sensors in Group 1 and 2 in Roof 1, for a summer period (July 2022) and a winter period (January 2022). The highest diurnal variation portrayed within the period is also shown. Figure 11 illustrate the difference in measured RH between the sensors. Note that the insulation layer is thicker for sensors in Group 2, so that the influence from the outside climate is somewhat dampened compared to sensors in Group 1.
Maximum and minimum RH for the sensors in Group 1 and 2 in Roof 1, for a summer period (July 2022) and a winter period (January 2022).
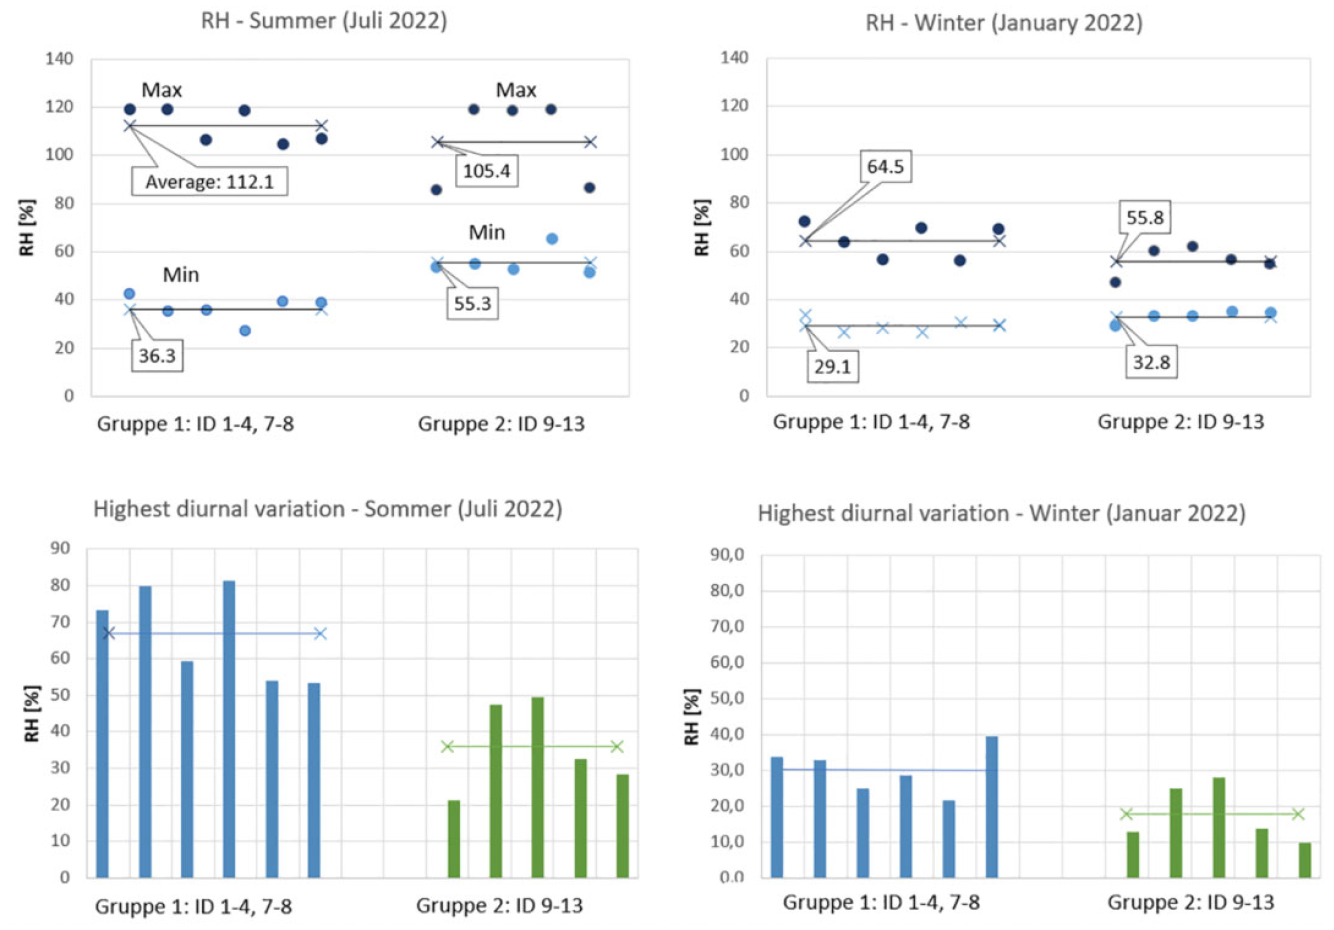
Variation in measured RH between sensors with equal position within the roof.
Discussion
Few studies have investigated smart control systems for leakage warning in compact roofs. Through our analyses, relations between measured data, occurring climate conditions and seasonal variations have been identified. The measured seasonal and daily temperature and humidity variations in the two compact roofs are in line with what could be expected based on previous measurements performed in compact roofs.
High readings on the free water sensors are the primary indicator of leakages for the analysed control system. The temperature and RH data are mainly used as additional information along with the weather data to determine whether high readings of the free water sensors are caused by actual leakages or by normal seasonal and daily variations. As illustrated in Figures 4–6, the type and thickness of the thermal insulation will influence the measured RH significantly, and this should be taken into account by the system algorithms. To address it, the algorithms might be set up to evaluate sensors with the same position, insulation type and thickness against each other and issue warnings if some sensors stand out. One challenge in this regard is that the RH is strongly influenced by the solar radiation. As illustrated in Figure 8, the algorithm should be trained to overlook daily elevated fluctuations in RH within certain reads owing to solar radiation. The RH-sensor also becomes unstable and unpredictable for periods when exposed RH above 95%. In both Roof 1 and Roof 2, the moisture contents in the roofs were high the 1st months owing to built-in moisture. Figures 4–6 illustrate how the built-in moisture makes it difficult to detect actual leakages through the roofing membrane. Leakages caused by construction errors could therefore mistakenly be interpreted as resulting from built-in moisture during this initial phase and potentially go undetected for a long time. Using a RH-sensor, which is less unstable at higher RH-levels, might contribute to make it easier to determine whether the free water sensor measures built-in moisture or an actual leakage.
Sensors positioned on the cold side of the thermal insulation may be used to detect condensation by air-leakages from the inside of the building. The benefit is however still uncertain, as the RH seem to remain high (>80%) at this position during the entire winter (October–May) even without air-leakages. More analysed data and experience from roofs with and without air-leakages is needed to better distinguish between expected and abnormal readings.
Repeatedly high readings on the free water sensors (>1.75 V) is a strong indicator that a leakage through the membrane has occurred. Since many of the sensors in Roof 1 portrayed high readings in June, an inspection was initiated, and leakages were discovered for sensors 2, 9, and 12. The leakages were repaired in the start of July, and ventilation caps were installed to dry out the excess moisture. During the rest of the measuring period the water sensor readings remained very low (∼0 V). The analysis from the Roof 2 shows that, although the RH readings often becomes very high and unstable during the summer periods (when placed on the warm side of the insulation), the free water sensors still portray small readings (<0.2 V). This gives a strong indication that the sensors system is well suited to distinguish between leakages and high RH under normal conditions.
To gain more knowledge of the expected range of daily variations, data from a greater number of buildings should be analysed, including buildings with more complex geometry, shading, green roofs, or solar panels.
Conclusion and future outlooks
Systems for leakage warnings can be particularly beneficial in building components, such as compact flat roofs, owing to their vulnerability to rain leakages through the roofing membrane The analysis illustrates how a smart control system may predict actual leakage in compact roofs by using a combination of free water, temperature, and RH-sensors. The primary indicator of leakages are the free water sensors, which appears to be well suited to distinguish between leakages and naturally varying RH-levels. Some influencing factors should however be taken into account by the system’s algorithms. The main influencing factors are differences in type and thickness of the thermal insulation, high built-in moisture and variations caused by solar radiation. One option is to set up the algorithm to compare data from sensors with similar preconditions and issue warnings some receive readings which stands out.
Future work will focus on gaining experience with the sensors in terms of drifting, instability and accuracy when exposed to the sometimes-high moisture levels in compact roofs. This is particularly important because the sensors may be directly exposed to rainwater and high levels of built-in moisture already during the installation period and the 1st months afterward. The optimal amount and position of the sensors will be investigated thorough the project by comparing measured data from sensors where leakages have occurred and data of surrounding sensors.
Footnotes
Appendix A
Declaration of conflicting interests
The author(s) declared no potential conflicts of interest with respect to the research, authorship, and/or publication of this article.
Funding
The author(s) disclosed receipt of the following financial support for the research, authorship, and/or publication of this article: The authors gratefully acknowledge the financial support by the RFF Trøndelag for funding an R&D project about warning of leakages in buildings.