
Abstract
Outdoor air temperature represents a fundamental physical variable that needs to be considered when characterising the energy behaviour of buildings and its subsystems. Research, for both simulation and monitoring, usually assumes that the outdoor air temperature is homogeneous around the building envelope, and when measured, it is common to have a unique measurement representing this hypothetical homogeneous outdoor air temperature. Furthermore, the uncertainty associated with this measurement (when given by the research study) is normally limited to the accuracy of the sensor given by the manufacturer. This research aims to define and quantify the overall uncertainty of this hypothetical homogeneous outdoor air temperature measurement. It is well known that there is considerable variability in outdoor air temperature around the building and measurements are dependent on the physical location of outdoor air temperature sensors. In this research work, this existing spatial variability has been defined as a random error of the hypothetical homogeneous outdoor air temperature measurement, which in turn has been defined as the average temperature of several sensors located randomly around the building envelope. Then, some of these random error sources which induce spatial variability would be the cardinal orientation of the sensor, the incidence of solar radiation, the outdoor air temperature stratification, the speed and variations of the wind and the shadows of neighbouring elements, among others. In addition, the uncertainty associated with the systematic errors of this hypothetical homogeneous outdoor air temperature measurement has been defined as the Temperature Sensor Uncertainty
Introduction
Outdoor air temperature is an intensive physical variable used for many purposes, including the energy performance of building analysis, the optimisation of Building Automation Systems (BAS) and buildings’ Heating, Ventilating and Air Conditioning (HVAC) systems control. From the point of view of the building energy balance, outdoor air temperature affects the heat transfer rate occurring through the building envelope via transmission losses and infiltration/ventilation losses (Bauwens and Roels, 2014; Chapman, 1984). The building envelope Heat Transfer Coefficient (HTC) is the parameter that best represents the overall energy performance of a building envelope. The HTC is the total heat transfer from a building resulting from transmission heat transfer through the envelope and from infiltration and/or ventilation per °C of indoor to outdoor temperature difference in W/°C. Since the HTC considers ventilation/infiltration effects, much of the variability in this estimate is due to time variability in weather conditions (Juricic et al., 2021); mainly outdoor air temperature and wind velocity. Thus, there is a need to achieve a representative measure of the temperature of the air surrounding the building envelope. This representative outdoor air temperature measure should consider the spatial variability of this measure around the building envelope and it should focus on how solar irradiation influences this spatial variability.
State of the art
As detailed in Giraldo-Soto et al. (2018), the outdoor air temperature measurements are commonly collected from the closest weather station to the analysed building, or by dedicated sensors (usually only one sensor per building) installed around the building envelope (on the façade, the roof or close to the studied building). Then, these unique outdoor air temperature measurements are used to represent the outdoor air temperature as homogeneous around the building envelope for each instant of time (Giraldo-Soto et al., 2018). Thus, it is considered or assumed that the air temperature surrounding a building only varies with time. Furthermore, the overall uncertainty associated with these outdoor air temperature measurements is considered to be the manufacturer’s accuracy of the sensors.
For example, in Yang et al. (2020), an experimental test was conducted on the campus of Nanyang Technological University in Singapore to study a model predictive control approach for an air conditioning system with a dedicated outdoor air system. To be able to model the air conditioning system demands, a dynamic model of the tested building area was constructed; where one of the main inputs for the model was the locally measured outdoor air temperature. To carry out the test, the outdoor air temperature of the building was measured, with the uncertainty due to systematic errors equal to 1/3DIN, this value being the manufacturer’s accuracy, without taking into account other uncertainty sources. In the case of Housez et al. (2014), large discrepancies were found between the real and the design heating demands of seven energetically retrofitted buildings located in Austria. The analysis compared the buildings’ real heating demands (estimated based on energy bills) against the heating demands obtained by different energy certificate methodologies and by simulating the heating demand of the analysed buildings. In the simulation, among others, the outdoor air temperature was one of the main input variables. In this study, the outdoor air temperature data was collected from weather stations close to the analysed buildings, without specifying their exact location regarding the analysed buildings or the manufacturer’s accuracy of the sensor. Similarly, in Chung et al. (2023), the variation in the building envelope moisture behaviour was studied using simulation work with multi-year historical weather data. This study demonstrated that envelope hygrothermal simulations using single-year moisture reference years, and single-trial climate, might underestimate moisture content and moisture-related damage as compared to simulations using stochastic simulations. In this study case, there are neither technical specifications of the weather station nor the manufacturer’s accuracy or sensor location concerning the demo test.
Another example is Vivek and Balaji (2023), which studied the cooling behaviour of a Thermally Activated Building System (TABS). For this purpose, they experimentally evaluated the effect on the indoor air temperature, surface temperature and heat transfer rate in a room with TABS and compared the results with an uncooled identical room. The outdoor air temperature variations were identified to define the cooling scenarios. In this research work, the manufacturer’s accuracies and the Type B uncertainties of surface temperature sensors, heat index meters, heat flux sensors and digital anemometers are shown, together with the estimation of the uncertainties of the radiant temperature and the operating temperature. However, the study does not include the manufacturer’s accuracy or the uncertainty of the weather parameters (outdoor air temperature, relative humidity and solar radiation) collected from a weather station located in front of the experimental facility. Likewise, in Jack et al. (2018), seven teams independently conducted co-heating tests on the same detached house near Watford, UK, to estimate its Heat Transfer Coefficient (HTC). This study empirically demonstrates the reliability of the co-heating test. The uncertainty of the estimated building envelope heat transfer coefficients was obtained with different methods. In these tests, for the outdoor air temperature measurement, only the uncertainty associated with a systematic error equal to ±0.2°C (the manufacturer’s sensor accuracy) is given. However, an uncertainty equal to ±1°C was assumed in the indoor-to-outdoor air temperature difference measurement, without specifying the way this uncertainty was obtained.
Another case is Ghosh et al. (2015), where the overall heat transfer coefficient (U-value) of two glazing systems under the same conditions was estimated. For this, two identical test cells were designed, manufactured and installed at the Dublin Energy Laboratory. For the test, the indoor and outdoor conditions were monitored, where a T-type thermocouple was installed to measure the outdoor air temperature, without specifying its location. Once again, only the manufacturer’s accuracy of the outdoor air temperature sensor is considered, it being equal to ±1°C. In another case, Sougkakis et al. (2021), the HTC was estimated by testing the Quick U-Building method for assessing the HTC in two UK buildings. The outdoor air temperature as a variable was included for estimating the HTC, measured via a weather station installed on the roof of a neighbouring house, approximately 30 m from the test house. The manufacturer’s accuracy of outdoor air temperature is not shown, but only the uncertainty of the heat transfer coefficients are specified through the standard deviations of their mean values. Similarly, Lai et al. (2020) presents a three-dimensional integrated numerical model to evaluate the building’s surface and mean radiant temperature. For this study, only one outdoor air temperature sensor with a manufacturer’s accuracy of ±0.20°C was installed on the roof of a building; this sensor was not shielded against radiation and was located in a shaded area to avoid the incidence of direct solar radiation. In Li et al. (2023), to size an air source heat pump, two models (under non-frosting and frosting conditions), considering the joint effect of outdoor air temperature and relative humidity, were developed to predict the output heating capacity of the analysed heat pump units. Experimental tests were conducted in a small office building in Beijing to validate the accuracy of the said models. The measurement system was built up to monitor and record the operating parameters of the tested air source heat pump units, where the outdoor air temperature sensor used was the model QFM9160. Once again, only the uncertainty due to systematic error was taken into account, this being equal to ±0.15°C.
In a case study of Chinese residential buildings (Yan et al., 2016), the influence of the outdoor air temperature on the indoor environment and thermal adaptation was studied. Through the thermal comfort questionnaire, the dwelling occupants defined the subjective thermal sensation with the ASHRAE seven-point scale, and then a statistical analysis was undertaken to analyse the influence of outdoor air temperature on thermal comfort. The study does not specify the layout of the single outdoor air temperature sensor and only mentions the manufacturer’s accuracy of the outdoor air temperature sensor being equal to ±0.5°C. In Calama-González et al. (2021), the influence of ventilation on indoor comfort was evaluated. In this study, several ventilation protocols (natural and mechanical) were analysed to determine how they can affect the indoor environmental variables. These indoor environments were monitored in two independent test cells with a window located in the South face, where the ventilation occurs. To define ventilation protocols, the correlation between the indoor and outdoor air temperature gradients was one of the assessed parameters. Therefore, the outdoor air temperature measurement, with a manufacturer’s precision equal to ±0.15°C, was measured from a single weather station located on the roof of one of the two independent cells. Only the manufacturer’s accuracy is mentioned in this study.
In research (Bakkush et al., 2015), where the effect of the outdoor air temperature on the thermal performance of a residential building was studied, sensors were located outside the building to compare the geographical outdoor air temperature surrounding the façades and roof with the outdoor average temperature based on the collected data. This study does not specify the sensor model or the manufacturer’s accuracy, and even where there are several outdoor air temperature measurements, there is no definition or quantification of an overall outdoor air temperature measurement uncertainty. Similarly, sensor accuracy and uncertainty are overlooked in research (Sansaniwal et al., 2021) which focused on the adaptive actions of occupants to control the indoor environment in naturally ventilated buildings. This study used the correlation between indoor and outdoor air temperatures to analyse the window opening behaviour related to environmental conditions. The study was conducted in naturally ventilated office buildings and hostels located within a radius of 10 km in the city of Jaipur, without specifying the number or location of the buildings studied, or the sensor used to measure the outdoor air temperature. There is also no mention of the manufacturer’s sensor accuracy. The same applies in Borkowski and Piłat (2022), where the design of a refrigeration system and its control was studied, with a comprehensive analysis of compressor and free cooling modes to demonstrate the adaptation of the existing demand to outdoor temperatures in the climate of the Małopolska Province, which has significant temperature fluctuations. In this experimental test, an outdoor temperature sensor was located on the roof of the building in a shaded place, but neither the type of sensor or its manufacturer’s accuracy is specified.
Furthermore, in other non-building case studies, little consideration is given to external temperature measurements; such as the research (He et al., 2020) undertaken on the outdoor air temperature entering a tunnel with a 78.5 m2 cross-sectional area represented by just one air temperature sensor located 100 m away from the tunnel entrance and with a manufacturer’s accuracy of ±0.50°C. Similarly, other studies (Huang et al., 2020) addressing the impact of different ground surfaces on thermal environments in outdoor activity spaces did not fully consider the variability and uncertainty of the external environment temperature. Five different measurement areas with different ground surfaces were measured and studied simultaneously. The outdoor air temperature was measured with a single weather station for each ground surface at the height of 1.1 m, with a manufacturer’s accuracy equal to ±0.30°C. Similar oversights are observed in research (Zhang et al., 2020) that studied the correlation between air temperature and urban morphology parameters in a cold climate city in China. The outdoor microclimate was evaluated through 27 measurement points located in open areas, using air temperature sensors with a manufacturer’s precision equal to ±0.20°C. In this study, only the horizontal stratification of the outdoor air temperature was considered, without the incidence of vertical stratification, as the experimental set-up placed the sensors in a grid with a distance of 100–200 m and at the height of less than 1.5 m. Furthermore, the work does not relate the measurements’ spatial variability with an uncertainty estimation of the hypothetical homogeneous outdoor air temperature representative for the whole analysed area.
In the same way, the International Organization for Standardization (ISO) and the American Society of Heating, Refrigerating & Air-Conditioning Engineers (ASHRAE) state, in their standards and manuals, the importance of considering measurement uncertainties and errors, where both outdoor and indoor air temperatures are essential physical variables used to develop procedures, methodologies and calculations for buildings and their subsystems. For example, the ASHRAE Handbook Fundamentals (ASHRAE, ) speaks about the importance of uncertainty estimation and highlights that ‘knowing the type of uncertainty associated with a parameter is important in understanding how to propagate that uncertainty through the model’. Its Chapter 28: ‘Heat, air, and moisture control in buildings’, specifies that ‘the annual calibration certificate is essential’, where the measurement uncertainty should be included, but does not specify how to estimate it or what the incidence of systematic and random errors is on this. However, these errors are defined in Chapter 38: ‘Measurement and instruments’. In turn, Chapter 38 also shows the uncertainty of temperature measurements in Table 1, ‘Common Temperature Measurement Techniques’, which only specifies the uncertainties associated with systematic errors (the manufacturer’s sensor accuracy). In the same way as the ASHRAE Handbooks, the normative of ISO 9869-1 (ISO Standard 9869-1, 2014) specifies that the accuracy of the estimated transmittance values depends on the environment temperature measurements (indoor and outdoor air temperature), but does not explain a methodology to estimate outdoor air temperature measurement uncertainty due to systematic and random errors.
Technical characteristics of the sensors, gateway and protocol communications of the MMS.
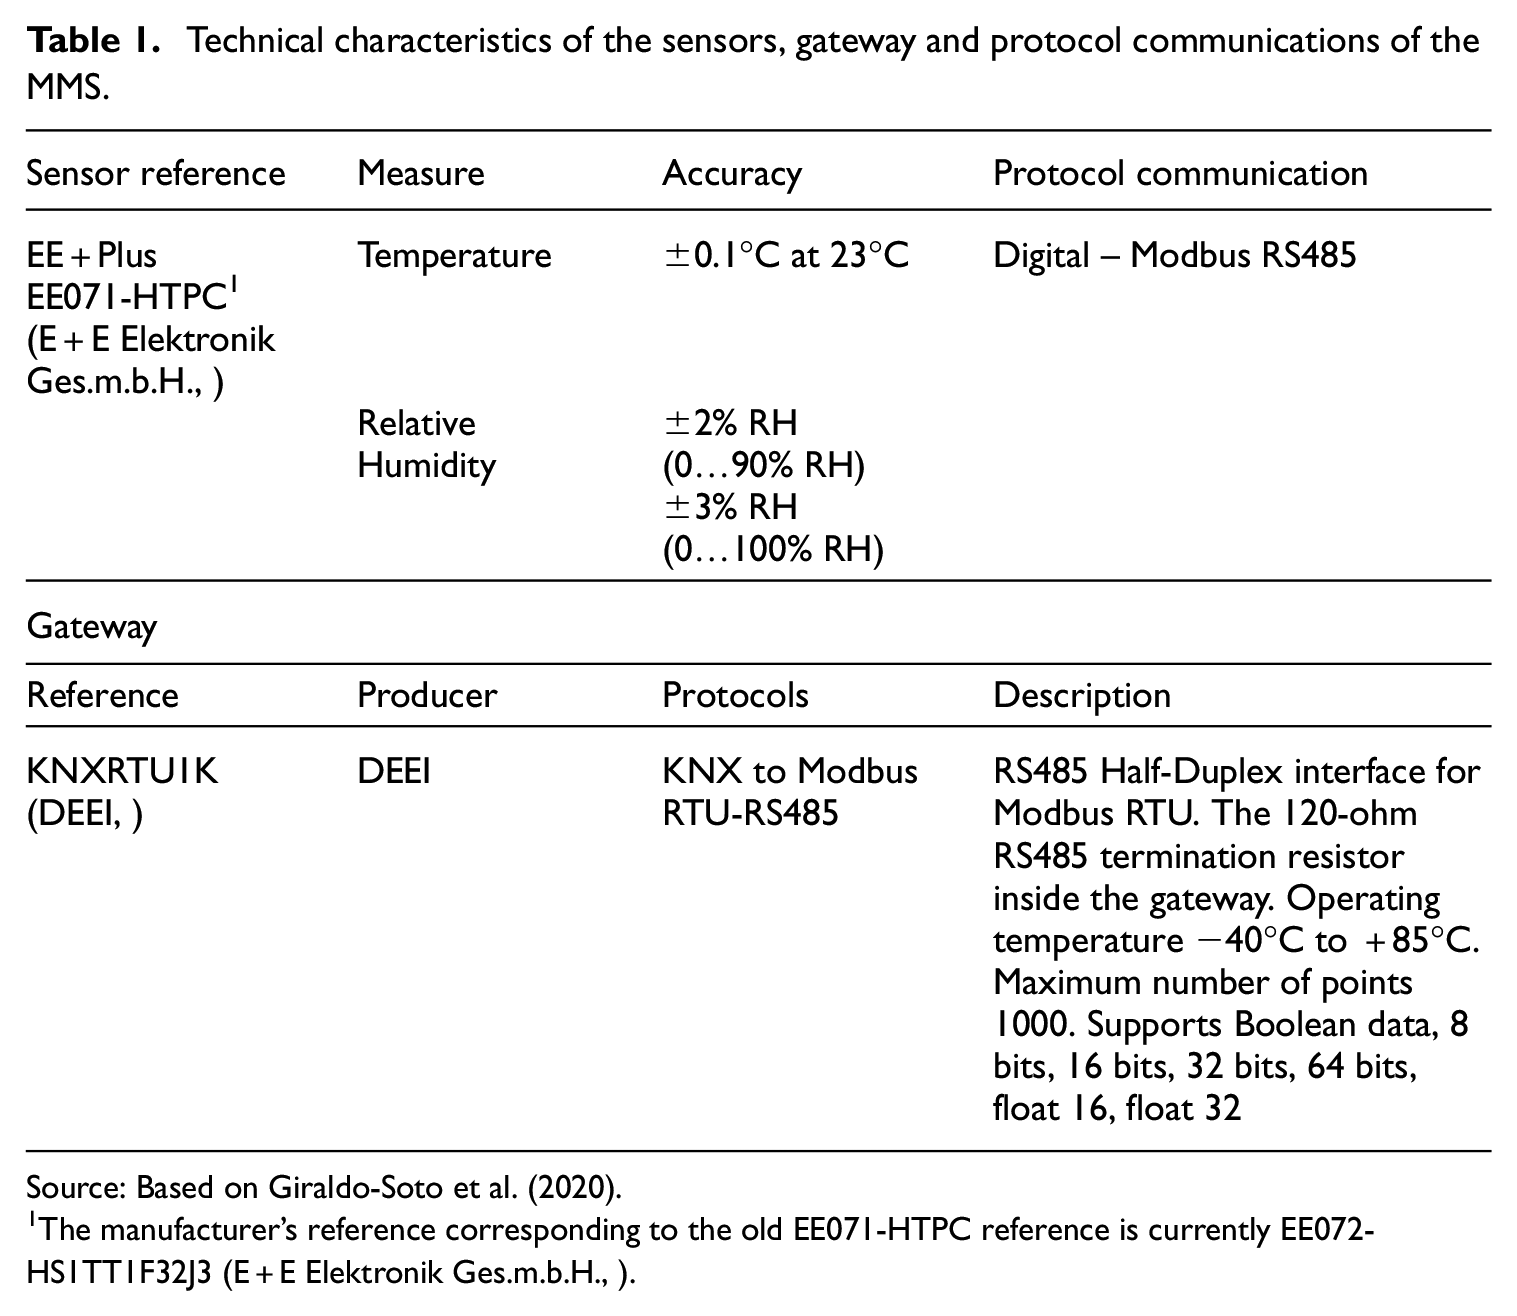
Source: Based on Giraldo-Soto et al. (2020).
The manufacturer’s reference corresponding to the old EE071-HTPC reference is currently EE072-HS1TT1F32J3 (E+E Elektronik Ges.m.b.H., ).
Aim and research questions
All of the above from normative and research works demonstrates that representing the outdoor air temperature surrounding a building envelope, the air temperature of a tunnel section or even the temperature of an urban zone as homogeneous is widespread. In such studies, the outdoor air temperatures are commonly measured with a single sensor, and when given, the uncertainty associated with these measurements is simply the manufacturer’s accuracy.
This research aims to quantify the correctness of this approach for the specific case of the outdoor air temperature surrounding a building envelope (note that the method would also be valid for the other non-building cases mentioned). To do so, the hypothetical homogenous outdoor air temperature surrounding a building envelope at a given instant of time is defined as the average temperature of several sensors located randomly around the building envelope (from now on named
Furthermore, the method also details the way in which the uncertainty associated with systematic errors can be estimated based on the manufacturer’s accuracy, and this is called the Temperature Sensor Uncertainty
Finally, the method was implemented for an in-use tertiary building, where eight high-precision outdoor air temperature sensors were randomly installed around the building envelope to take simultaneous measurements at different heights and cardinal orientations for several weeks. This uncertainty analysis of the temperature of the air surrounding the building also focuses on analysing the overall measurement uncertainty of
Method
This section explains the statistical method used to estimate the uncertainty of
Overall
The uncertainty due to systematic errors in the
The measurement uncertainty due to random fluctuations occurring in the building envelope is identified as ‘Temperature’s Spatial Uncertainty (
In this study, to estimate the temperature uncertainty in open exterior volumes, the same method used for closed interior volumes (Giraldo-Soto et al., 2022) has been implemented. Even if the estimation of the overall uncertainty is similar; in this work, it has been proven that decoupling this overall uncertainty is also possible without doing the Sensor Together Test to obtain the systematic uncertainty. In this case, the systematic uncertainty has been estimated starting from the manufacturer’s accuracy value.
State of the art of uncertainty analysis methods
The statistical method to estimate the measurement uncertainty of
All uncertainties set out in this study
Temperature Uncertainty
analysis
The outdoor air temperature measurements carried out around an in-use tertiary building are analysed in this manuscript (these data sets are available in the ‘Exterior (E) Test’ files of reference (Giraldo-Soto et al., 2020)). The statistical study samples are the Instants of Time
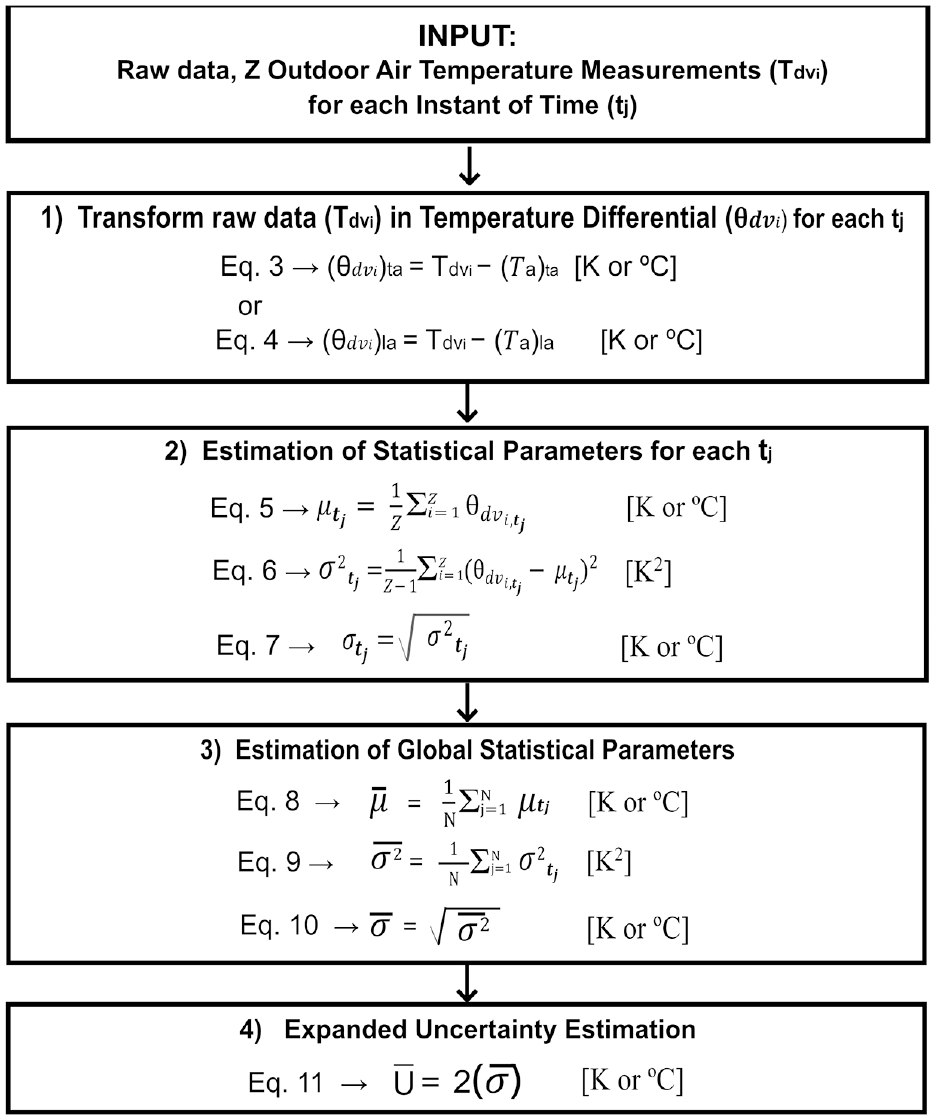
The uncertainty analysis method applied in this study is based on the following steps (Figure 1; Giraldo-Soto, 2021):
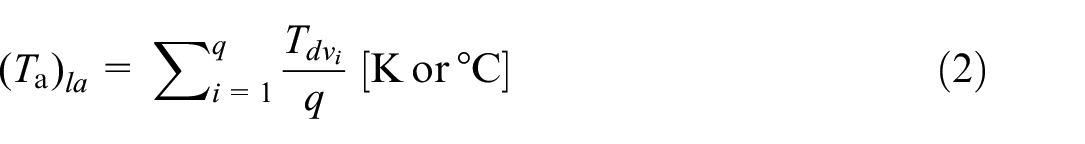
(1) The statistical analysis to estimate the uncertainty of
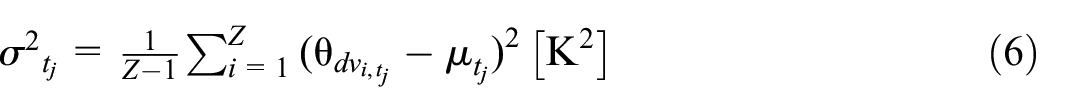
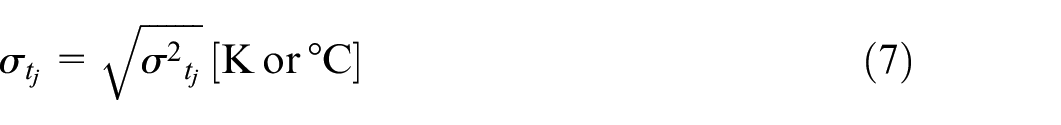
(2) Estimation of the mean (μ) (equation (5)), standard deviation (σ) (equation (6)) and variance (
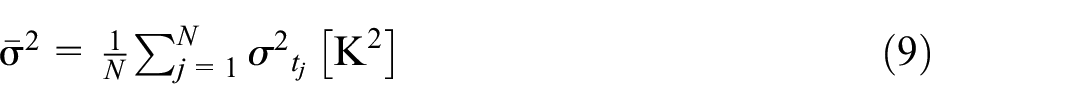
(3) The Global Mean (
(4) Based on the GUM method (BIPM, ), the Temperature Uncertainty (
(5) The statistical parameters of this study have been calculated to obtain the results of Section ‘Results and discussions’, using Scispy-stats (Scipy,), Pandas libraries (Pandas,) and programming in Python (Python.org,).
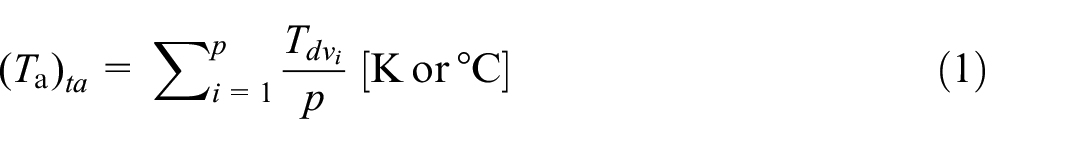


Where,
p: Number of
q: Number of
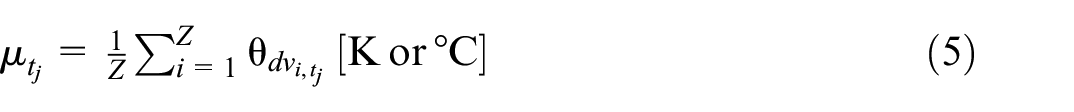


Where,
Z: Number of
N: Sample Size defined by the number of Instants of Time
Flowchart of the methodology to estimate the Temperature Uncertainty
In the case where there is only one sensor temperature measurement (Z = 1), the
Temperature Uncertainty
analysis for outdoor air temperature measurements protected with solar radiation shield with and without mechanical ventilation
This first analysis demonstrates that the solar radiation-shielded outdoor air temperature sensors only measure the convection air temperature, excluding any solar radiation effect on these temperature measurements. Solar radiation shields without mechanical ventilation are commonly used to protect outdoor air temperature sensors against solar radiation effects on their measurements. In this research, one of the temperature sensors has been protected by a mechanically ventilated solar shield, while naturally ventilated solar radiation shields have protected the rest. Thus, it has been possible to demonstrate that the not mechanically ventilated solar radiation-protected air temperature measurements are not affected by solar radiation. For this, two sensors, one with mechanically ventilated solar shielding and the other with naturally ventilated solar shielding, were installed in the same place, measuring next to each other in a BA at the same height. Then, the Temperature Uncertainty
Tout overall Temperature Uncertainty
estimation for the whole Building Air Volume (BAV)
In order to estimate the overall temperature Uncertainty
Temperature Sensor Uncertainty
analysis
This analysis aims to estimate the uncertainty sources due to systematic errors of the installed sensors. In this case, eight newly calibrated high-accuracy sensors from the same batch were acquired. Furthermore, the selected sensors are digital, so no uncertainty associated with the monitoring system connections is expected and thus, the Temperature Sensor Uncertainty
Decoupling the overall Temperature Uncertainty
by means of the Temperature Sensor Uncertainty
to estimate the Temperature’s Spatial Uncertainty
for the whole Building Air Volume (BAV)
Temperature Uncertainty
The objective of applying the decoupling method is to obtain the Temperature’s Spatial Uncertainty
(1) From the experimental test,
(2) The Mean Variance
(3) Subsequently, the weight of the systematic


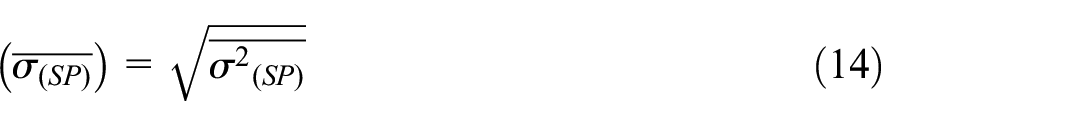

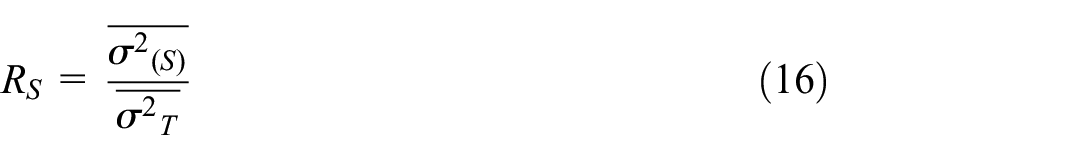
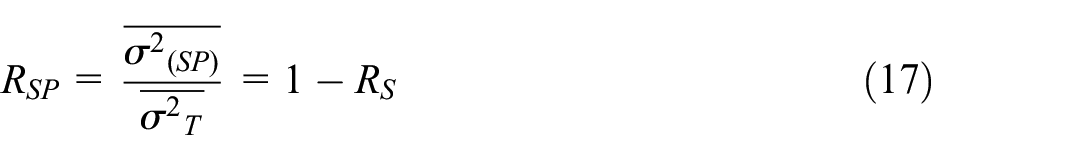
Where,
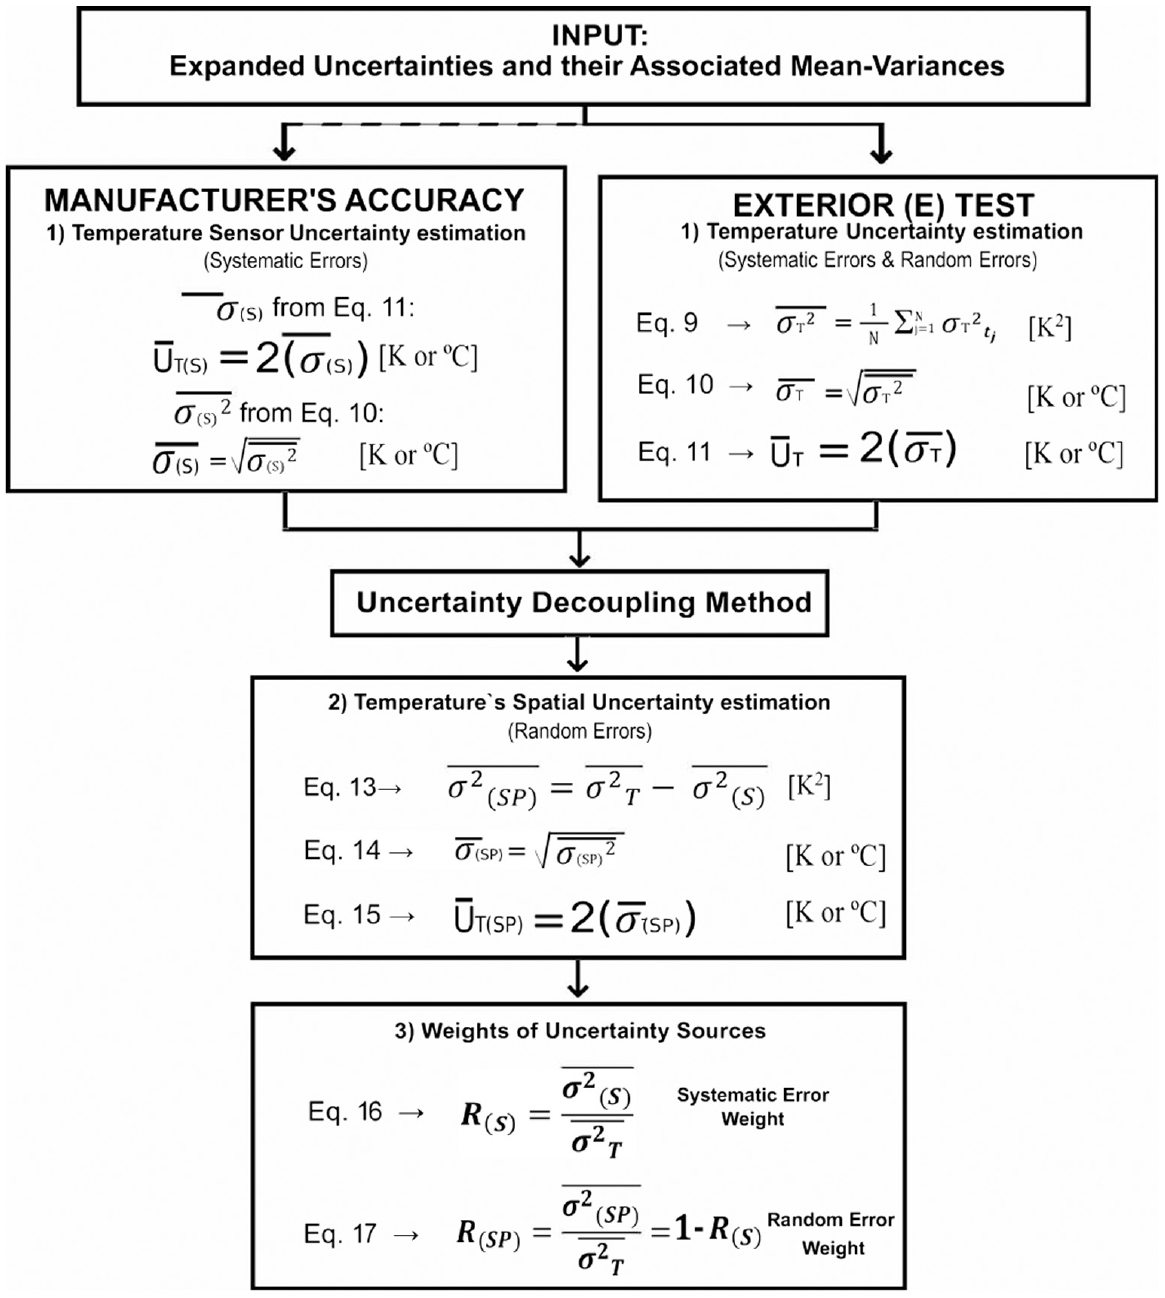
Flowchart of the decoupling methodology to estimate the Temperature’s Spatial Uncertainty (UT(SP)) and the uncertainty weights. Based on Giraldo-Soto et al. (2022).
Case study
Description of the monitoring system
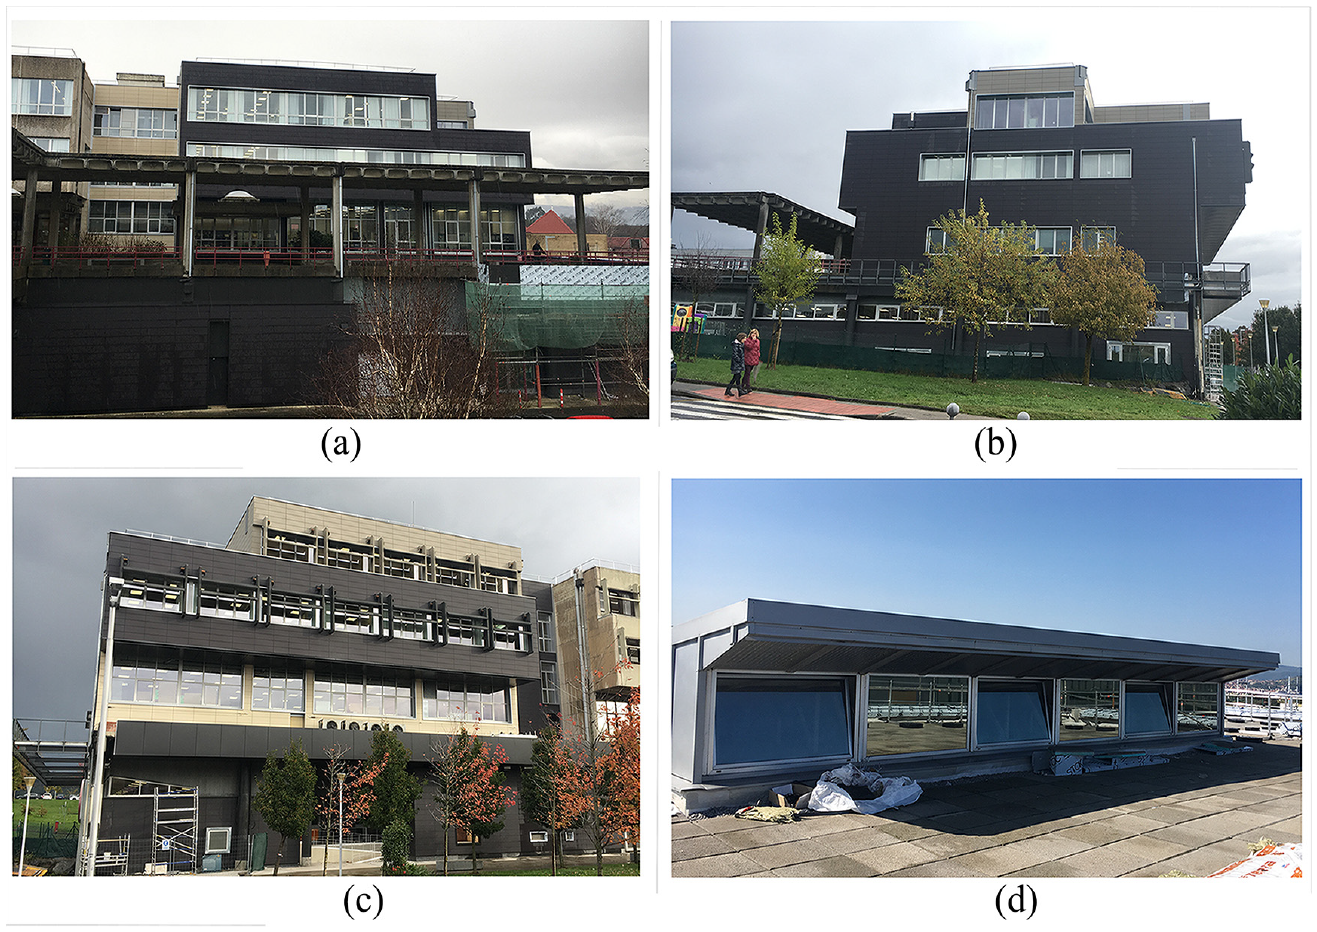
The monitored building is the west block of the University of the Basque Country (UPV/EHU) rectory (Figure 3). Eight EE071-HTPC (Table 1) sensors were installed within the existing building monitoring system to measure the Outdoor Air Temperature at several points. Seven of these installed sensors were protected against solar radiation using shields without mechanical ventilation and one with mechanical ventilation (ID sensor: 25). Table 2 shows the sensor references based on the ID sensor, height, cardinal orientation and building location. The sensors were installed around the building envelope at different heights and cardinal orientations (North (n), South (s) and West (w)). Figure 4 to 7 show the layout of the sensors.
Upper view of the exterior sensor layout around the building envelope. Based on Giraldo-Soto et al. (2020) and Affordable and Adaptable Public Buildings through Energy Efficient Retrofitting (A2PBEER).
Exterior (E) Layout of EE071-HTPC sensors installed around the building envelope.
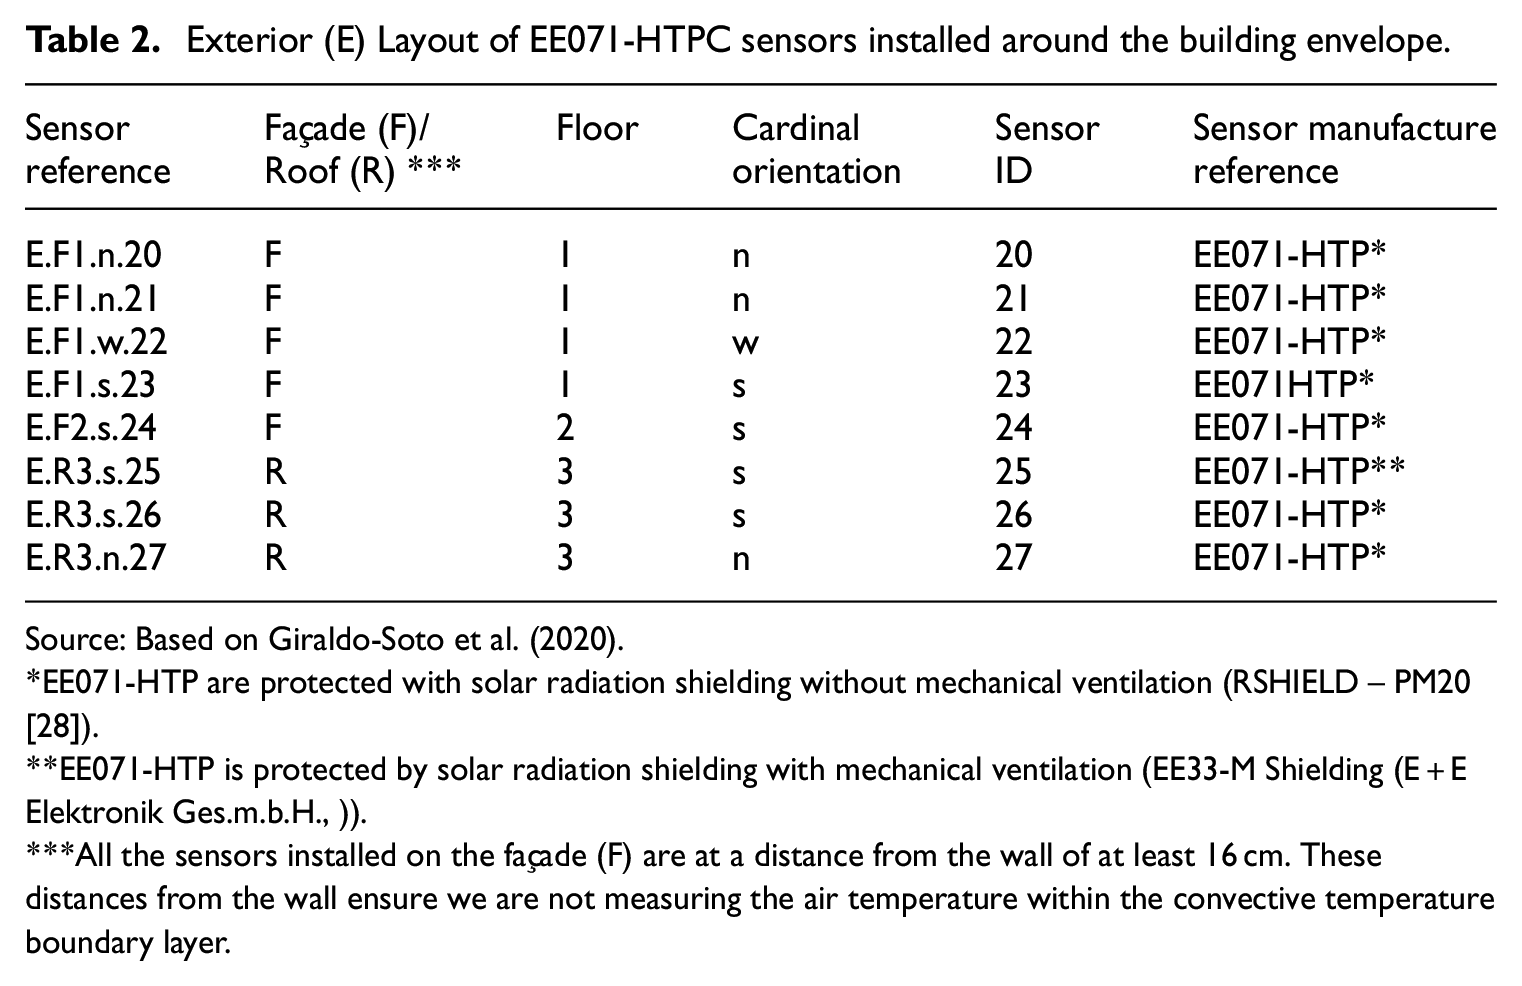
Source: Based on Giraldo-Soto et al. (2020).
EE071-HTP are protected with solar radiation shielding without mechanical ventilation (RSHIELD – PM20 [28]).
EE071-HTP is protected by solar radiation shielding with mechanical ventilation (EE33-M Shielding (E+E Elektronik Ges.m.b.H., )).
All the sensors installed on the façade (F) are at a distance from the wall of at least 16 cm. These distances from the wall ensure we are not measuring the air temperature within the convective temperature boundary layer.
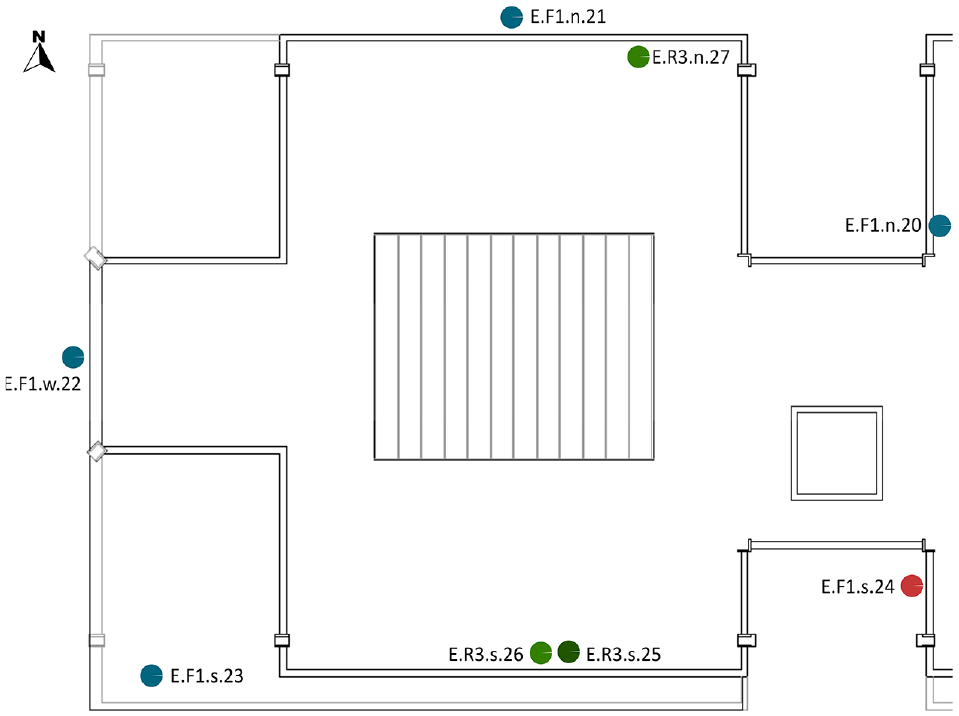
Upper view of the exterior sensor layout around the building envelope. Based on Giraldo-Soto et al. (2020) and Affordable and Adaptable Public Buildings through Energy Efficient Retrofitting (A2PBEER).
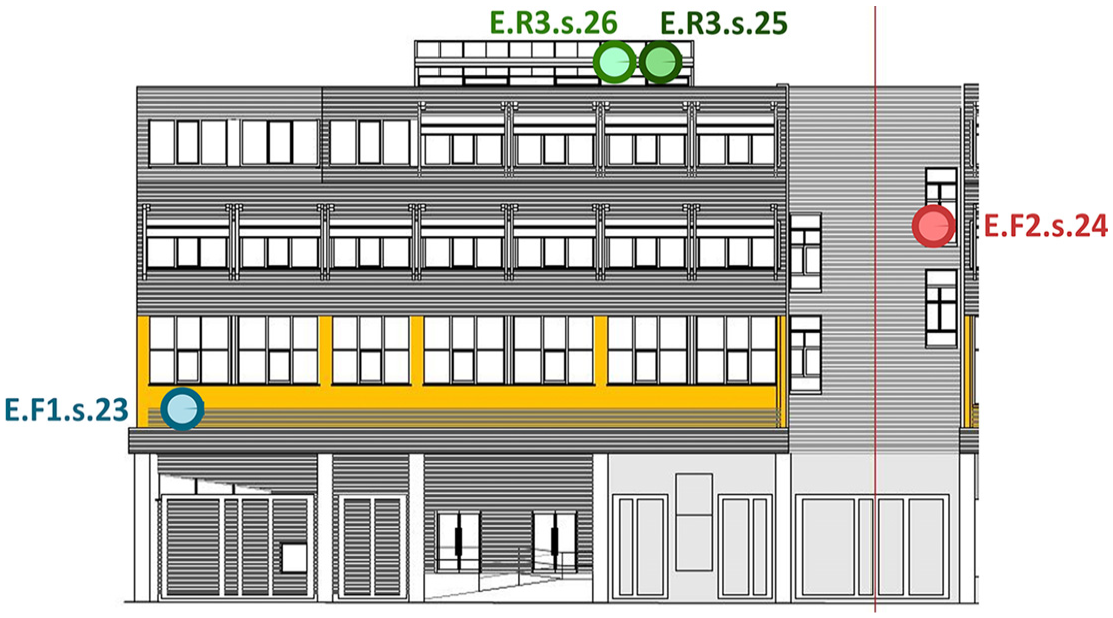
Exterior sensor layout on the south facxade of the building. Based on Giraldo-Soto et al. (2020) and Affordable and Adaptable Public Buildings through Energy Efficient Retrofitting (A2PBEER).
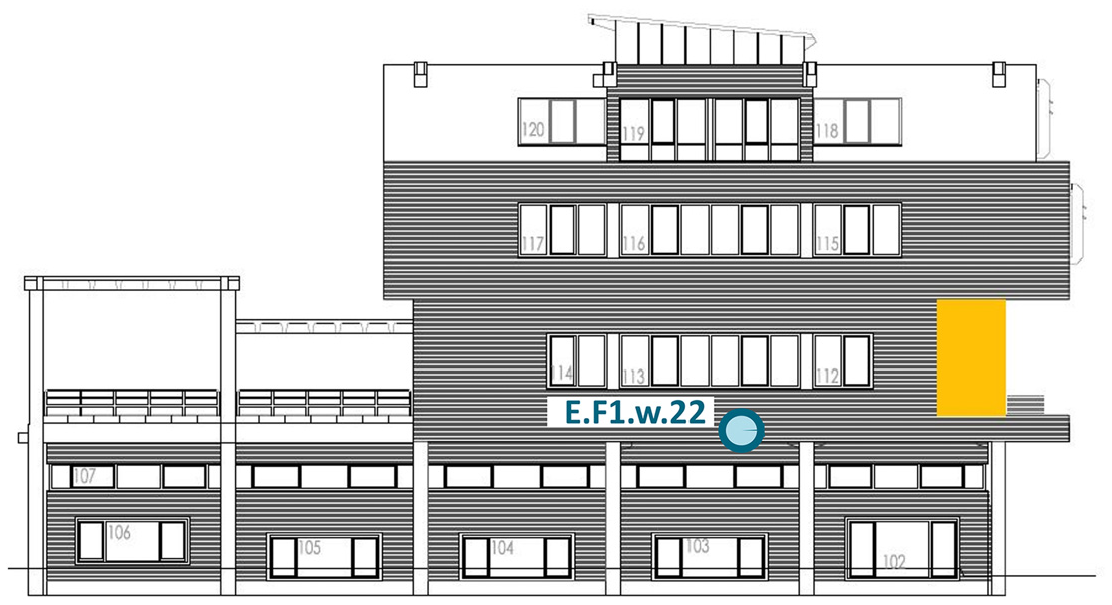
Exterior sensor layout on the west facxade of the building. Based on Giraldo-Soto et al. (2020) and Affordable and Adaptable Public Buildings through Energy Efficient Retrofitting (A2PBEER).
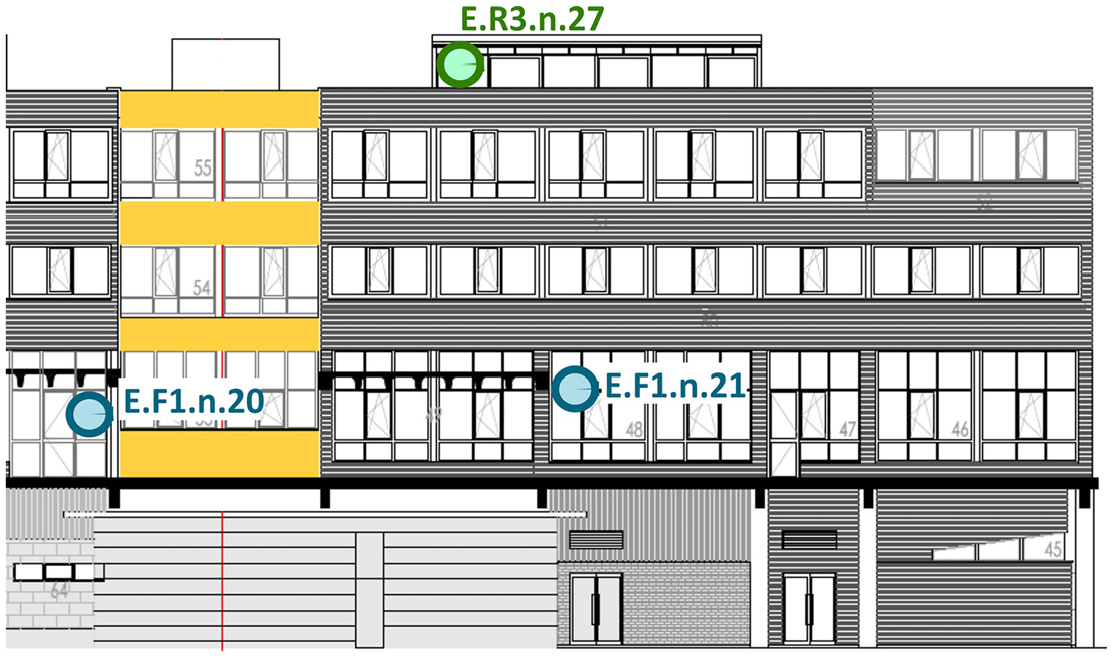
Exterior sensor layout on the north facxade of the building. Based on Giraldo-Soto et al. (2020) and Affordable and Adaptable Public Buildings through Energy Efficient Retrofitting (A2PBEER).
The EE071-HTPC sensors with Modbus RS485 technology (The Modbus Organization, ) were integrated into the existing Building Automation System (BAS) implemented during the A2PBEER European project (a2pbeer.eu, ), with KNX protocol communication (KNX Association, ). A KNXRTU1K gateway was used for this (Table 1).
The experimental test for this study is described in detail in the Data in Brief article: ‘Dataset of an in-use tertiary building collected from a detailed 3D Mobile Monitoring System and Building Automation System for indoor and outdoor air temperature analysis’ (Giraldo-Soto et al., 2020). To carry out the studies on the
Results and discussions
The data analysis has been carried out on the data sets available in the data repository (Giraldo-Soto et al., 2020), specified and described in Giraldo-Soto et al. (2020). This section starts by validating the outdoor air temperature measurements performed by the sensors protected by solar radiation shields without mechanical ventilation (see Figure 8). It is followed by the estimation of the overall temperature uncertainty of the
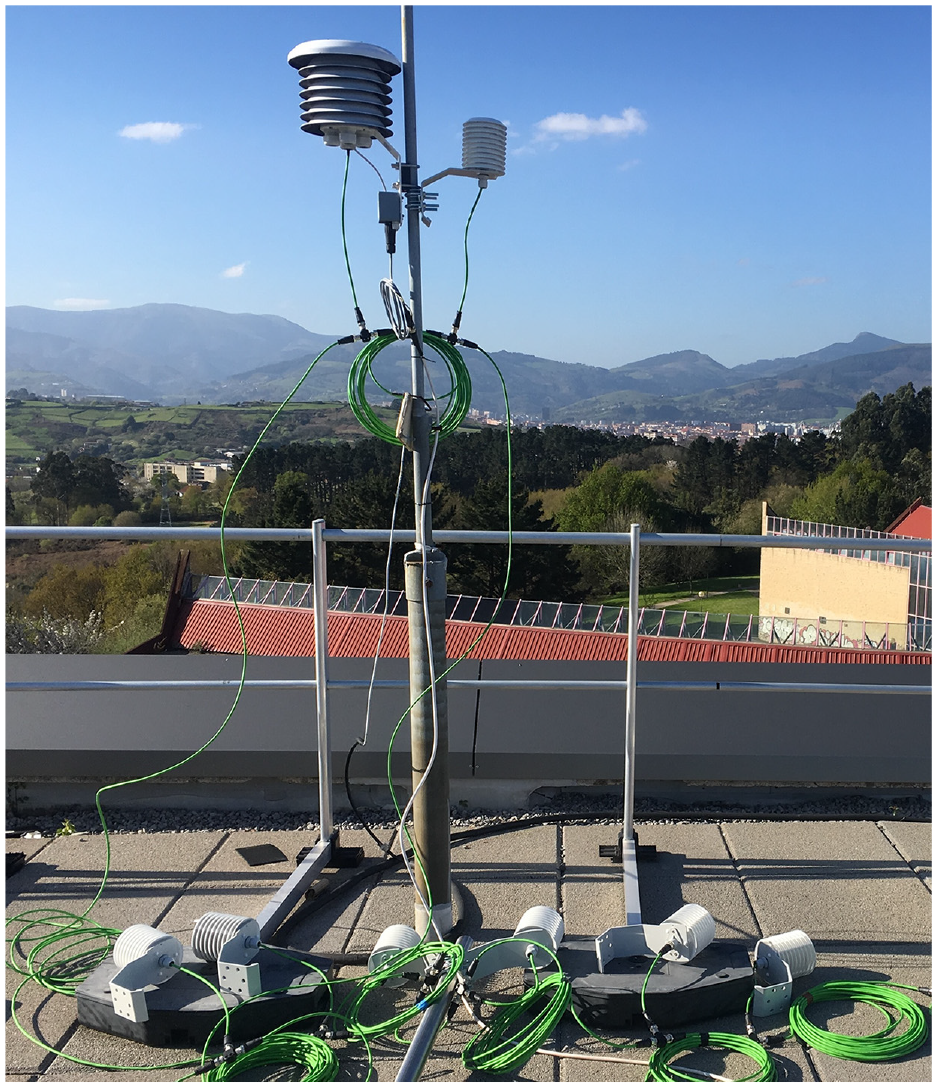
All the shielded sensors for the exterior monitoring system during the installation. The solar radiation shield with mechanical ventilation (on the left) on the mast can be seen together with a solar radiation shield without mechanical ventilation (on the right); these two sensors are already in their final position. Based on Giraldo-Soto et al. (2020).
In the analysed period, 407,664 data points were collected in 50,958 Instants of Time (
In the RAD ON-OFF case, with a sample size equal to 50,958
Temperature Uncertainty
analysis
Temperature Uncertainty
analysis for outdoor air temperature measurements protected with a solar radiation shield with and without mechanical ventilation
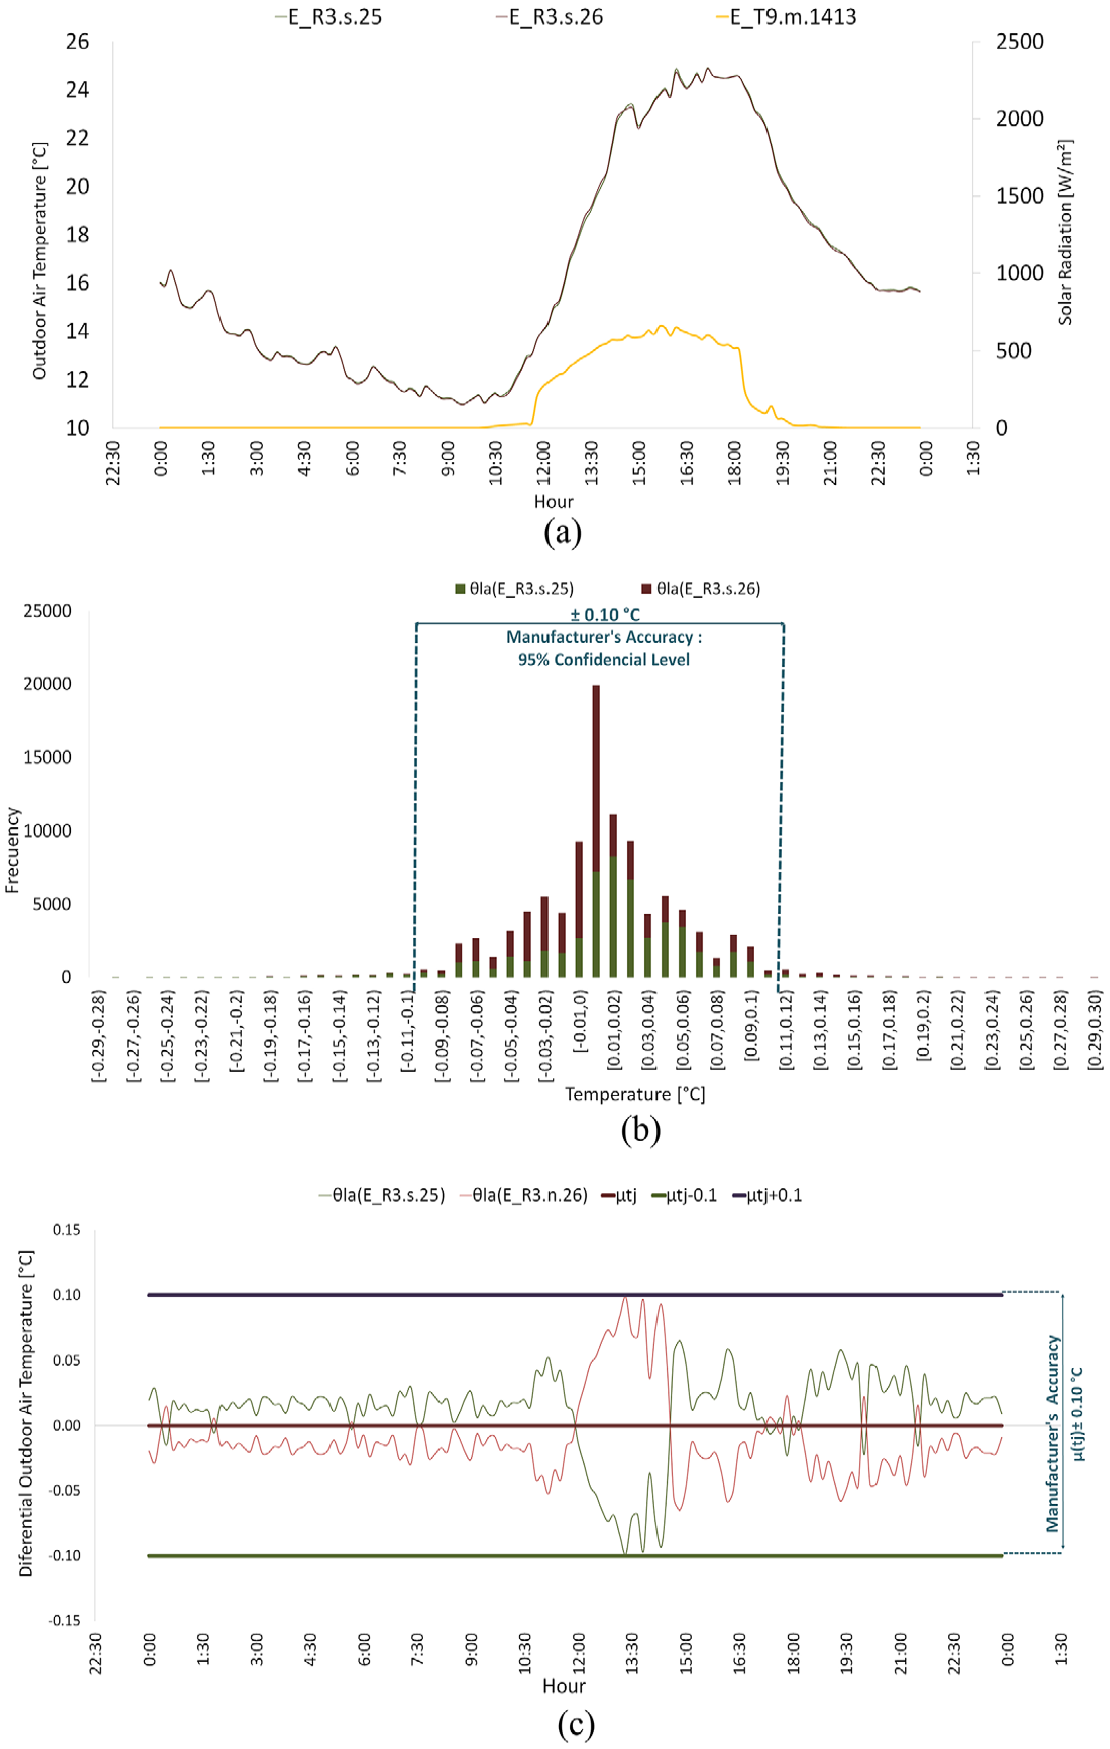
Any radiation shield must be designed to provide an enclosure with an internal temperature that is uniform and equal to the outside air (Foken and Bange, 2021). The shielding should surround the thermometer and exclude radiant heat, precipitation and other phenomena that may influence the measurements. To ensure the shielding effect, they must be standardised to ISO 17714:2007 (2007). To demonstrate that the outdoor air temperature sensors protected against solar radiation only measure the air temperature by convection, thus excluding any effect of solar radiation, the analysed data were collected by the E.R3.s.25 and E.R3.s.26 sensors, with and without mechanical ventilation within the solar radiation shield, respectively. Data from October 7th, 2019, at 12:42:20, to January 6th, 2020, at 3:53:00 during the Exterior E test (Giraldo-Soto et al., 2020) was used. The methodology of the statistical analysis carried out is based on Subsection ‘Temperature Uncertainty
Figure 9(a) is the temperature evolution of both air temperature sensors and the horizontal global solar radiation measurements on October 08th, 2019, from 0:00 to 23:59 (UTC+2). This top figure shows how the temperature signals of both sensors have the same behaviour and tendency.
Figure 9(b) shows the histograms of the
Figure 9(c), here it is possible to appreciate how most
Panel (a) shows, on the left axis, the
The results of this statistical analysis are shown in Table 3 for different
The difference RAD ON and RAD OFF (
The difference RAD ON and RAD ON-OFF
Temperature Uncertainty (
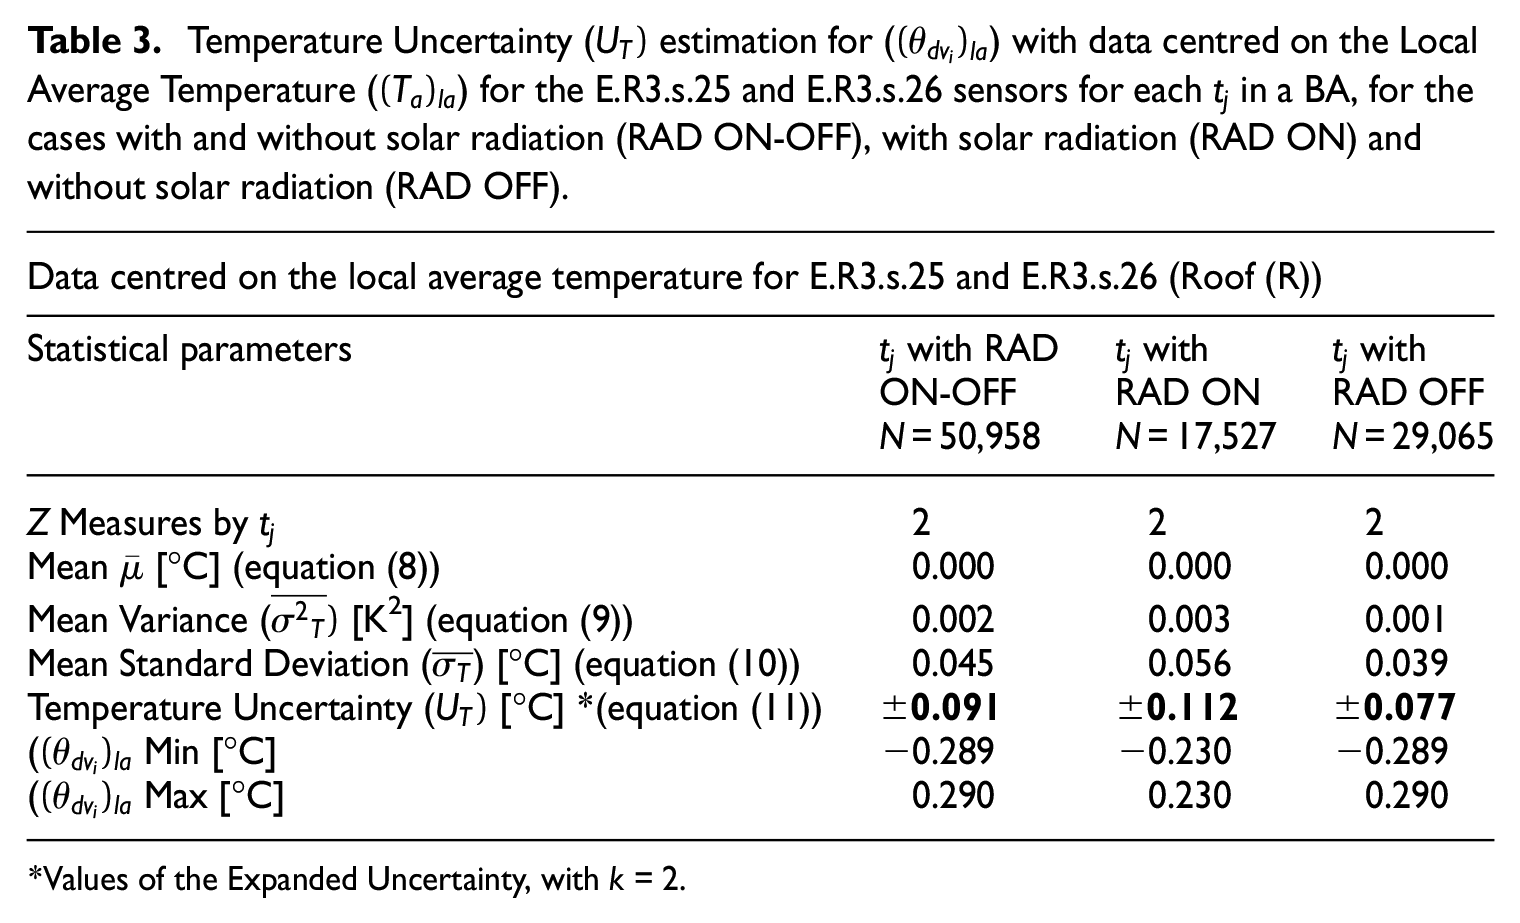
Values of the Expanded Uncertainty, with k = 2.
Both
Tout overall Temperature Uncertainty
estimation for the whole Building Air Volume (BAV)
This section calculates the overall uncertainty of the
In Figure 10, it can be seen that:
Figure 10(a) shows: the left axis
Figure 10(b) shows the histograms of the
Figure 10(c) represents the
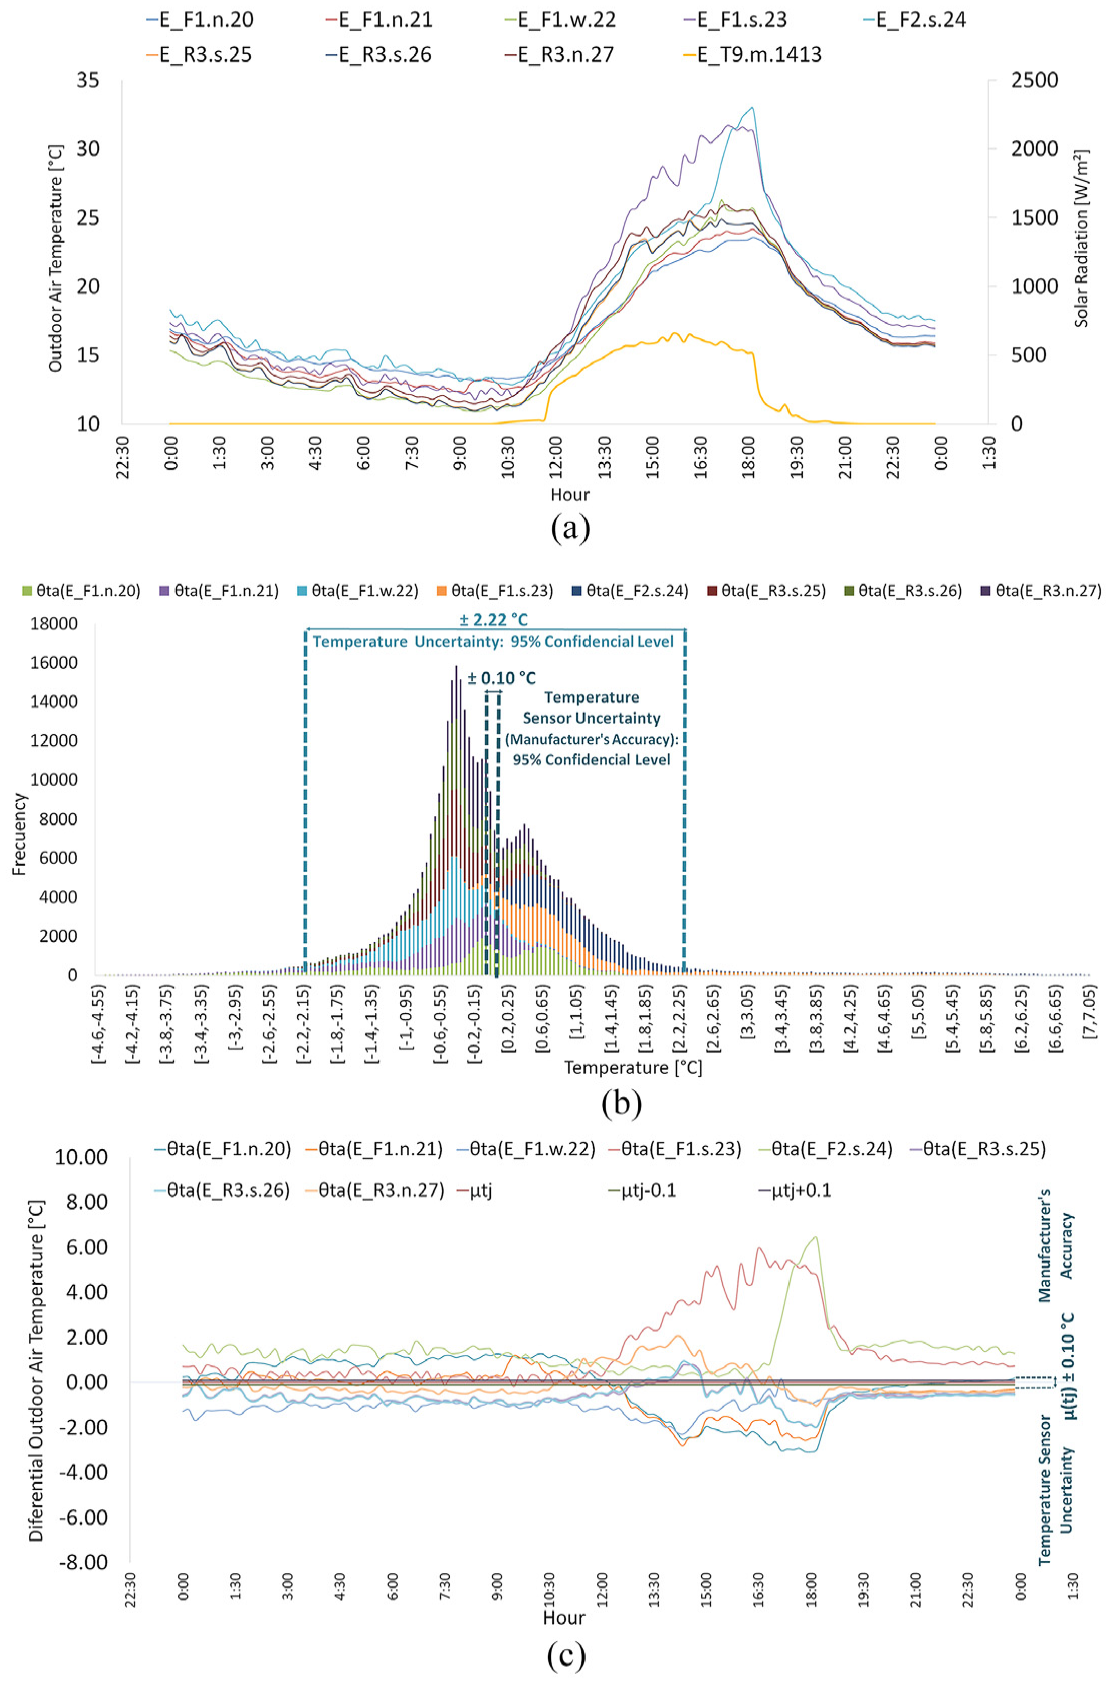
Panel (a) shows the left axis is the
Table 4 shows the results of the statistical analysis for the three studied cases, RAD ON-OFF (N = 50,958), RAD ON (N = 17,527) and RAD OFF (N = 29,065). Likewise, this table shows the results for the RAD ON-OFF case for a sample size equal to 46,952
Overall Temperature Uncertainty (
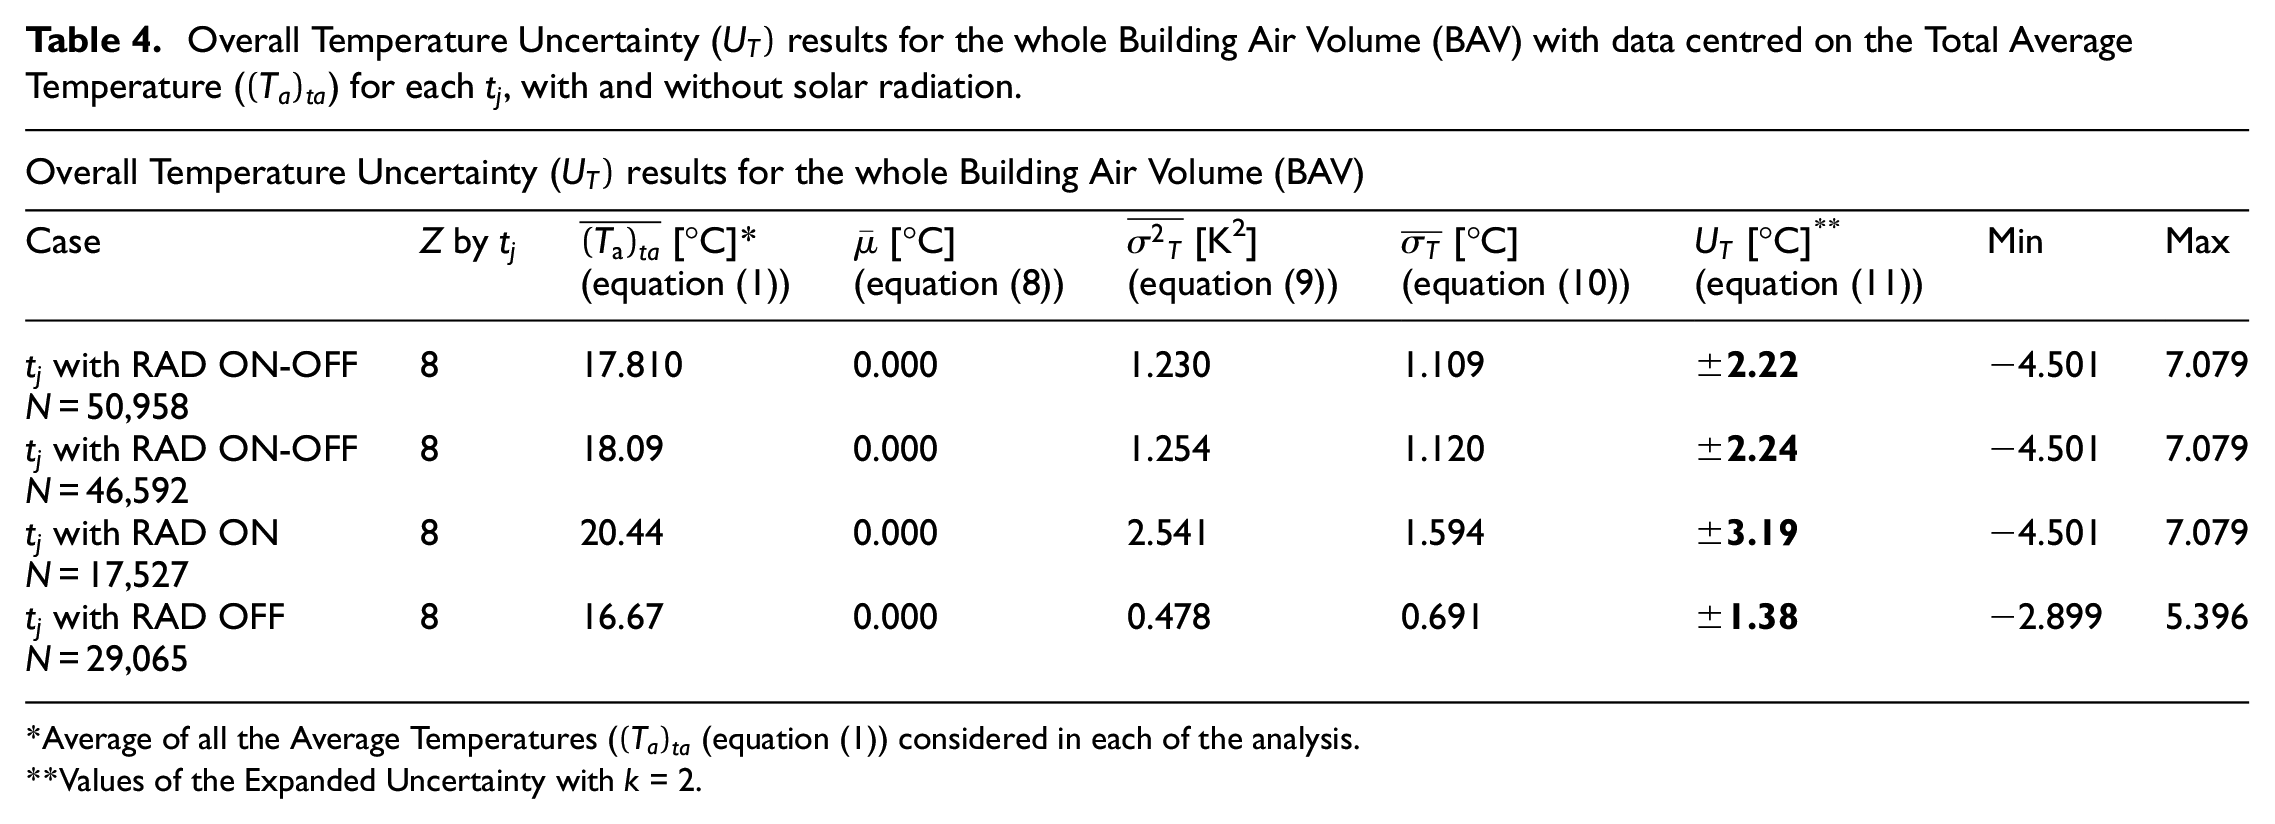
Average of all the Average Temperatures (
Average Temperatures (
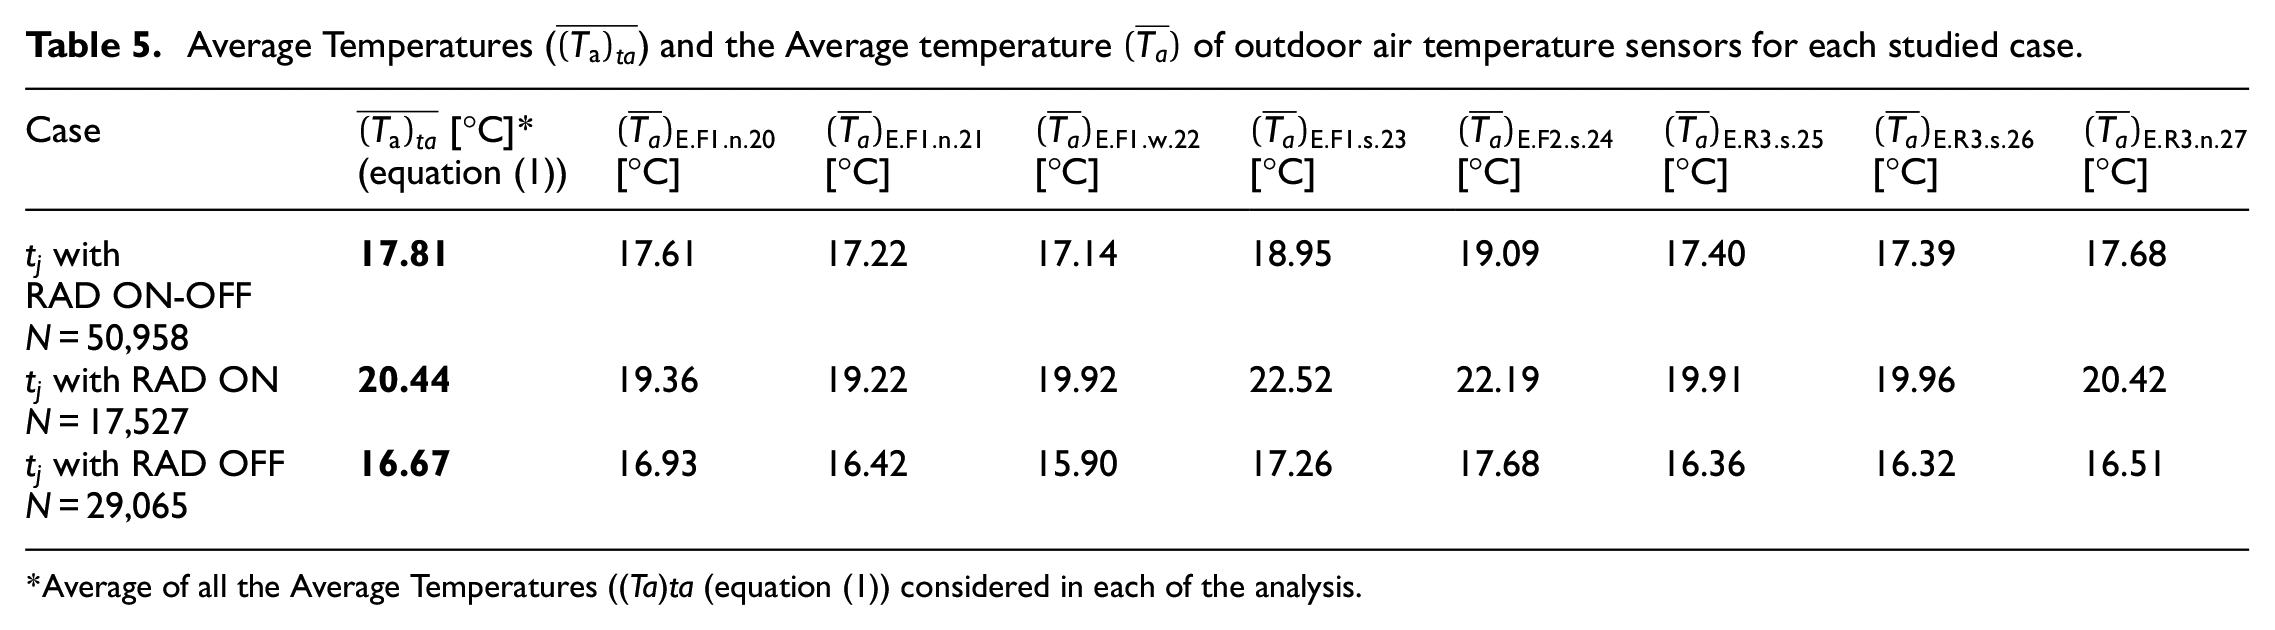
*Average of all the Average Temperatures ((Ta)ta (equation (1)) considered in each of the analysis.
In the case of the RAD ON and RAD OFF periods, the
Furthermore, comparing the
From (Table 4), it can be stated with 95% confidence that the average temperature of the outdoor air surrounding the studied building during the monitoring period, comprised from October 7th, 2019, at 12:42:20 to January 6th, 2020, 3:53:00, was 17.81 ± 2.22°C. Note that the uncertainty band of this Tout is much higher than the ±0.1°C uncertainty value given by the sensors’ manufacturer, which is generally used as the overall measurement uncertainty.
Finally, from (Table 5), it can be stated that, for this particular building, the best position to place the outdoor temperature sensor would be the north area of the roof (sensor E.R3.n.27). This is the position where the individual temperature measurement is closest to the mean of the eight sensors surrounding the building. Obviously, this is a case specific result.
Temperature Sensors Uncertainty
analysis
The Temperature Sensor Uncertainty
Table 6 shows the Mean Variance equals 0.0025 K2 and the Mean Standard Deviation equals 0.05ºC, calculated from the Manufacturer’s Accuracy data. This
Statistical results from manufacturer’s accuracy of the EE071-HTPC sensor.
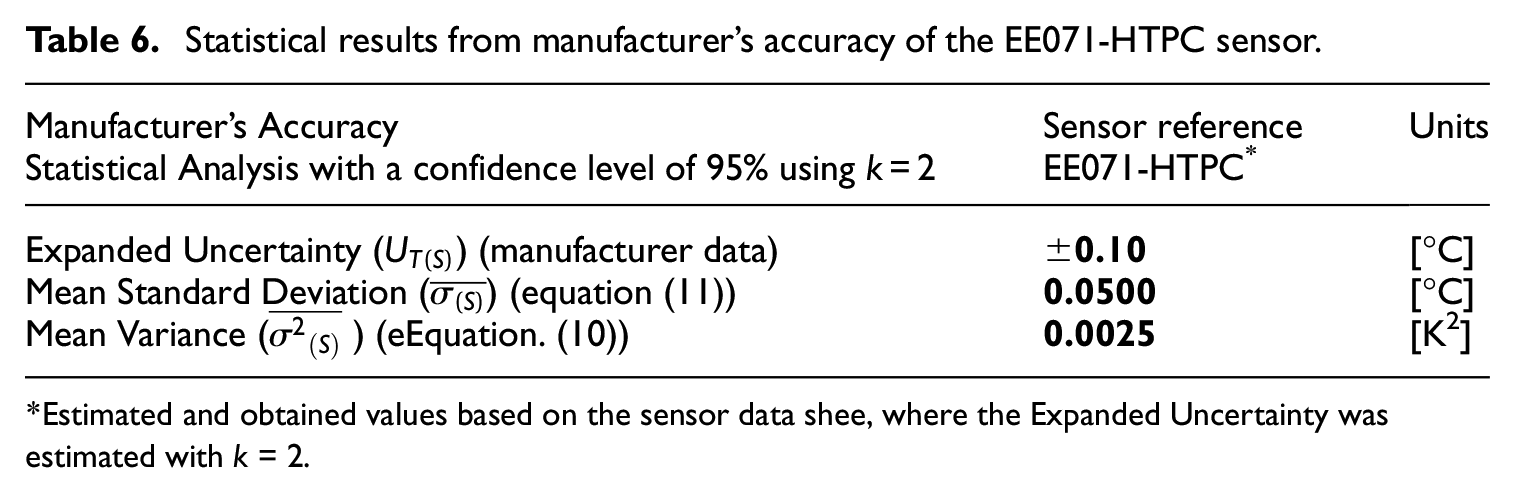
Estimated and obtained values based on the sensor data shee, where the Expanded Uncertainty was estimated with k = 2.
Decoupling the Temperature Uncertainty
by means of the Temperature Sensor Uncertainty
to estimate the Temperature’s Spatial Uncertainty
of the whole Building Air Volume (BAV)
In this section, the decoupling method was carried out to estimate the Temperature’s Spatial Uncertainty
The results of decoupling the Temperature Uncertainty
Decoupling of
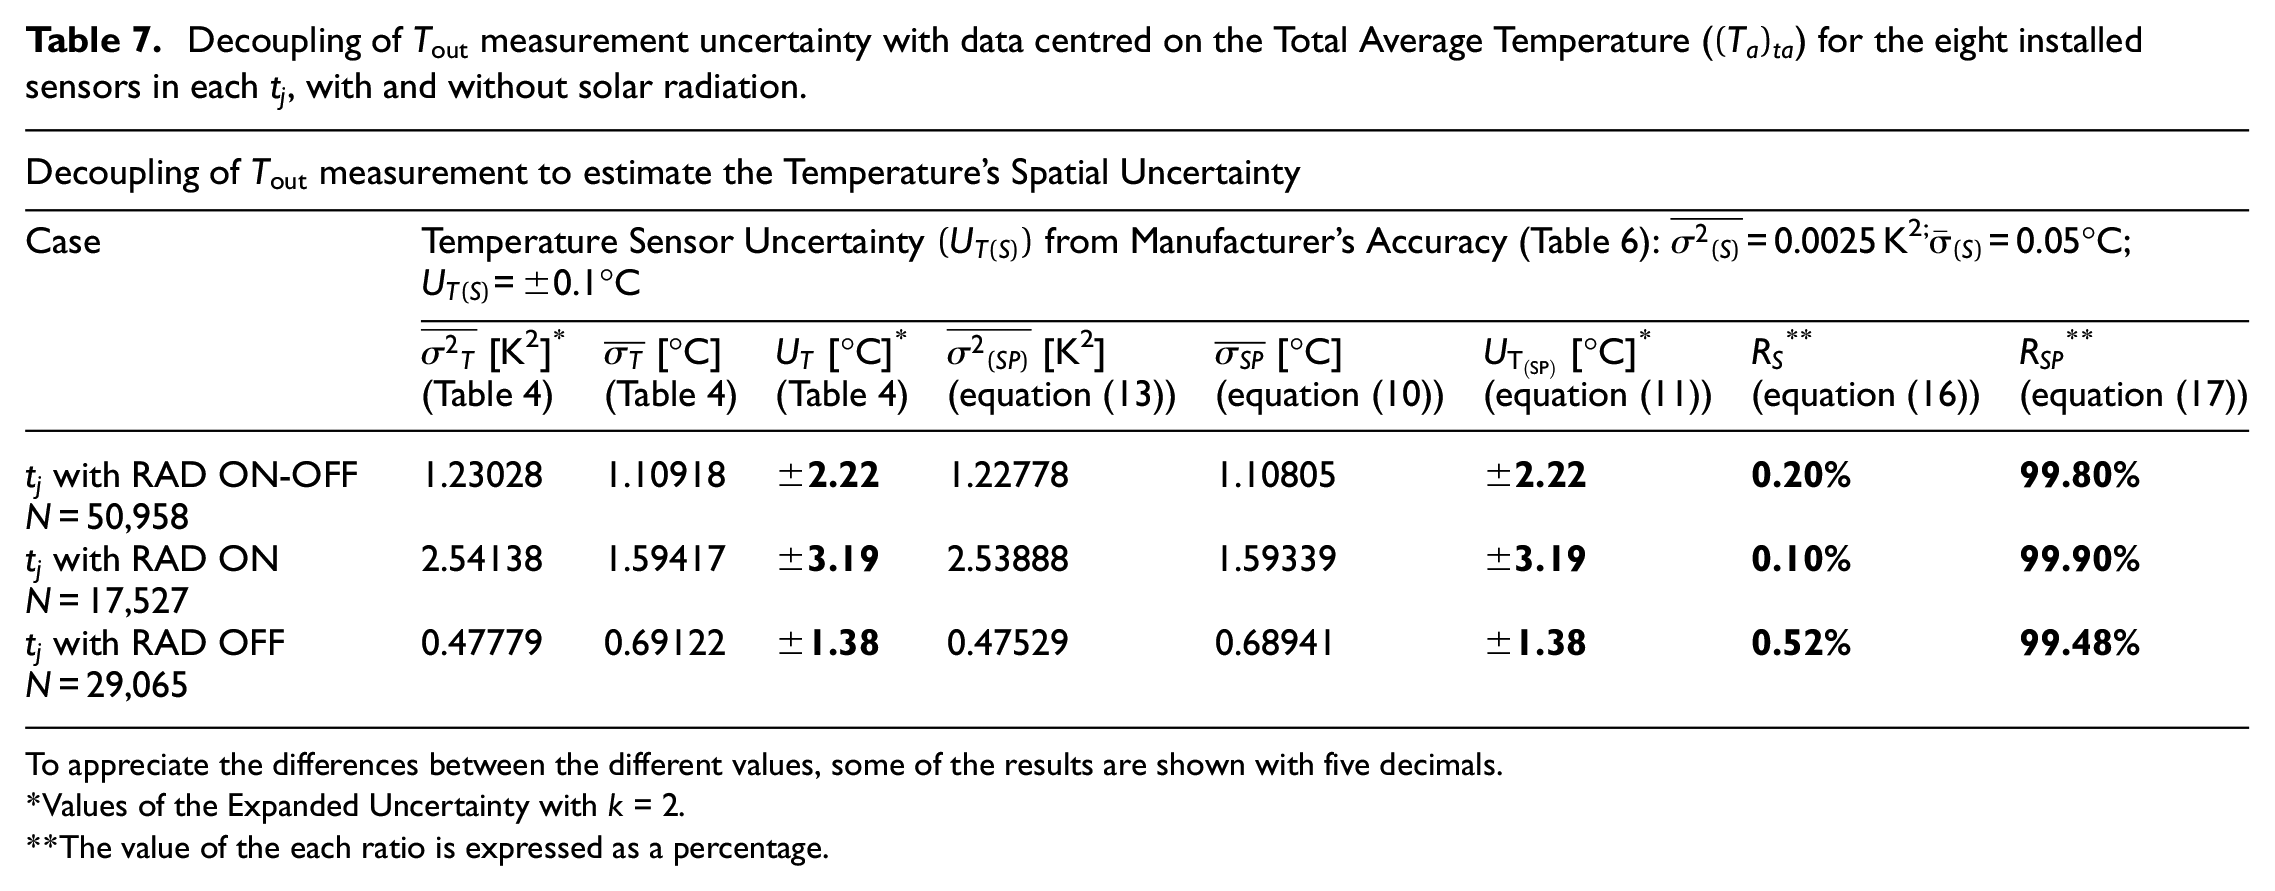
To appreciate the differences between the different values, some of the results are shown with five decimals.
Values of the Expanded Uncertainty with k = 2.
The value of the each ratio is expressed as a percentage.
The
Additionally, taking into account that the estimated
Conclusions
In the literature review of this manuscript, it is highlighted that the practice of considering the outdoor air temperature surrounding the building envelope as homogeneous is well established. In addition, when measured, it is common practice to have a unique measurement representing this hypothetical homogeneous outdoor air temperature surrounding the building envelope (namely Tout). Furthermore, the uncertainty associated with this measurement (when provided within the research) is usually limited to the accuracy of the sensor given by the manufacturer. In this manuscript, an overall uncertainty of this hypothetical homogeneous outdoor air temperature (Tout) measurement has been defined and quantified. For this, the existing spatial variability of the outdoor air temperature measurements around a building envelope has been defined as a random error. Likewise, Tout has been defined as the average temperature of several sensors located randomly around the building envelope. Then, the total variability of these measurements regarding Tout at a given time instant has been linked through the GUM method to the overall Temperature Uncertainty
The method has been applied to the Tout measurement of a four-floor building, where eight high-precision temperature sensors (with a ±0.1°C accuracy;
Additionally, the monitoring period was divided into two sub-periods: one considers all the measurement instants with solar radiation incidence, and the other considers all the measurement instants without solar radiation incidence. Analysing the sub-period with solar radiation, this overall Temperature Uncertainty increases to ±3.19°C; while for the sub-period without solar radiation incidence, it decreases to ±1.38°C. Thus, solar radiation incidence is one of the main random uncertainty sources (or physical effects that generate spatial variability around the outdoor air temperature surrounding a building envelope) in the Tout measurement. Consequently, research studies that only consider cloudy periods and night time will have a lower measurement uncertainty of outdoor air temperature, thus improving the reliability of their estimates. Furthermore, this also reflects the importance of estimating the HTC on cloudy days to reduce the uncertainty of its estimation, which will allow great progress towards the development of more reliable methods for estimating the HTC and its uncertainty.
Finally, thanks to the developed Temperature Uncertainty decoupling method, it has been possible to estimate the Temperature Spatial Uncertainties (which include only the random errors) of Tout; these being equal to ±2.22°C in periods with and without solar radiation incidence, ±3.19°C in periods with solar radiation incidence and ±1.38°C in periods without solar radiation incidence. Likewise, the weight of the Temperature Spatial Uncertainties represents 99.93%, 99.97% and 99.82% of the overall Temperature Uncertainty in periods with and without solar radiation incidence, with solar radiation incidence and without solar radiation incidence, respectively. This analysis of the weight the random errors have in the overall Temperature Uncertainty of Tout can quantify to what extent we are underestimating the Tout overall uncertainty when only considering the sensor manufacturer’s accuracy as the overall uncertainty of the Tout measurements.
Footnotes
Appendix
Auhtor contributions
Declaration of conflicting interests
The author(s) declared no potential conflicts of interest with respect to the research, authorship, and/or publication of this article.
Funding
The author(s) disclosed receipt of the following financial support for the research, authorship, and/or publication of this article: This publication is part of the R+D+i project PID2021-126739OB-C22, financed by MICIU//AEI/10.13039/501100011033/ and ‘ERDF A way of making Europe’. The corresponding author also acknowledges the support provided by the University of the Basque Country and the University of Bordeaux through a scholarship granted to Dr. Catalina Giraldo-Soto to complete her PhD degree through the Framework Agreement: Euro-regional Campus of Excellence within the context of their respective excellence projects, Euskampus and IdEx Bordeaux. Funder reference: PIFBUR 16/26. University of the Basque Country (UPV/EHU). Likewise, it acknowledges the support the Basque Government provides through a post-doctoral fellowship granted to Dr. Catalina Giraldo-Soto, which funding is awarded according to the order dated July 6, 2021, from the Minister of Education. Funder reference: POS_2021_1_0019, POS_2022_2_0043 and POS_2023_2_0025