
Abstract
Performance of Photovoltaic-double skin façade (Photovoltaic-DSF) system in summer has been critical. Owing to high solar ingress, cooling requirement of a building significantly increases. Photovoltaic-DSF system provides a shield and controls the heat gain through fenestration in the interior spaces. In the present article, mathematical correlations are developed to analyse energy behaviour of forced-ventilated Photovoltaic-DSF system in India’s hot summer zone, that is, Jaipur. The Photovoltaic-DSF system has been installed and monitored for Jaipur’s summer months (May to July). L25 Orthogonal array of design parameters (air cavity thickness, air velocity and PV panel’s transparency) and their respective levels have been developed using Taguchi design to perform experiments. Based on experimental results, multiple linear regression has been used to forecast solar heat gain coefficient, PVs electrical power and daylighting illuminance indoors as function of design factors. The statistical significance of mathematical relationships is supported by variance analysis, which is found to be in good accord with field measurements (R2 > 0.90). The proposed correlations are pragmatic in designing Photovoltaic-DSF systems for hot summer conditions. The Photovoltaic-DSF system with 30% transmittance and air velocity of 5 m/s in 200 mm air cavity thickness achieved maximum energy performance in hot summers.
Keywords
Highlights
Summer performance of a forced ventilated PV-DSF system is assessed.
PV panel transparency, air cavity and velocity are selected as design parameters.
Mathematical correlations are developed to predict the energy performance.
Correlations are validated experimentally for their robustness.
Introduction
Around 1/3rd of world’s energy is consumed by commercial and residential buildings, which will probably increase to nearly 1/2 by the end of 2025. This escalation in energy consumption share is due to an exponential increase in development activities. As per International Energy Outlook, energy consumption in India’s residential and commercial building sector is expected to rise by 2.7% per year by 2040 (Preet and Smith, 2024). In light of the foregoing estimates, countries around the world realise the importance of energy-efficient building envelopes. Net-zero energy buildings have been mandated by the ‘European Union Energy Performance of Buildings Directive’ (Preet et al., 2017). LEED (Leadership in Energy and Environmental Design) and the Energy Star programme is an initiative of U.S. government to lower building energy demand (Preet et al., 2024). Buildings in India are now required to comply with Energy Conservation Building Code (ECBC; Saxena and Das, 2018).
Climate Adaptive Building Shells (CABS) and passive techniques (Chen and Yang, 2017) provide reliable Energy Conservation measures (ECMs) in buildings. The passive design components optimise building design, providing substantial thermal and visual comfort with low energy requirements (Yao et al., 2018). Having less energy requirement than a single envelope, double or dual-pane envelope or facade (DSF) has become a popular passive heating and cooling solution (Pomponi et al., 2016). An optimised balance in energy savings and thermal-visual comfort can be achieved using a double-pane envelope (Kim et al., 2018). Semi-transparent photovoltaic modules over the exterior skin of DSF provide an advantage of aesthetics and on-site energy generation with acceptable daylighting illuminance and reduced glare in occupied space (Agathokleous and Kalogirou, 2016).
Over last two decades, many researches have been carried out on the usage of single photovoltaic modules on the envelope or facade of the buildings (Lu and Law, 2013). Researchers opted for the dual-glazed windows due to high U-value and high solar heat gain coefficient (SHGC) characteristics of single windows or facades. In dual-glazing windows, specified 13 mm air gap maintained between two glazing (Miyazaki et al., 2005; Wang et al., 2017) and found a better performing envelope with a dual glazed window or facades system (Chen et al., 2019; Wang et al., 2021a). In some instances, it was observed that in hot or warm climatic conditions, heat entrapping within cavity overheats the façade, which causes thermal discomfort in the built area (Preet, 2021). Due to the above reasons, researchers replaced enclosed cavity with the ventilated cavity (Barbosa et al., 2015). Natural ventilated based system achieved better performance than dual-glazing window systems due to evacuation of heat through cavity to outdoor environment (Wang et al., 2021b). Improvement in energy performance with natural ventilated Photovoltaic-DSF is not substantial in hot summer season mainly because of low convective rate between the envelope as well as with outdoor environment (Ioannidis et al., 2020; Radmard et al., 2020). Thus, the researchers adopted forced ventilation integrated DSF system to enhance convective heat transfer inside air cavity (Preet et al., 2020; Yang et al., 2020). In forced ventilated dual skin system, transparency of photovoltaic module, air cavity thickness and ventilation rate within cavity are key parameters that can greatly impact its achievement in energy savings and needs to be explored in the future (Jankovic et al., 2022; Preet et al., 2022; Yang et al., 2020). The present research work focussed on comprehensively analysing the impact of above three parameters on energy savings achieved with forced ventilated Photovoltaic-dual skin facade system in hot and dry summer.
Literature review
Semi-transparent photovoltaic windows for an office building were studied by Lu and Law (2013). Photovoltaic windows reduced the heat gain by 65 % when used in conjunction with semi-transparent windows. About 23% of the energy used to cool the room was saved by the semi-transparent photovoltaic glass. Increase in the transparency of the photovoltaic panel reduced the requirement of heating and artificial lighting, but increased the cooling load of area under analysis, as per the Miyazaki et al. (2005). An energy-efficient dual-glazing window was evaluated by Wang et al. (2017) using numerical simulations and experimental tests. The performance of DGU windows was compared separately with 100% transparent windows and less emit glass windows. Dual-glazed photovoltaic windows were found to save 25.3 % and 10.7 % of energy compared to 100% transparent windows and less emit glass windows. Chen et al. (2019) observed that solar PV based dual-glazed windows with 0.87 coverage ratio and 9 mm air gap between the panes were found to be an ideal combination of specifications for maximising energy savings in comparison to 100% transparent glass. Savings in energy in summer season were found to increase substantially with an increase in the photovoltaic coverage ratio (Wang et al., 2021b).
Photovoltaic-DSF systems that are naturally ventilated can save significant amounts of energy in summers because of the evacuation of heat through entire system. Natural ventilated Photovoltaic-DSF system was examined and compared to a typical glass façade by Han et al. (2013). Problem of overheating was reduced to suitable extent with ventilated DSF system. According to Peng et al. (2013), natural ventilation was concluded to be most efficient method for reducing heat gain in a Photovoltaic-DSF system. However, no ventilation mode provided thermal insulation to the building’s envelope that is necessary in cold climates. Peng et al. (2015) studied Photovoltaic-DSF system in different modes of operation, that is, non-ventilated, buoyancy ventilated and simply natural ventilated. Low SHGC found in natural ventilated system and low U-value was with non-ventilated system. To put it another way, photovoltaic double-glazing consumes about half as much energy as standard double-glazing. Photovoltaic double-glazing in Hong Kong was observed to be most efficient natural ventilation in terms of overall energy use (Wang et al., 2017).
As per the Inan and Basaran (2019) study, there were two ways to evaluate the energy efficiency of transparent glass-based DSF systems: buoyancy and mechanical/forced ventilation. Mechanical ventilation used less energy for cooling than buoyant ventilation. As a result of the forced ventilation mode, the cooling load of a transparent inner glass integrated DSF system reduced by 26%. The Nusselt number proposed by Ioannidis et al. (2020) measure convective heat transfer in the Photovoltaic-DSF system. Experimental tests were conducted to verify Nusselt number relationships and temperature differences of lower than 2°C between the Photovoltaic panel and the air were observed. The thermal behaviour of DSF system was also predicted using various numerical simulations (Radmard et al., 2020). The findings were on track with the theory. Yang et al. (2020) examined impact of forced ventilation on the Photovoltaic-DSF system’s overall energy consumption. It was found that forced ventilation results in a lower cooling load due to less SHGC value. However, natural ventilation Photovoltaic-DSF system was found to have higher energy savings than a forced ventilation system due to energy consumption components, that is, fans. Studies were done with varying air cavity thicknesses and air velocities and their thermal performance was analysed (Preet et al., 2020). The Photovoltaic-DSF system was found to operate much better with an optimum combination of the air velocity and air cavity thickness. Through numerical modelling heat and fluid momentum in the buoyancy ventilated DSF cavity was investigated (Pourshab et al., 2020). It was seen that building’s energy efficiency improved significantly with the installation of venetian blinds in the cavities. The buoyancy effect of horizontal Venetian blinds was more pronounced than that of vertical venetian blinds resulting from high convective flow in the cavity. According to Wang et al. (2020), a naturally ventilated DSF in the Yangtze River area was found to be energy efficient. Natural ventilated DSF with interior double glass outperformed natural ventilated DSF with external double glass and standard single clear glass in terms of thermal performance. Energy savings of 45.5 % were achieved using DSF with an internal double glazing over the commercially available DGU system. Srisamranrungruang and Hiyama (2020) used perforated sheet integrated dual skin façade to maximise energy savings with enhanced daylighting in built space. It was found that the perforated sheet with a 50% perforation ratio generated the maximum energy savings and 40% reduction in glare. Natural ventilation of the Photovoltaic-DSF system was modelled and evaluated using numerical simulations by Tao et al. (2021a). Optical qualities, glazing materials and shading devices were all studied using DSF. Venetian blinds had the greatest impact on DSF’s performance compared to its optical and glazing features. Tao et al. (2021b) evaluated performance of natural ventilated Photovoltaic-DSF system under varied solar conditions. The louver angle varied from 30° to 150° for two different types of glazing material. It was observed that the louver opening upward having a slat angle 30°–67.5° enhanced the buoyancy effect as compared to no louver case. However, the downwards louver with slat angle 112.5°–150° weakened the airflow by 6%–9%. Tao et al. (2021c) observed 13% increment in the stack effect by substituting the clear glazing with Low emitting glazing. Optimal cavity width for ventilated DSF system was found in the range of 150–300 mm. Sotelo-Salas et al. (2021) observed air cavity of 400 mm, 25 µm droplet size and 600 mm separation between the nozzles were found to be appropriate combinations. Sharma et al. (2021a) enhanced rate of heat removal through cavity by inserting a perforated metallic sheet inside it. It was observed that SHGC reduced by 14.7% as compared to conventional DSF system. Jankovic and Goia (2022a) performed fluid dynamic study on venetian blinds based DSF system. This system performed well in summer however, for winter conditions, a moderate ventilation rate was recommended. Zhang et al. (2022) developed the natural ventilated bio-productive DSF system and compared its overall performance in the winter season. It was observed that the bio-productive DSF system increased the overall UDI level and daylighting level and prevented the risk of glare. Wang et al. (2021b) developed the photocatalytic dual skin façade system (PDSF) based on the spectrum splitting utilization concept. Results revealed that net electricity consumption was reduced by 229 kWh/m2 with 7014 m3/m2 clean air. Jankovic and Goia (2022b) implemented the design of experiments (DOE) method for analysing parameters impact on its energy behaviour. Design parameters, that is, Solar irradiance, temperature difference, venetian blind angle and inlet/outlet cross-sectional area, is analysed against the responses net heat flux transfer, air cavity temperature, airflow rate inside the cavity, heat loss though system. It was observed that blind slat angle and solar irradiance exhibited maximum impact on the responses. Jankovic et al. (2022) justified with the experimental investigation that complete flow characterization, impact of solar geometry and glazing properties on the performance of DSF needed to be identified. Tao et al. (2022) identified that ventilation rates enhanced by 14.8 %, 15.3 % and 2.9 % with increment in louver size, height and aspect ratio, respectively. Lin et al. (2022) developed the natural ventilated DSF system with adjustable louvers to enhance its energy performance in China’s temperate continental climatic conditions. It was observed that louver-type DSF system, compared to conventional DSF system saved around 12% and 6% of energy. Tao et al. (2021d) found 200 mm cavity width and 300 mm height as an optimal geometric parameters that saved maximum energy.
Research gap and objective
Forced ventilated DSF system has become an important topic of research due to its potential to achieve substantial reduction in SHGC. Through parametric studies, different geometric design parameters and their impact is analysed. Yang et al. (2020) quantitatively analysed performance of DSF system. It was observed that photovoltaic panel’s transparency, air velocity and the thickness of the air cavity are all essential design characteristics that affect the energy performance. Jankovic and Goia (2022b) quantified airflow inside the cavity of DSF system. In further study, Jankovic and Goia (2022a) studied impact of solar radiation, Venetian blind angle and inlet/outlet cross-sectional area. Ioannidis et al. (2017) studied impact of air cavity in cold climatic of Canada. Yang et al. (2020) analysed the effect of roller blinds at various thicknesses of the air cavity.
The most of above studies were conducted in cold and moderate climates, which are significantly different from hot climatic zones (Preet et al., 2020). In hot climates, the photovoltaic module’s surface temperature rises with ambient temperature (Kumar et al., 2016) and solar radiation (Preet et al., 2023), reducing its power output. Moreover, heat gain to indoor area is exceptionally high, which enhances the energy required to maintain thermal comfort levels in the indoor area, all of which contribute to higher utility bills. Moreover, the literature research work on forced ventilated DSF system studied only on few design parameters. The energy behaviour of forced ventilated Photovoltaic-DSF system significantly depends upon the air cavity thickness, air velocity and photovoltaic panel’s transmittance. The effect of variation in transmittance of photovoltaic panel and the airflow rate in different cavity thicknesses in hot summer conditions is rarely discussed in the literature but are very significant. A lower transmittance results in a less heat gain in indoor area but adversely affects the daylight penetration and outside view and vice versa. Increase in air velocity enhances the convective heat loss; however, it also affects overall energy savings. Thus, there is a need to find optimised ratio of all three design parameters for hot summer from the perspective of thermal and visual comfort in the built system without significant loss of power consumed by fans for ventilation purposes inside the cavity.
In this study, a detailed parametric investigation has been done to analyse effect of three design parameters: air cavity thickness, air velocity and transparency of the Photovoltaic panel on forced-ventilated Photovoltaic-DSF system’s performance in hot summers. On behalf of experimental results, mathematical correlations are developed that used to estimate energy savings in hot summer. These correlations may be implied for designing the Photovoltaic-DSF system on a commercial scale.
Experimental setup
Semi-transparent Cadmium telluride (CdTe) PV module is employed as the external skin, while a 6 mm inner clear glass is separated by cavity thickness in this Photovoltaic-DSF module design. As depicted in Figure 1(a), the Photovoltaic-DSF system can be seen outside. The CdTe photovoltaic module of various transparency has been employed. Table 1 shows the CdTe photovoltaic module utilised in this study’s experiments.
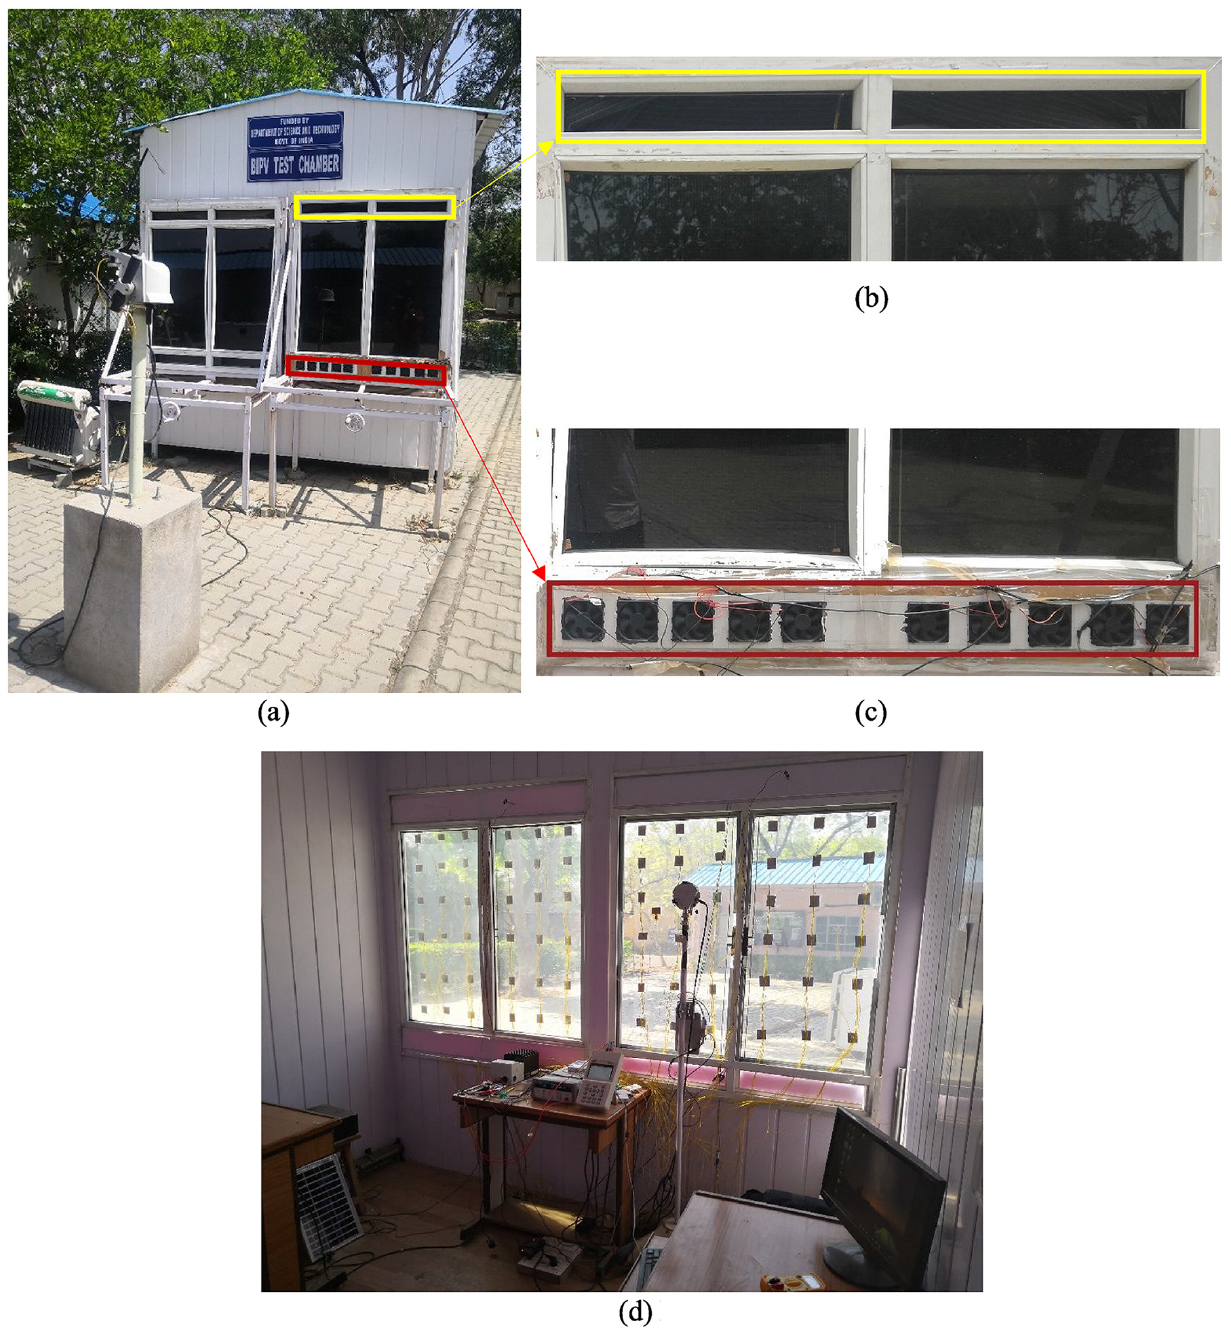
Pictorial view of experimental setup: (a) exterior view of PV-DSF system, (b) outlet opening of air cavity, (c) position of fans at inlet opening of air cavity and (d) interior view of PV-DSF system.
Properties of the CdTe PV module at STC (provided by the manufacturer).
Figure 1(b) and (c) demonstrate that the photovoltaic window frame has an inlet and an outlet for air flow at the top and bottom. Forced ventilation is provided by axial fans installed in the Photovoltaic-DSF system’s input aperture cavity. Figure 1(d) depicts the system’s interior from the perspective of Photovoltaic-DSF. The Photovoltaic-DSF system is of the size of 3 m × 3 m × 3 m. U-values (Insulation) of walls and roof system are 0.493 and 0.352 W/m2K are maintained as per ECBC guidelines for India’s composite climate (Saxena and Das, 2018). Present system is provided with movable air cavity, where the thickness of an air cavity can be changed. The photovoltaic module integrated window is kept on the rollers by which it can move in the groove with the screw system. The sides of adjustable cavity are made insulated using high thermal resistance material.
A series of experiments are performed throughout the summer season (May–July). Every 15 min from May through July, the values of each output variable or reaction are recorded. Each experiment has been conducted in triplicate and an average value of each response is considered for further analysis. Bansal and Minke (1988) has classified the climate of India into five different climatic zones, that is, Hot and Dry, Warm and Humid, Moderate, Cold and Composite. Kumar et al. (2016) and Tewari et al. (2019) have considered Jaipur under the composite climate zone of India in their research work. In the hot summer season of Jaipur’s composite climate, high solar radiation raises the ambient temperature to the range of 35°C–45°C in the daytime and relative humidity falls below 10% (Kumar et al., 2016). The incident solar radiation on a vertical plane and ambient temperature in summer on a typical day is presented in Figure 2. The Photovoltaic-DSF system maintains a temperature of 28°C in the constructed space. The mean comfort temperature ranges between 25°C ± 1 and 30°C ± 1 in summer for built area located in India’s composite climate (Kumar et al., 2018).
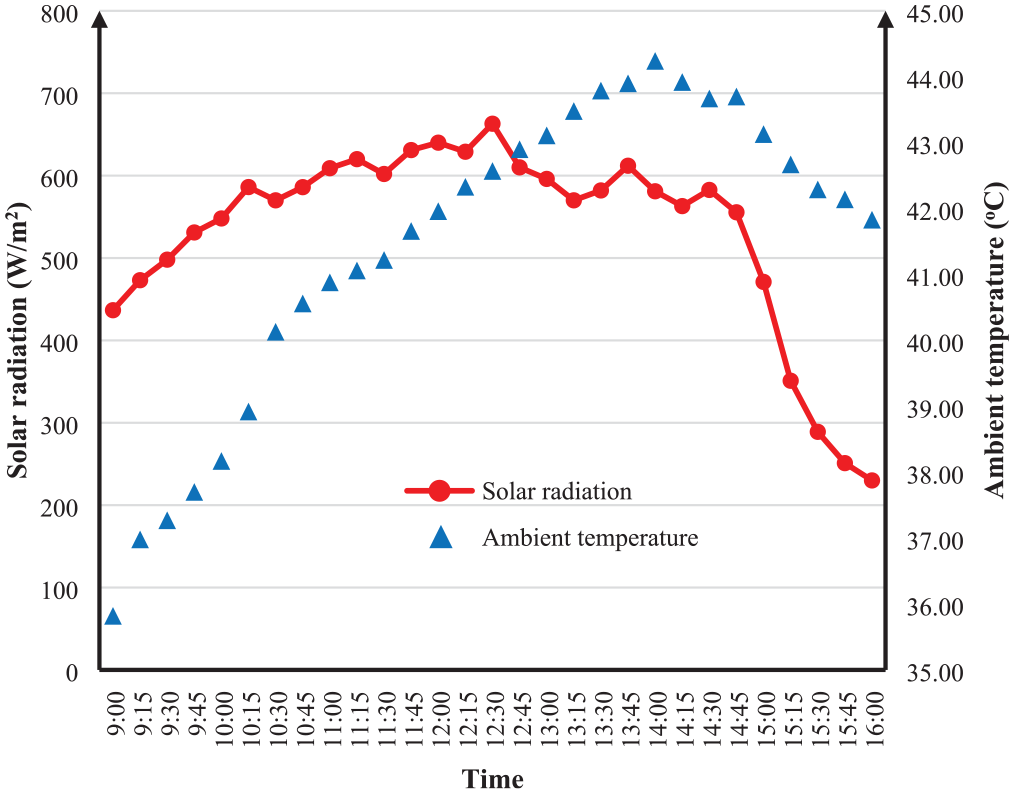
Solar radiation incident on vertical plane and ambient temperature on a typical day in summer.
Instrumentation details
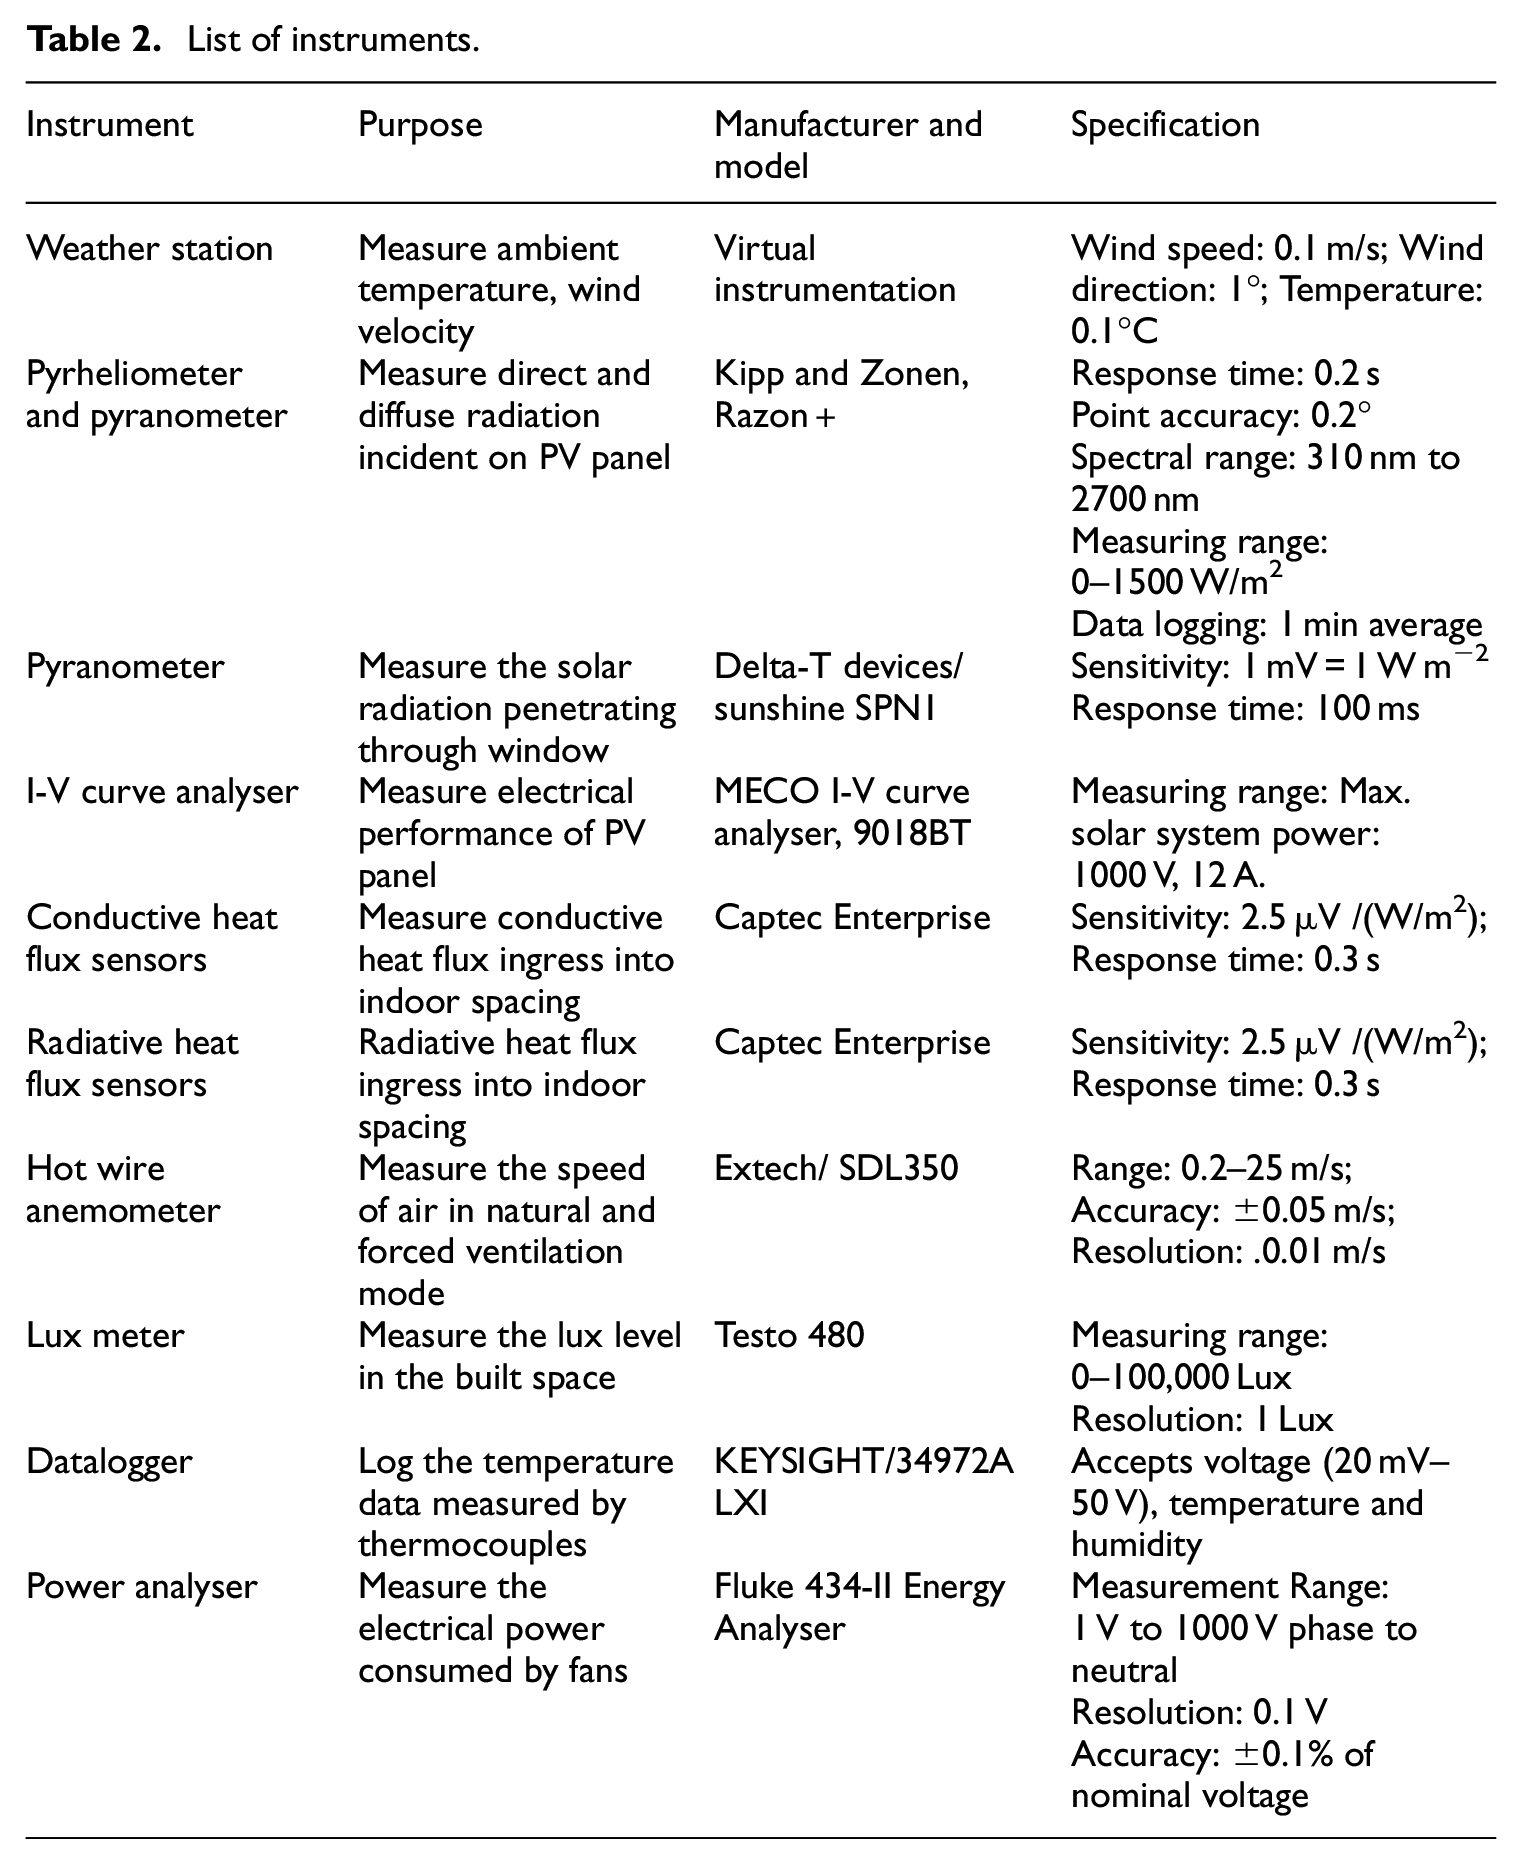
The experimental site has a weather station (Virtual instruments) placed to monitor the weather conditions. Pyrheliometer Razon+ is used to monitor direct and diffuse sun energy throughout the day. Another Pyranometer measures radiation enters to main built space through DSF system. Convective and radiative heat flux is used to measure net heat flux through DSF system (Preet et al., 2020; NFRC 201-2014, 2014). L-19 data logger store the data of net heat flux. For the electrical power of PV panel, the I–V curve device manufactured by MECO instruments is used. The daylight illuminance in indoor space is measured by the lux meter of Testo 480 placed inside the indoor area at 1 m away from the PV-DSF window and at 0.8 m above from floor surface (Bureau of energy efficiency, 2017; Sharma et al., 2021a, 2021b). The corresponding schematic diagram is illustrated in Figure 3. Specifications of used instruments are listed in Table 2.
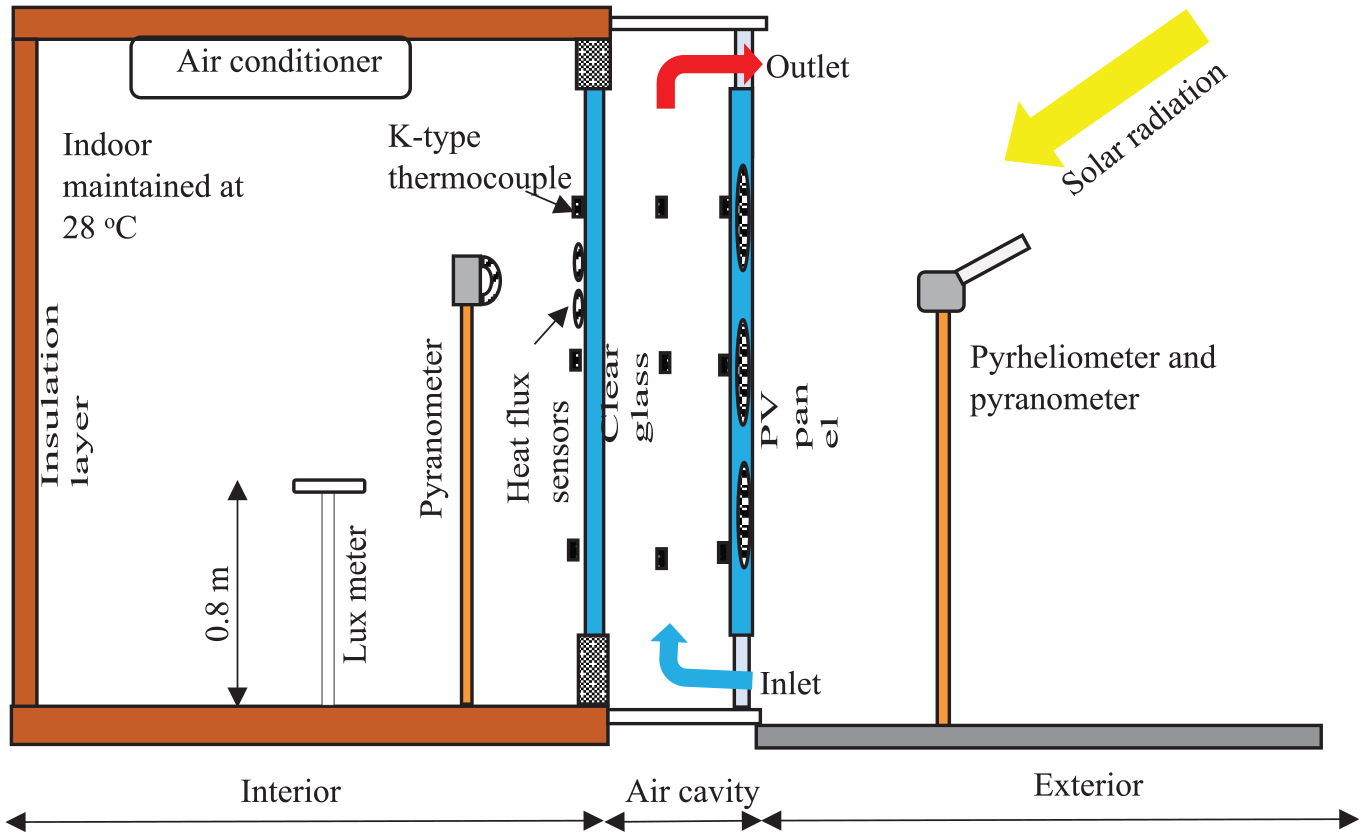
Schematic diagram of PV-DSF system with location of sensors and instruments.
List of instruments.
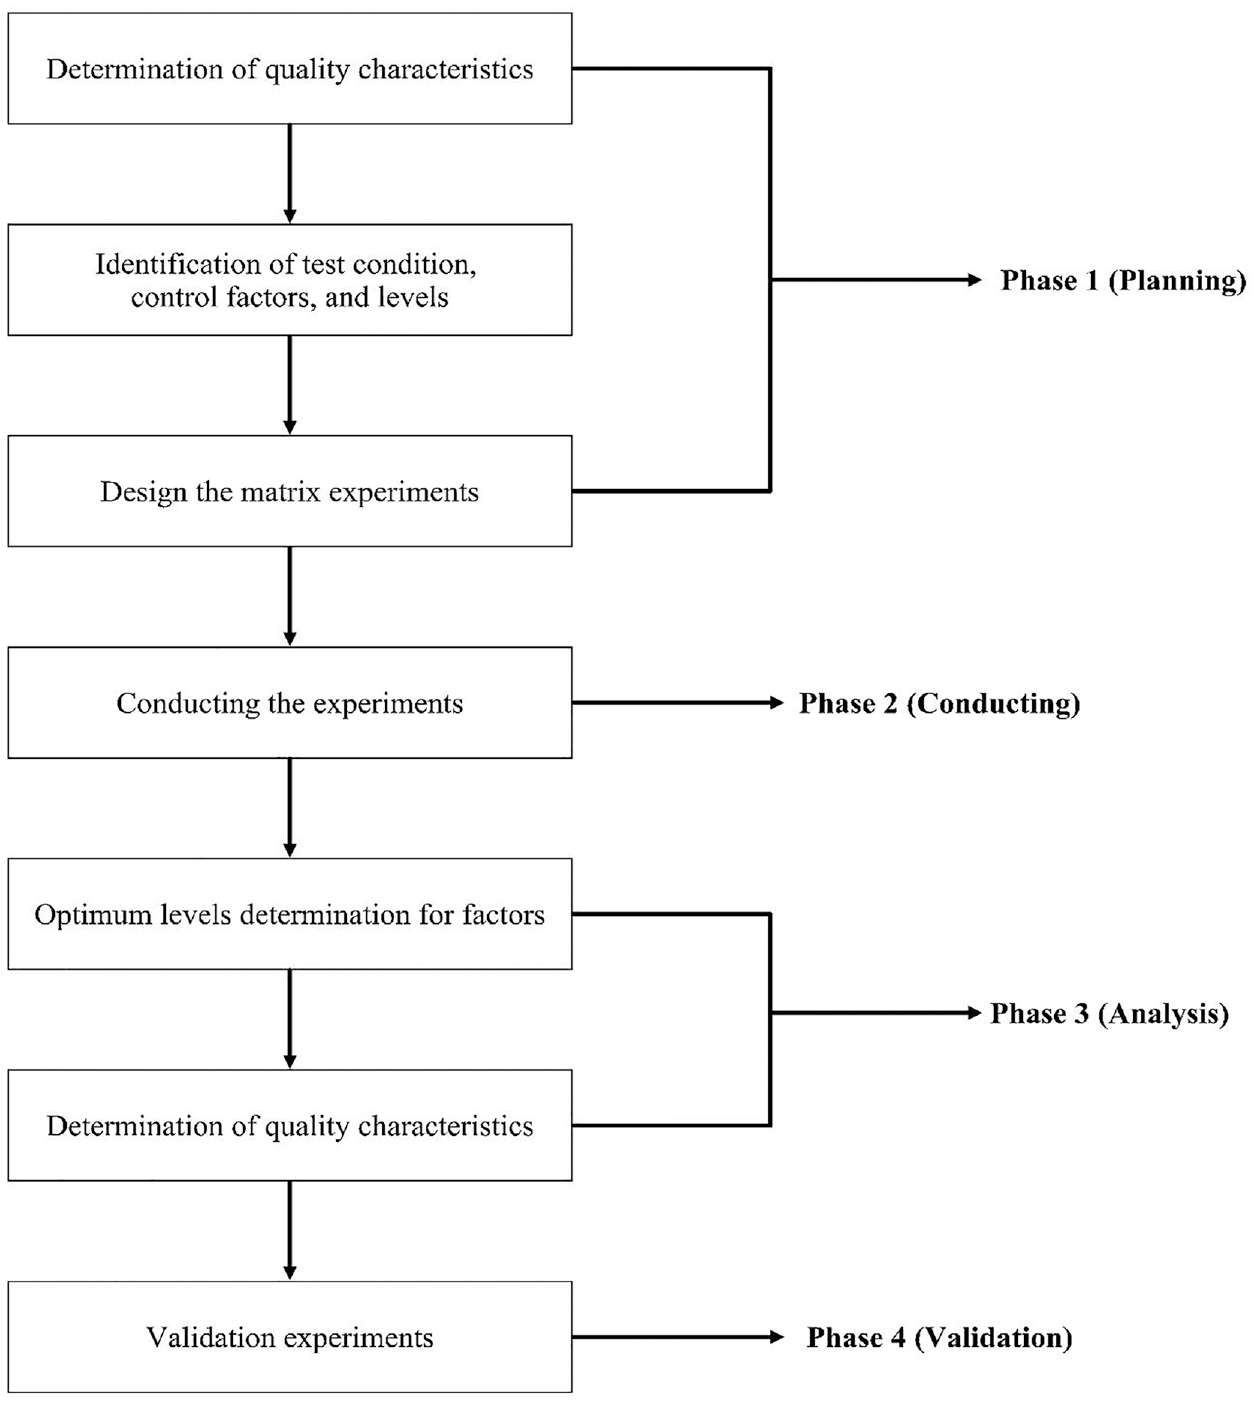
Methodology
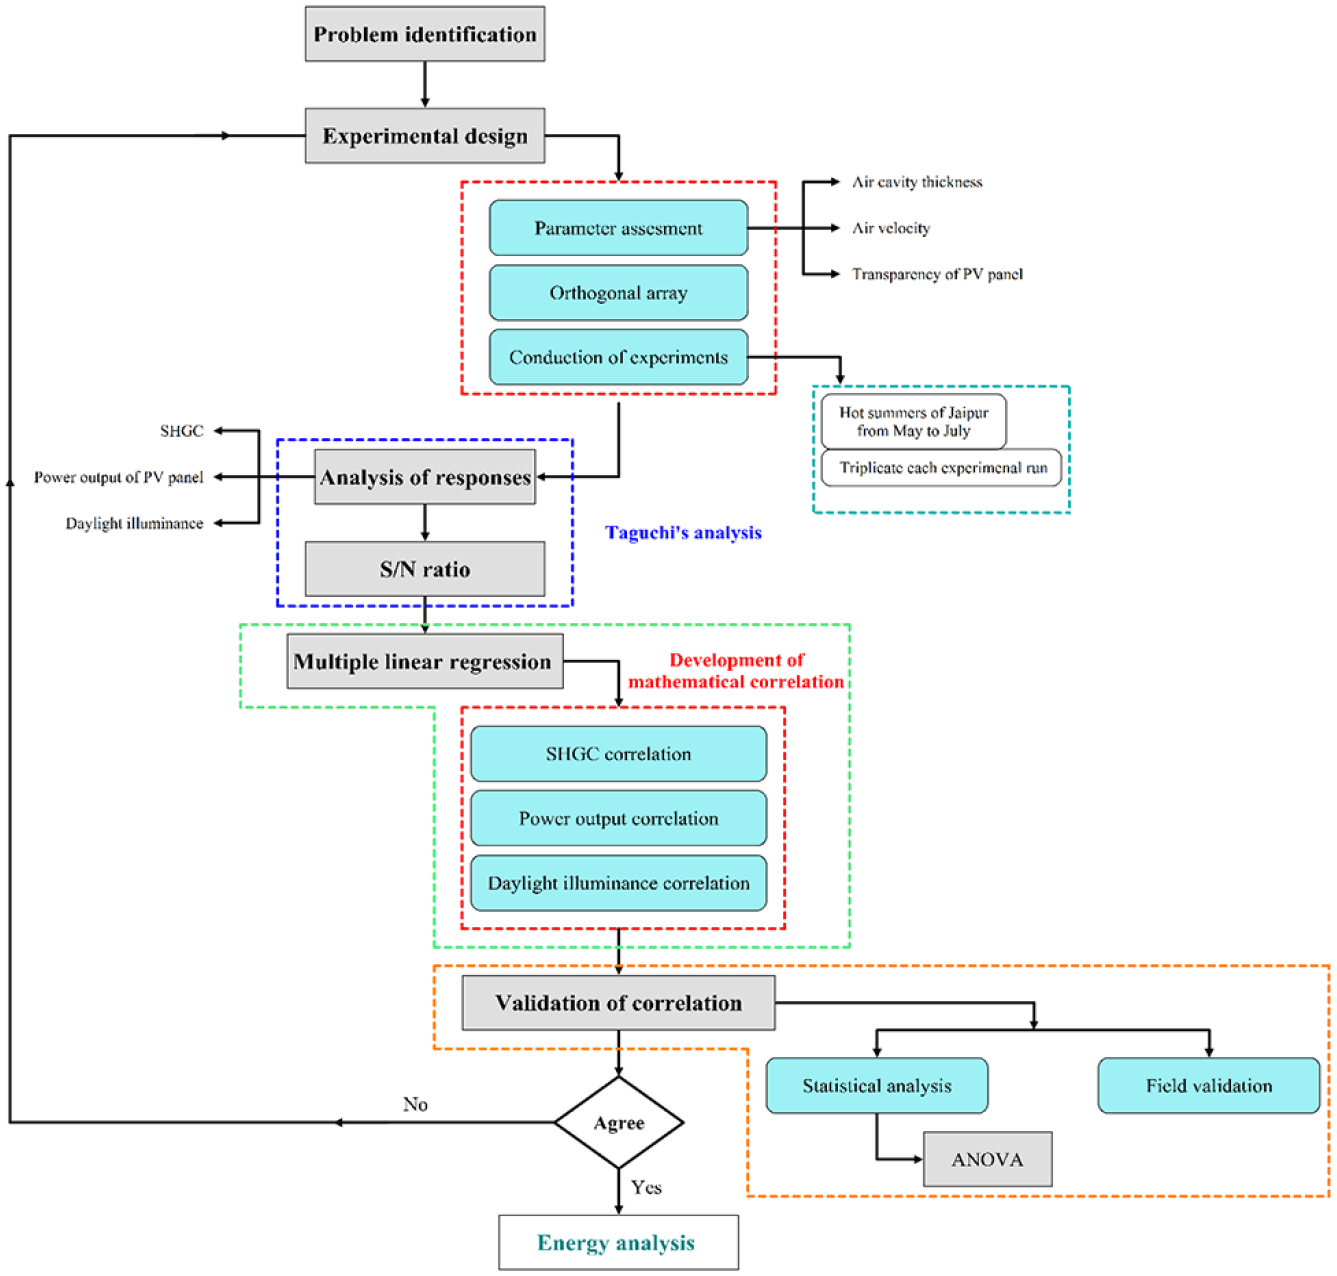
This study develops a mathematical correlations to analyse variation in range of design parameters on SHGC, photovoltaic panel’s power output and daylight illuminance in built space of a forced-ventilated Photovoltaic-DSF system. These mathematical correlations are very helpful to design energy-efficient building envelope in composite climate zone. Figure 4 presents the methodology adopted to develop mathematical correlations in the present research work.
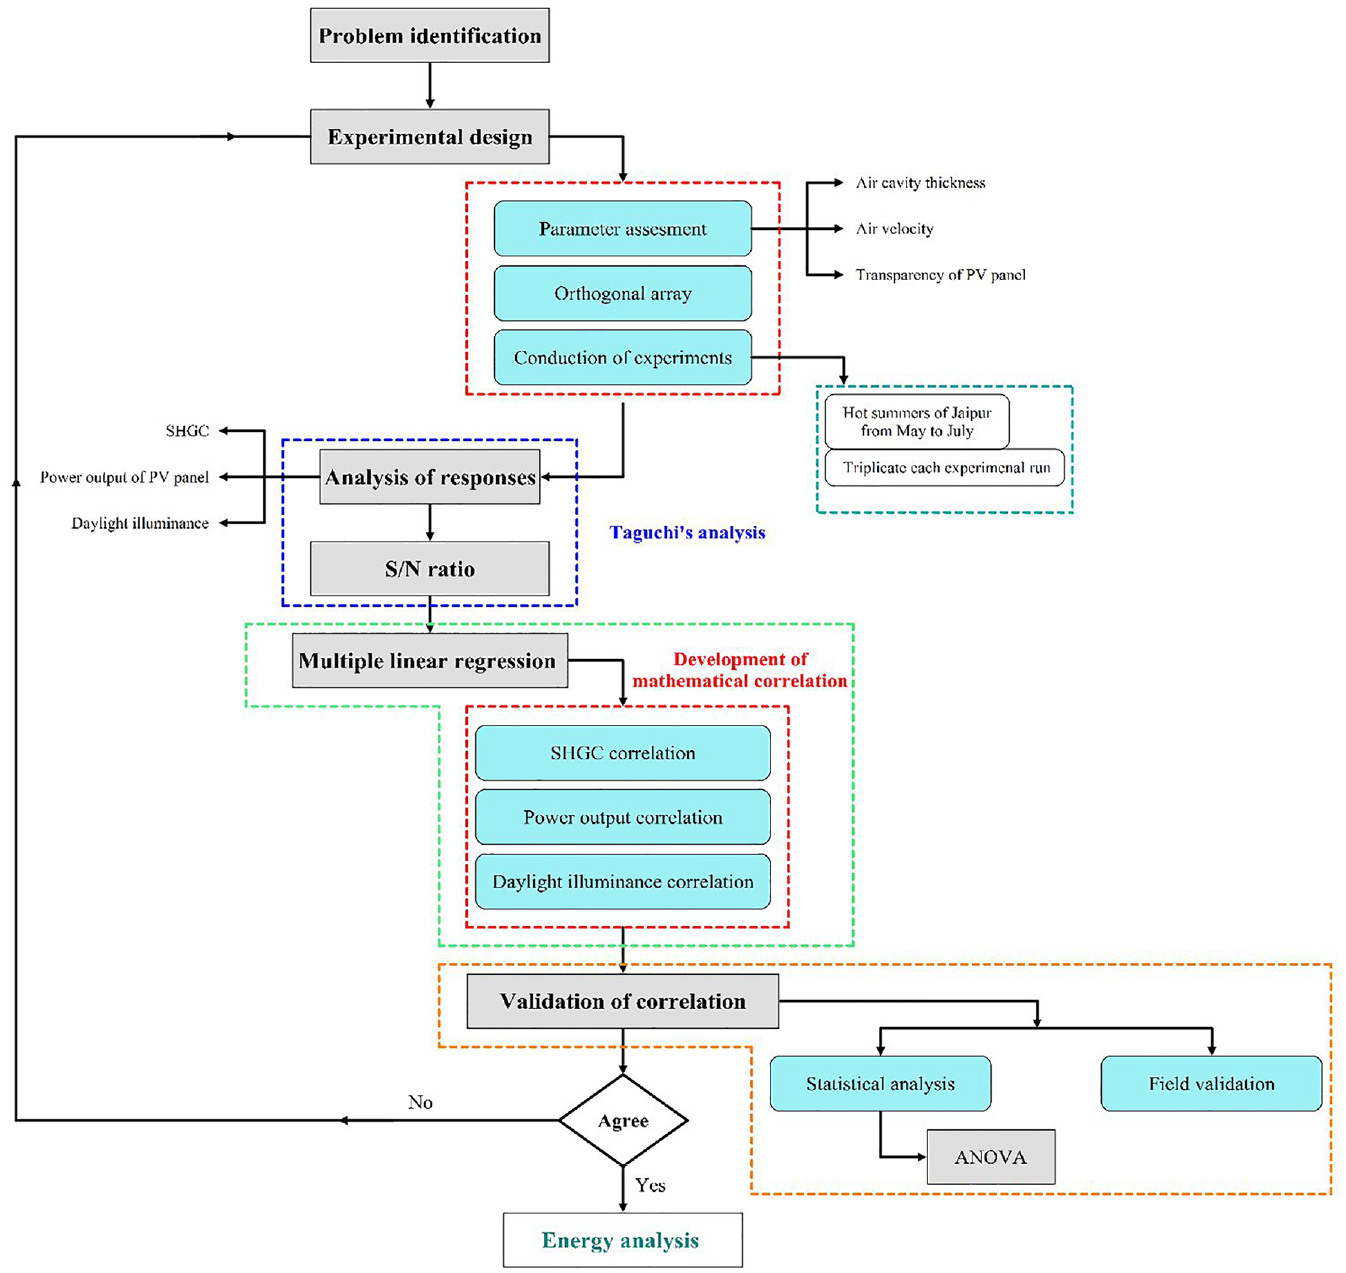
Methodology flow chart for the present study.
Problem formulation
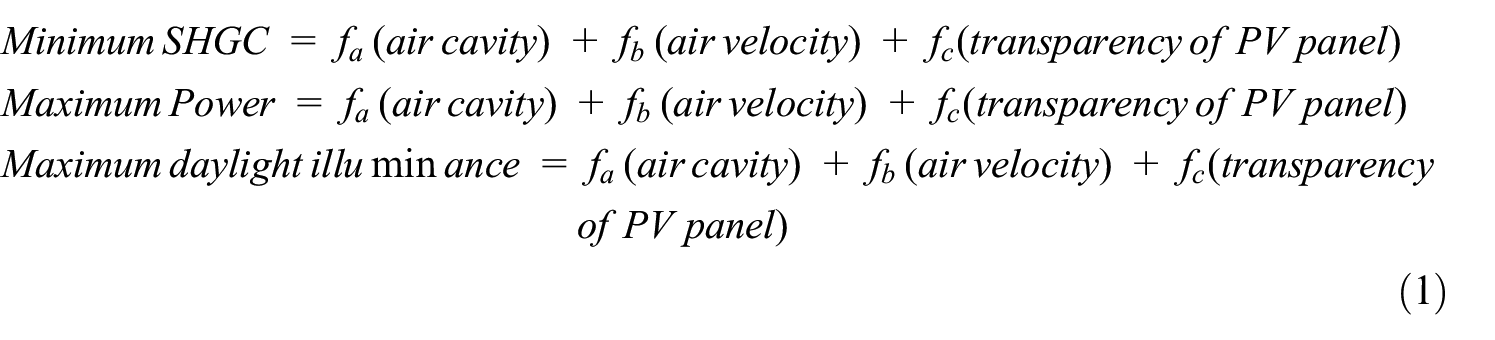
The Photovoltaic-DSF’s energy performance primarily depends upon the air-conditioning system’s energy consumption for cooling, lamps for lighting and energy generation by photovoltaic panel. Least SHGC of windows with a high-power output of the photovoltaic module and adequate daylight illuminance in the built space is required to achieve the maximum energy savings in summer. The aim of the current research is to optimize the design parameters of a Double-Skin Facade (DSF) integrated building to achieve a minimum Solar Heat Gain Coefficient (SHGC), maximum daylight illuminance inside the built space and the highest electrical output from the photovoltaic panel, as illustrated in equation (1).
In the present investigation, SHGC is calculated by a method recommended by National Fenestration Rating Council (NFRC; NFRC 201-2014, 2014), Preet et al. (2020), Peng et al. (2015) and Sharma et al. (2021a).
An experimental method to calculate the solar heat gain coefficient as follows:
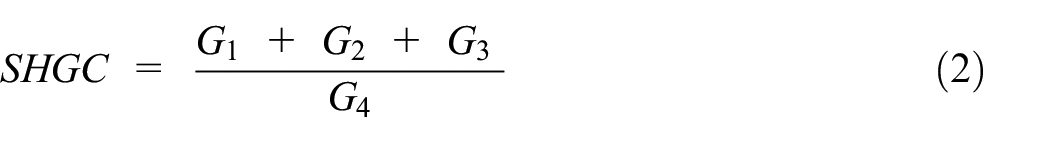
G 1 and G2 are convective and radiative heat flux penetrate occupant’s area through window, respectively, G3 is solar radiation enters into occupant’s area and G4 is incident solar radiation incident on entire system. Solar radiation on vertical envelope is calculated through mathematical relations provided by Sukhatme (1996).
The ambient temperature mainly affects coefficient of performance (COP) of the cooling system, that is, air conditioner (AC; Wu et al., 2012; Zarei et al., 2020). The energy consumed by the AC system is calculated by cooling demand

where COP of the selected AC system is in range of 2.9 and 3.2. The average lux level in the building’s workplaces should be more than 300 lux (Saxena and Das, 2018). When daylight is not enough to provide the required 300 lux in the workplace, dimmable LED lamps are provided to reach the workplace’s required illuminance. The energy consumed by the LED lamps for artificial lighting is calculated by:
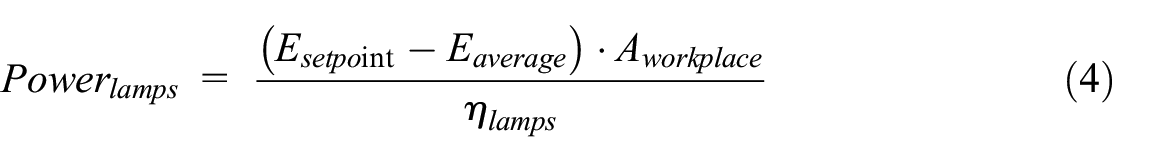
The artificial lighting in the built space is provided by lamps having 100 lm/W as luminous efficacy. The solar system analyser manufactured by MECO instruments measures the electricity generated by the photovoltaic panel. Another power analyser manufactured by Fluke Corporation is installed to quantity the energy consumption by the fans for ventilation in the air cavity.
Taguchi design method
Researchers have used various methods to solve problems of experimental design with multiple parameters, such as response surface method (Ravuri et al., 2021), artificial neural network (ANN; Gul et al., 2020) and Taguchi method (Roy, 2010). The response surface method is a sequential procedure method, a combination of mathematical and statistical techniques, to suitably optimize the specific system’s design parameters (Ravuri et al., 2021). It is applied to perform reliability analysis. ANN is the machine learning method from the class of black box models, enabling the development of a relationship between input and output variables. This method can deal with complicated non-linear functions and noisy and incomplete data. It has less computational time and updates the model with new data (Gul et al., 2020). Taguchi’s method is a simple, reliable, efficient and systematic technique for optimizing processes/products that attain the best quality with the least cost (Roy, 1990). Taguchi’s method is beneficial among the other methods because it facilitates to examine multiple parameters with least experimental trials. Thus, the time and cost of performing the experiments are significantly reduced. In the Taguchi method, input variables are consistently shifted to study their impact on the process’s output parameter (Sasmito et al., 2017).
The Taguchi method is one of the best methods for designing experiments to evaluate the impact of independent variables with a limited number of trials (Roy, 1990). It is the combined technique of statistical and mathematical method to optimize the design parameters which have maximum influence on the overall performance. With this, there will be the improvement in the quality of system with minimum variability (Kumar et al., 2017). In this method, design parameters, which have a direct impact on the specific response, are identified to find the optimal combination (Türkmen et al., 2008; Vyas et al., 2019). Figure 5 represents the flowchart of Taguchi’s method adopt for optimization process. Taguchi method is based on Orthogonal Array (OA) that provides efficient with schematic characteristics of any particular objective response with constrained conditions of design parameters (Tewari et al., 2019; Varun et al., 2009). The Orthogonal array is the fractional factorial characteristics design wherein possible combinations of all the parameters at different levels occur equally (Roy, 1990). In the present work, there are three design parameters with five-level variants. The experiment requires 53 = 125 repetitions with each time change in input. Taguchi reduced the number of runs to 25 based on the degree-of-freedom approach (Roy, 1990) as given below:
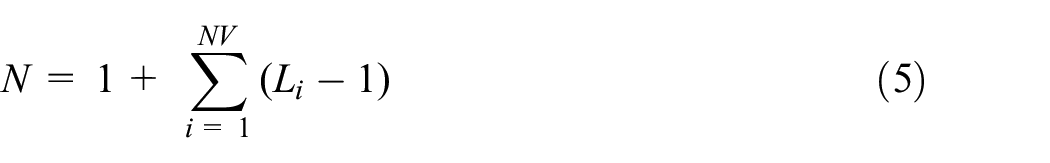
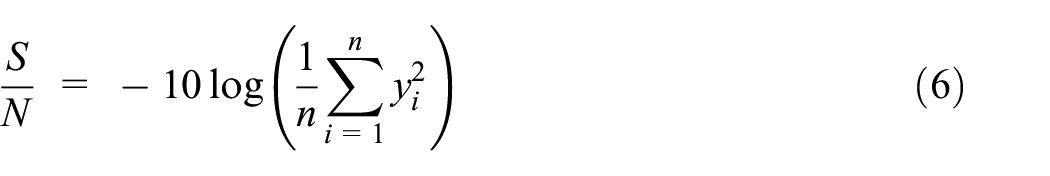
Where N = total number of runs, NV = number of independent parameters, L = levels of parameter. L25 orthogonal array (OA) is adopted for the experiment design using Minitab (version 15; Sharma et al., 2021b). Number of levels are selected on basis of effect of different design parameters on the responses. The linear relation between responses and design parameters requires the two-level setting. If the design parameters are non-linearly related to responses, then three, four or higher-level settings can be selected (Dehnad, 2012). The experiment runs are performed as per the experiments specified by the L25 OA design. Output values of SHGC, photovoltaic panel power and illuminance in built space are obtained by conducting the experiments as per the Taguchi design. The significance of each design parameter on the responses is observed through the S/N ratio analysis. S/N ratio analysis is used to optimise the value of design parameters that influence system performance (Sharma et al., 2021b). In the S/N ratio, the desirable output is represented by signal and noise represents the undesirable output of responses. The S/N ratio is required to measure quality results that deviate from desired results (Kumar et al., 2017). Three different S/N ratios are in Taguchi design, that is, smaller is better, nominal is better and larger is better (Sinha and Mathur, 2016). In present research, smaller-the-better characteristic is considered for SHGC to meet the requirement of minimum SHGC and larger-the-better for Power and illuminance for their maximum values. Signal-to-noise ratio (S/N) for smaller-the-better is calculated by;
Flowchart representing the Taguchi method.
Signal-to-noise ratio (S/N) for larger-the-better is calculated by;
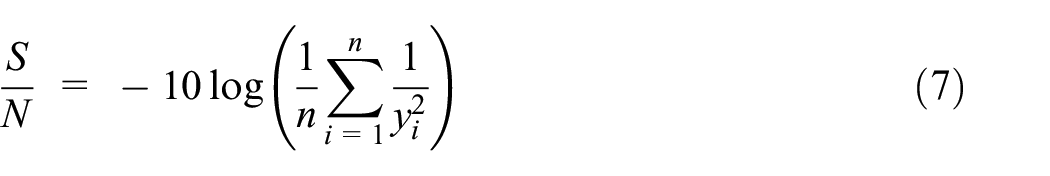
Smaller-the-better (minimize) and Larger-the-better (maximize): where n is several tests in an experimental trial and yi is the response or output variable of the ith test experiment. The multiple linear regression model is adopted to develop the mathematical correlation among the design parameters for individual responses (Yi et al., 2015). The significance of mathematical correlations was validated through the analysis of variance (ANOVA) analysis. ANOVA is simply statistical based model that segregates total variation in data into separated segments to test hypotheses on various parameters of the model (Mamourian et al., 2016).
Selection of range of parameters
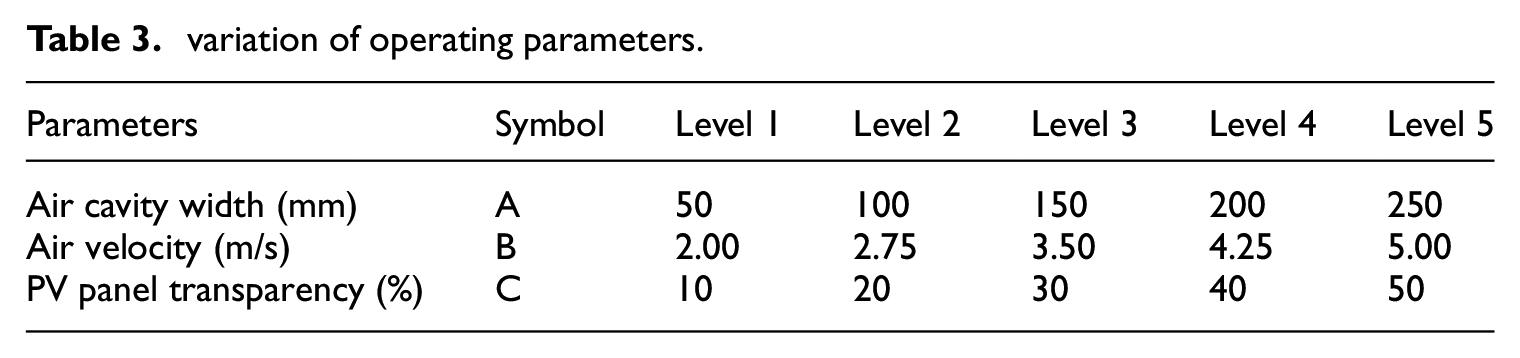
To propose mathematical correlations, first step is to define the range of the design parameters which could be suitable for estimation of SHGC, the power output of photovoltaic panel and natural daylighting in built space. These responses vary as a function of design parameters, that is, the photovoltaic panel’s transparency, air cavity and the air velocity.
Thickness of cavity wide-ranged from 50 to 250 mm. Analytical modelling shows that a cavity thickness of less than 40 mm may induce an overlap of both pane’s boundary layer, which may hinder air circulation inside the cavity, resulting in heat accumulation (Mathur et al., 2006). The minimal air cavity size is 50 mm, based on these requirements. There was a wide range of air cavity thickness variation in the early investigation. The heat gain decrease in the built area was found to be significant from 50 to 200 mm as discussed in a prior study (Preet et al., 2020). After that cavity thickness, the heat gain reduction was restricted. This means that the maximum thickness of the cavity is limited to 250 mm.
Velocity within cavity varied from 2 to 30 m/s in preliminary testing on Photovoltaic-DSF system. Since power requirements for fans cannot go beyond the electricity supplied by the PVs and noise levels in occupant areas must be below 55 dB (Bhatnagar et al., 2019), range of air velocity is studied to 5 m/s inside the cavity. Photovoltaic panel’s transparency ranges from 10% to 50%, which has been taken into account. High power generation is provided by the 10% transparent photovoltaic panel, while high lux levels are provided by the 50% transparent photovoltaic panel (Miyazaki et al., 2005). Table 3 shows the range of values for the design parameters.
variation of operating parameters.
Results
Main effect plot
In the main effect plot, the level of each parameter is connected by a line. When the line is horizontal, it shows no effect of variation in the design parameter’s level on responses. However, the line’s inclination shows an impact of variation in the design parameter on the responses. In this work, the main effect plot is developed to investigate the effect of variation in design parameters and their respective levels on the popular indices of Photovoltaic-DSF system: SHGC, a power output of the photovoltaic panel and daylight illuminance in built space.
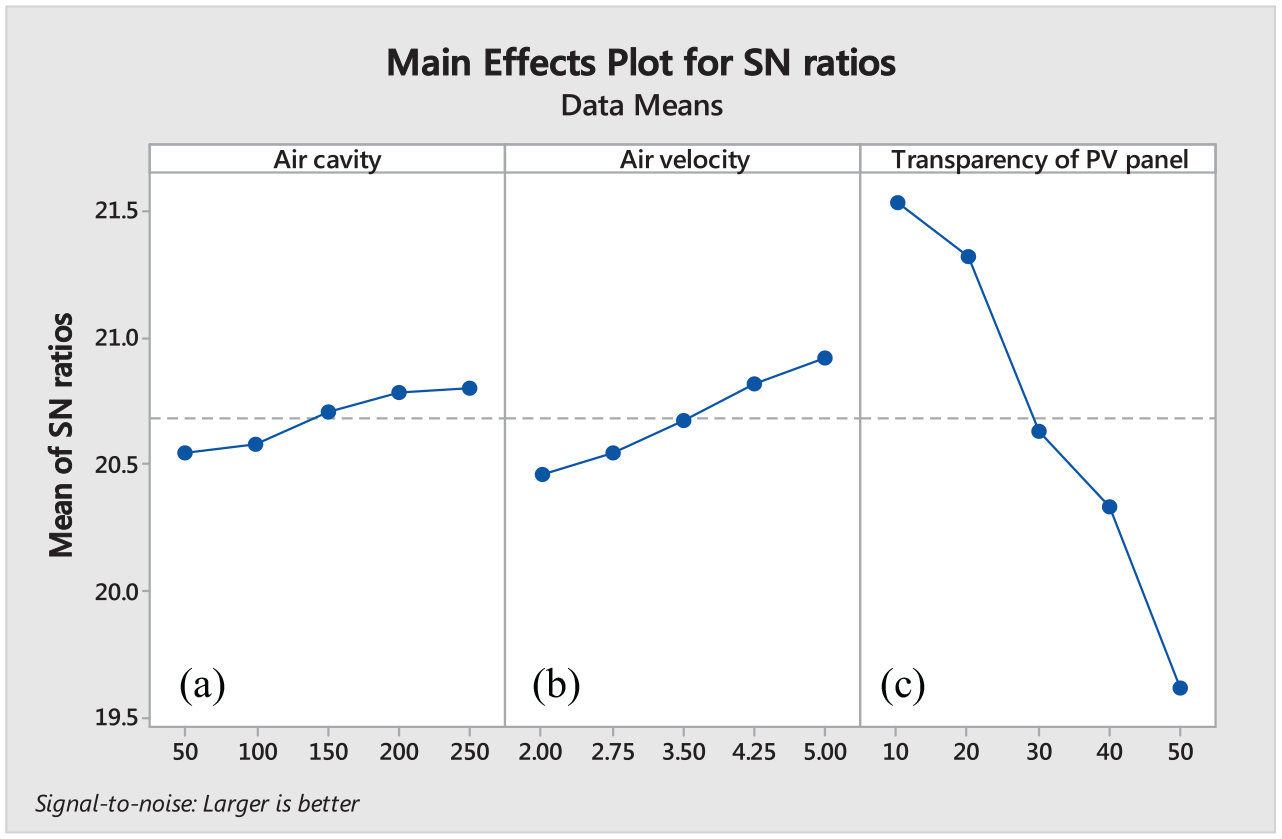
Main effect plot of solar heat gain coefficient (SHGC)
Figure 6(a) shows the main effect plot of SHGC at different levels of air cavity thickness. It can be observed that from air cavity 50 to 250 mm, the SHGC decreased (S/N ratio increased). A substantial reduction has been observed in SHGC from 50 to 200 mm air cavity thickness and subsequently, reduction is limited. It could be attributed to the accumulation of a large air mass within the spacious air cavity. This leads to an increase in the size of the boundary layer, causing the rate of heat transfer between the pane surface and the moving air inside cavity to decrease. Consequently, this results in a lower rate of heat evacuation through the cavity. Additionally, the absence of turbulence in the large air mass within the spacious cavity contributes to insufficient temperature gradients, leading to a decreased rate of convective heat transfer. This, in turn, reduces the overall rate of heat evacuation through the cavity. Similar observation has been reported by Peng et al. (2016).
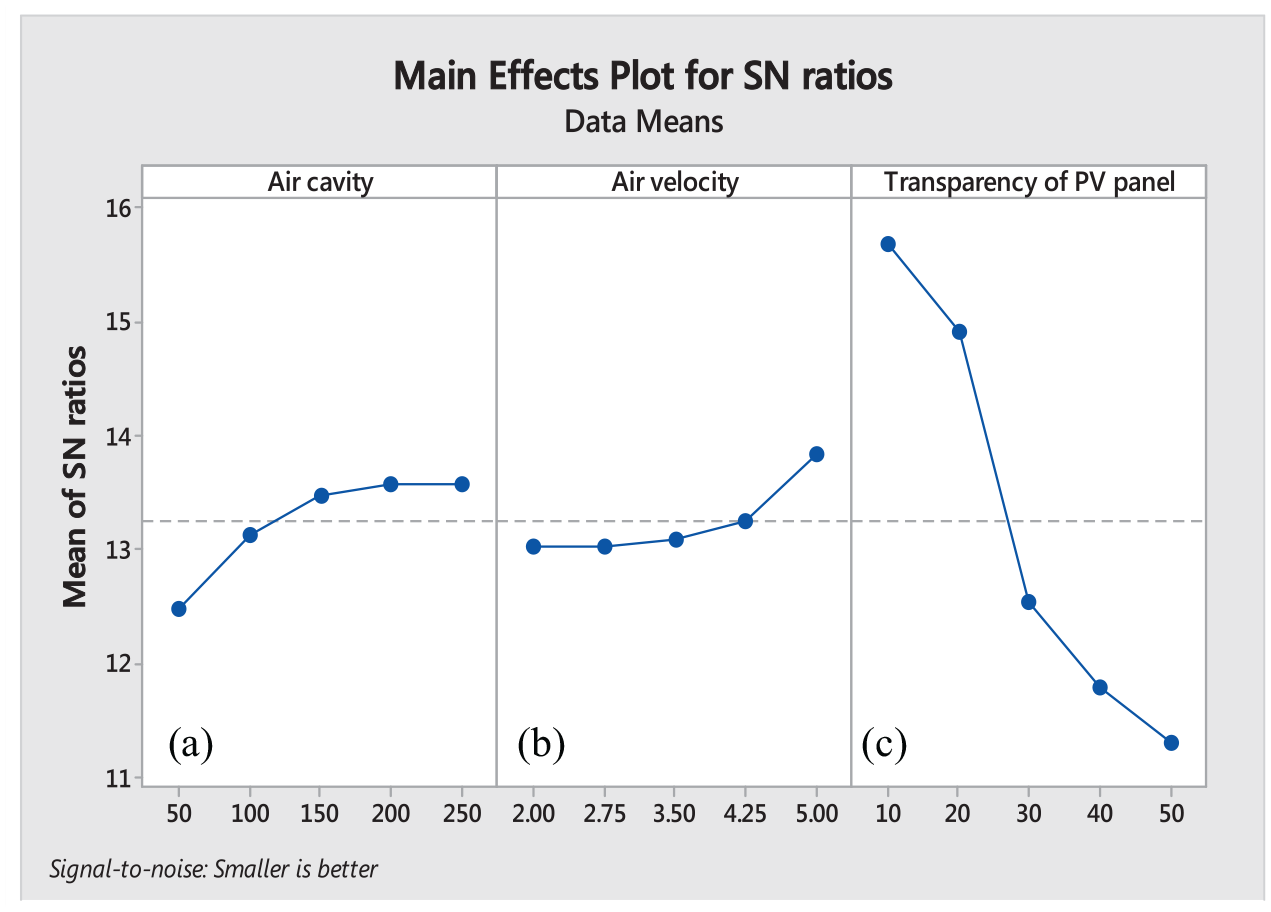
Impact of air cavity (a), air velocity (b) and transparency of PV panel (c) on SHGC.
Figure 6(b) shows that SHGC is reduced with increased air velocity in the cavity (S/N ratio increased). It is mainly because of the rise in heat loss rate through convection from the panes to air inside the cavity with air velocity. Low operating temperature of inner panelled to less net heat flux transfer to occupant’s area. Similar findings observed by Mateus et al. (2014), Ioannidis et al. (2017) and Yang et al. (2020).
Impact of different levels of the transparency of the Photovoltaic panel on the SHGC is presented in Figure 6(c). It is found that the SHGC has increased significantly (S/N ratio decreased) with an increase in transparency of the photovoltaic panel. It is due to a decrease in the photovoltaic cell area on the photovoltaic panel. Miyazaki et al. (2005) reported similar results.
Main effect plot of the electrical output of PHOTOVOLTAIC panel
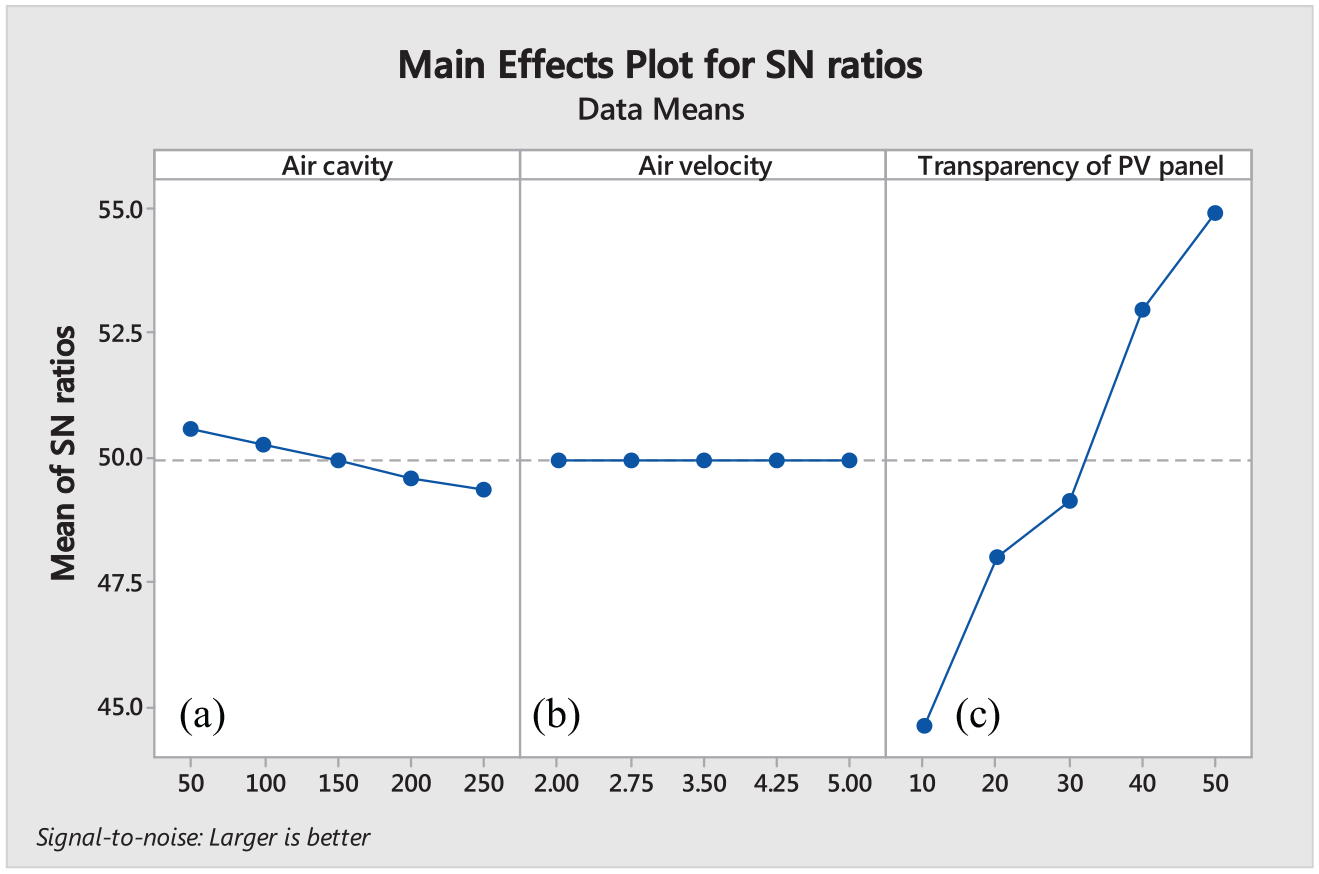
The impact of the air cavity thickness on photovoltaic panel’s electrical output, as shown in Figure 7(a). An improvement has been observed in the electrical output of the photovoltaic panel by increasing air cavity (S/N ratio increased). It is because of the enhancement in heat loss through convection from photovoltaic panel with air cavity that lowers its operating temperature. Photovoltaic panel’s power output improved from 50 to 200 mm and afterward, it is limited.
Impact of air cavity (a), air velocity (b) and transparency of PV panel (c) on power of PV panel.
Effect of variation in air velocity on photovoltaic panel’s electrical power output is presented in Figure 7(b). The heat loss rate from the photovoltaic panel is enhanced with increased air velocity. It resulted in an enhancement in power output of photovoltaic panel (S/N ratio increased) with a rise in air velocity.
Figure 7(c) presents the main effect on photovoltaic panel’s power output at different levels of transparency of the photovoltaic panel. It can be inferred that the power output of photovoltaic panel is significantly reduced with an increase in photovoltaic panel transparency. It is mainly due to a reduction in photovoltaic cover ratio on the photovoltaic panel. Miyazaki et al. (2005) reported similar results.
Main effect plot of daylight illuminance in built space
Figure 8(a) demonstrates the main effect plot of daylight illuminance in the built space at different air cavity thicknesses. It can be observed that daylight illuminance is reduced continuously (S/N ratio decreased) with an increase in air cavity thickness. It is because of an increase in daylighting reference points between outside and inside. Same observations are reported by Peng et al. (2016) and Ioannidis et al. (2017). An increase in air velocity has no impact on the illuminance in built space. Therefore, the S/N ratio remained constant, as discussed in figure 8 (b).
Impact of air cavity (a), air velocity (b) and transparency of PV panel (c) on daylight illuminance.
Daylight illuminance in the built space is significantly increased with the transparency of the photovoltaic panel (S/N ratio increased), as presented in Figure 8(c). It is because of an increase in clear surface area in the photovoltaic panel with an increase in transparency of photovoltaic panel. Miyazaki et al. (2005) reported similar results.
Mathematical correlations
The regression analysis method is used to develop the mathematical correlations for SHGC, a power output of photovoltaic panel and daylight illuminance in built space. The design parameters are regressed against SHGC, a power output of the photovoltaic panel and daylight illuminance obtained through experimental runs as per the Taguchi design conducted in the hot composite climate zone shown in Table 4. The mathematical correlations are developed based on the experimental value of responses. This multiple linear regression analysis expresses the responses in terms of mathematical expression as follows:
Responses in L25 Taguchi design.
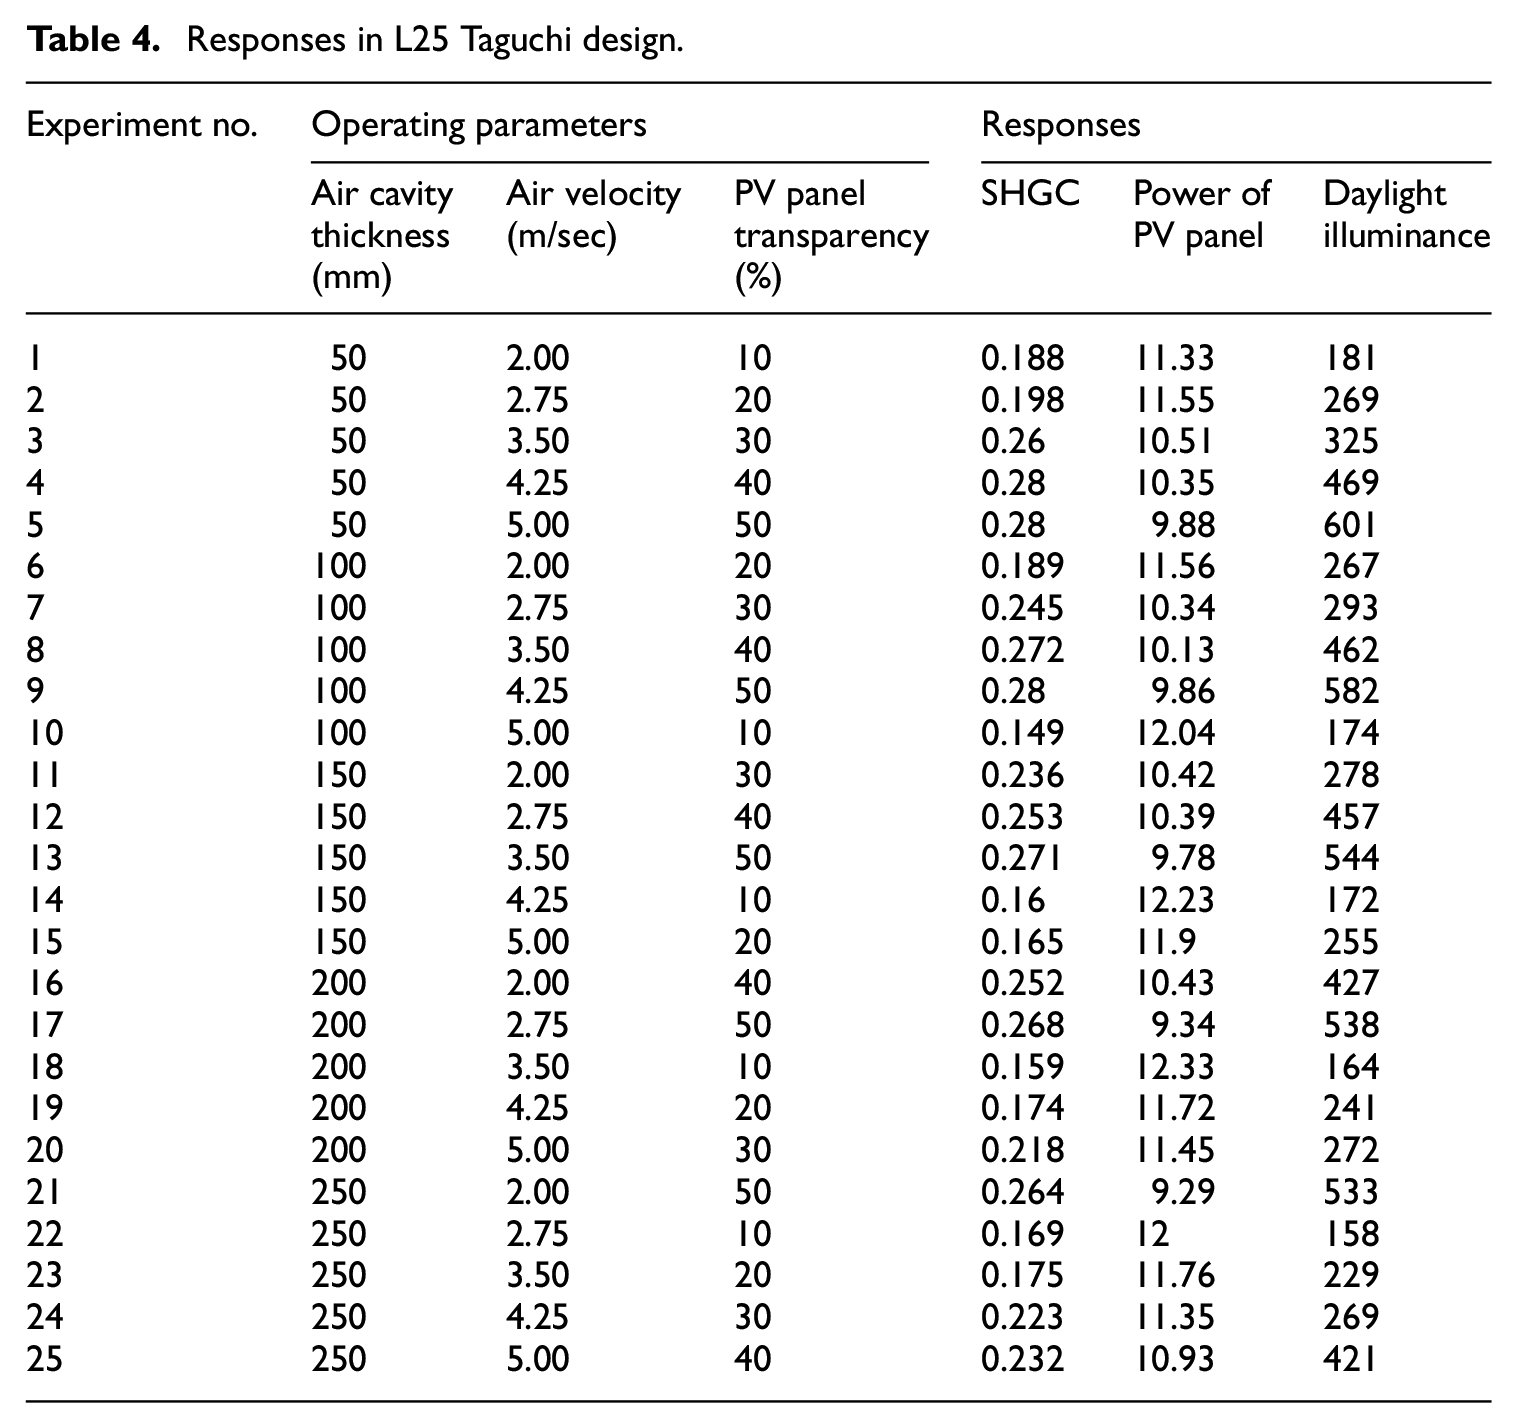
It can be observed from the above equations that when the effect of the design parameter is positive and its value varies from low to high, the SHGC and daylight illuminance increase. In contrast, the power of the photovoltaic panel decreases. On the contrary, when the design parameter’s effect is negative and its value varies from low to high, the SHGC and illuminance decrease, whereas the photovoltaic panel’s power increases. Equation (8) indicates that air velocity and air cavity thickness show a negative effect on SHGC. In contrast, the transparency of the photovoltaic panel shows a positive impact on SHGC. Besides, it can be observed in equation (9) that air velocity and air cavity show a positive effect and transparency of the photovoltaic panel shows a negative impact on photovoltaic panel’s power output. Equation (10) indicates that the air cavity has a negative effect and transparency of the photovoltaic panel positively impacts the daylight illuminance in the built space. As discussed above, air velocity does not influence daylight illuminance in the built space. Researchers such as Vyas et al. (2019), Tewari et al. (2019), Kumar et al. (2017) and Sharma et al. (2021b) have used similar multiple linear regression techniques (MLR) to develop the mathematical correlations based on experimental observations.
Validations of mathematical correlations
In this section, the validation of mathematical correlations of responses is performed through the ANOVA method. The robustness of the mathematical correlations has been validated with the experimental investigation.
Statistical validation
For determining the statistical significance of the design parameter on the responses, ANOVA should be performed on output obtained for the responses. ANOVA also estimates the influence of each design parameter on the response, which can help find the robustness of the product (Faraway, 2002). The frequency test (F-test) signifies the effect of different design parameters on the responses. For every F-value, the p-value has been given, which defines the significance of a particular design parameter on response. This analysis has been undertaken for significance level of 5%, that is, for a confidence level of 95% (Sinha and Mathur, 2016). Usually, a value of p < 0.05 signifies considerable contribution of specified parameter, while higher value signifies specified parameter has least contribution (Kumar et al., 2017). Table 5 shows the statistical significance of the design parameters on the SHGC, power of photovoltaic panel and daylight illuminance correlations. It indicates that all three design parameters influence the SHGC and photovoltaic panels’ power since they have a p-value under 0.05.
p-value of different design parameters on responses.
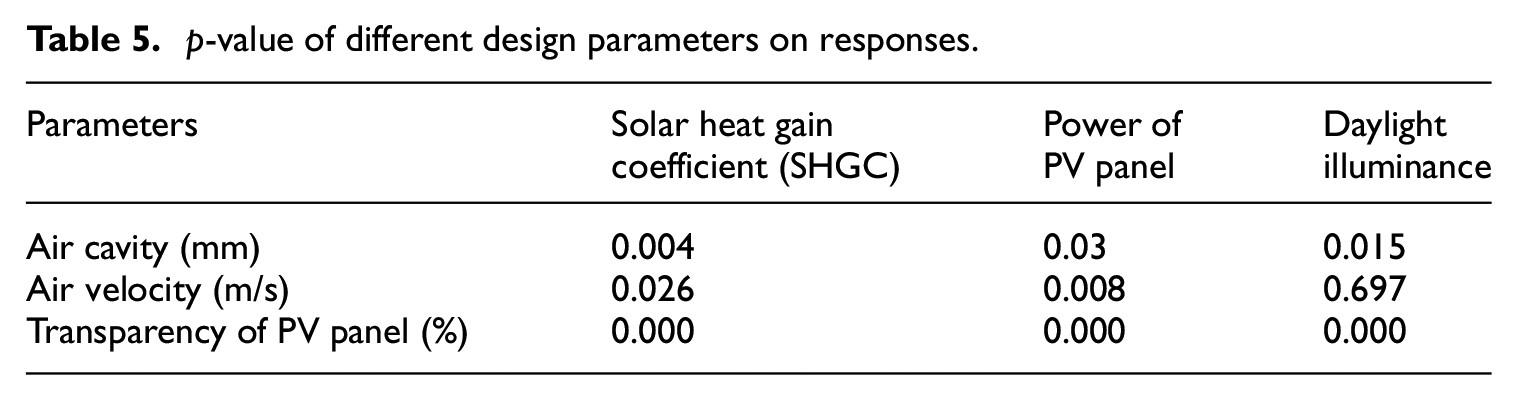
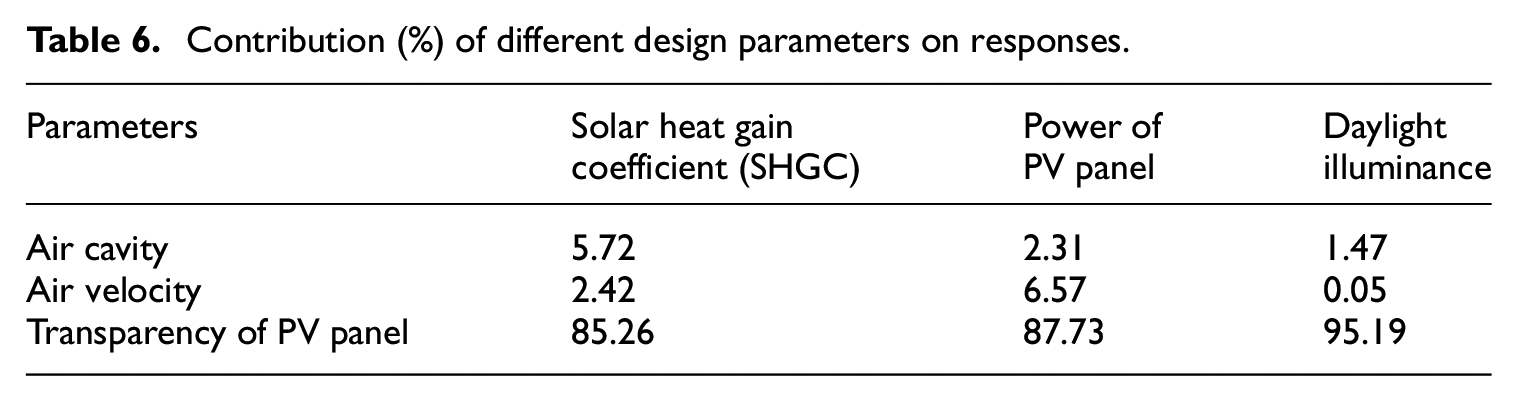
However, the impact of air velocity on daylight illuminance is found insignificant as the p-value is more than 0.05. The contribution rate of each design parameter on the SHGC, power of the photovoltaic panel and daylight illuminance is presented in Table 6. It is seen that the transparency of photovoltaic panel has shown the highest contribution to the responses. The coefficient of determination, R2 is found more than 0.9 for the correlations of all responses, which is not by chance (Kumar et al., 2017; Tewari et al., 2019). The comparison between the values of SHGC, power of photovoltaic panel and illuminance obtained from experimental runs and computed values from mathematical relations is shown in the scatter plot, Figure 9(a)–(c), respectively. Normal probability plots are used to define the normality of residuals. In this, the data are plotted against the theoretical normal distribution. It is carefully observed that points should form an approximate straight line. Variation from this linearity indicates the departure from normality (Sinha and Mathur, 2016). The normal probability plot of SHGC, power of photovoltaic panel and daylight illuminance are presented in Figure 10. Normal probability plots fulfil the criteria and satisfactorily discusses the adequacy of the developed mathematical correlations.
Contribution (%) of different design parameters on responses.
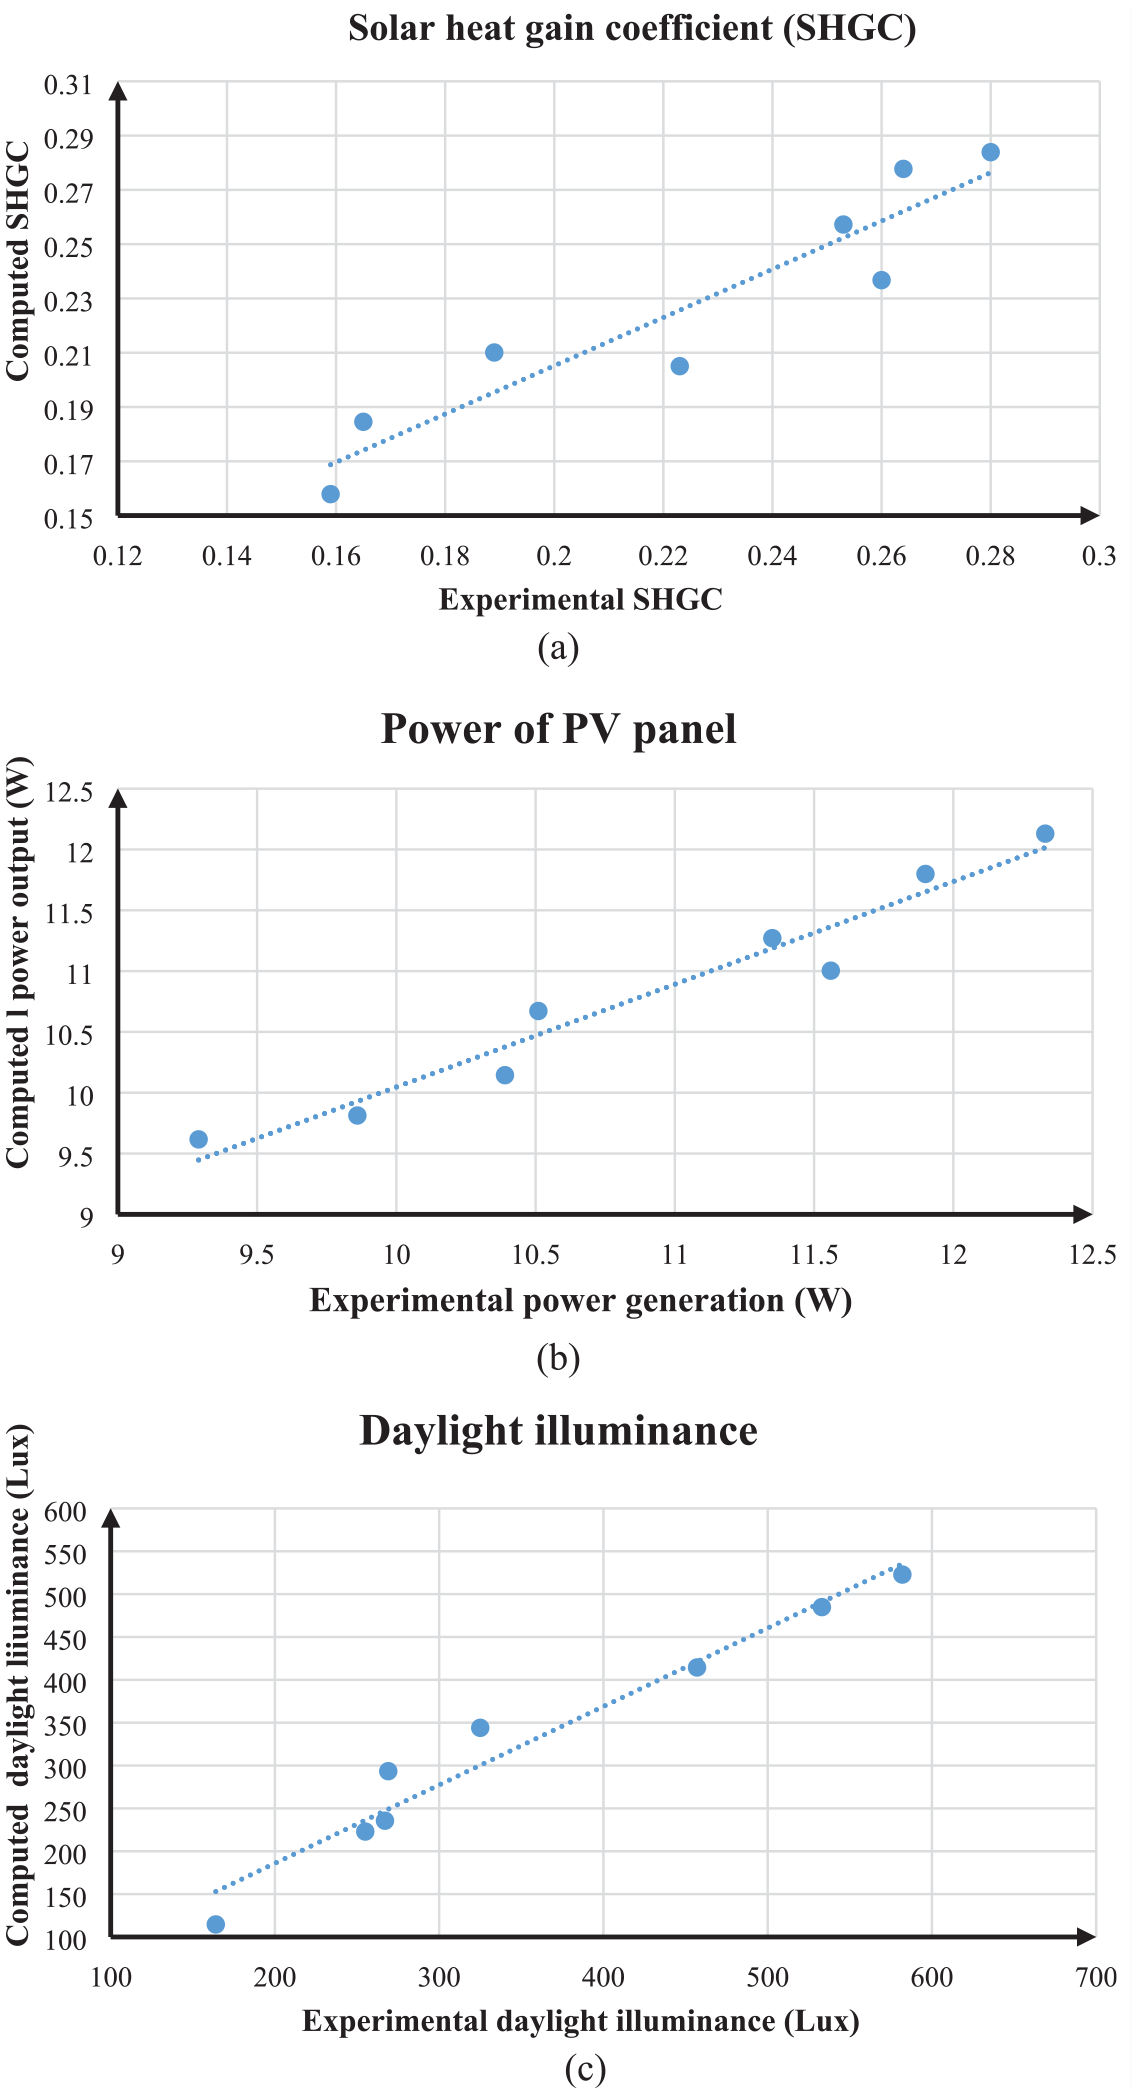
Curve fitting for (a) SHGC, (b) power of PV panel and (c) daylight illuminance.
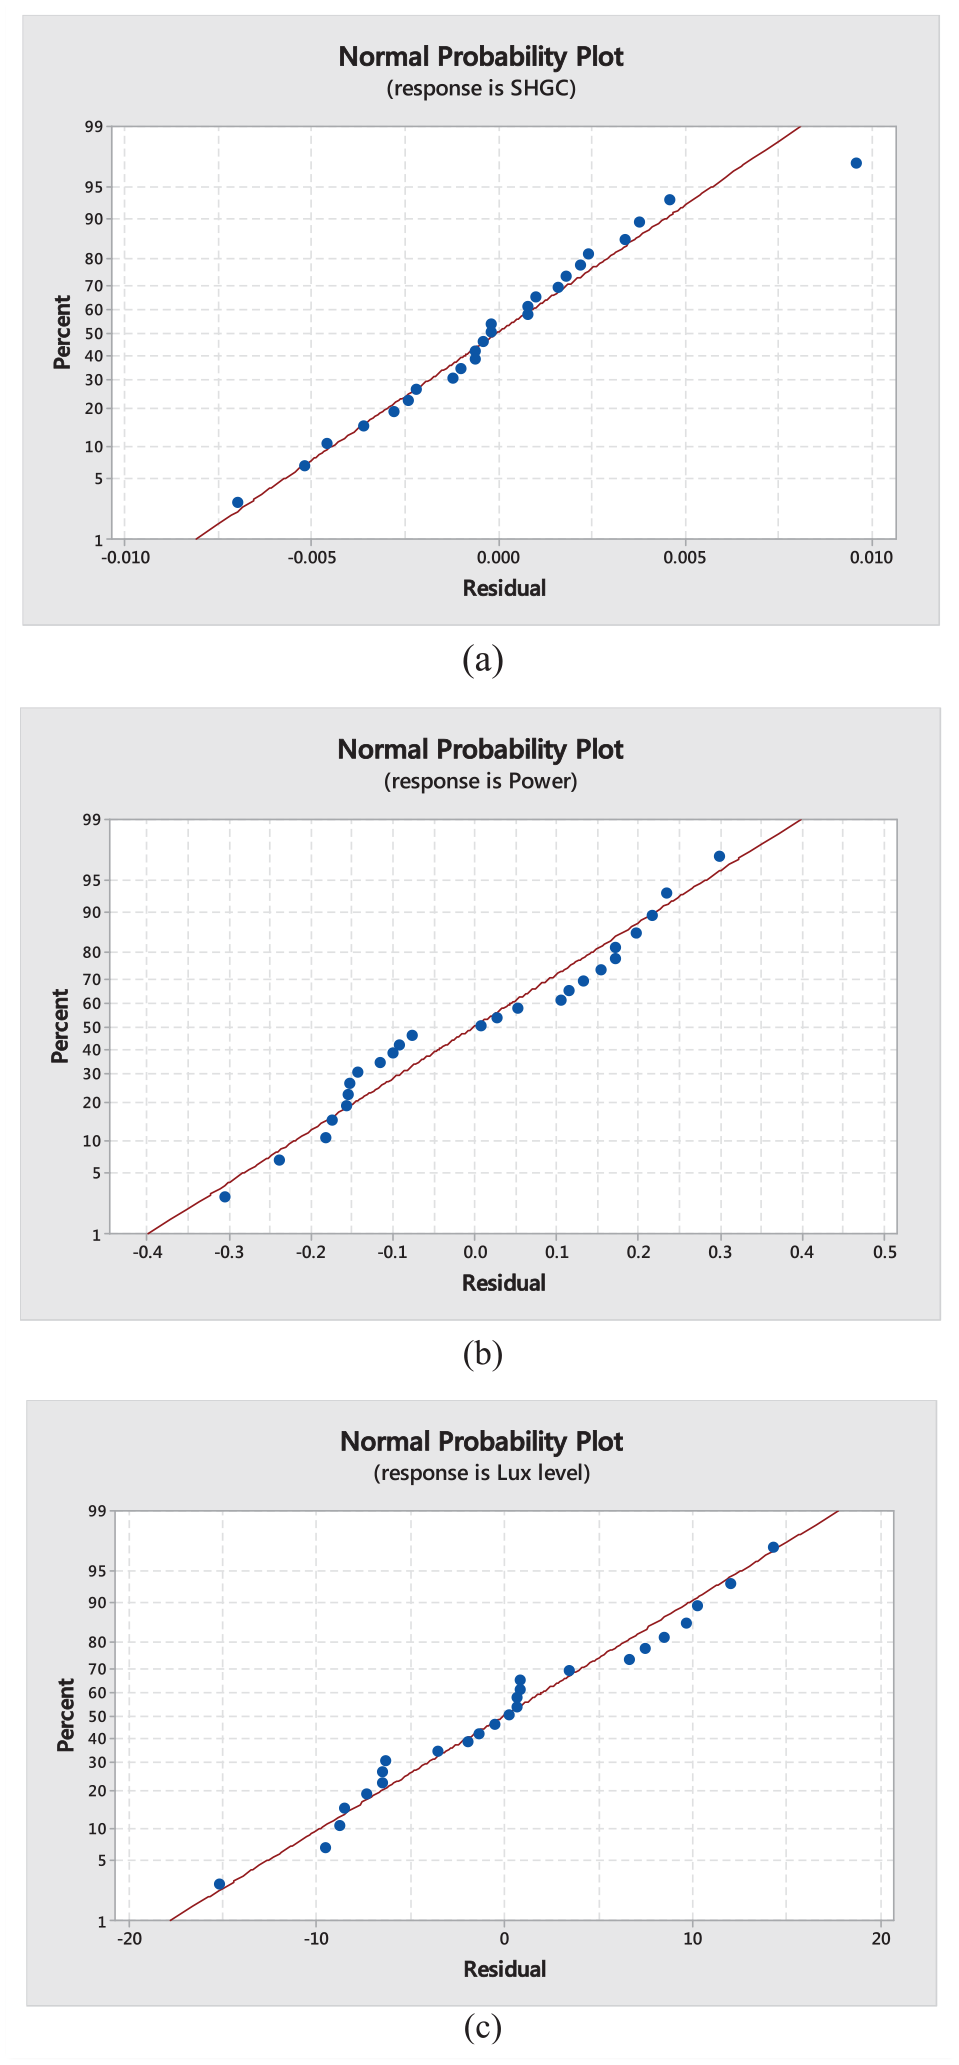
Normal probability plot for: (a) SHGC, (b) power of PV panel and (c) daylight illuminance.
Field validation
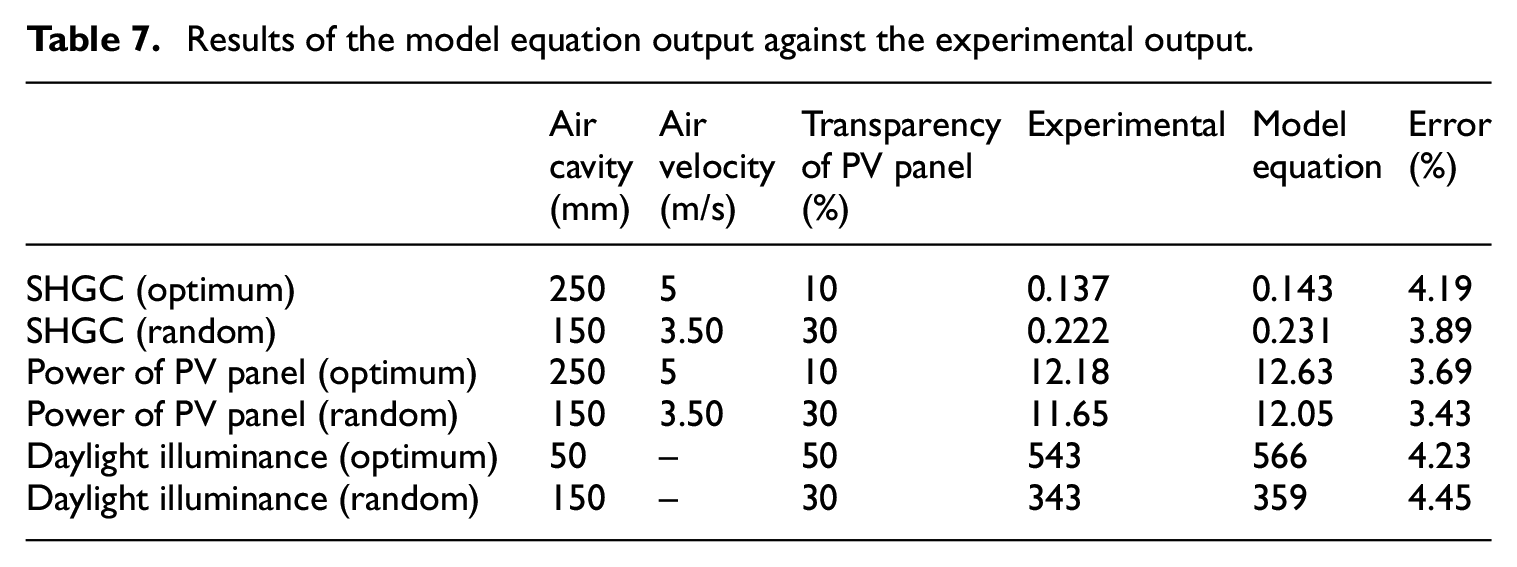
The experiments have been further conducted on the optimal and random settings of design parameters to check the robustness of developed mathematical correlations. Experimental validation is carried out on the same experimental setup in the hot summers of Jaipur city. Table 7 represents the results obtained for optimal and random arrangements of the design parameter. It is observed that adequacy of proposed model results lies in the acceptable range, and the relative error was found within the range of 5%. The analysis shows that the transparency of the photovoltaic panel has shown a major effect on the SHGC, electrical power output of the photovoltaic panel and daylight illuminance in the built space in hot summer conditions.
Results of the model equation output against the experimental output.
Discussion
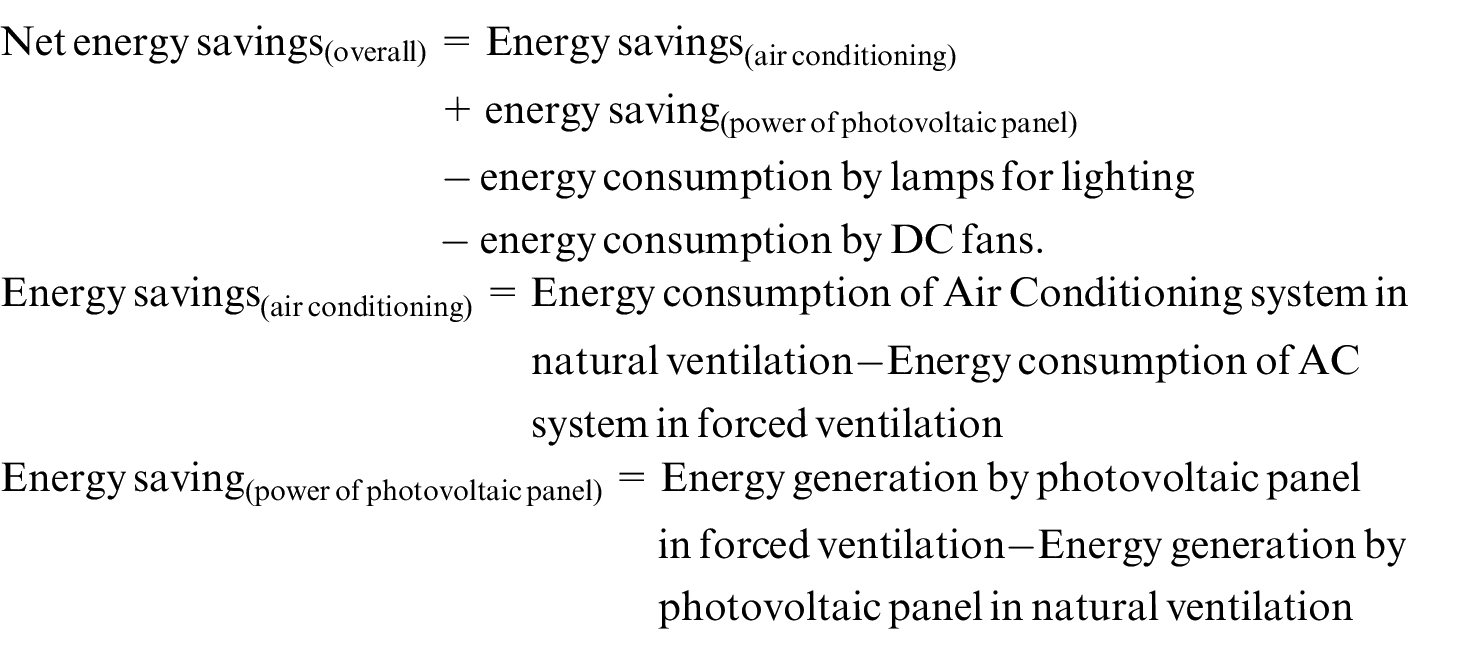
Based on experiments, the forced-ventilated Photovoltaic-DSF system’s overall energy performance has been evaluated. Calculated net energy savings of occupant’s area integrated with forced ventilated Photovoltaic-DSF system are discussed below:
Overall energy performance and energy savings
The parametric analysis of forced ventilated Photovoltaic-DSF system to assess the overall energy performance has been summarised in this section. The study intends to identify the suitable combination of design parameters for hot summer that can provide maximum energy savings by minimizing the energy demand of occupant’s area for cooling and lighting while maximizing the photovoltaic panel’s power output.
Effect of transparency of Photovoltaic panel
The overall energy behaviour of the PV-DSF system includes its thermal, electrical with daylighting performance. At various photovoltaic panel transmittances, the daylighting in occupant’s area is shown in Figure 11. When transmittances of the photovoltaic panel are enhanced, daylighting illuminance in an indoor space increases. The photovoltaic panel’s 20 % transparency is discovered to be the crucial transparency, after which more than 300 lux is available in the indoor area in each transparency. Figure 12 illustrates the amount of energy needed to maintain the desired illuminance in an interior area. It is witnessed that the energy demand for lighting decreased with an increase in transparency of the PV panel. No use of lamps is required in the built space for artificial lighting with a transmittance of PV panels higher than 20%.
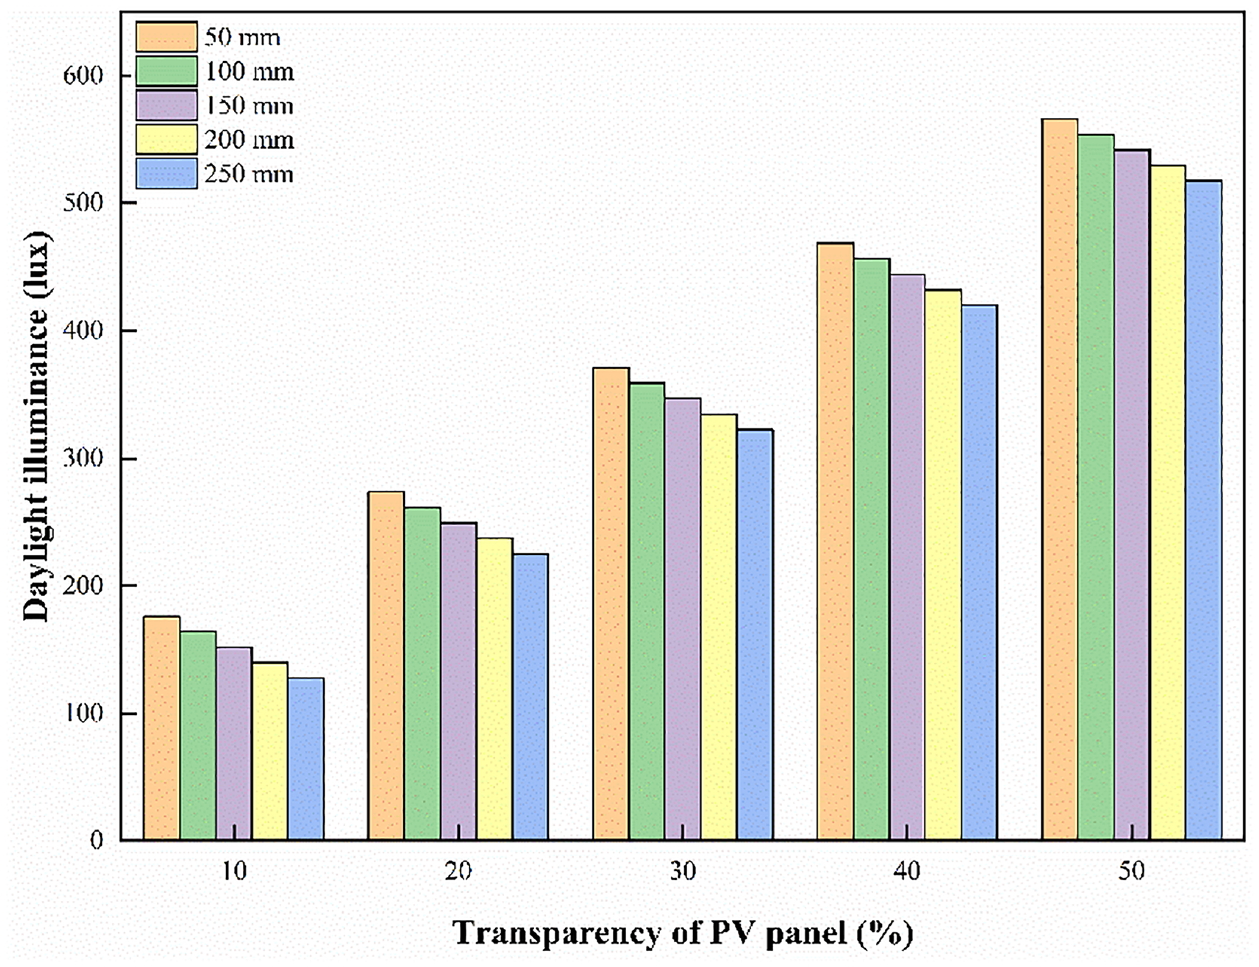
Daylight illuminance in built space under different air cavities and transparencies of PV panel.
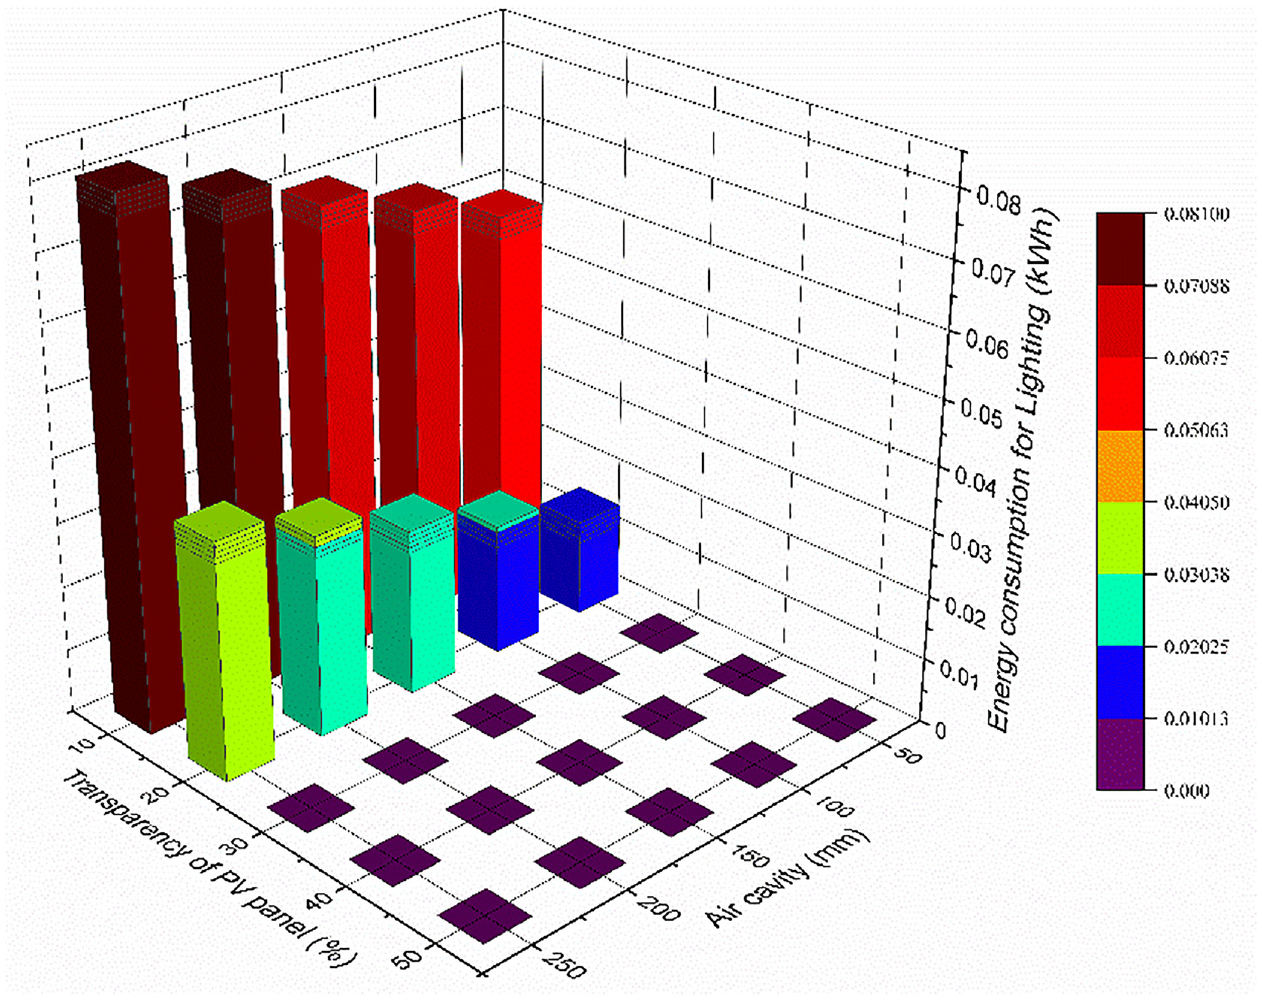
Energy consumption by lamps for artificial lighting in built space.
The air conditioning system (AC) is the largest energy consumer for achieving optimal thermal comfort conditions in the indoor area during summer. High SHGC of the window causes high heat gain in indoor area and raises the energy consumed by air conditioning systems. As reported in the previous section, SHGC has increased significantly with increment in the transparency of the photovoltaic panel. Thus, the electrical consumption of installed cooling system is substantially raised with increment in the transparency of photovoltaic panel. The transparency of photovoltaic panel also influences its power output. The power output of photovoltaic panels is reduced with an increase in photovoltaic panel transparency from 10% to 50%.
The Sum of the above features contributed to an increment in indoor area energy consumption with an increase in the photovoltaic panel transparency. However, increment in the energy consumption with variation in transparency is less in forced ventilated systems than natural ventilated system. It is due to higher convective heat loss from panes and cavity in forced ventilation than natural ventilation. Figure 13 presents the net energy savings of forced system compared to the natural-ventilated system as a function of the transparency of photovoltaic panel. Compared to natural ventilation, net energy savings with forced ventilation have increased from 0.078 to 0.180 kWh, increasing photovoltaic panel transparency up to 30%. Afterwards, it got reduced to 0.131 kWh at 50% transparency of the photovoltaic panel. It is because 10% and 20% transparent photovoltaic panels require artificial lighting to maintain required lux in the indoor area, thus lowers its energy savings. Although 40% and 50% transparent photovoltaic panels provide substantial lux, heat gain in indoor area is significantly high, raising energy needed for cooling. The photovoltaic panel of 30% transmittance is a suitable transmittance for a forced ventilated Photovoltaic-DSF system that achieves maximum energy savings.
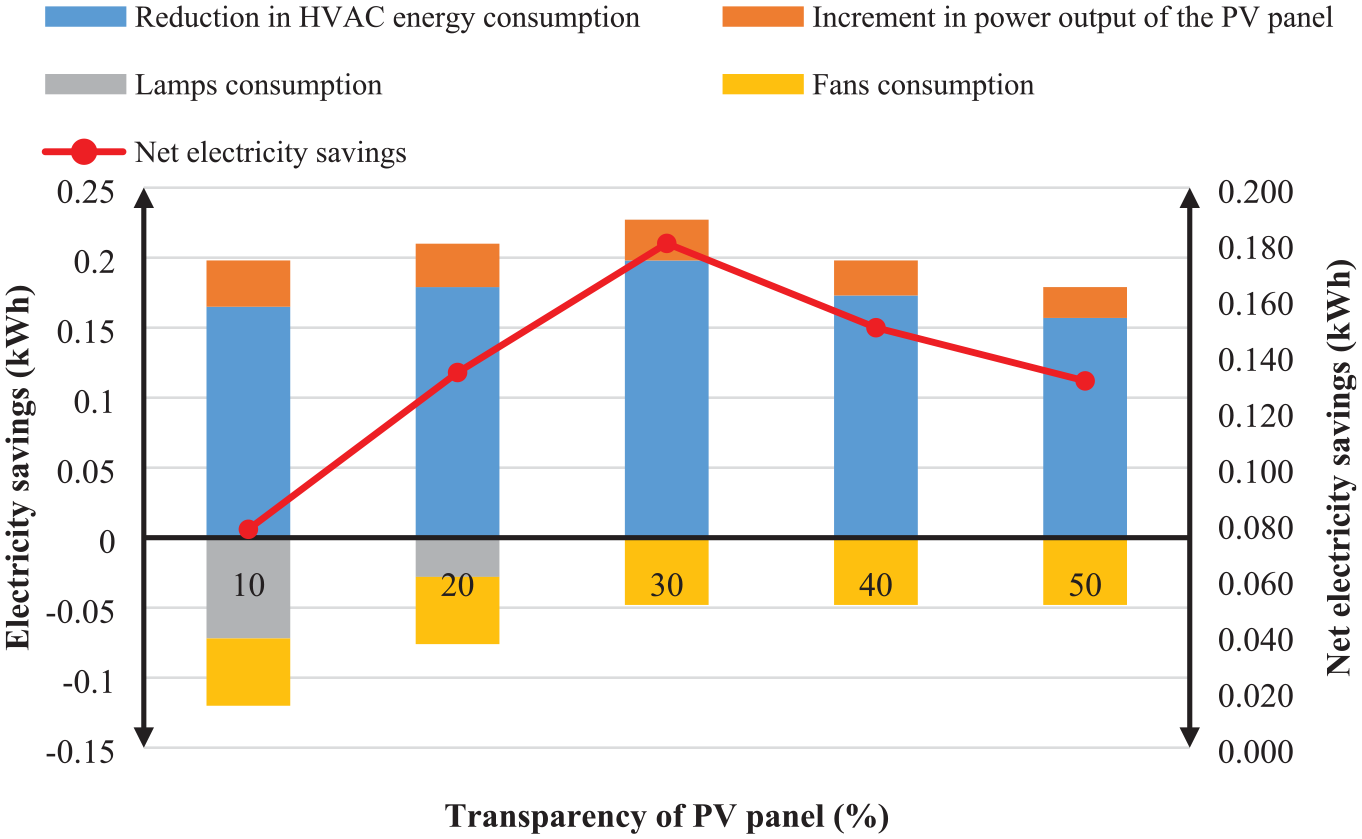
Energy savings of built space as a function of transparency of PV panel under 5 m/s air velocity and 200 mm air cavity.
Effect of air cavity thickness
In previous section, it is observed that the photovoltaic panel with 30% transparency has provided maximum energy savings compared to other transmittance of photovoltaic panel. In this section, energy behaviour of the forced ventilated Photovoltaic-DSF system is analysed as a function of air cavity thickness. The results are observed with 30% transmittance photovoltaic panel and 5 m/s air velocity inside cavity.
Figure 11 presents the average daylight illuminance in the occupant’s area integrated with Photovoltaic-DSF system. It is found that there is a minimal reduction in daylight illuminance in built space with increased cavity thickness. It is because of an increase in distance between two daylighting reference points placed inside and outside of Photovoltaic-DSF system. There is a nominal increment in the energy consumption of lamps with an increased air cavity thickness, shown in Figure 12. Similar findings are observed by Peng et al. (2016) and Ioannidis et al. (2017).
Figure 14 presents the savings in air conditioner’s energy consumption for forced ventilation compared to natural ventilation. It is observed that increment in cavity thickness enhanced cooling energy savings. It is because of an improved convective loss from the panes and cavity, which decreased cavity overheating. Energy saving due to increment in electrical output of the photovoltaic panel at several air cavity thicknesses is also presented in Figure 14. By increasing air cavity thickness, the energy savings in power output of photovoltaic panel has increased by 5.33%. Low temperature coefficient of power of CdTe photovoltaic modules is the reason for less increment in power output of photovoltaic panel. Similar findings are reported in studies done by Peng et al. (2015, 2016). The Sum of these features contributed to an improvement in net energy savings by widening the air cavity. Compared to natural ventilation mode, energy savings have increased from 0.167 to 0.180 kWh with an expansion in cavity space from 50 to 200 mm and afterwards, increment is limited. Based on the analysis, an air cavity of 200 mm thickness is suitable for a forced ventilated Photovoltaic-DSF system in hot summer zone.
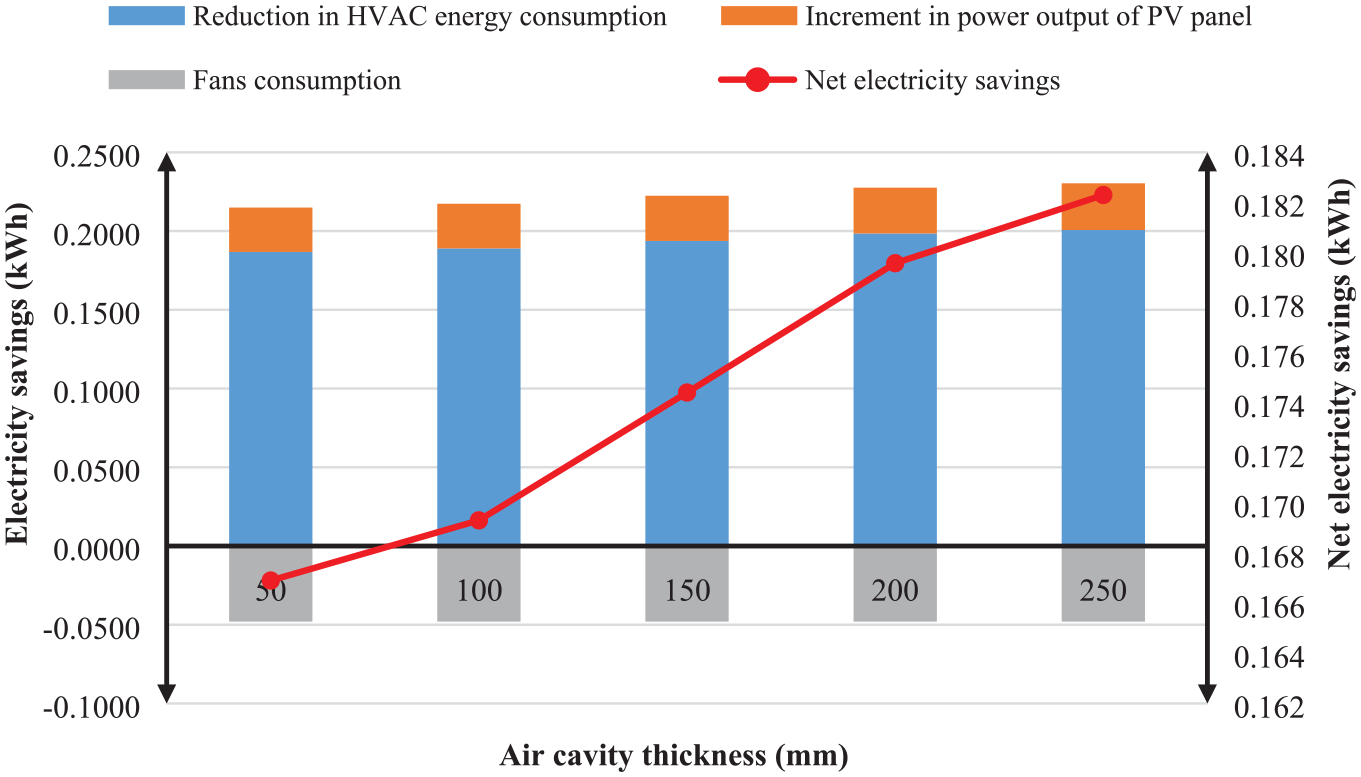
Energy savings of built space as a function of air cavity thickness under 5 m/s air velocity and 30% transparency of PV panel.
Effect of air velocity in the cavity zone
In the above section, 200 mm air cavity thickness and 30% transparency of photovoltaic panel is found suitable for forced ventilated Photovoltaic-DSF systems for hot summer climate. In this section, overall energy analysis of the forced-ventilated Photovoltaic-DSF system is explored at different air velocities in ventilated cavity.
Figure 15 presents the reduced energy consumption of Air Conditioning systems at various air velocities in cavity of Photovoltaic-DSF system. It is found that consumption of electrical energy of air conditioning system has reduced with air velocity in cavity. It is because of enhanced convective heat loss from envelope that lowered inner pane’s temperature. Low operating temperature of inner pane curtailed total heat flux transfer through it to occupant’s area, thus reducing the air conditioning system’s energy demand for cooling. In the same figure, energy consumed by fans at different air velocities are reported. The observation suggests that a high airflow within the cavity of DSF system results in greater energy savings compared to natural ventilation within the cavity. This holds true even when accounting in the energy consumed by fans to facilitate ventilation inside the cavity.
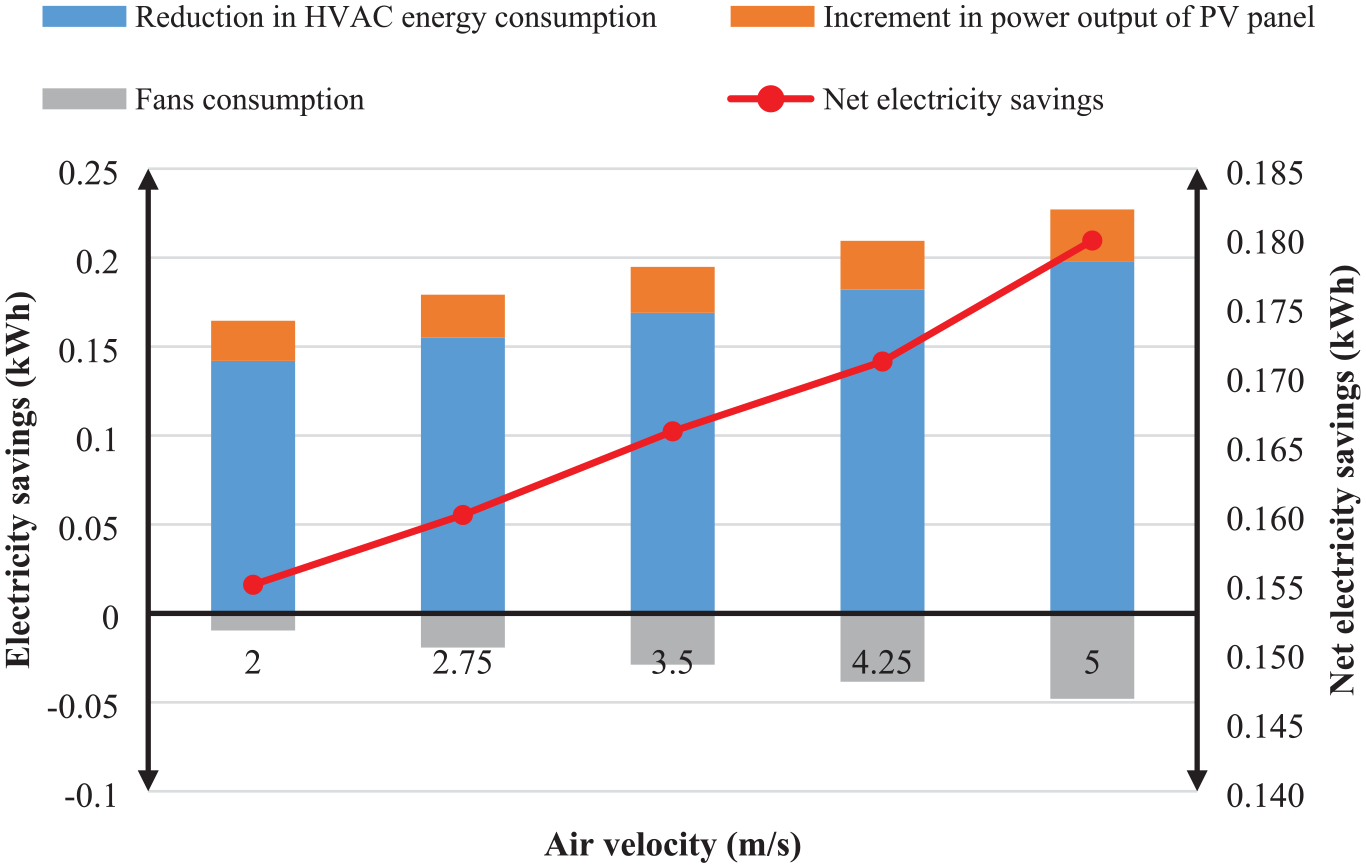
Energy savings of built space as a function of air velocity under 200 mm air cavity and 30% transparency of PV panel.
Figure 15 also presents the enhancement in the electrical power output of the Photovoltaic panel at several air velocities as compared to same naturally ventilated system. Electrical power output of the Photovoltaic panel has enhanced with increased air velocity as convective heat loss through photovoltaic panel improved. The Sum of all the above features contributed to an increase in intensity in net energy saving with air velocity in the cavity. Compared with natural ventilation mode, there has been a continuous increment in net energy savings from 0.155 to 0.180 kWh with upraise in air velocity from 2 to 5 m/s in a cavity.
From the above observations, the photovoltaic panel of 30% transmittance and air velocity of 5 m/s in a 200 mm air cavity is found to be a suitable combination of design parameters of forced ventilation Photovoltaic-DSF system that provided the high energy performance in the hot summer zone. Forced-ventilated Photovoltaic-DSF system’ energy performance can be increased to a more extent using high energy efficient semi-transparent photovoltaic modules, making it an energy-efficient façade for the hot summer climate zone.
Conclusion
This study examines the overall energy performance of photovoltaic-DSF forced ventilation systems in India’s composite environment during the hot summer. Using Taguchi L25 OA and multiple linear regression, mathematical correlations are developed to estimate SHGC, daylight illuminance and the photovoltaic panel’s power production. In the hot summer of the Indian composite environment, the proposed correlations are used to assess the energy behaviour with energy savings of the forced ventilated Photovoltaic-DSF system.
Key conclusions of the present research are:
Estimation of thermal and electrical performance of forced ventilated Photovoltaic-DSF system is done for summer using the mathematical correlations. The ANOVA test confirms the statistical significance of the response correlations that have been developed.
The forced ventilated Photovoltaic-DSF system’s overall energy performance is predicted using the suggested mathematical correlations for SHGC, the power output of photovoltaic panel and illuminance considering different levels of air cavity, air velocity and transparency of photovoltaic panel.
There is a good correlation (R2 > 0.90) between the experimental and calculated results based on mathematical relations.
Net energy savings have improved with an increase in transparency of photovoltaic panel up to 30% and afterwards, it reduced at 50% transparency of photovoltaic panel. Net energy savings increased with variation in thickness from 50 to 200 mm and afterwards, increment in net energy saving is plateaued. Increasing the air velocity from 2 to 5 m/s results in a steady improvement in energy savings.
A forced-ventilated Photovoltaic-DSF system with a 30% transparency photovoltaic panel and a 5 m/s air velocity in a 200 mm air cavity is a suitable design combination for achieving high energy performance in hot summer climate zone.
Air cavity, air velocity and panel transparency have a substantial impact on energy performance of forced-ventilated Photovoltaic-DSF systems, according to experimental data. Photovoltaic-DSF systems may benefit from the findings of this study by identifying the ideal combination of air cavity, air velocity and transparency of photovoltaic panel for achieving high energy savings in the hot summer climate zone. At the planning stage of building and retrofitting existing buildings, it can be used to achieve maximum energy savings.
Footnotes
Declaration of conflicting interests
The author(s) declared no potential conflicts of interest with respect to the research, authorship, and/or publication of this article.
Funding
The author(s) disclosed receipt of the following financial support for the research, authorship, and/or publication of this article: This work is supported by a DST project named ‘Development and performance analysis of Semi-Transparent Solar Photovoltaic double pane Window/Facade system’ funded by the Department of Science and Technology, Government of India (TMD/CERI/BEE/2016/070(G).
Data availability statement
The authors confirm that the data obtained and analysed during the findings of this research work are available within the article.