
Abstract
Current exterior wall assembly designs for new low-rise residential buildings targeting low-energy demand in heating dominated countries include split-insulation wall and thick-wall assembly designs. Both have been shown to result in thermal efficiency gains compared to building-code minimum assemblies, however long-term hygrothermal performance can vary depending on boundary conditions and the presence of construction deficiencies. Future climate scenarios estimate many heating-dominated climates will experience a reduction in heating-degree day hours and an increase in annual rainfall. Using validated assembly performance data from a Passive House certified facility, a sensitivity analysis is performed to determine the impact of rainwater wetting, air exfiltration and insulation material properties on the hygrothermal response of a thick-wall assembly. Results show that rainwater leakage values of 0.50% and greater of the adhering rainfall on the exterior surface of the assembly results in the greatest risk for failure. The hygrothermal response of the assembly is then examined under a global temperature rise scenario of 3.5°C for five geographic locations across Canada. Results show that an increase in average annual total rainfall does not directly result in an increase in the failure rate of the assembly when a rainwater leak is present. Additional climatic factors, including outdoor air temperature, driving rain and solar radiation received will influence the hygrothermal response of the assembly and need to be considered when modelling the performance under future climate change scenarios.
Introduction
In Canada, GHG emissions for fuel combustion in residential, commercial and institutional buildings make up 12.5% of national emissions (Environment and Climate Change Canada, 2022), with space heating accounting for 53.2% and 64.0% of commercial/institutional and residential building energy end use, respectively (Natural Resources Canada, 2022). In 2016 Canada established the Pan-Canadian Framework on Clean Growth and Climate Change (the Framework) with the intent to reduce national emissions by 30% over 2005 levels by 2030. To address building-related operational emissions, the Framework includes a national housing strategy with a goal that all provinces develop and adopt a ‘net-zero energy ready’ model building code for new construction by 2030. To reduce operational energy demand in heating-dominated climates, the construction of new buildings should include low-energy use envelope design to reduce heat loss and associated heating energy consumption. Wall assembly designs which have been used in part to fulfill low-energy use buildings include split-insulation and thick-wall assemblies. Split-insulation designs include the addition of insulation exterior to a framed-wall assembly, while thick-wall designs utilize a single cavity space which is framed using dimensional lumber or engineered wood filled with insulation. Thick-wall assembly designs include the double-stud wall, I-joist wall and truss wall. The type of insulation used, and assembly depth are dependent on material availability, boundary conditions and designer choice. Laboratory and field-based studies focused on the performance of thick-wall assemblies using current and historic weather data have shown that the hygrothermal response of the assembly can vary greatly depending on the presence of convective airflow within the assembly, the vapour permeance and moisture storage capacity of the assembly materials, rainwater leakage and climatic conditions (Pihelo et al., 2016; Simonson et al., 2005; Trainor et al., 2016; Wang and Ge, 2018).
As a result of the increase in insulation thickness and thermal resistance, thick-wall assemblies may experience colder exterior sheathing temperatures compared to alternative designs. Consequently, the exfiltration of interior air through the assembly as a result of temperature-driven buoyancy differences may result in an increase in sheathing moisture content and risk for moisture-related damages due to the growth of mould and other decay organisms (Ge et al., 2019; Gullbrekken et al., 2015; Trainor et al., 2016). In their 2019 study, Ge et al. (2019) reported slightly lower exterior sheathing temperatures in two north-facing thick-wall assemblies compared to a traditional 89 mm × 140 mm framed assembly installed in a natural exposure test facility. Under an induced air leakage rate of 0.11 L/s m2 at 5 Pa, the thick-wall assemblies insulated with cellulose insulation achieved slightly higher moisture content (MC) values (peak >30%) compared to the traditional framed assembly insulated with fiberglass (peak 27%) at the bottom of the wall near the air injection port, with the moisture-storage capacity of the cellulose insulation also resulting in slower drying times in the thick wall assemblies. Trainor et al. (2016) performed a similar assessment of thick-wall and split-insulation wall assemblies under simulated air exfiltration. They found an increased risk for mould growth in the thick-wall assembly compared to the split-insulation assemblies, demonstrating peak sheathing moisture content at or exceeding 25% at leakage rates above 0.02 L/s m2 at 5 Pa.
While studies have found the use of cellulose insulation in thick-wall assemblies can result in an increase in moisture content values and mould growth risk compared to traditional and split-insulation wall assemblies (Ge et al., 2019; Trainor et al., 2016), the material properties of the insulation used in a thick-wall can have a significant impact on the hygrothermal performance of the assembly. When comparing the simulated hygrothermal performance of a 300 mm assembly using either mineral wool or cellulose insulation, Langmans and Roels (2015) found the use of low-density mineral wool (20 kg/m3) resulted in predicted mould index values >4, while the assembly insulated with high-density cellulose (60 kg/m3) had lower predicted values (<2). When lower density (40 kg/m3) cellulose insulation and higher density (30 kg/m3) mineral wool insulation were used in the assembly, however, the predicted mould index of both assemblies was the same (2.3). Pihelo et al. (2016) presented similar findings following the measurement of three cellulose insulated thick-wall (500 mm) assemblies used in the construction of a residential structure built in Estonia. Simulation of the assemblies using alternative insulation materials found that the mould index value increased for all assemblies when insulated with low-density mineral wool (22 kg/m3) compared to the high-density cellulose (60 kg/m3). However, the highest mould index value (>3) was reported for the assembly insulated with mineral wool with no exterior insulation and no interior PE air/vapour barrier, with the mould index value decreasing to >1 for the assembly with exterior insulation (30 mm) and no interior PE air/vapour barrier.
In low-rise residential construction the exterior cladding is commonly considered the first plane of envelope protection against the exterior climate, with the water-resistant barrier (WRB) membrane or material considered the second plane of protection. In some jurisdictions, a rain-screen or ventilation cavity included interior of the cladding is also considered part of the second plane of protection and can increase the outward drying capacity of the assembly (Karagiozis and Kuenzel, 2009; Van Belleghem et al., 2015). Rainwater penetration past the first plane of protection in an exterior wall assembly may occur as a result of cladding material properties, installation methodology or incorrect installation practices. Laboratory measurements undertaken have shown penetration values to the exterior surface of the WRB between 0.5% and 2% of incident rainfall (Recatala et al., 2018; Støver et al., 2022). In their 2007 study, Tariku et al. (2007) demonstrated failure of a stucco-clad wall assembly under simulated rainwater leakage values as low as 0.5% deposited on the exterior face of the WRB. The same assembly did not show failure until 4% leakage for other geographical locations, however, leading the authors to conclude that the net affect of wetting and drying potential on the exterior surface of the assembly will have a greater affect on its long-term hygrothermal performance than the amount or frequency at which wetting occurs. To reflect discontinuities in the exterior cladding system, the ASHRAE 160 Standard assumes 1% of the driving rain that contacts the building façade will penetrate through to the exterior surface of the WRB layer (Tenwolde, 2008). Using a stochastic modelling approach, Wang and Ge (2019) investigated the hygrothermal response of several wall assemblies under a rainwater leakage scenario of 1% of driving rain. The results found no failures in the assemblies when the rainwater was deposited on the exterior surface of the WRB; however, failure was found to occur in several of the assemblies when the 1% leakage was deposited on the exterior surface of the OSB. Further investigation showed risk of failure may occur with leakage values as low as 0.5%. Ott et al. (2015) presented similar findings in their evaluation of driving rain simulation models, which includes rainwater deposition values of 0.5% and 1% past the second plane of protection. They concluded that a 1% moisture leak results in an increase in moisture content of the assembly beyond the safe limit, while a 0.5% leak may show acceptable performance depending on additional model parameters. While the presence of a ventilation cavity separating the exterior cladding from the exterior sheathing and WRB can reduce the amount of driving rain that reaches the surface of the WRB, discontinuities in the vertical joints of exterior cladding systems and around penetrations in the façade may lead to the infiltration of rainwater past the WRB. For linear vertical joints in exterior cladding systems (Van Linden and Van Den Bossche, 2022) recommend simulated penetration rates of 0.25%–0.30% past the exterior cladding system and 3%–5% for window-wall details. When no information is available for the specific cladding system in a building the proposed 1% infiltration rate designated in the ASHRAE 160 Standard may be used, however this value may lead to over or underestimations of the actual leakage which would occur on a façade depending on the exterior cladding material.
Using future climate datasets developed by the Canadian Regional Climate Model-version 4 (CanRCM4), Defo and Lacasse (2020) compared the hygrothermal performance of a standard 38 mm × 140 mm wood-frame wall assembly with a split-insulation assembly under historical and future global warming scenarios for five cities across Canada. Based on the parameters defined for the study, all geographic locations except one showed an increase in annual precipitation in the future climate files relative to the historical climate files. In addition to climatic differences present between the historical and future climate datasets, the impact of air leakage (flow rate 0.01 L/s m2) on the wall assemblies was also investigated. The results for both wall assemblies show variations in performance based on the geographical location of the assembly, with the maximum moisture content of the outer layer of the sheathing board decreasing between the historical and future climate datasets for two locations, while increasing in the remaining three. The authors conclude that all climatic parameters need to be taken into consideration before drawing conclusions about the predicted performance of an assembly under future climate scenarios. A similar investigation was undertaken by Conroy et al. (2021) which investigated the predicted performance of a thick-wall assembly (533 mm) under future global warming scenarios. Using validated assembly data, the average annual relative humidity levels at the interior face of the exterior sheathing were shown to decrease under all future climate scenarios relative to historical weather data as a result of warmer sheathing temperatures. The modelled parameters for the building included a low (0.14 1/h at 50 Pa) air exchange rate and exterior rain leak (0.01% of driving rain) scenario. No additional air leakage or rainwater wetting scenarios were investigated.
While the hygrothermal response of a thick-wall assembly to air leakage, rainwater wetting and cavity insulation material property changes has been investigated through in situ and HAM modelling under known climatic conditions (Bunkholt et al., 2021; Ge et al., 2019; Gullbrekken et al., 2015, 2017; Pihelo et al., 2016; Radon et al., 2018; Trainor et al., 2016; Wang and Ge, 2017, 2018), the predicted behaviour of the assembly under future climate data is relatively unknown. Future climate data shows global warming trends resulting in a lower risk of condensation and moisture-related deterioration in exterior wall assemblies for traditional and split-insulation assemblies (Defo and Lacasse, 2020). The hygrothermal response of a thick-wall assembly to future climate scenarios shows similar favourable performance when no construction deficiencies are present in the assembly (Conroy et al., 2021). The objective of this study is to examine the hygrothermal response of a wood-frame thick-wall assembly using future climate data for five locations across Canada under a simulated rainwater wetting scenario. Using validated assembly performance data, a sensitivity analysis is first performed to determine the impact of rainwater wetting, air exfiltration and cavity insulation material property changes on the hygrothermal response of the assembly. The performance of the assembly is then assessed using future climate data taken from CanRCM4 climate database under an average global temperature rise scenario of 3.5°C, which shows the greatest increase in average annual rainfall relative to historical weather data. The study aims to determine whether an increase in annual rainfall will lead to a subsequent increase in the risk of moisture-related deterioration of the thick-wall assembly under the future global warming scenario.
Methodology
The wall assembly used in this investigation was designed and constructed for the Wood Innovation Research Laboratory building (WIRL) built by the University of Northern British Columbia in Prince George, BC, Canada. The WIRL was constructed and achieved certification as Canada’s first industrial Passive House building in 2018. The walls were built using a continuous vertical truss system spanning the height of the building, measuring 9.8 m tall with a depth of 533 mm and insulated with blown-in mineral fibre insulation. Figure 1 shows the cross-section of the wall assembly and the detailed wall components are listed in Table 1. To monitor the hygrothermal performance of the exterior assemblies, relative humidity (RH) and temperature (T) sensors were installed in the north and south walls of the building and the SW corner of the foundation slab. The performance to date has shown the assemblies have performed well, with no evidence of excessive moisture accumulation or exterior wetting in the proximity of the sensors (Conroy et al., 2021).
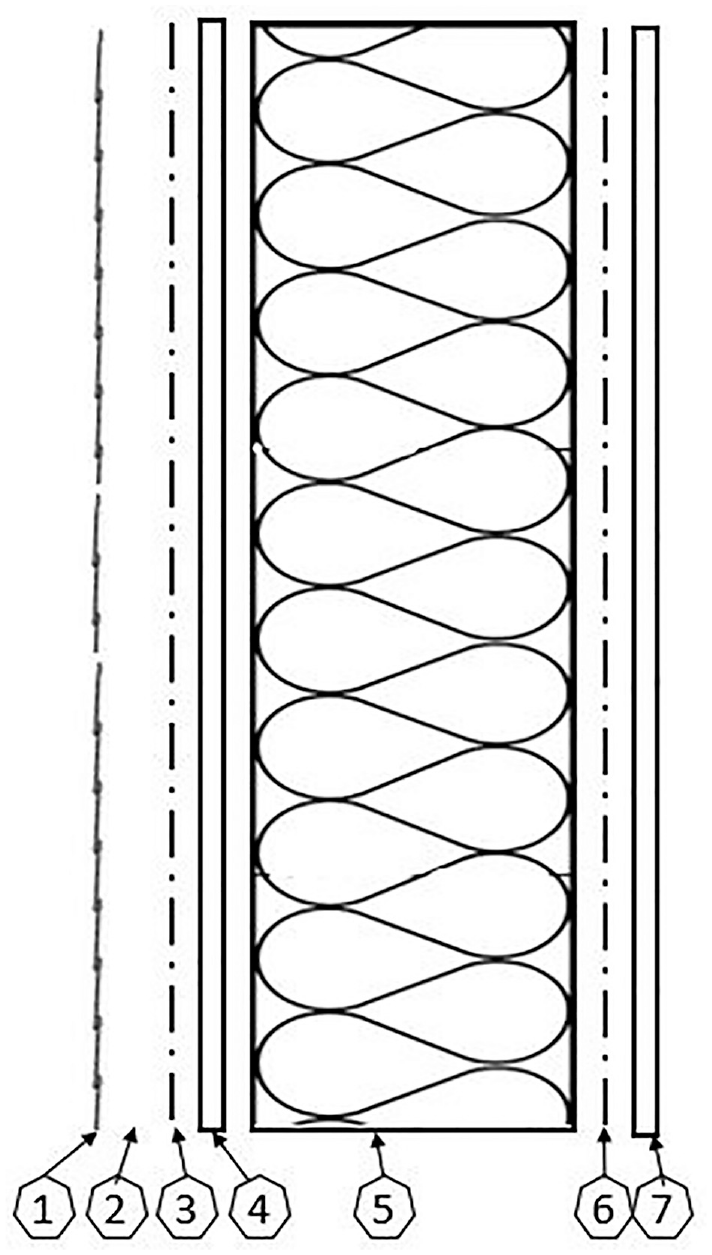
Cross-section of the WIRL wall assembly.
WIRL wall components and properties.
A model of the WIRL wall assembly was created using the WUFI® Plus software package and validated using data collected from the sensors installed in the north and south walls of the building between July 2018 and April 2020 (Conroy et al., 2021). The WUFI® Plus software package allows users to create 3D models of buildings and provides dynamic 1D hygrothermal simulations for building assemblies in addition to indoor environment simulations. Material properties for the modelled building assemblies are user-defined or taken from the WUFI material database. Due to the 1D nature of the simulations, non-continuous members such as studs are omitted from calculations, which may result in outputs that differ from in-situ performance of the assembly at these locations. Further description of the construction and reported performance of the WIRL building for the 21 month period beginning in 2018 can be found in (Conroy et al., 2021).
Using the validated WUFI model as given by Conroy et al. (2021), a sensitivity analysis is performed to determine the impact of insulation material type, air exfiltration and rainwater wetting on the hygrothermal performance of the thick-wall assembly. The methodology used to create these models and the parameters included are described in greater detail below.
Basecase model parameters
The parameters of the basecase model were set to reflect the measured conditions in the WIRL building and exterior wall at the start of the data collection period. A user-defined climate file was created using historical climate data collected from the Prince George Massey Auto Environment Canada meteorological station (Government of Canada, 2021). Because solar radiation data is not recorded at the meteorological station, data was derived from a TMY file obtained from the Canadian Weather Energy and Engineering Dataset (CWEEDS) (Government of Canada, 2021). Data used from the TWY file was correlated with radiation data available through the NASA Langley Research Center (LaRC) POWER Project and found to be in agreement for the given timeline of the basecase model (National Aeronautics and Space Administration, 2022).
The WUFI Plus® software allows users to describe the airflow parameters of a building using data based on on-site blower door testing. In addition, the user may simulate additional airflow through the building envelope by inserting an air layer within the assembly and coupling it to the interior or exterior environment. The air exchange rate of the air layer is expressed in air changes per hour (1/h) and may reflect known assembly performance data (Wang and Ge, 2017), or provide predictive assembly behaviour under typical construction scenario (Lstiburek et al., 2016).
In simplified building models, the simulation of air exfiltration through envelope assemblies is modelled to reflect the pressure differences caused by thermal stratification between the interior and exterior environment. Although air pressure differences across the building envelope may also be caused by wind and mechanical ventilation imbalances, these differences are not easily measured and can be inconsistent and are therefore often disregarded. Although simplified, previous studies have shown the results of including thermal buoyancy driven air movement to correlate well with field measurements (Karagiozis and Kuenzel, 2009; Petersen and Harderup, 2011). In rain screen cavities, air exchange through the cavity may also occur as a result of wind-induced pressure differences or thermal buoyancy. Although the addition of an air change rate to the rain screen cavity may increase the accuracy of the predicted performance of the assembly, the inclusion of the cavity may not be required in all scenarios and can be inconsequential to accurate modelled performance (Karagiozis and Kuenzel, 2009; Langmans et al., 2016).
To account for convective air movement in the WIRL wall assembly, the air convection model introduced by Wang and Ge (2017) is used. This model allows for the introduction of interior air into the wall by adding an air layer with a thickness of 1 mm into the assembly and coupling it to the indoor environment with a given air change rate. The air layer is typically modelled at the face of a potential condensation plane in the assembly, selected by the modeler.
As described by Künzel et al. (2012) and Wang and Ge (2017), the amount of condensation which results on the selected plane as a result of convective air movement in a defined air cavity is described by the difference between the indoor vapour concentration and the vapour saturation concentration at the condensation position p and the airflow through the cavity according to equation 1:

where SCL = moisture source due to vapour infiltration into the component(kg/(m2h)) qCL = air flow through the moisture leaks of the envelope component (m3/(m2 h)) ci = water vapour concentration of the indoor air (kg/m3) csat,p = water vapour saturation concentration at position p, where condensation due to exfiltration is expected (kg/m3)
Any increase in sorption water content that could occur in the air temperature drop during exfiltration is neglected, and the heat of condensation resulting from convective flow is disregarded. The airflow rate in the cavity (qCL) may be determined based on the difference in air pressure between the exterior and interior environment and moisture specific air permeance of the component. Component permeance values may be derived from industry standards or laboratory based research (Künzel et al., 2012).
Using the air convection model, the qCL in the WIRL wall assembly is set as a constant value of 2 (1/h) located in the ventilation layer modelled at the interior face of the exterior sheathing board. 2 (1/h) was calculated based on the research by Persily and Emmerich (2009), who estimate a stack pressure difference at the top and bottom of a building on the order of 0.02 Pa per m of building height and degree K of indoor-outdoor temperature difference, neglecting internal resistance to airflow. From the WIRL wall sensor data, an average temperature difference between the top and bottom sensor (height = 3.9 m) on the exterior side of the insulated cavity was calculated at 2.52°C. Using the power law equation (Cd = 0.61 and n = 0.65), an air exchange value of 2.33 1/h was calculated for the modelled ventilation layer, which was simplified to 2 1/h. This value was found to be in good agreement with the measured performance of the assembly. The air layer was given a thickness of 1 mm as there is no actual air cavity in the existing assembly and was coupled to the interior environment (Künzel et al., 2012; Lstiburek et al., 2016). An air change rate of 0.14 1/h at 50 Pa was set for the building airflow numerics to reflect the results of the airtightness test performed on the building in 2019 (Conroy et al., 2021). An air change rate was not included in the rain screen cavity in the WIRL wall assembly as it was not found to produce performance data that was in good agreement with measured data.
The initial temperature and relative humidity in all exterior assembly components were set at 18°C and 50%, respectively, to reflect the measured conditions reported by the sensors in the assembly at the beginning of the modelling period. Interior operational climate conditions were set to 18°C with a relative humidity of 30%, which were chosen to represent a typical moisture load for the winter but a low interior moisture load scenario in the summer. The indoor relative humidity is typically about or below 30% in the wintertime for the region where the WIRL is located.
Moisture transport through a material is calculated in WUFI® as the sum of liquid transport and vapour diffusion. The rain load (adhering rain) is defined by WUFI as the amount of rain which comes into contact with the exterior surface of the building and is calculated as shown in equation 2. The default adhering rain factor value is set at 0.7 (70%) for an exterior wall surface. The user may also define additional liquid or water vapour moisture sources to a given material within the assembly.

Where R1 = inclination factor (0 for vertical surfaces, 1 for inclinations <90°) R2 = driving rain coefficient (s/m), height dependent. WUFI defaults R2 = 0.07 for small buildings with height up to 10 m in the centre of the façade, and R2 = 1.0 for tall buildings, central part 10–20 m
The adhering rain factor value was left at the default value (70%) for the WIRL basecase model. The water ingress past the WRB layer is defined in the basecase model as a moisture source (fraction of adhering rain) located on the exterior face of the exterior sheathing, set at 0.01%. The fraction of adhering rain is estimated to be a conservative value to represent small discontinuities in which may exist in the WRB layer (Lstiburek et al., 2016; Wang and Ge, 2019) while demonstrating the drying capacity of the assembly and reflect the measured performance to date (Conroy et al., 2021).
So that the impacts of solar exposure could be negated on the assembly performance, a northern orientation was used for the basecase model and calibrated to the results given by the sensors located in the north wall of the building. Failure of the thick-wall assembly is assumed when a calculated mould index value
Alternative assemblies model parameters
Impact of insulation material properties
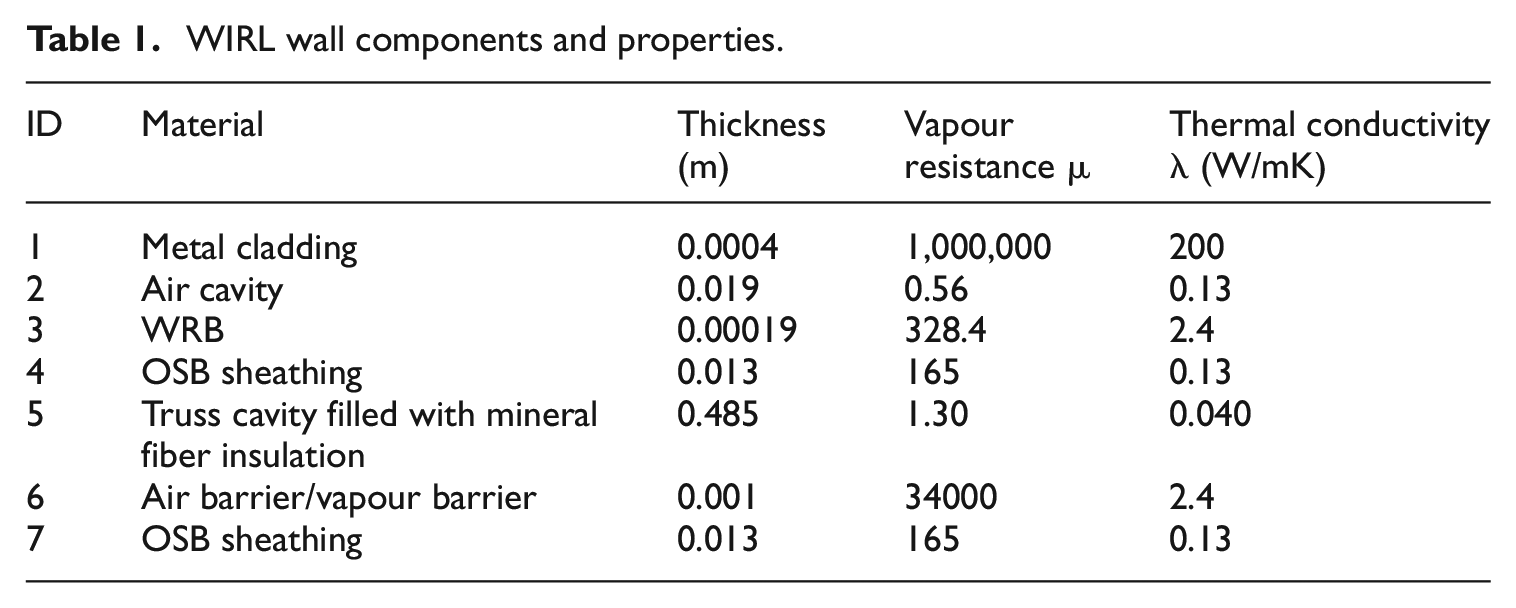
The WIRL walls were constructed using a 533 mm thick vertical truss panel assembly insulated with mineral fibre insulation. To investigate what impacts the insulation material has on the predicted performance of the assembly, the thick-wall assembly was modelled with cellulose insulation, a hygroscopic material. The material properties of each insulation were taken from the WUFI material database (Table 2).
Insulation Material Properties.
Material properties taken from the WUFI material database with reference to the IEA Annex (mineral wool) and TU Dresden (cellulose) reported values, respectively.
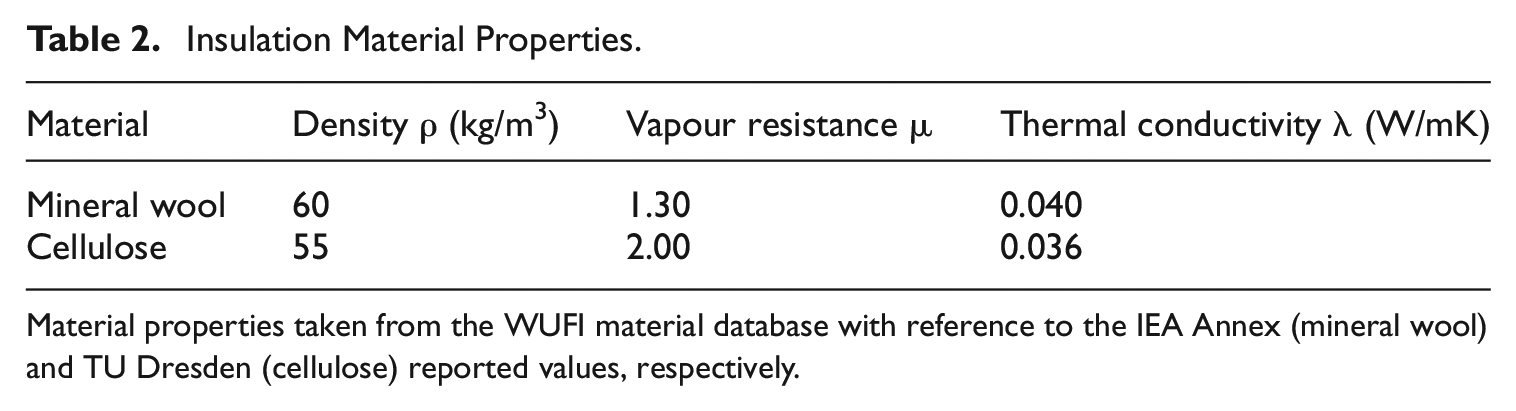
The performance of the thick-wall assembly with each insulation material is shown in Figure 2. For this analysis, the moisture content of the interior face of the exterior OSB sheathing was investigated to see what, if any, impact the insulation material properties had on the amount of moisture that was transported the surface over the investigated period (July 2018–March 2020). Following the methodology of (Lstiburek et al., 2016; Wang and Ge, 2019), to measure the predicted performance of the OSB, the material was divided into three layers with the interior and exterior layer each measuring 3 mm in depth. The predicted moisture content of the interior layer of the OSB for the basecase and basecase with cellulose insulation assemblies were calculated using (Simpson, 1998).
Comparison of the moisture content of the interior face of the exterior OSB in the WIRL thick-wall assembly with mineral fiber (basecase) and cellulose insulation (from Conroy et al., 2021).
Natural and forced convection that occur during the winter in heating dominated climates can result in the movement of moisture-laden air towards the exterior side of an assembly. As shown in Figure 2, the use of cellulose insulation results in higher moisture content values on the interior face of the exterior OSB compared to the basecase wall insulated with mineral fiber. This is a result of the moisture-storage capacity of the cellulose insulation and movement of moisture-laden interior into air into the assemblies. However, due to the low exfiltration rate and rainwater leakage included in the model parameters, both assemblies are shown to dry out during the summer months and at no time displays moisture content values that may lead to long-term durability issues.
Impact of airflow within the exterior wall assembly
To understand the impact that an increase in airflow in the assembly has on the predicted behaviour of the WIRL wall, the airflow in the modelled ventilation layer at the interior face of the exterior sheathing was increased to 10 and 20 (1/h) for the basecase models insulated with both mineral fiber and cellulose insulation. The air change rates of 10 and 20 (1/h) reflect large pressure differences which may occur in the assembly as a result of high thermal stratification scenarios due to cold exterior temperatures (<−25°C) or more extreme cases of coupled cold exterior temperatures and high wind-flow scenarios.
As a result of the moisture storage capacity of the insulation, initial RH (50%) and high air change rate at the face of the exterior sheathing, the greatest increase in the moisture content can be seen in the simulated performance of the basecase wall assembly with cellulose insulation and an air change rate of 20 (1/h), with a maximum value of 18.70% (Figure 3). The basecase wall assembly with 10 (1/h) and 20 (1/h) also demonstrates a substantial increase in sheathing moisture content over the basecase assembly, with maximum values of 16.77% and 17.82%, respectively. Although a large increase in moisture content is observed, the moisture content of the assembly demonstrates drying capacity outside of the heating months as a result of the convective air flow and higher exterior temperatures and does not exceed the threshold for mould growth risk.
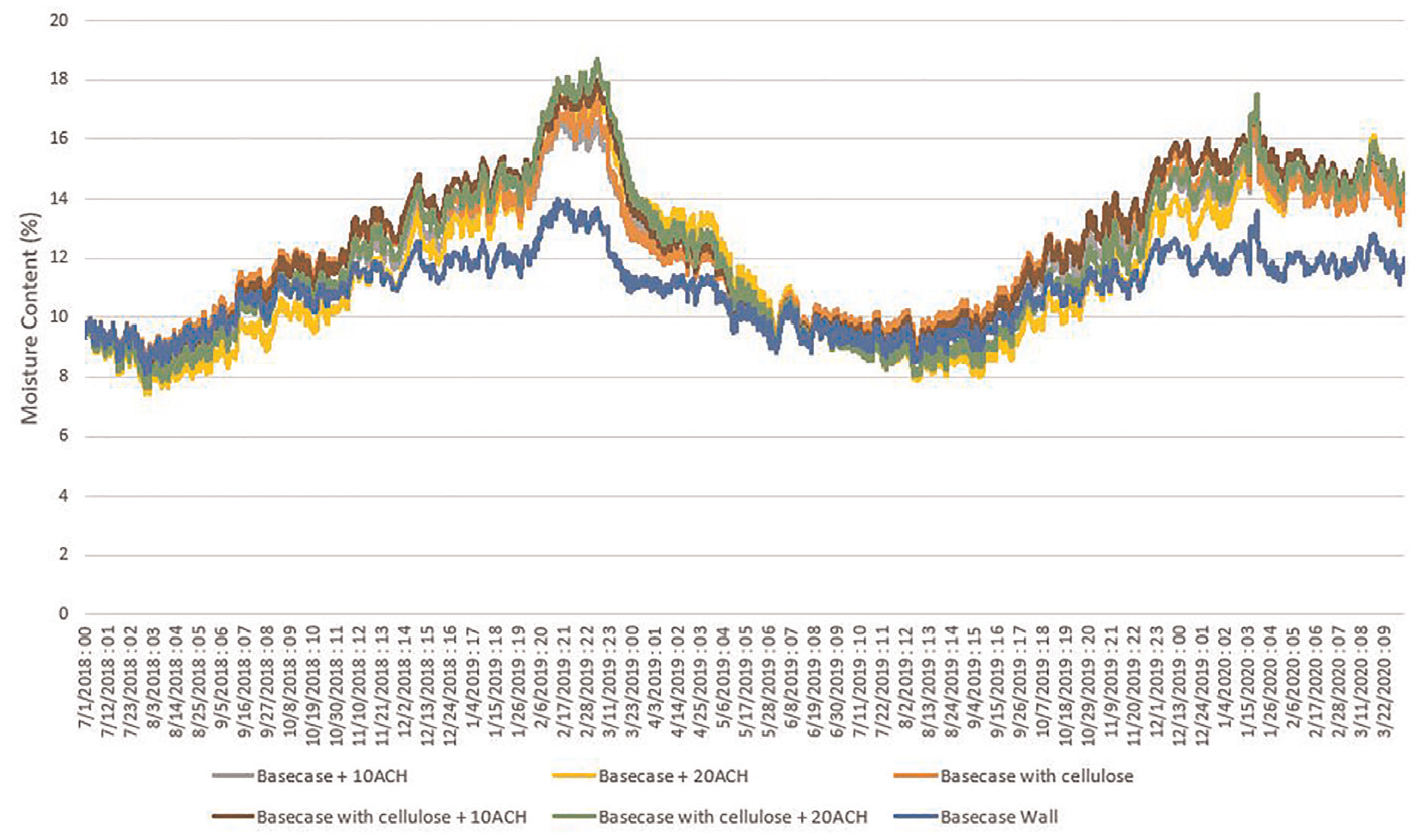
Moisture content of the interior face of the exterior OSB in the basecase wall with both mineral fiber and cellulose insulation under three air leakage scenarios.
Impact of rainwater wetting on the exterior wall assembly
To determine the threshold of rainwater leakage at which the WIRL wall assembly will sustain long-term durability concerns, increasing levels of rainwater leakage (fraction of adhering rain) were modelled using the basecase and basecase with cellulose insulation assemblies, including 0.1%, 0.5% and 1.0%. The simulated rainwater leak is designated to one grid element of the sheathing with a depth of 0.5 mm.
The maximum moisture content of the outer layer of the OSB sheathing under the basecase and three rain leak scenarios are shown in Table 3. When a rainwater leak is added to an assembly component, the WUFI Plus® software sets a source-term cut off when free water saturation is reached. Free water saturation in wood and composite wood products typically occurs around 28% moisture content, while additional moisture uptake may occur as a result of diffusion and condensation until maximum saturation is achieved. Using free water saturation as the source-term cut-off, any additional moisture added to the OSB after saturation is calculated as run off from the system.
Maximum moisture content (%) of the exterior face of the OSB for the WIRL wall and the WIRL wall with cellulose insulation modelled assemblies under basecase (0.01%), 0.1%, 0.5% and 1.0% rain leakage models.
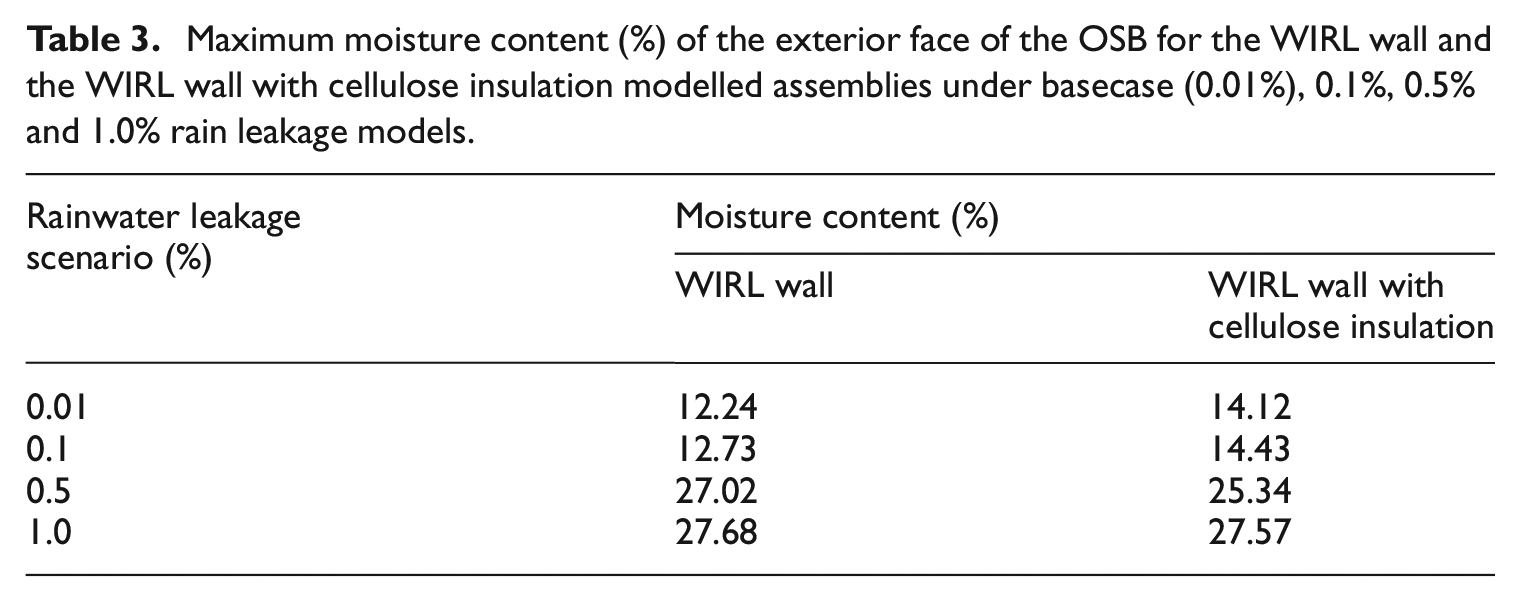
As a result of the initial relative humidity of the assemblies and moisture storage capacity of the cellulose insulation, the basecase wall with cellulose insulation shows a higher maximum moisture content of the exterior face of the OSB in the basecase and 0.1% rainwater leakage scenarios compared to the basecase assembly (Figure 4). However, we see a lower risk of failure for the 0.5% rainwater leakage scenario in the assembly insulated with cellulose, with the WIRL wall exceeding the safe limit following the second heating season. This is assumed to be a result of the moisture storage capacity of the cellulose insulation. Under the 1% rainwater leakage scenarios both assemblies exceed the safe limit within the first heating season and stay above the safe limit threshold for the remainder of the modelling period.
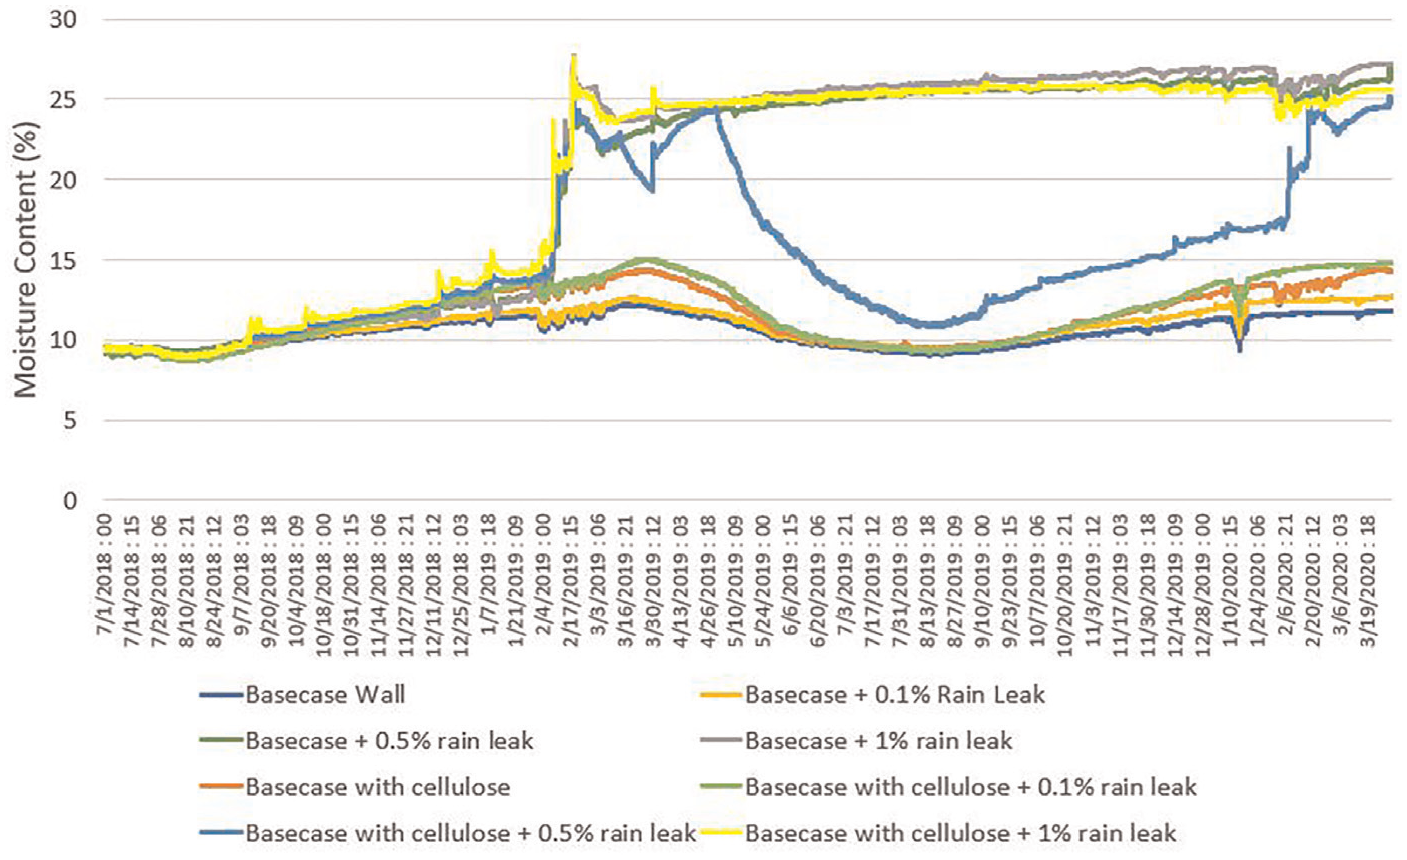
Comparison of the moisture content of the exterior face of the OSB sheathing of the WIRL wall and WIRL wall with cellulose insulation with three alternative rainwater leakage values.
Alternative climate parameters
The CanRCM4 climate datasets obtained from the National Research Council of Canada (NRC) include historical datasets and future climate scenarios for 11 urban centres across Canada. The datasets are based on CanESM2 large ensemble simulations that have been downscaled and bias-corrected with reference to observations (Gaur et al., 2019), with 15 different sets of projections (runs) available for each city meant to capture the internal climate variability of the climate system (Gaur, 2019).
For this study, the climate projection file with the highest annual rainfall was used for both the historic and the 3.5°C global temperature-rise scenario for the cities of Vancouver, Calgary, Winnipeg, Ottawa and St John’s. The climate datasets are given for a 30-year period, with the datasets set between 1986–2016 and 2062–2092 for the historical and future 3.5°C global temperature rise scenario, respectively. The 3.5°C temperature rise scenario was chosen as it presents the greatest increase in average annual rainfall over the historical climate dataset. The cities included in the study were chosen based on their geographical distribution across Canada and variations in annual rainfall values.
Results and discussion
Based on the results of the sensitivity analysis performed, the basecase WIRL wall assembly is found to demonstrate the greatest risk for failure when a rainwater leak is present, with the predicted moisture content of the exterior sheathing exceeding and remaining above the safe limit in both the 0.5% and 1% leakage scenarios. These findings are in keeping with the results presented by Sehizadeh and Ge (2016) and Wang and Ge (2018), who demonstrate a greater increase in the predicted moisture content of a thick-wall assembly under a 1% rainwater wetting scenario compared to air-leakage only scenarios. To investigate the impact of a future climate on the performance of the assembly with a global temperature rise of 3.5°C, the assembly with 1% rainwater leakage is used. For each of the five Canadian cities included in the analysis, the climate projection file with the highest annual rainfall for the future and historic climate datasets for each location is used. Due to the file simulation time required to process each model, the analysis timeline is set to the 3-year period surrounding the year with the highest annual rainfall, with the year with the highest annual rainfall occurring during the middle of the 3-year analysis period.
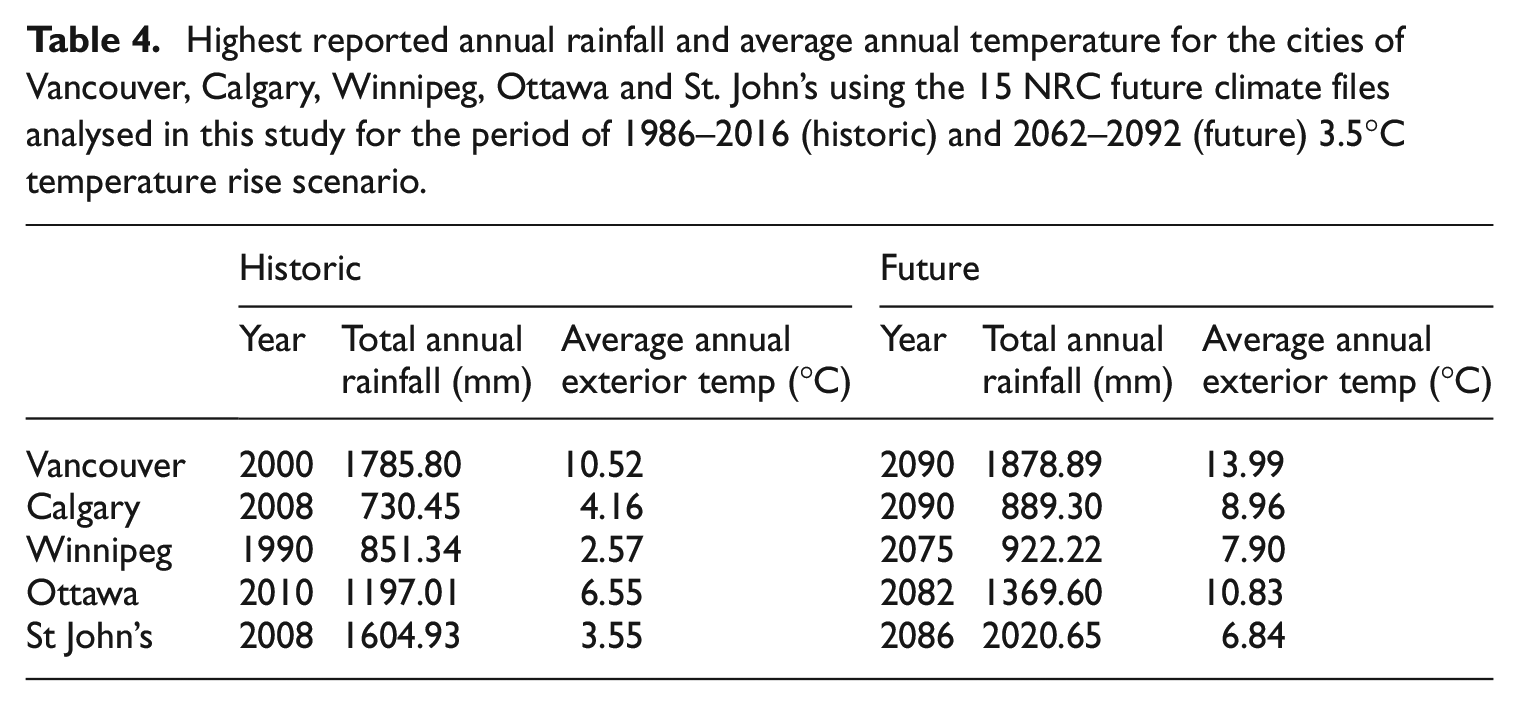
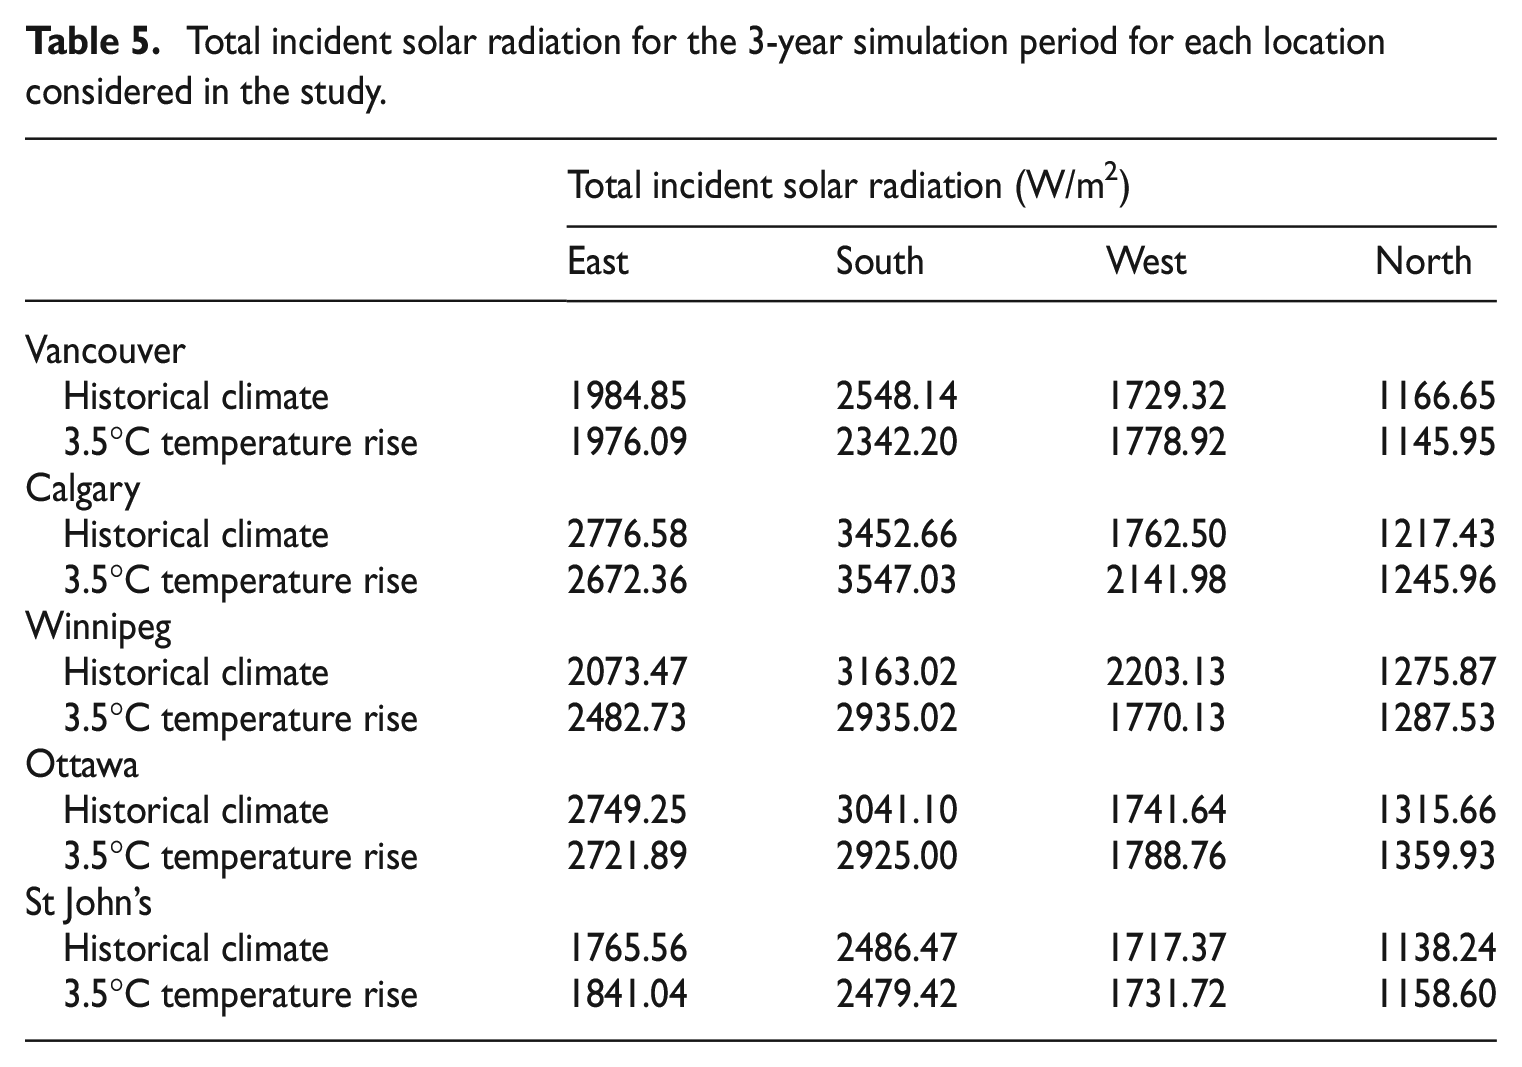
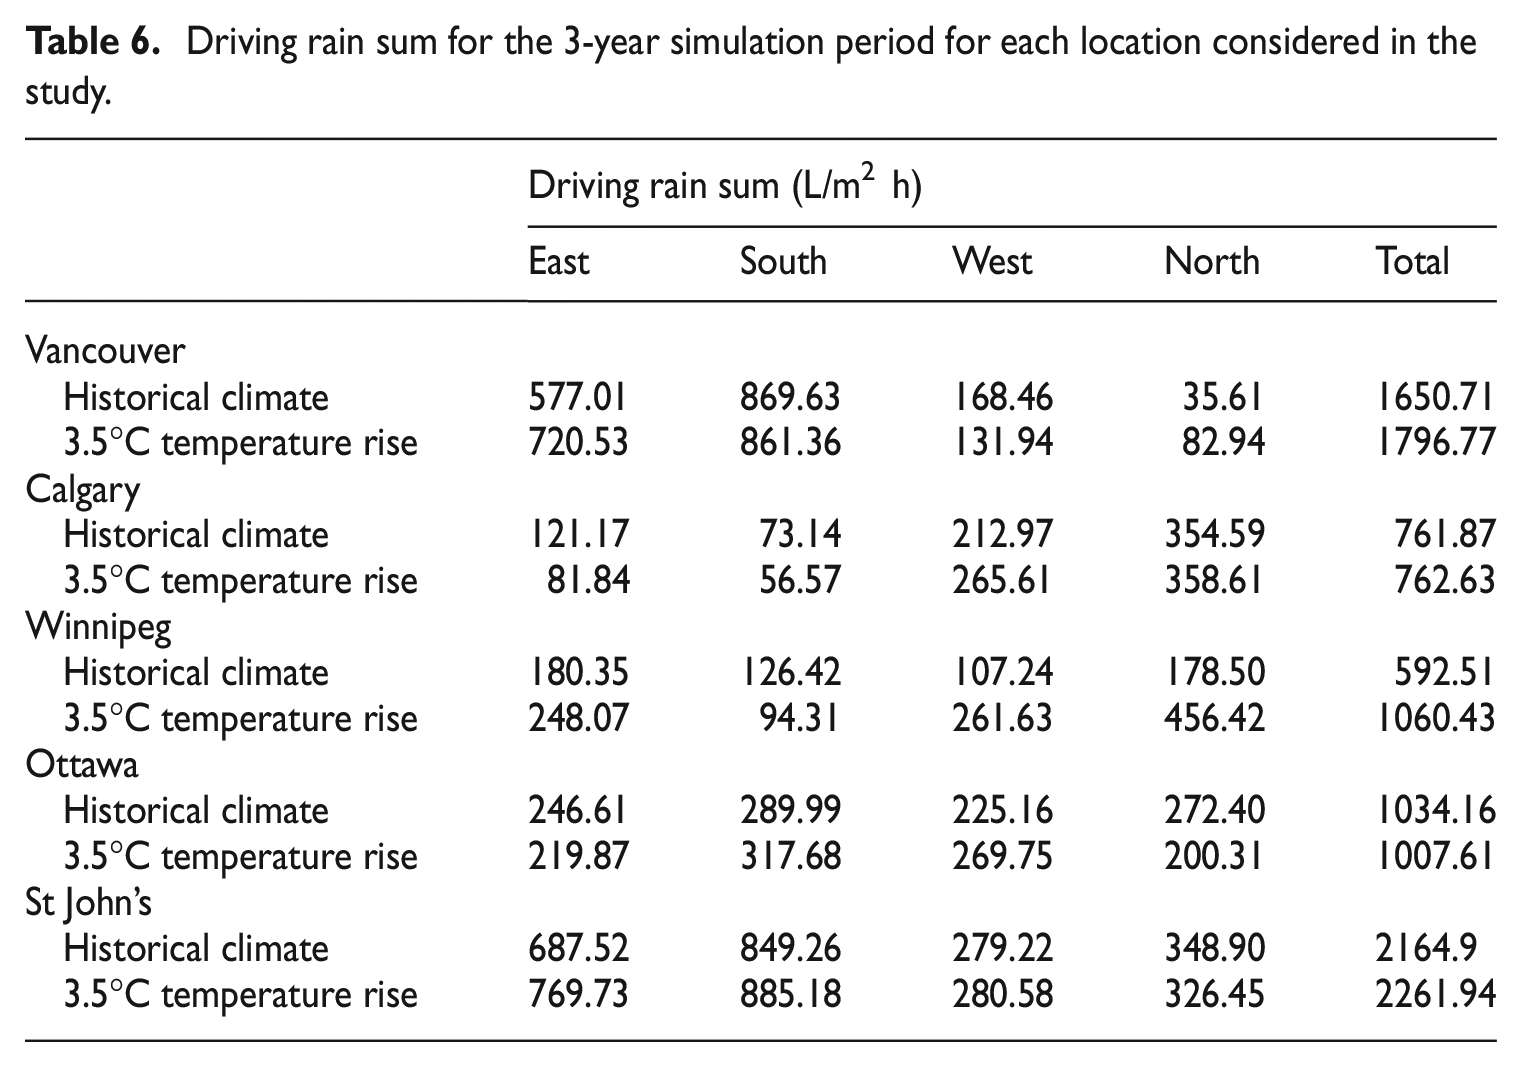
The total annual rainfall, mean annual temperature, incident solar radiation, driving rain and vapour pressure profiles for the historical and future climate files used for each location are presented below. As shown in Table 4, the total annual rainfall and mean annual temperature is projected to increase in the future climate scenario compared to the historic scenario for each city. The total incident solar radiation received increases for 11 of the 20 orientations in the future climate scenario compared to the historic climate scenario for all locations (Table 5), while the total driving rain received increases for four of the five locations (Table 6). As a result of an increase in mean annual temperature for each location, the exterior vapour pressure is higher in the future climate scenario relative to the historic climate (Figure 5).
Highest reported annual rainfall and average annual temperature for the cities of Vancouver, Calgary, Winnipeg, Ottawa and St. John’s using the 15 NRC future climate files analysed in this study for the period of 1986–2016 (historic) and 2062–2092 (future) 3.5°C temperature rise scenario.
Total incident solar radiation for the 3-year simulation period for each location considered in the study.
Driving rain sum for the 3-year simulation period for each location considered in the study.
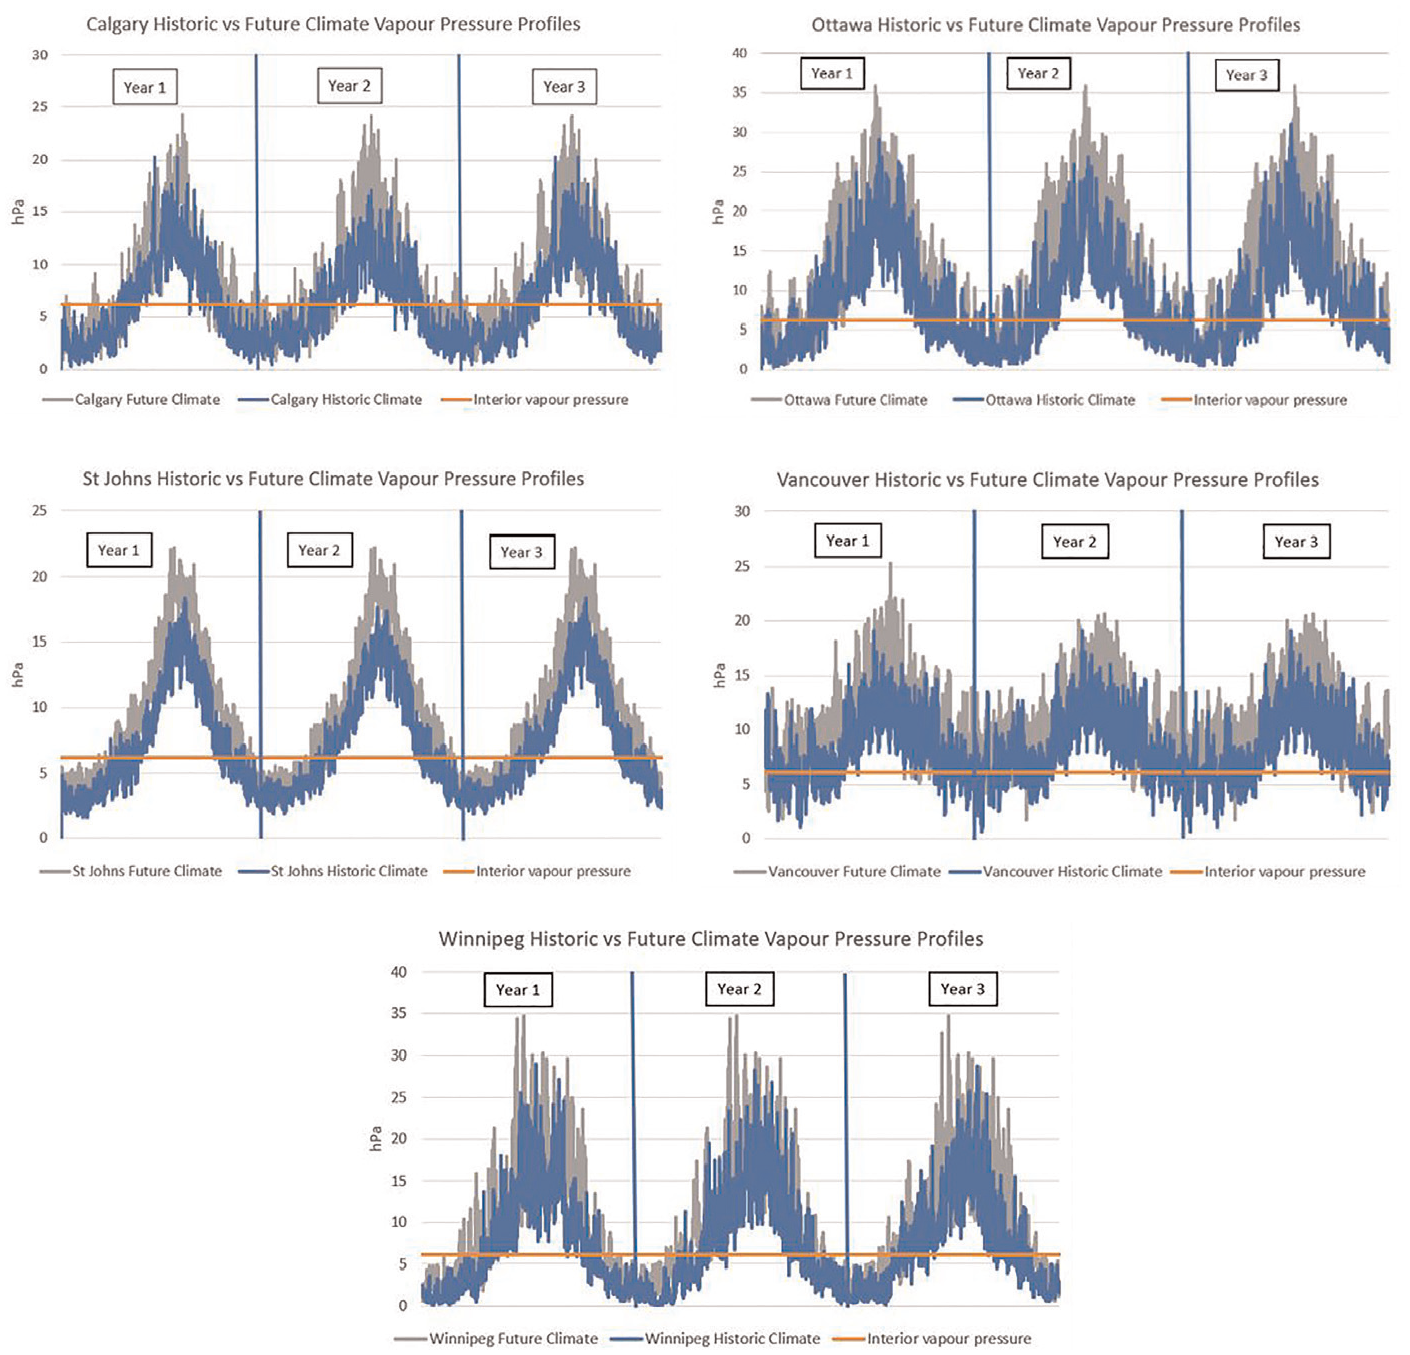
Historic vs future vapour pressure profiles for the cities of Calgary, Ottawa, Vancouver, St John’s and Winnipeg.
To evaluate the impact that the amount of annual rain received has on the performance of the assembly in each location, the time for the onset of mould growth was calculated using the regression formula developed by Isaksson et al. (2010) shown below in equation 3.

where t
ms = time (days) T = temperature (°C) Φ = relative humidity (%)
The model was developed using test results with spruce sapwood for relative humidities between 75
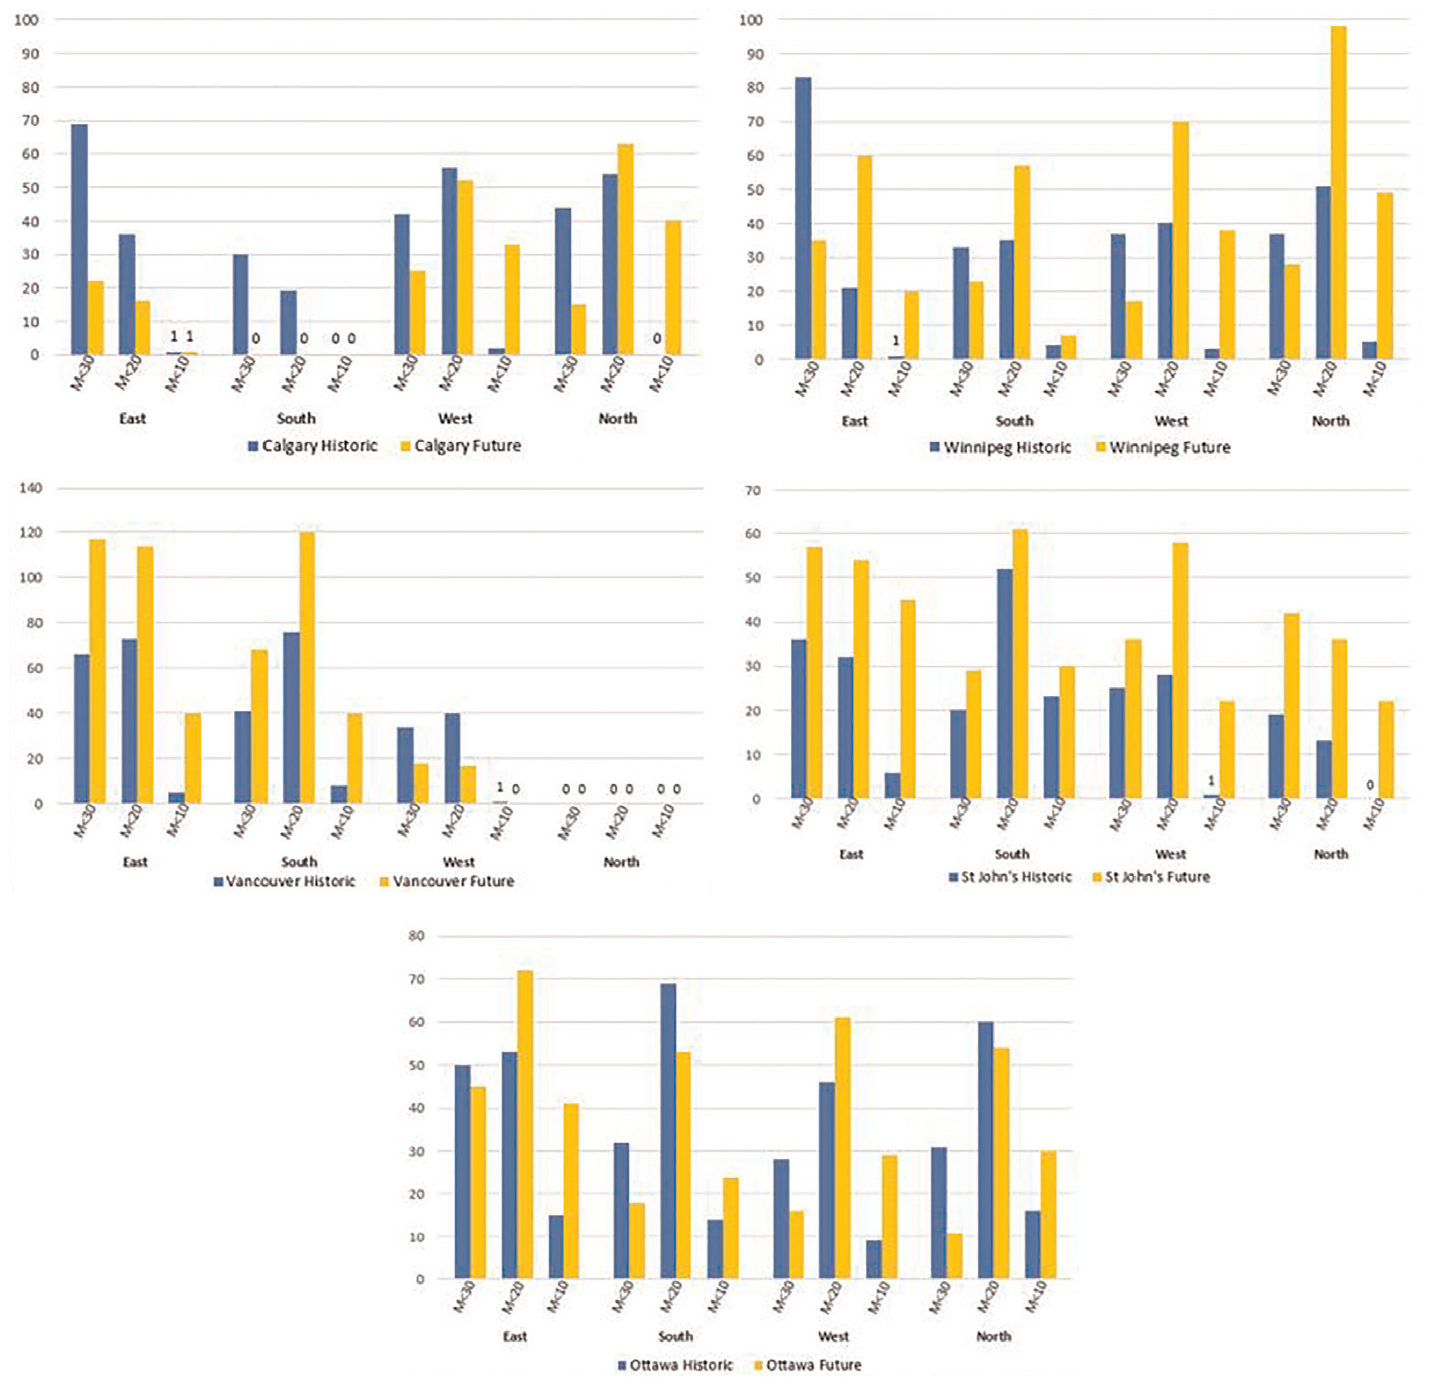
Total number of days for predicted onset of mould growth under the historic and future climate files for the cities of Calgary, Winnipeg, Vancouver, St John’s and Ottawa.
The predicted mould growth index value of the assembly for each city under the historic and projected future climate data are shown in Table 7. For this study, the critical value of the mould index (M) was set to level M = 3, resulting in visual findings of mould on the material surface (<10% coverage). A mould growth index value of 3 is considered risky as per the ASHRAE 160 Standard.
Mould index values for the WIRL wall assembly with a 1% rain leak for all orientations under the historic and future climate scenarios for each location.
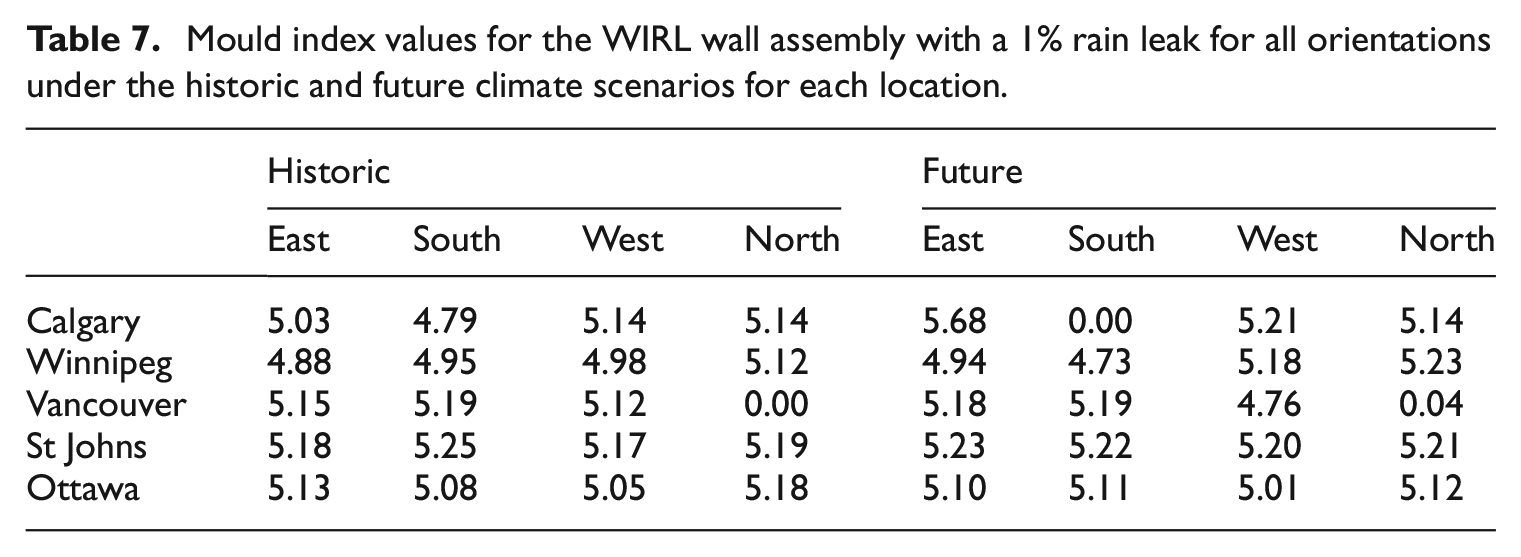
Table 7 shows the critical mould index value is exceeded (i.e. M > 3) under both the historical and future climate scenario by the end of the simulation period for the assembly in all but three orientations. The results for the city of Calgary show the southern orientation of the assembly under the future climate scenario does not exceed the critical value (M = 0) over the duration of the simulation period. The city of Vancouver shows similar results, with the mould index value for the northern orientation of the assembly under both the historic and future climate scenarios remaining below 1.
From the results we see that an increase in total annual rainfall does not directly result in a proportional increase in the failure rate of the assembly, nor do changes to the amount of driving rain received by the assembly in each orientation. For the assembly in the east orientation in the city of Calgary, the amount of driving rain received and consecutive days of predicted mould growth decreases or remains constant under the future climate scenario, but the mould index value increases from 5.03 to 5.68. The assembly in the north orientation in the city of St John’s also experiences a decrease in the driving rain received but increase in mould index value (5.19–5.21), however the number of consecutive days of predicted mould growth M < 30 or less increases under the future climate scenario. The assembly in the southern orientation experiences an increase in driving rain and consecutive days of predicted mould growth M < 30 or less in the future climate scenario, while the mould growth index value decreases. Similar results are shown for all other locations, with no correlation found between the amount of driving rain received or consecutive days of wetting resulting and response in the failure rate of the assembly.
The mould index criteria by Viitanen and Ojanen (2007) was developed as a model to assess the risk of mould development in building materials, and is able to account for periods of delayed growth, that is, dry conditions and low temperatures, which can inhibit germination or slow growth. The mould index is considered a reasonable tool to examine the predicted performance of a building or assembly under changing temperature and humidity conditions and can be used as one criterion for the moisture performance of the building envelope. Under the future climate scenarios included in this study, the WIRL thick-wall assembly experiences an increase in total annual rainfall but variations in the amount of driving rain received by the assembly in each orientation for the different geographic locations examined. Under the future climate scenarios, all locations experience an increase in average annual outdoor air temperature (Table 4), with temperatures increasing between 3.29°C and 5.33°C. An increase in vapour pressure is also observed (Figure 5), while the total incident solar radiation received increases in 11 of the 20 orientations (Table 5). As a result of the sum of climatic changes experienced in the future climate scenarios, the hygrothermal response of the thick-wall assembly is shown to vary in its response pattern and rate.
Conclusions
Previous research has shown that an increase in annual mean temperature and decrease in mean relative humidity can result in lower predicted moisture content values and risk of failure in the thick-wall assembly used for the construction of the Wood Innovation Research Laboratory building (WIRL) built by the University of Northern British Columbia in Prince George, BC, Canada compared to historical climate scenarios. A sensitivity analysis of the assembly found that neither the use of hygroscopic cavity insulation nor an increase in cavity airflow ventilation rates increased the moisture content of the exterior sheathing board above safe limits. Rainwater leakage values of 0.1% past the WRB did not have a significant impact on the long-term durability of the exterior sheathing of the assembly, however leakage values of 0.5% and 1% resulted in moisture content values above the safe limit within 2 years. When assessing the predicted hygrothermal performance of the assembly with 1% rainwater leakage under a 3.5°C global temperature rise scenario on the performance of the assembly, it can be concluded that additional climatic parameters outside of total annual rainfall, including outdoor air temperature, driving rain and incident solar radiation received must be considered before conclusions are drawn regarding the predicted hygrothermal performance of a given wall assembly.
Footnotes
Acknowledgements
The authors thank UNBC’s Facilities Management team and UNBC staff for providing information and support throughout the data collection and analysis that was used in the writing of this study. The authors would also like to thank Abhishek Gaur for providing the climate data.
Author contributions
Project administration, G.W.; funding acquisition, G.W.; Conceptualization, G.W., P.M. and A.C; Data curation, A.C.; Formal analysis, A. C.; Funding acquisition, G. W.; Methodology, A. C.; Validation, A. C.; Writing – original draft, A. C.; Writing – review & editing, P. M. and G. W. All authors have read and agreed to the published version of the manuscript.
Declaration of conflicting interests
The author(s) declared no potential conflicts of interest with respect to the research, authorship, and/or publication of this article.
Funding
The author(s) disclosed receipt of the following financial support for the research, authorship, and/or publication of this article: This research was funded by Forest Innovation Investment (FII).
Data availability statement
Climate data used in this study were obtained from Gaur, A.; Lacasse, M.; Armstrong, M. Climate Data to Undertake Hygrothermal and Whole Building Simulations Under Projected Climate Change Influences for 11 Canadian Cities. Data 2019, 4(2), 72 and are available online at ![]() . Data obtained from simulations in this study are available on request from the corresponding author.
. Data obtained from simulations in this study are available on request from the corresponding author.