
Abstract
An enormous range of building materials that is almost impossible to keep track of is available. The trend toward building densification in cities continues apace. Coupled with climate change, a situation is emerging that poses ecological as well as economic risks in terms of living comfort in public, urban spaces. Building designers need help (tools) to be able to address a wide range of requirements within their planning. The development of the Multi-Criteria Decision-Making (MCDM) model BASK (engl. “Construction Materials for Cities in Climate Change”) is presented. The goal of the model is to assist building designers in determining surface materials for wall, ground and roof construction and help determine the best compromise between environmental, economic, and building practice criteria. Currently available criteria are heat stress, visual reflectance, CO2 equivalents, electricity production, retrofitability, sound absorption, construction costs, and life span. The criteria can be weighted by the designer, resulting in a customized ranking of construction systems that best meets the designer’s prioritized criteria. The design of BASK basically allows for an extension of the criteria. The version of BASK described in this paper includes 10 construction systems covering a wide range of construction types focused on walls. The tool requires technical data for materials considered in construction systems included, which are made available via a data base. The scope of construction systems can also be extended in the future. Based on the restricted set of construction systems the results of a sensitivity analysis and initial validation are given.
Keywords
Introduction
Extreme heat waves are becoming more frequent because of climate change. Even in temperate latitudes, summer is now bringing increasingly hot temperatures that would usually be described as “tropical.” For example, the new heat record in Germany since July 2019 is 42.6 °C (ZEIT ONLINE, 2019). At the same time, the population as a whole is growing, but especially those living in urban regions (Bundesamt für Statistik (BFS), 2018). The resulting densification of urban areas increases the demands on inner-city construction measures, especially on the surfaces that come into contact with the environment.
This paper addresses the challenge of optimal construction selection of superficial materials. An MCDM model called BASK is presented, which can evaluate construction systems based on ecological, economic and building practice criteria. The aim is to provide a basis to increase the general quality of life and living within densely populated cities, such as Basel. To this end, a variety of surface materials used in construction systems are examined to determine what effects they have on the immediate surroundings in terms of various criteria. Surface greening, as often discussed in the context of ecologically valuable inner cities, is not addressed in this paper as it is generally considered to be an effective measure especially in regard to temperature control, albeit not always possible or desirable to implement. If needed, surface greenings could also be added to the list of construction systems in a later stage. However, the current lack of data for surface greenings regarding the different criteria due to the fact that they are a non-common construction system until now will pose a challenge.
A key criterion considered is the impact of surface materials on the thermal comfort of people, both at night and during the day. In densely built-up areas, significant heat stress can arise for pedestrians as a result of hot summer days (Oleson et al., 2015). In order to enable a holistic view of the environmental impact of superficial materials in addition to the thermal effects, acoustic or visual properties are also included in the assessment. Depending on the influence on the well-being of pedestrians, the constructions are classified as favorable or unfavorable. An ecological assessment is made based on CO2 equivalents. Other practice-relevant criteria, such as the costs of various constructions, their lifespan and the possibility of retrofitting, are also included in the evaluation. The developed MCDM is intended to support building planners in climate-adapted construction (Hoffmann et al., 2021).
Methodology
MCDM is used to evaluate different available alternatives within a problem. The alternatives are evaluated with respect to arbitrary criteria. The goal is to find the alternative that solves an existing problem in the best possible way. By weighting the criteria, the decision-making focus can be adjusted. The advantage of MCDM is the possibility to represent multiple, often conflicting criteria in only one output variable. In this way, a clearly defined ranking list can be created, which - taking into account the weighted criteria—virtually represents the best compromise for the problem solution. MCDM can be flexibly applied to existing problems and is at the same time intuitive and easy to understand.
The evaluation of a construction using the MCDM model BASK follows the scheme shown in Figure 1. The evaluation hierarchy is divided into two levels, the top-level criteria and the sub-criteria. The weighting Xn of the top-level criteria can be adjusted by the user according to his or her needs. Similarly, the user can decide on the weighting of the two sub-criteria of heat stress (in the current version, Mean Radiant Temperature (MRT) day and MRT night are used, however, also Ta could be used for Nighttime). The weights of the sub-criteria sound absorption are fixed.
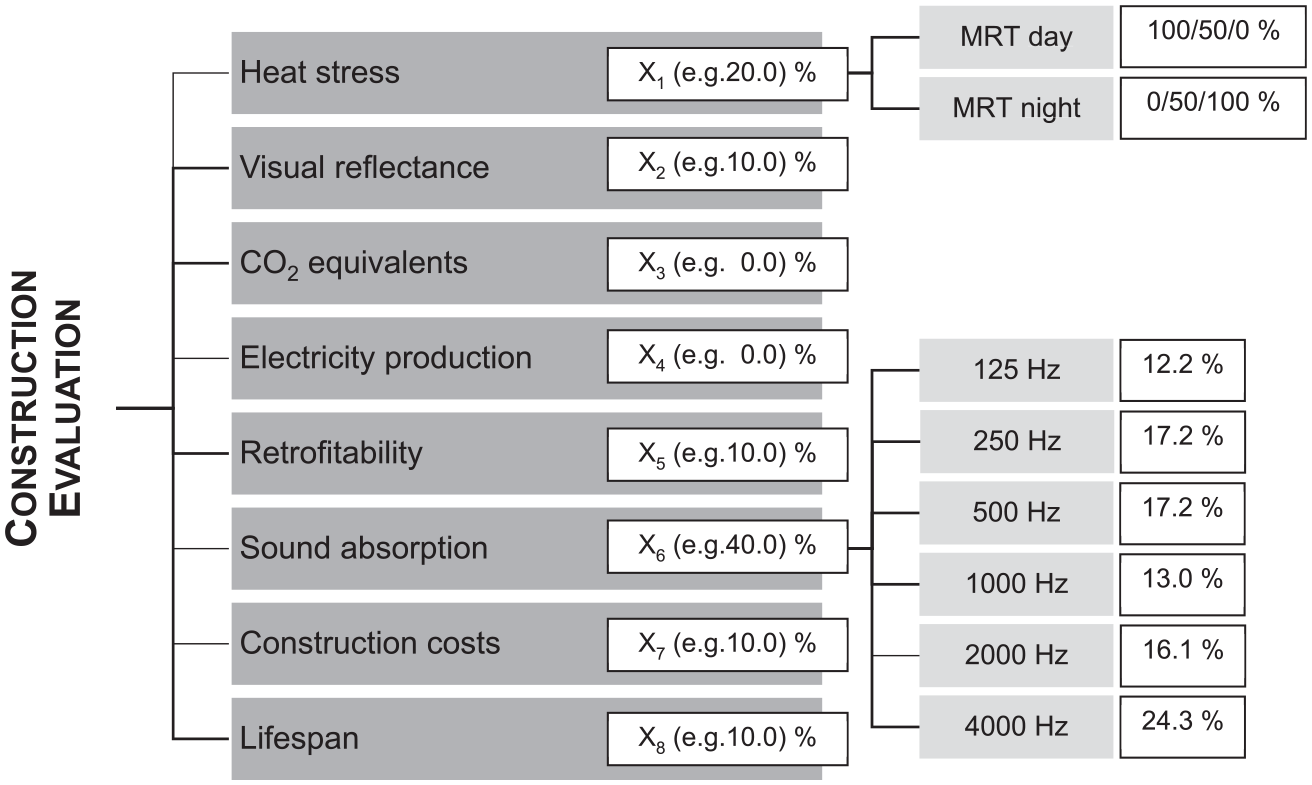
Measurement hierarchy with top-level criteria (dark gray) and sub-criteria (light gray). Individual criteria are weighted, the weightings used in BASK are given for the sub-criteria.
Analogous to the MCDM model developed from Josa et al. (2020), the construction evaluation in BASK is further carried out on the basis of so-called evaluation curves (see Appendix). The evaluation curves can have different characteristics, so that both linear and non-linear criteria can be considered simultaneously (Figure 2). The intermediate evaluation (Y-axis) of a construction can then be read off for each criterion based on the technical specification data value (X-axis) of a criterion. The threshold values on the X-axis correspond to the minimum and maximum data values contained in the database for the respective criterion. The total score of a construction is obtained by summing all the individual intermediate scores of the criteria. Flexible weighting inputs allow individual criteria to be weighted more heavily in the construction evaluation or to be ignored altogether. As a result, the user receives a ranking list of construction systems that are optimal—in the sense of the best possible compromise—for his or her specific building project with the prioritized evaluation criteria.
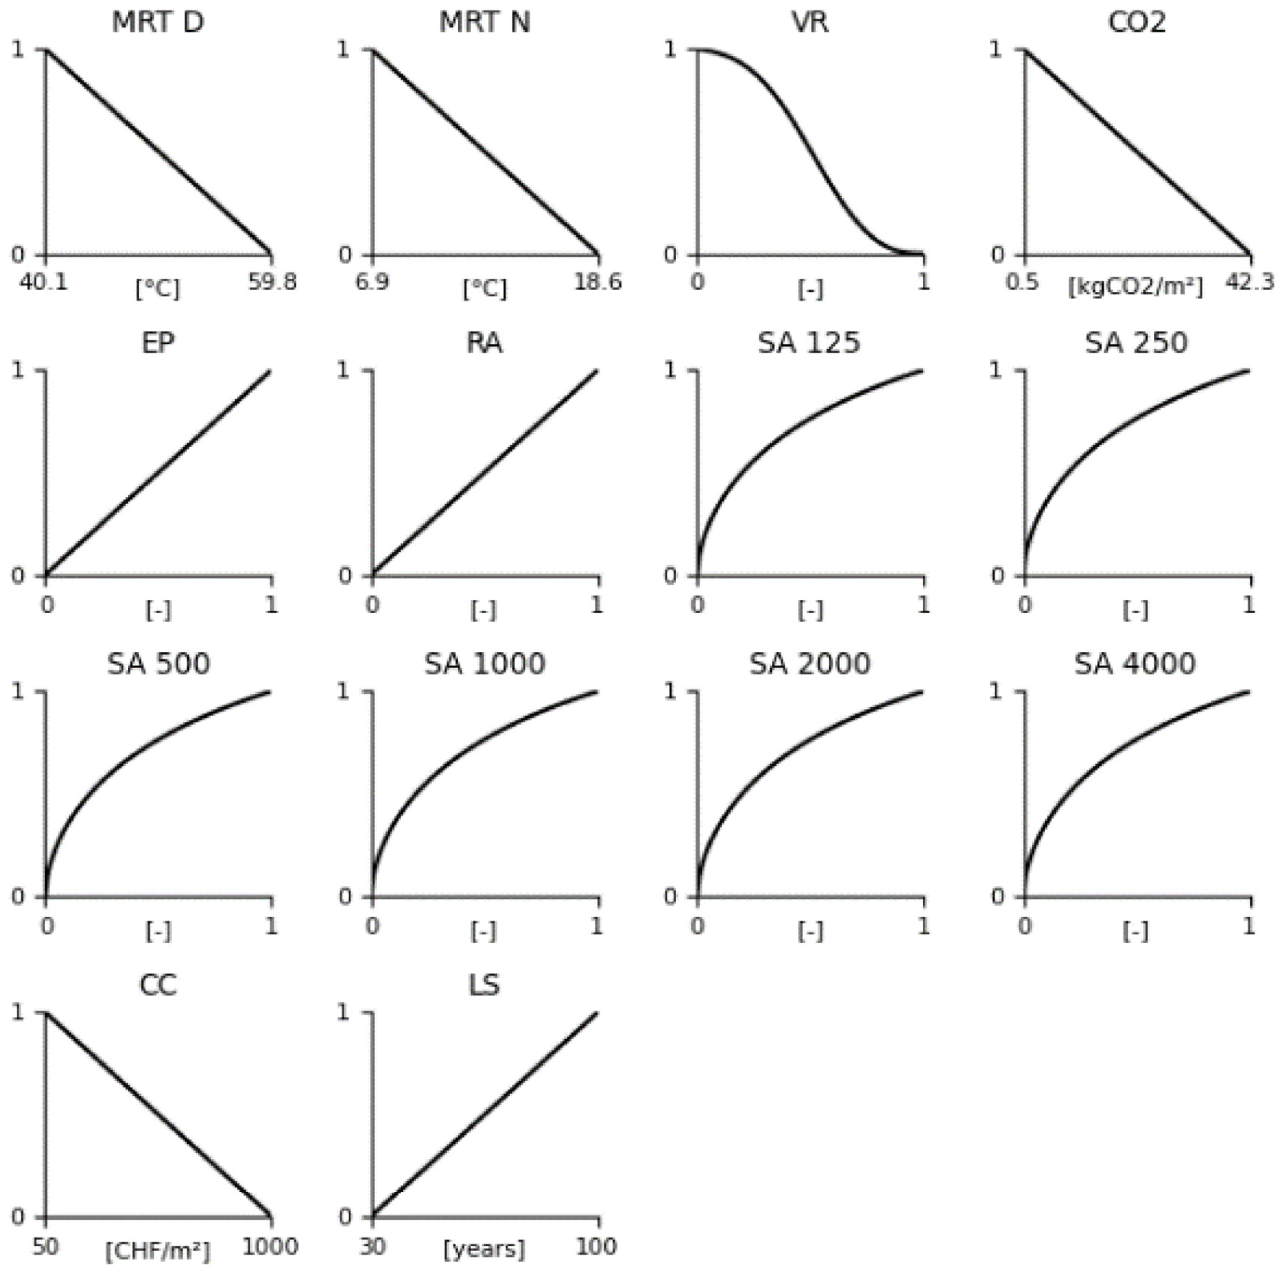
Evaluation curves used to determine the unweighted intermediate score of the criteria (see Appendix). MRT D/N: MRT day/night; VR: visual reflectance; CO2: CO2 equivalents; EP: electricity production; RA: retrofitability; SA i; sound absorption at frequency i; CC: construction cost; LS: lifespan.
The technical specification data that BASK evaluates is stored in an SQL database (Figure 3). This is composed of the construction categories, each of which lists the evaluation criteria mentioned above. The number of categories as well as the number of criteria are basically expandable.
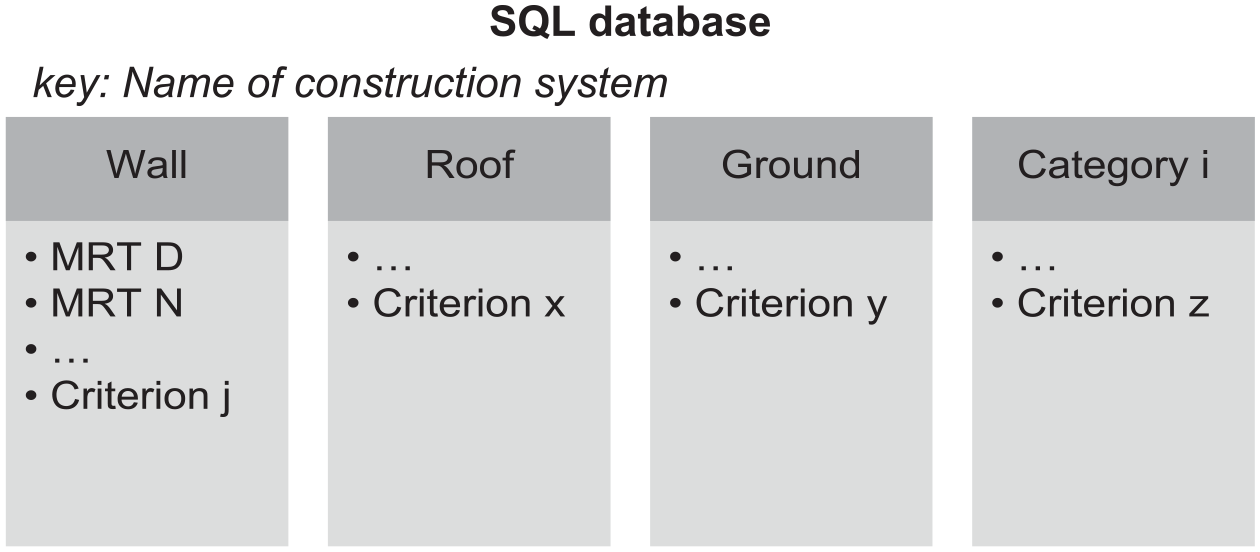
SQL database schema.
After coding the MCDM system described, a sensitivity analysis is performed to check the robustness of BASK’s results. The sensitivity analysis is based on a statistical approach.
Development of BASK
Framework of the criteria
The framework of the considered criteria defines the limits of the construction system evaluation and corresponds to the current development stage of BASK.
Heat stress
The data for the evaluation of heat stress on pedestrians is taken from thermal simulations in the simulation program ENVI-met (ENVI-met V 4.4.4, 2020). A typical street canyon of the city of Basel is used as basis for the simulation model. The parameter used as data value for BASK is the calculated Mean Radiant Temperature (MRT), which occurs in the simulation model at the selected measuring points when using different construction systems. The maximum and minimum MRT values (cf. Table 2) used for the construction evaluation correspond to the average simulated MRT in the period from 10:00 to 16:00 for “day” and 0:00 to 6:00 for “night.”
Visual reflectance
Visual reflectance is described by the diffuse visual reflectance. This is a surface property and quantifies the percentage of visible light rays that are diffusely reflected from a surface when the light rays strike it. The visual reflectance of a (opaque) structure is determined solely by its outermost construction material. If a coating is applied to this material, the visual reflectance changes accordingly. High degrees of reflection are classified as disturbing and thus negative due to glare.
CO2 equivalents
The CO2 equivalents record the global warming potential of a construction. The decisive factor in the context of BASK is not the entire construction, but only the outermost construction system, for example exposed concrete, facing bricks, wood cladding, etc. In this initial development, the underlying insulation is not included. In principle, these construction systems can be applied to various insulation and load-bearing structures. Therefore, the approach used is that the estimation of the global warming potential is not bound to fixed substructures but only refers to flexibly usable covering construction systems. The value of the CO2 equivalents is given in kgCO2 equivalents per m2 of this outermost construction system. It depends on the assumed thicknesses of the construction system layers, which are fixed for the time being. Again, in the context of the initial development of BASK the values used in regard to CO2 equivalents refer only to the production of the materials (values mainly from Ökobilanzdaten im Baubereich 2020-II (n.d.) or scattered from Hein and Schwarte (2019) and Werner et al. (2006)). This includes raw material extraction, transport to the manufacturer and subsequent production of the material. The approach described here has two caveats. For example, the construction aerogel plaster with finishing plaster includes the insulating layer. Thus, it does not strictly fit above mentioned criteria. However, including the finishing plaster only disregards the main CO2 equivalent load due to the aerogel. Also, it is quite common to include disposal of the materials as well when reporting CO2 equivalents. Both these issues could easily be addressed in a later version of the MCDM and do not bear on the system design and initial testing.
Electricity production
Electricity production considers the binary decision whether a construction is capable of producing electricity or not.
Retrofitability
The retrofitability criterion is used to determine how much work is required to dismantle a structure. The deconstruction also refers only to the construction system without its substructure. This criterion can be used to take into account situations in which the outermost construction system has to be renewed, for example at the end of its lifespan or in the case of damage.
Sound absorption
The sound absorption coefficients record the absorption behavior of the surface material at the six octave band center frequencies between 125 and 4000 Hz. The sound absorption coefficient defines how much sound energy is absorbed by the construction surface when the sound waves hit it. High sound absorption has a reducing effect on the reverberation time in a street canyon. Small reverberation times mean that the sound pressure level of sound events decays more quickly and is thus perceived as disturbing for a shorter time. Section 4 explains the treatment of sound absorption in detail. The diffusivity of the sound field is not included.
Construction costs
The construction costs include labor and material costs for the application of the construction system without its substructures. The following cost items are explicitly not included:
Substructure
Site equipment (e.g. for scaffolding)
Substrate preparation (for absorbent or non-absorbent substrates)
Subsoil consolidation (for trickling or solid subsoils)
Lifespan
The lifespan estimates the period during which the construction system is typically functional. The values are merely indicative. Under favorable conditions, a construction system may well fulfill its function for a longer period. Proper application/installation by the craftsman is assumed in all cases.
Criteria weighting
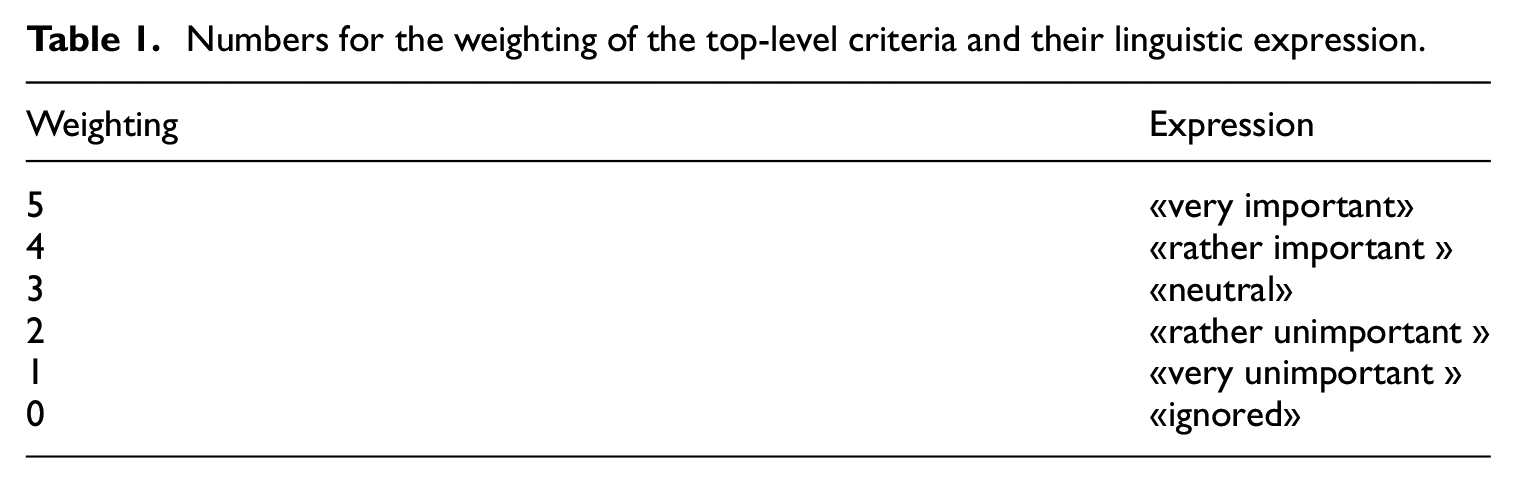
The weighting of the top-level criteria is done via user input of a number between 0 and 5 for each criterion. A “0” means that the criterion is switched off, i.e. is not taken into account. The weights entered are normalized so that the total weight of the top-level criteria is always 100%. Subsequently, the normalized weights are multiplied by the intermediate evaluations of the top-level criteria obtained via the evaluation curves. The influence of the top-level criteria is thus increased as a function of the selected weight. The linguistic expressions associated with the weighting factors can be seen in Table 1.
Numbers for the weighting of the top-level criteria and their linguistic expression.
For the sub-criteria MRT day and MRT night of the top-level criterion heat stress, the user can choose between three weighting scenarios. These allow the user to focus on heat stress during the day or night. Depending on the reflection and heat storage capacity, materials have strongly opposing influences on the heat stress during day and night.
Construction systems
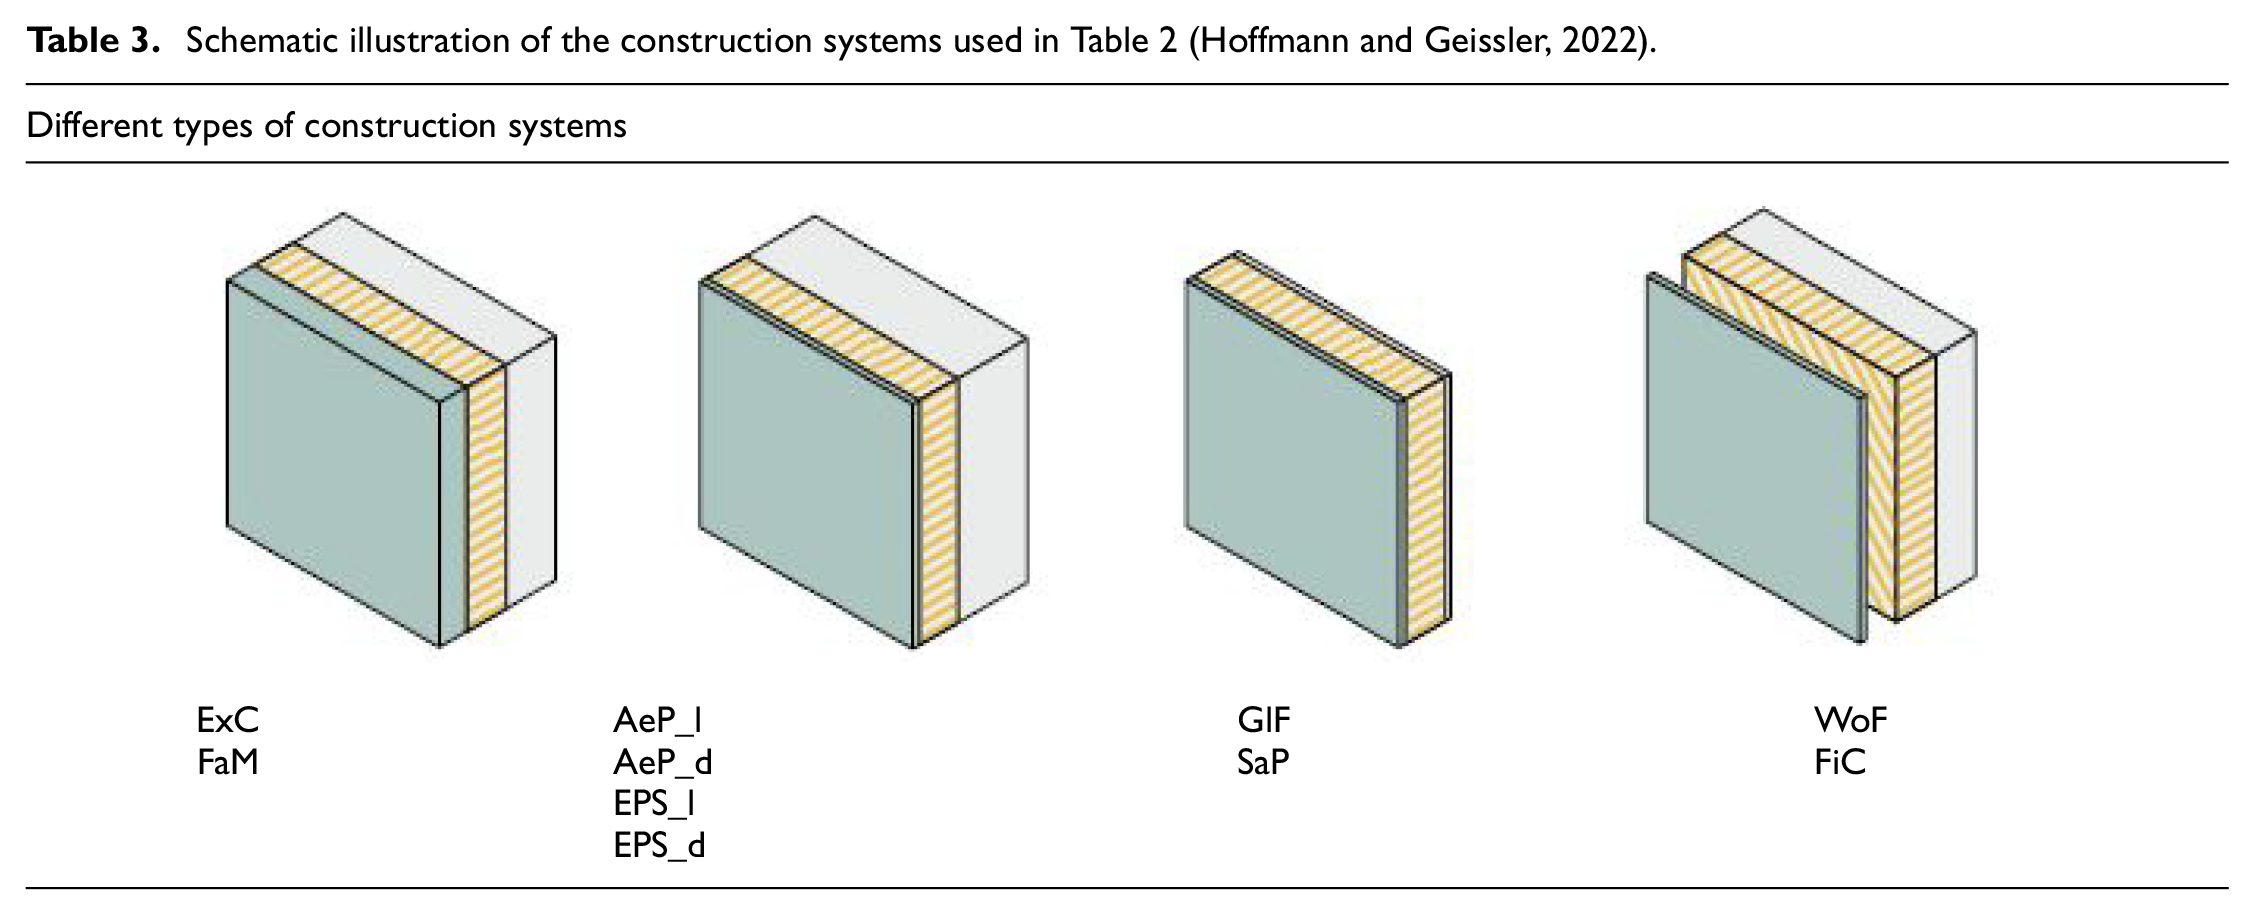
BASK is developed based on one construction category (wall) and 10 exemplary wall construction systems. Further categories, construction systems as well as new criteria can be added to the underlying SQL database at a later stage (see Figure 3). The comparison of construction systems and the creation of rankings should always be done within one construction category. Table 2 below shows all wall construction systems considered within the scope of this paper, Table 3 illustrates the systems. The construction systems are listed separately from the deeper, thermally effective materials. For the evaluation of the influence of different construction systems on the heat stress, the approach of the evaluation by means of the construction systems alone is too inaccurate. In the heat exchange between the wall and the outside air, deeper construction materials may also be involved. These must be taken into account in the design of the simulation model, so that the construction system evaluation based on heat stress can no longer be based exclusively on the outermost construction system. For example, the construction systems “AeP” and “EPS” are each considered with two different coatings. This influences on the one hand the visual reflectance (0.70 → 0.30) and on the other hand the solar reflectance or the albedo (0.77 → 0.32), which has an influence on resulting MRT values.
Technical data of the 10 construction systems relevant for the evaluation or deeper lying materials relevant for the heat stress.
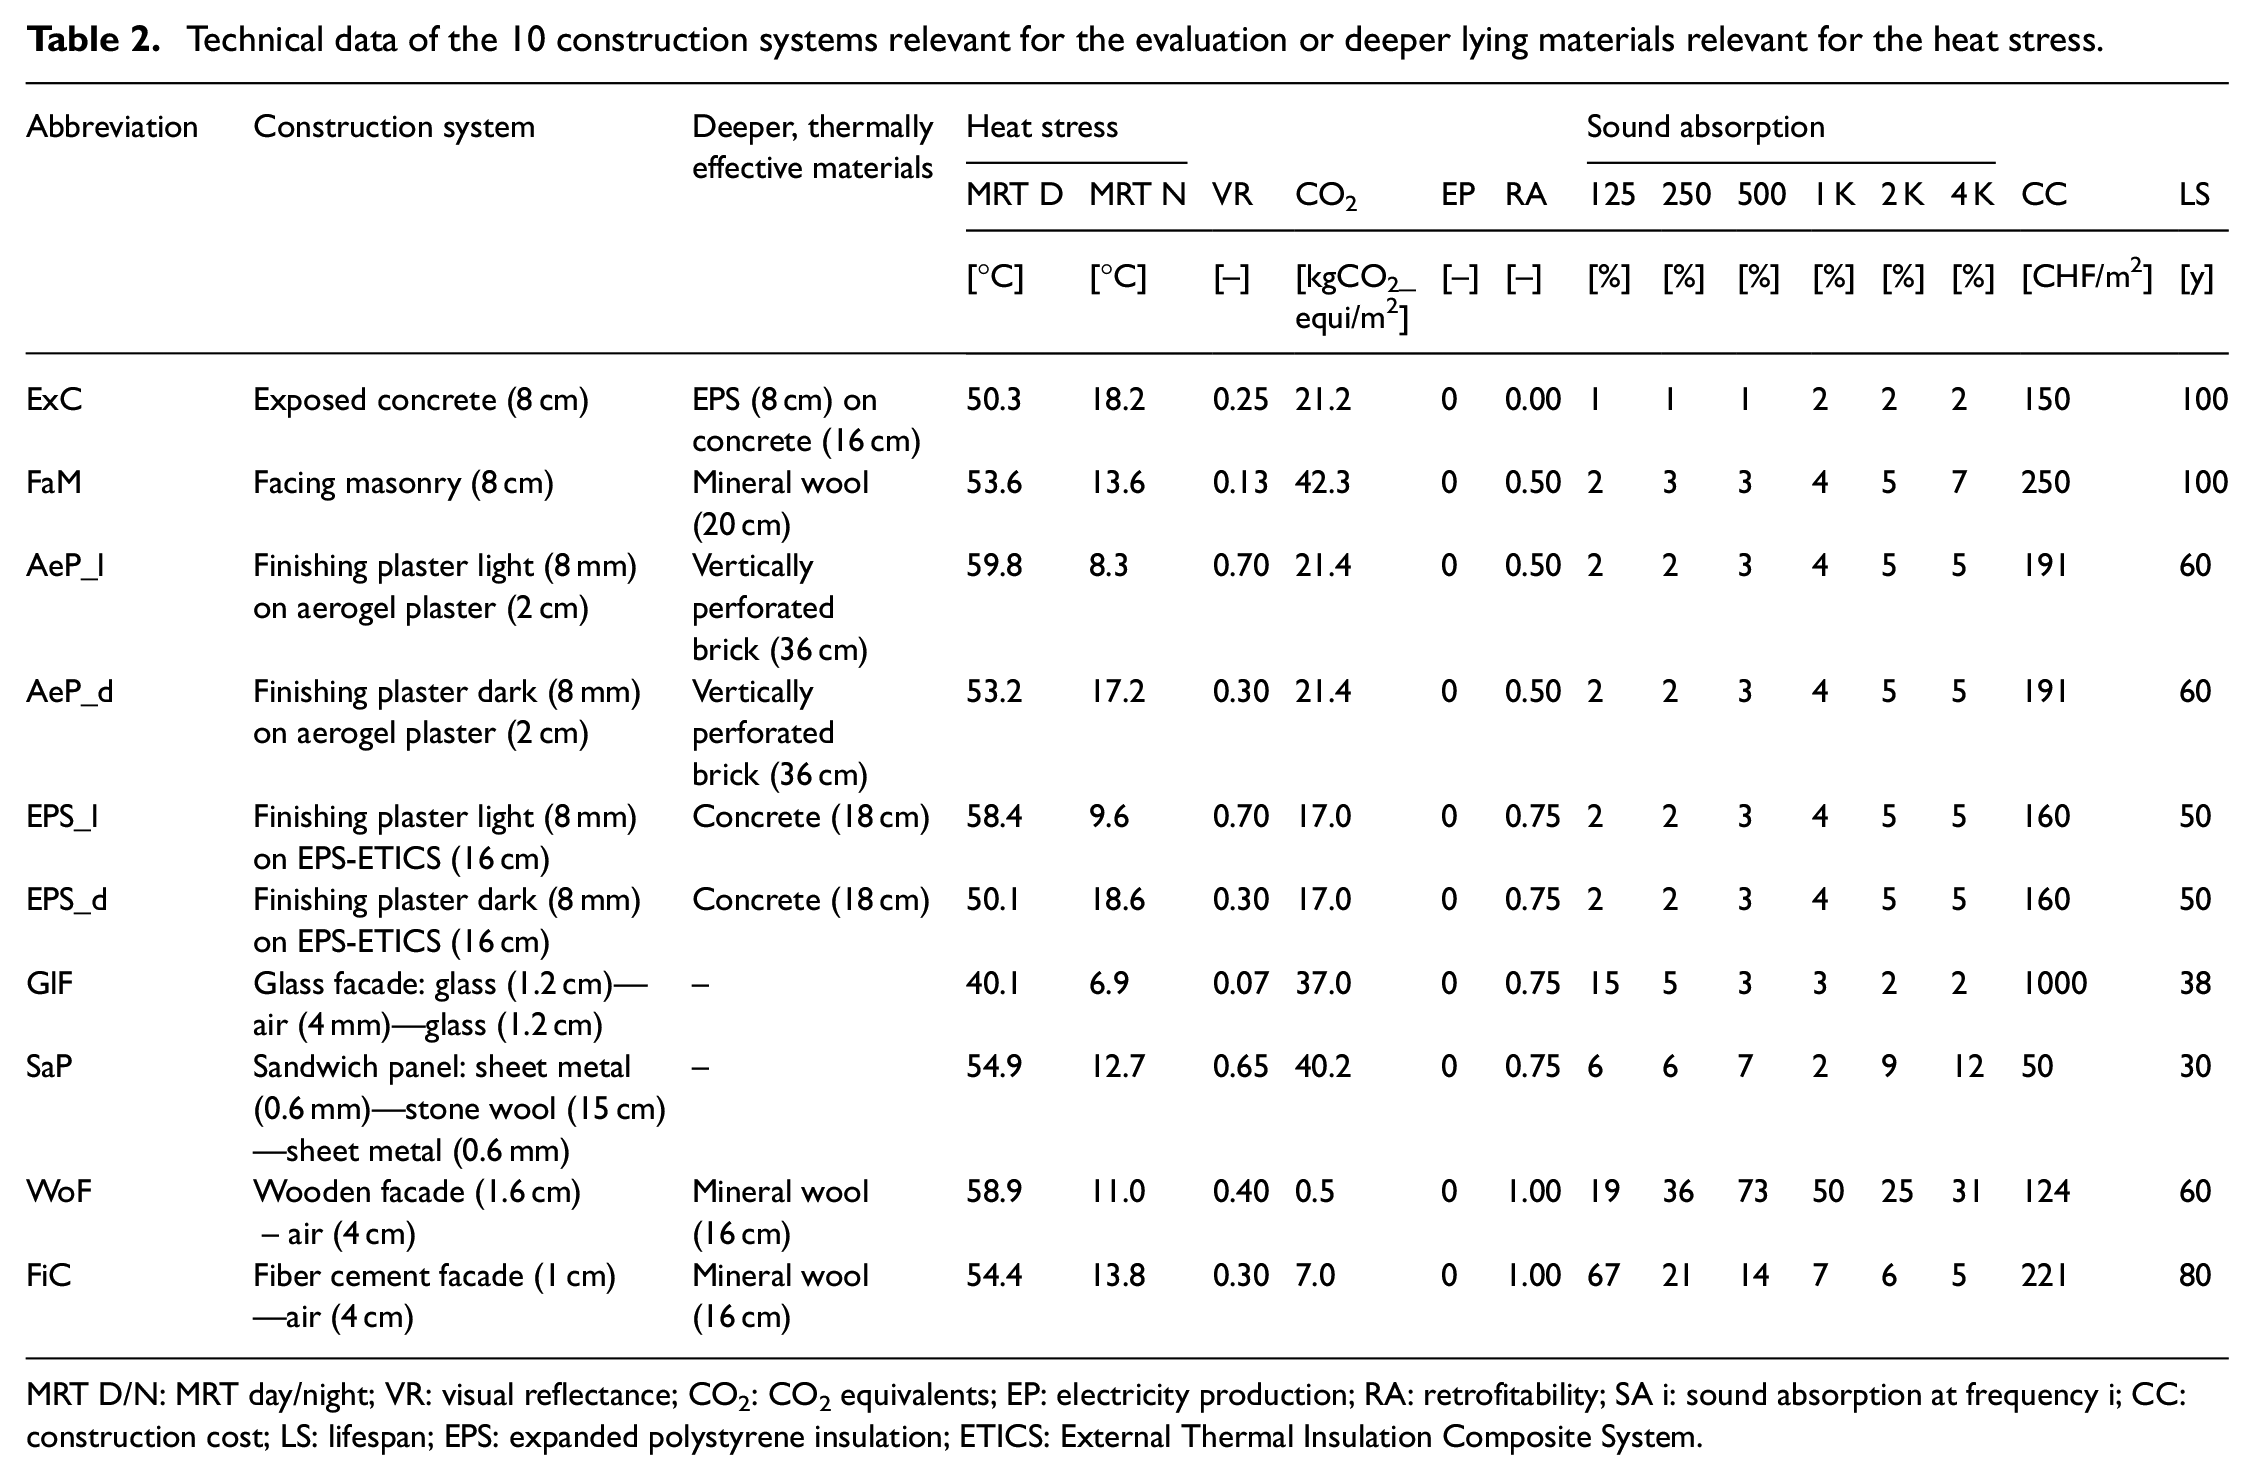
MRT D/N: MRT day/night; VR: visual reflectance; CO2: CO2 equivalents; EP: electricity production; RA: retrofitability; SA i: sound absorption at frequency i; CC: construction cost; LS: lifespan; EPS: expanded polystyrene insulation; ETICS: External Thermal Insulation Composite System.
Schematic illustration of the construction systems used in Table 2 (Hoffmann and Geissler, 2022).
Evaluation of acoustic properties
The acoustic properties of a construction are evaluated based on the sound-absorbing properties of its outermost (surface) layer. A short overview in Section 4.1 shows that many other aspects have an influence on the acoustics. However, in the context of BASK an evaluation must be made on the basis of one or more technical specification data values. The difficulty in the acoustic evaluation of construction systems has several reasons. Sound propagation shows nonlinear physical relationships (Section 4.2). Also, it is common in construction practice that available acoustic material data is confined to coefficients of sound absorption, typically for six frequency bands. This necessitates the development of a suitable methodology for combining six intermediate evaluations into a single evaluation and restricts BASK to the top-level criterion sound absorption (Section 4.3).
Sound propagation in street canyons
The propagation of sound waves behaves in a very complex way depending on the geometry of the street canyon and the properties of its surfaces. Literature that examines sound propagation in street canyons in detail always refers to acoustic measurements or computer simulations (Hornikx and Forssén, 2009; Hornikx et al., 2018; Jang et al., 2015; Kang, 2002; Onaga and Rindel, 2007; Yu et al., 2019). Analytical calculation models reach their limits due to the many influencing factors. The increased complexity of street canyons compared to classical room acoustics can be seen in several aspects. One of the most obvious differences are the properties of the surfaces. A street canyon is usually open to the sky at its ends and at the top. These openings basically act as very strong absorbers, since no sound waves can be reflected (Onaga and Rindel, 2007). In addition to the openings, the construction surfaces can also have a sound-absorbing effect. Increased sound absorption levels are able to reduce the occurring sound pressure level within street canyons (Hornikx and Forssén, 2009; Kang, 2002). Similarly, the sound-absorbing effect of pitched roofs should not be neglected in acoustic planning (Hornikx and Forssén, 2009). Furthermore, the space volume also has an influence on sound propagation. As the volume increases, the proportion of sound absorbed by the air and the hydrogen molecules it contains increases (Lerch et al., 2009: 228). Regarding geometry, the height-to-width ratio of the street canyon is also a defining factor. This is because sound is reflected more quickly and more strongly into the sky in low and wide street canyons (Onaga and Rindel, 2007). As a result, the reverberation time is also lower than in high street canyons, which has a positive effect.
These explanations of the factors influencing sound propagation within street canyons clearly show that the evaluation based solely on sound absorption coefficients is by no means conclusive. One can say that in spacious, wide and low street canyons choosing a construction system with a high absorption coefficient won’t increase the acoustic comfort as much as the same construction system would increase the acoustic comfort in a small, narrow and high street canyon. However, BASK is aimed at usage in the design stage of buildings or clusters of buildings, where the layout of the street canyon can be assumed to be given/immutable. Therefore, the absorption coefficient of surfaces can be considered to be the parameter which has the biggest influence on sound propagation and can be chosen by the designer. For an initial recommendation within the framework of BASK, this reduction is considered a permissible simplification.
Derivation of the evaluation curve
Due to the lack of analytical calculation models for sound propagation within street canyons, the influence of the sound absorption coefficient is estimated based on classical room acoustics. In the context of the acoustic evaluation of BASK, this shall serve as a first justified assumption. An important quantity in room acoustics is the already mentioned reverberation time. It is defined as the period of time “in which the sound energy in the room decays to the millionth part of its initial value after a sound source has been switched off” (Willems et al., 2017: 443). In the logarithmic scale, this corresponds to a sound pressure level drop of 60 dB. The reverberation time can be estimated according to both Sabine and Eyring (Figure 4). The formula according to Sabine is more applicable to rooms with a weakly diffuse sound field and an average sound absorption coefficient of up to approximate 0.25 (Willems et al., 2017: 444). On the other hand, the formula according to Eyring is particularly suitable for rooms with higher average sound absorption coefficients and a strong diffusivity of the sound field.
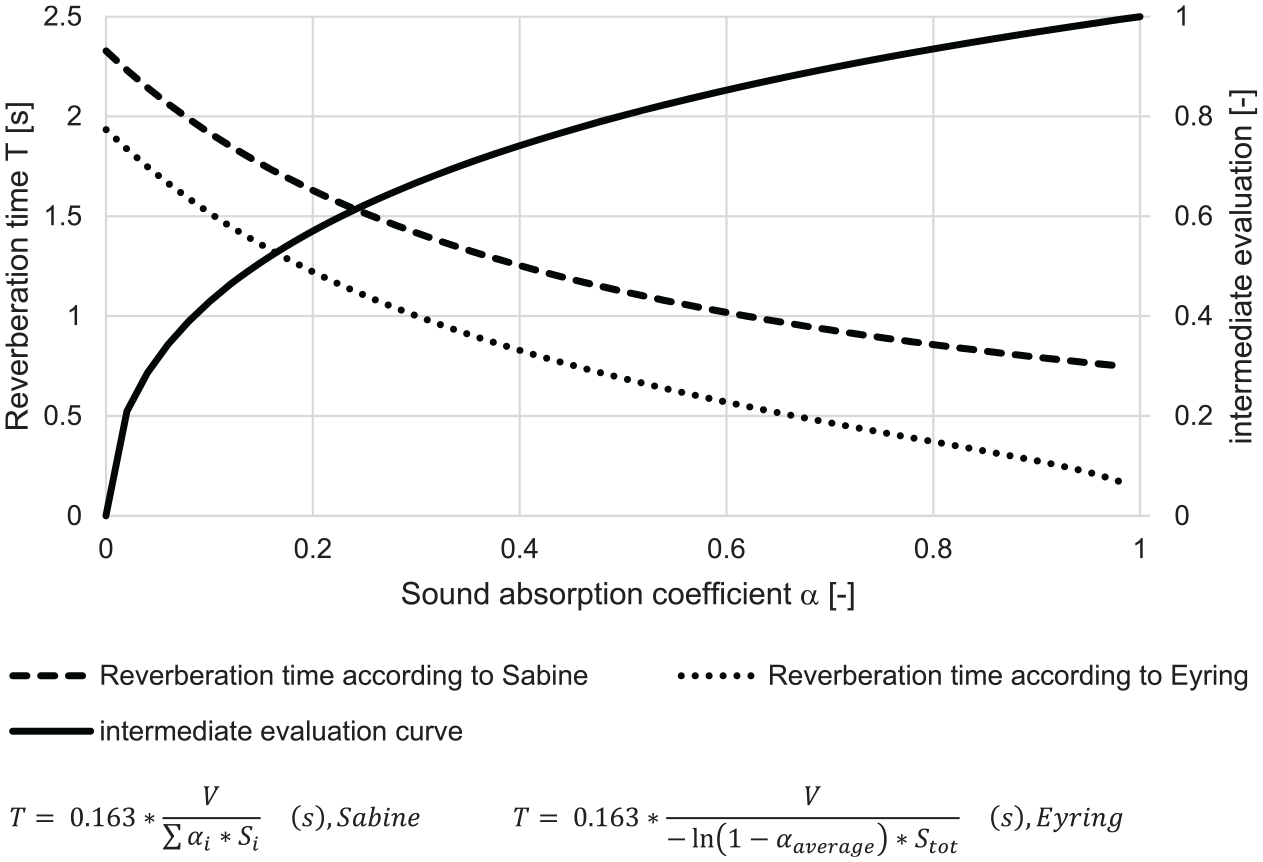
Reverberation times of a street canyon (20 m × 20 m × 100 m) as a function of the sound absorption coefficient α of the adjacent surfaces according to Sabine (dashed) and according to Eyring (dotted). The derived evaluation curve for BASK is shown solid (see Appendix).
The quantification of the influence of the sound absorption coefficient on the reverberation time and thus on the course of the evaluation curve is based on an exemplary street canyon with the dimensions 20 m × 20 m × 100 m (H * W * D). Figure 4 below shows the course of the reverberation time according to Sabine and Eyring as a function of the sound absorption coefficient of the ground and the walls of the street canyon. The absolute values play a subordinate role for the evaluation of the construction systems. What is important is the course of the curve of the reverberation time. This is very similar according to both Sabine and Eyring. An increase in the weakly absorbing range of the sound absorption coefficients results in a greater reduction of the reverberation time than the same increase in the already strongly absorbing range. Also shown in Figure 4 is the derived evaluation curve used in BASK. With this curve, the highest rating of a construction is achieved for a sound absorption coefficient of 1.0. At the same time, increasing the sound absorption coefficient from 0.1 to 0.2 leads to a greater increase in the intermediate rating than increasing the sound absorption coefficient from 0.7 to 0.8. The sensitivity analysis shown in Section 6 confirms that this course of the evaluation curve is suitable for the construction evaluation.
Weighting of the frequency ranges
Healthy and young people can perceive sound in the frequency range from about 16 Hz to 20 kHz (Willems et al., 2017: 435). However, the edge frequencies from this range hardly play a role in acoustic planning in the building industry. It is therefore common practice to specify the sound absorption coefficients in the frequency range from 125 to 4000 Hz, in each case for the octave band center frequencies (Willems et al., 2017: 455–458). The six resulting values form the basis of the construction evaluation with BASK with regard to sound absorption. The differentiation of the sound absorption coefficient for different frequencies is necessary because, on the one hand, the sound power impinging on a surface can be absorbed by a construction to a different extent depending on the frequency and, on the other hand, the subjective perception of the human auditory system depends on the frequency (Willems et al., 2017: 435).
In principle, the greater the sound pressure level Lp, the louder the sound is perceived by humans. In order to quantify subjective perception, another acoustic quantity is required in addition to the sound pressure level Lp, namely the loudness level LN. The loudness level is given in the unit “phon” and takes the frequency-dependent sensitivity of the human ear into account. The relationship between sound pressure level Lp, loudness level LN, and frequency f is shown in Figure 5.
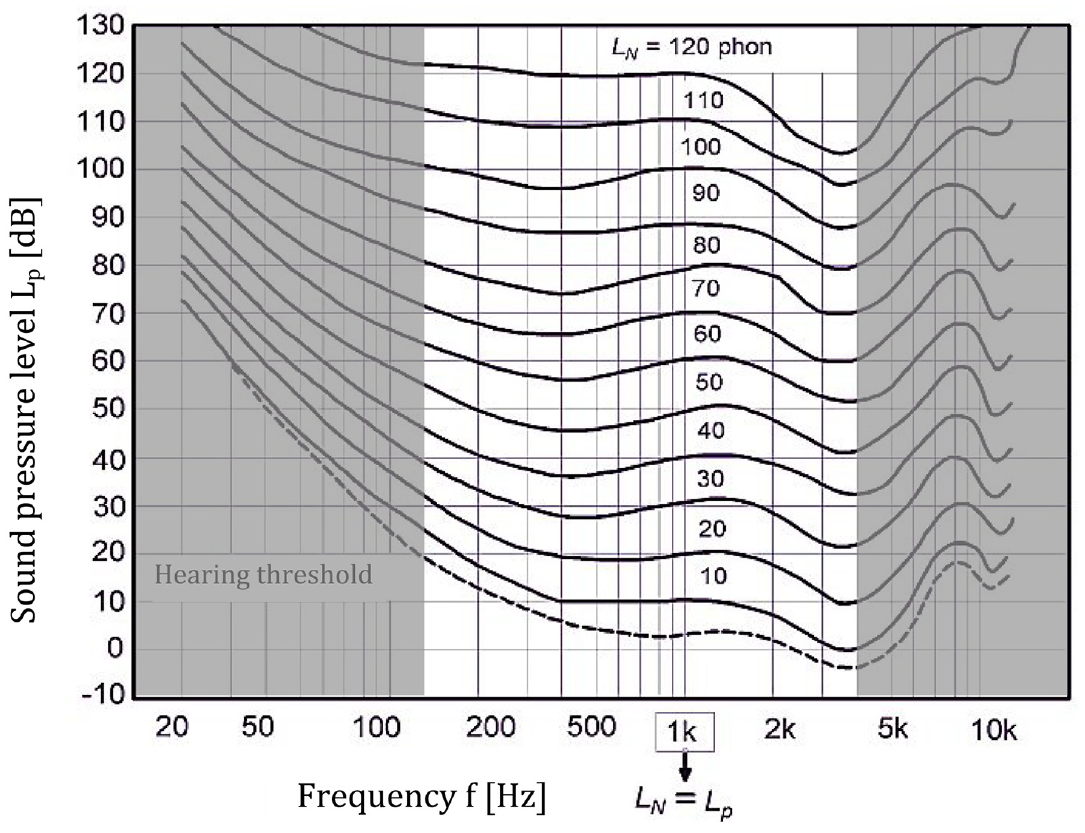
Relationship between sound pressure level Lp, volume level LN, and frequency f, adapted from Willems and Stricker (2012: 55).
The course of the isophones in the frequency range from 125 to 4000 Hz shows that low frequencies require a higher sound pressure level LP to generate the same subjectively perceived loudness level LN. For construction evaluation, this means that the sound absorption coefficients of the higher frequencies must be weighted more heavily than those of the low frequencies, since the human ear is more sensitive in this range.
To handle the subjective loudness level in a linear scale of values, another acoustic quantity is used, the loudness N in sone. The relationship between the loudness level LN in phon and the loudness N in sone is shown in Figure 6.
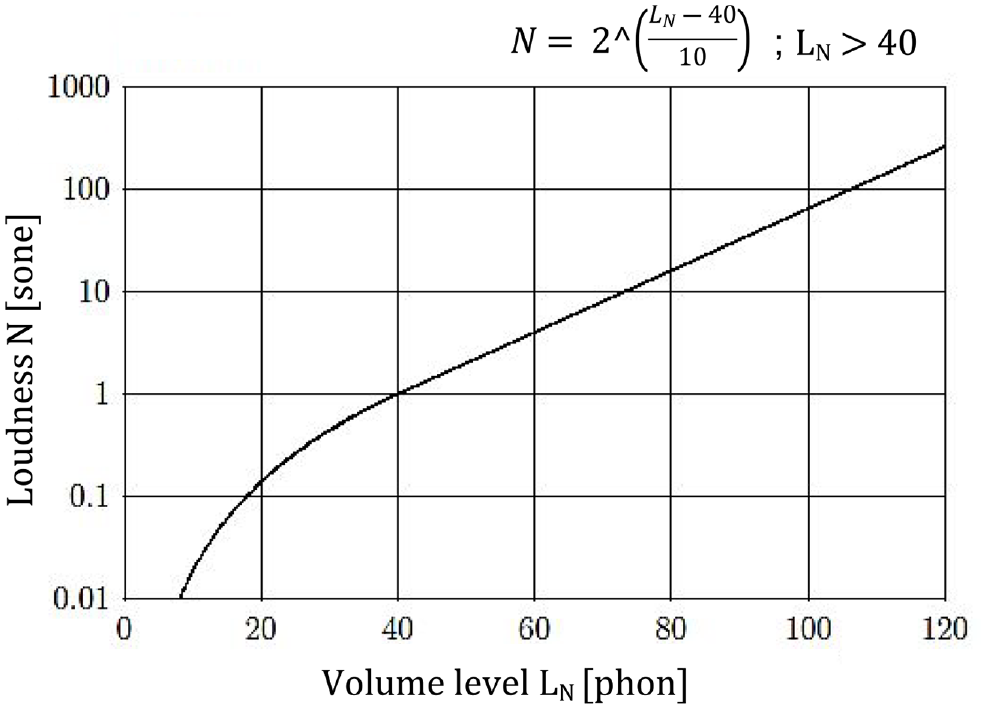
Relationship between volume level LN and loudness N. A volume level LN of 40 phon corresponds by definition to a loudness N of 1 sone, adapted from Lerch et al. (2009: 197).
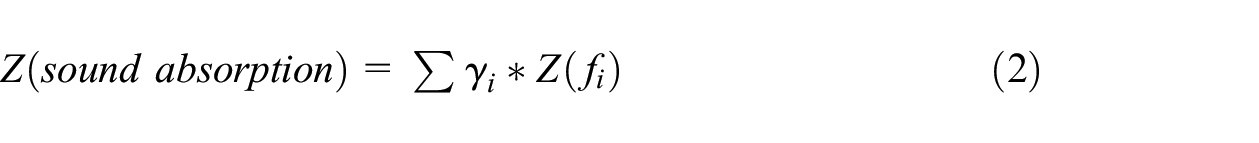
The weights of the six sub-criteria of sound absorption can be derived with the correlations between sound pressure level Lp, loudness level LN, and loudness N. For this purpose, the loudness level LN,i is determined according to Figure 5 for each octave band center frequency fi for a sound pressure level Lp,i = 70 dB (expected value for “center-near residential location” (Ziemann et al., 2007)) and subsequently converted into loudness Ni according to Figure 6. The weight i of the individual frequencies fi is then determined using equation (1).
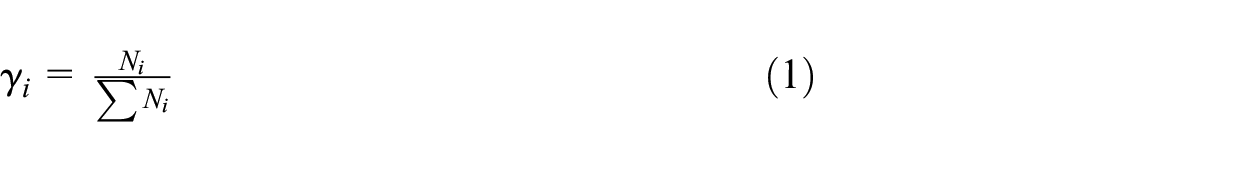
In summary, the evaluation of a construction based on sound absorption follows the following steps:
determination of the intermediate evaluation Z(fi) by means of the evaluation curve (see Appendix).
weighting of the intermediate evaluation Z(fi) with the weights γi of the corresponding frequencies fi (equation (2)).
determine the intermediate evaluation of sound absorption Z (sound absorption) by summing the six weighted frequency intermediate evaluations Z(fi) (equation (2)).
Heat stress evaluation—Microclimate parameters
Air temperature
Air temperature is probably one of the most obvious quantities for assessing the thermal effect of different construction systems on street canyon climate. However, the evaluation based on air temperature quickly reaches its limits. The thermal comfort or the resulting heat stress for humans is significantly influenced by thermal radiation (Atmaca et al., 2007). Consequently, an air temperature that is not very high in itself can lead to human discomfort in combination with high thermal radiation.
Mean Radiant Temperature (MRT)
The thermal radiation load of a person in a street canyon can be of different types. Therefore, when using MRT, it is always important to define precisely which types of thermal radiation the MRT considers. In the context of BASK, the specified MRT includes all shortwave and longwave thermal radiation. Figure 7 shows all radiation sources that have to be considered for the calculation of the MRT at a point within a street canyon. In addition to the direct and diffuse thermal radiation, the reflected components also have an influence on the MRT.
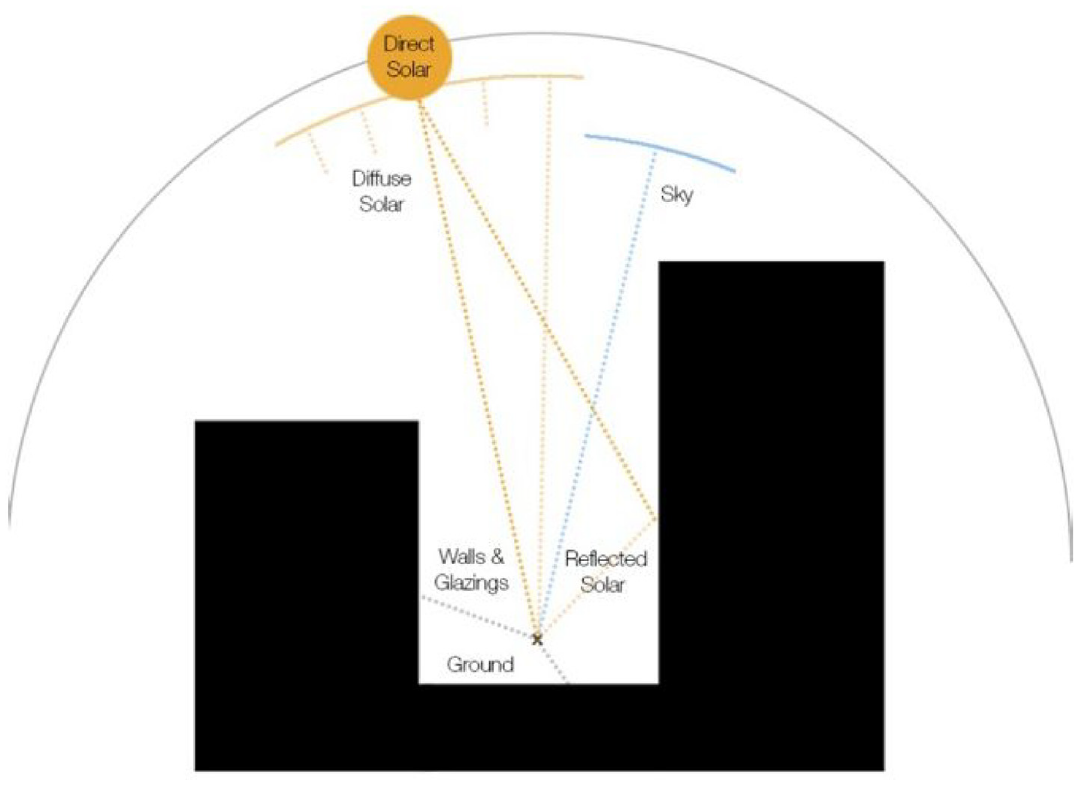
Different short- and longwave thermal radiation sources within a street canyon (Rakha et al., 2017).
Physiologically Equivalent Temperature
The Physiologically Equivalent Temperature (PET) is used to describe thermal comfort of a person under given meteorological influences. These influences include air temperature, humidity, wind speed and MRT (Höppe, 1999). In addition, there is the influence of the clothing worn by the person and their (sporting) activity level. With the help of these parameters, a heat balance equation for the human body can be established, which takes into account both external and internal influences (Höppe, 1999).
The PET is given in degrees Celsius. It corresponds to the fictitious air temperature of a typical indoor space at which the same core and skin temperatures of the human body would be reached as under the given meteorological influences (Höppe, 1999). The assumptions for the climatic conditions of the typical indoor space are: Reduced direct solar radiation, calm wind speeds, and a relative humidity of 50% at an air temperature of 20 °C (Wicki, 2018: 43). It is further assumed that the human is at rest indoors and wearing light clothing.
The higher the PET, the greater the heat stress for the human body or the greater its thermal discomfort. According to Matzarakis and Amelung (2008), heat stress can be expressed in terms of PET as follows:
PET > 23 °C mild heat stress
PET > 29 °C moderate heat stress
PET > 35 °C severe heat stress
PET > 41 °C extreme heat stress
Table 4 shows exemplary scenarios under different meteorological conditions and the PET resulting from these conditions. Comparing the scenario “Summer, sunny” with the scenario “Summer, shady,” one can see that the difference MRT of 30 K results in a difference in PET of 14 K. Following Matzarakis and Amelung (2008), one is exposed to extreme heat stress in the sunny scenario (PET = 43 °C), while one is on the borderline of moderate heat stress in the shady scenario (PET = 29 °C).
Example scenarios under the meteorological influences of air temperature TL, mean radiation temperature MRT, wind speed vW, water vapor pressure pWD, and associated PET (Höppe, 1999: 73).
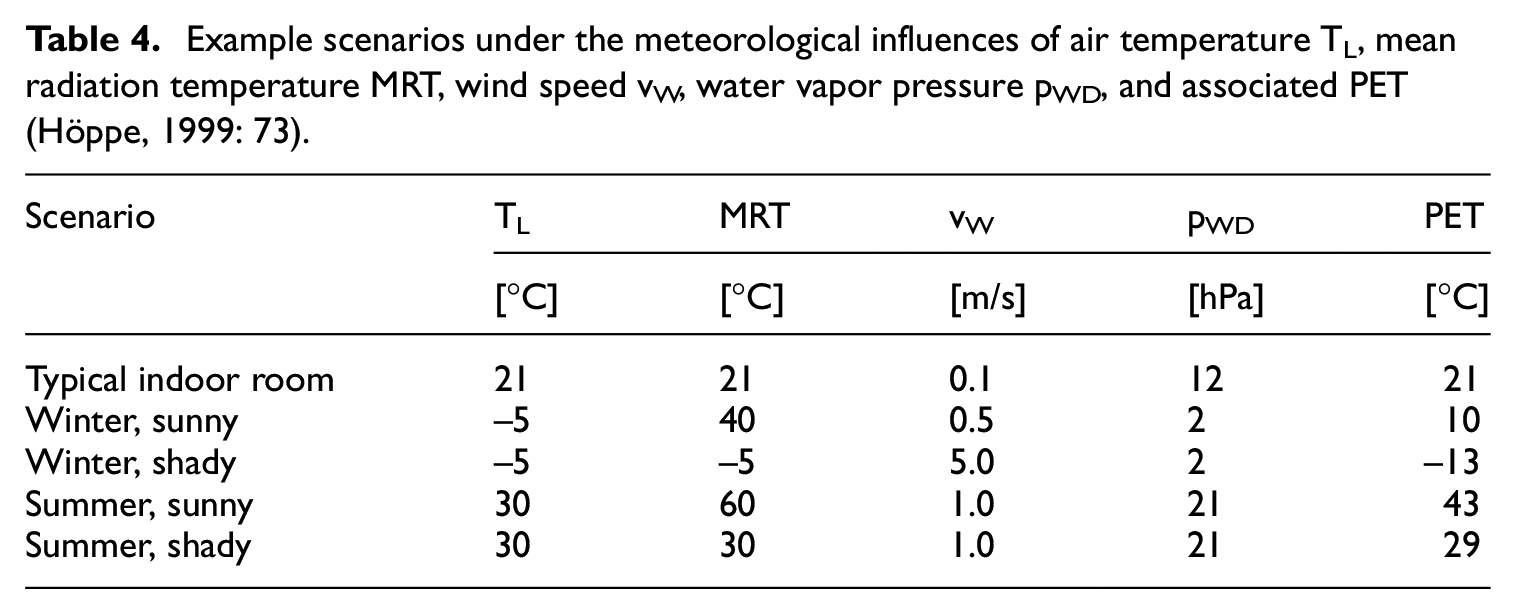
One advantage of using the PET is that the PET value is easily understood by a layperson. The idea of the resulting heat stress is very striking due to the definition of the PET as a comparative internal temperature. One can very well imagine the heat stress one is exposed to, for example, in the scenario “summer, sunny” with a PET of 43 °C. An indoor temperature of 43 °C is probably more reminiscent of a sauna than of a desirable everyday climate.
Comparison MRT and PET
The numerous influencing variables of the PET give the impression that the PET can assess the thermal comfort more accurately than the MRT. However, if we look at the temporal course of the MRT and the PET in Figure 8, we see a strong correlation between the two metrics. Maximum and minimum deflections of the MRT and of the PET do not show any significant temporal misalignment. The main difference between the two courses lies in the amplitude. The MRT amplitude is much larger than that of the PET. The temporal alignment of the extreme values is an indicator that the PET is strongly influenced by the MRT. Thus, an evaluation of the heat stress based on the MRT should lead to similar results even without the numerous influencing factors of the PET.
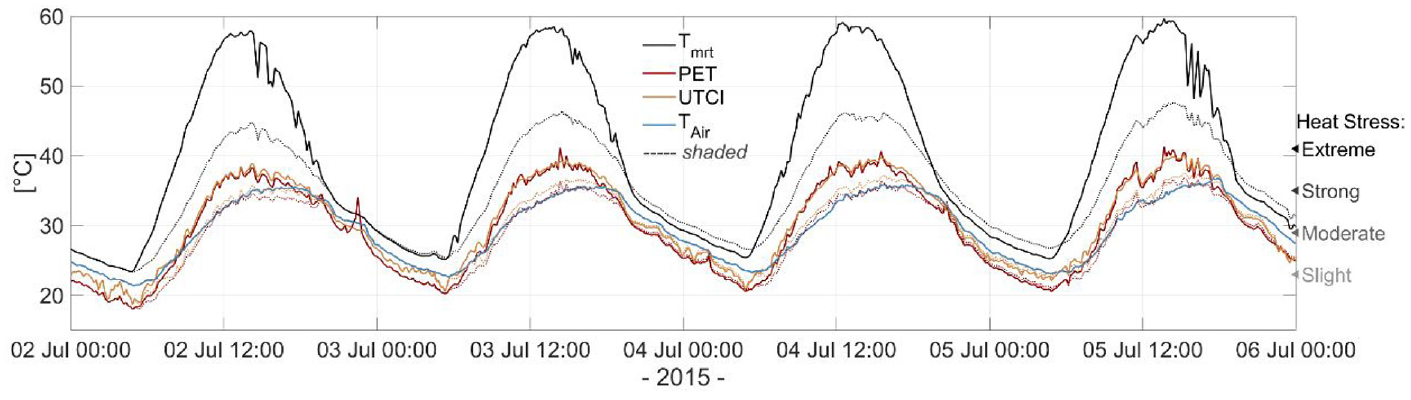
Temporal courses of climate indices MRT (Tmrt), PET, UTCI, and air temperature (TAir) during a heat wave in Basel in July 2015 (Wicki, 2018).
The advantage of the PET is that it is easy for the user to understand. With knowledge of the PET definition, the user can more easily imagine the heat stress at a PET of 40 °C than the heat stress at a MRT of 60 °C. A possible disadvantage when using the PET are relativizing environmental influences. High wind speeds have a cooling effect, so they have a positive impact on thermal comfort on hot summer days. In principle, worst-case scenarios are to be considered in the context of BASK, that is an influence of wind effects on thermal comfort is to be avoided, since these cannot be regarded as always given.
Conclusion
Due to the central importance of thermal radiation for the thermal comfort of pedestrians, an evaluation of the heat stress in the context of BASK based on the air temperature does not go far enough. It is imperative that thermal radiation be taken into account. Due to the similar characteristics of MRT and PET, the evaluation of the heat stress based on these parameters will not differ significantly. BASK is developed based on MRT.
Sensitivity analysis
A sensitivity analysis examines the changes in the results of a model when individual parameter values are systematically changed (Qureshi et al., 1999). If the results are unchanged even with changed parameter values, the model can be considered robust. With the help of a sensitivity analysis, priority aspects for the improvement of a future model version can be determined (Qureshi et al., 1999). Aspects of the model that are very sensitive and may have a strong influence on the result should be analyzed in more detail in subsequent versions compared to less sensitive areas.
General procedure
The procedure for checking the robustness of the results of the MCDM model follows the procedure shown from Josa et al. (2020). The authors perform the sensitivity analysis using a statistical approach. The input data of the model are randomly varied within a range of ±10% of the original data value, based on a PERT distribution (Program Evaluation and Review Technique). Subsequently, the MCDM model is evaluated for each varied data set and it is checked whether the ranking of the evaluated construction systems has changed (Josa et al., 2020). In the field of decision-making and expert opinions, the PERT distribution is a frequently used distribution (Peters, 2016). As a basis for the statistical evaluation, a total of 500,000 iterations are carried out analogously to Josa et al. (2020).
Uncertainty within the technical specification data and the evaluation curves
The sensitivity analysis is divided into two parts (scenarios). Both the influence of uncertainties within the technical specification data and within the slopes of the rating curves are investigated. For the former, the data values of the technical specification data (Table 2) are varied as described. For the variation of the evaluation curves within a certain “corridor,” the parameters of the evaluation curves must be varied (see Appendix).
The evaluation of the varied data with BASK results in 500,000 total scores for each of the 10 construction systems in both scenarios. From the frequencies of the total scores, the probability density (PD) for each construction can be presented in the form of a boxplot. The significance level is set to 95%, the whiskers define the 2.5% and 97.5% quantiles, see Figure 9.
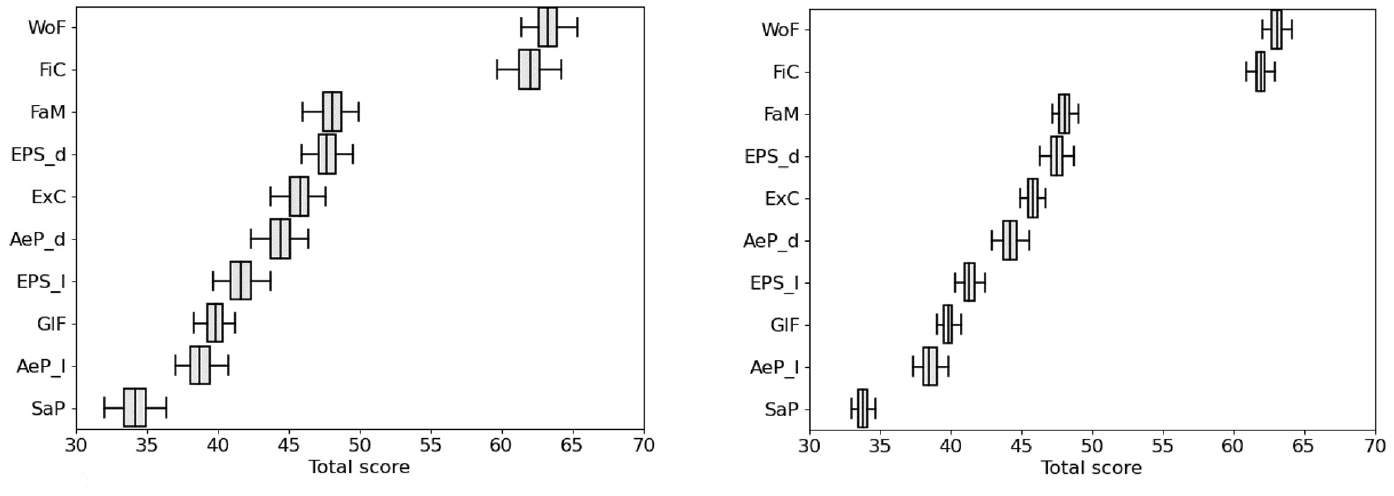
Boxplots of the total score distributions of the 10 construction systems as a result of varying the technical specification data (left) and the rating curves (right). The whiskers define the 2.5% and 97.5% quantiles.
The boxplots show that the total scores scatter more strongly as a result of varied technical specification data than as a result of varied rating curves. This is only a first indication. A more detailed check of the robustness of the MCDM model is performed using the associated rankings of the construction systems. These can be calculated for each of the 500,000 iterations. Each construction can assume a rank between 1 and 10. The result of transforming the total score values to discrete rank values is shown in Figure 10. Note the following in Figure 10: the reduction of the box to one line means that at least 50% of the iterations of a construction have the corresponding rank (e.g. “ExC,” rank 5); if the entire box including the whiskers is reduced to one value, 95% of the iterations of a construction have this rank, indicating a non-sensitive behavior (e.g. “SaP,” rank 10). Finally, a one-sided whisker indicates a one-sided close construction with a similar total score (cf. “WoF” and “FiC”).
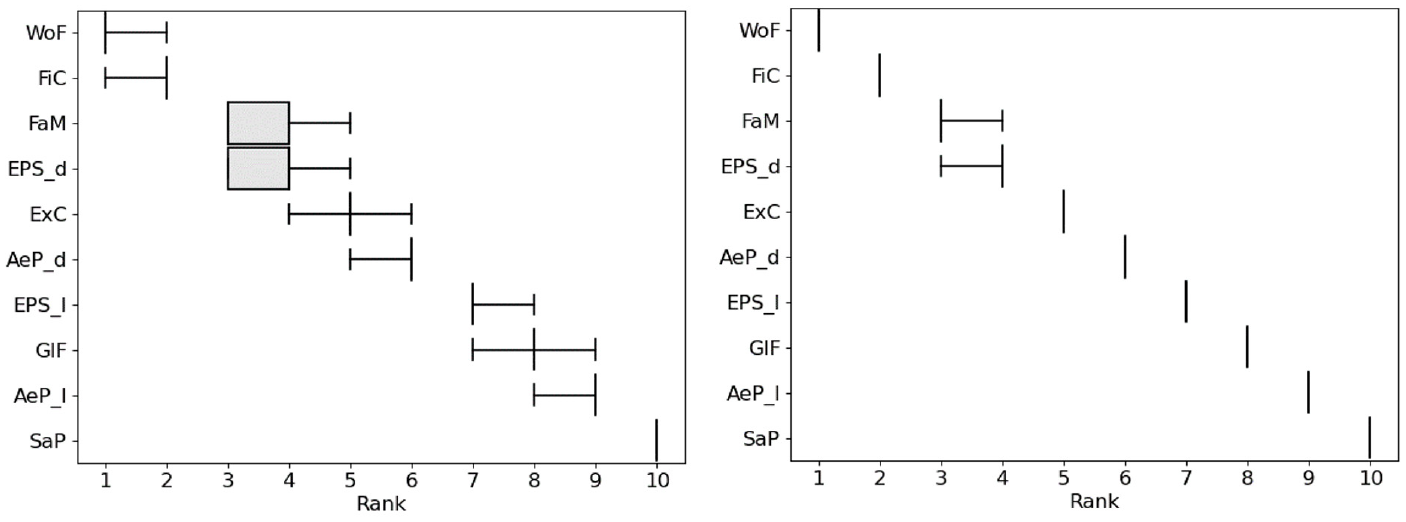
Boxplots of the rank distributions of the 10 constructions as a result of varying the technical specification data (left) and the rating curves (right). The whiskers define the 2.5% and 97.5% quantiles.
Uncertainty in the technical specification data results in different ranks of the construction systems. The model is therefore not robust based on the 95% significance level. This is considered accordingly in the result output by BASK by including uncertainty bars in the reporting (see Section 7).
A different picture regarding robustness is shown by the rank distributions due to variation of the rating curves. Eight of the 10 construction systems show a robust rank at the 95% significance level. Only the two construction systems “FaM” and “EPS_d” show a slight variance. It follows that the total score distributions in Figure 9 (right) do not scatter randomly up and down. Rather, depending on the set-up of the evaluation curves, there is an overall shift of all construction total scores downwards or upwards. This shift has no consequences for the rank numbering, so the MCDM model can be considered robust against uncertainties of the scoring curves. BASK therefore only considers the uncertainties resulting from the technical specification data in its output.
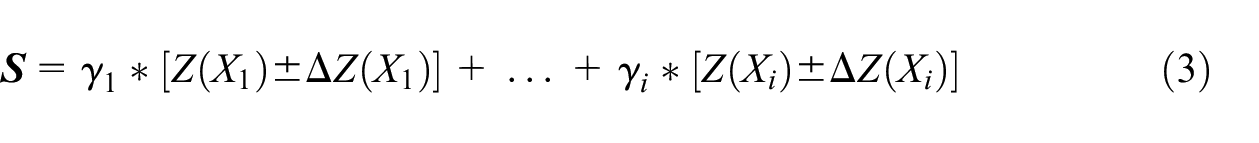
Further, the question arises whether the uncertainties derived from the uniform weighting scenario are also valid for other weighting scenarios. The weights γi scale both the intermediate scores Z(Xi) and the uncertainties ΔZ(Xi) of a criterion Xi (equation (3)). At the same time, the differences between the uncertainties ΔZ(Xi) of each criterion are small and are therefore considered negligible. This means that the absolute uncertainty
BASK prototype results
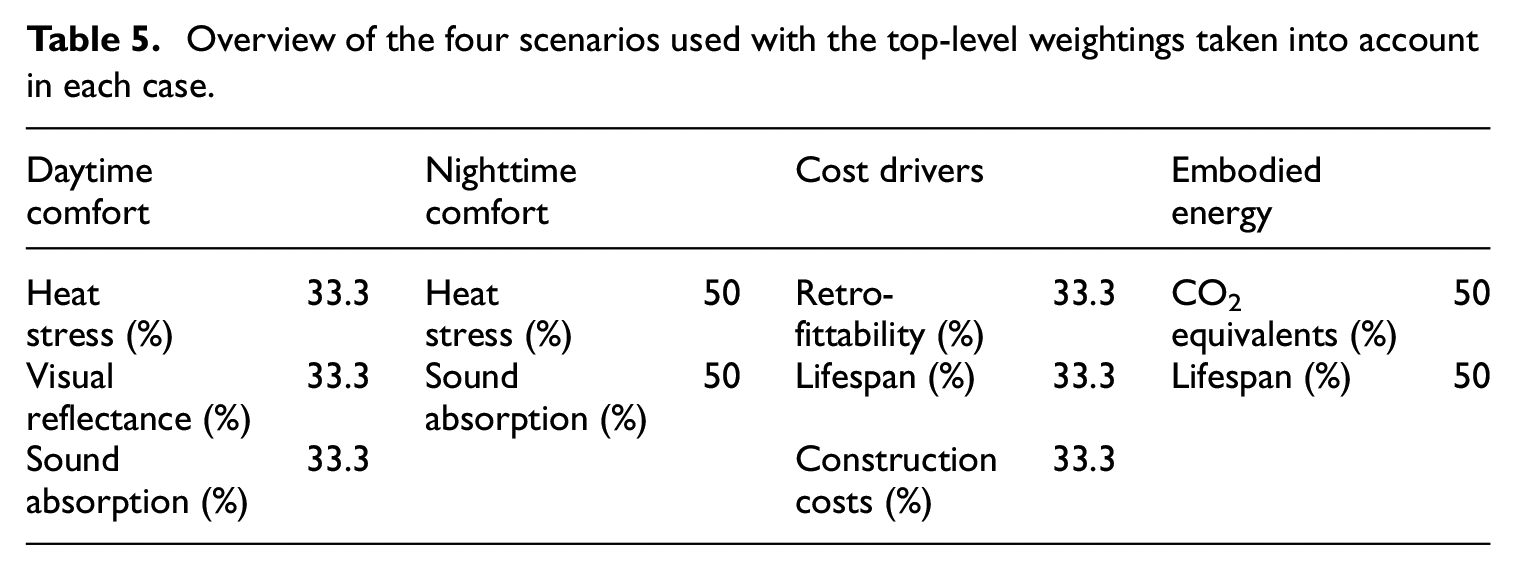
Four different weighting scenarios are used to analyze the output by BASK. The scenarios are chosen to correspond to a potential prioritization of criteria by a construction planner in practice (Table 5). A maximum of three top-level criteria are considered per scenario. Uncertainty bars are added to the total scores of the construction systems to account for the uncertainties derived in the previous section. The uncertainty bar corresponds to the 2.5% and 97.5% quantile of the total score distributions. In this way, it is easy for the user to see which total scores of the construction systems differ significantly from each other. Construction systems that cannot be significantly distinguished from each other due to uncertainty must be considered as having the same score.
Overview of the four scenarios used with the top-level weightings taken into account in each case.
The results are summarized in Figure 11 and show plausible rankings of the construction systems. The uncertainty bars lead to a non-significant differentiation of several construction systems in each scenario. The highly significant influence of the changed paint of “EPS” and “AeP” in the scenarios “daytime comfort” and “nighttime comfort” is striking. In the daytime comfort scenario, light coatings perform worse than dark ones due to the increased albedo values and visual reflectance. In the nighttime comfort scenario, the high albedo leads to smaller nighttime MRT values due to the lower heat input into the structure during the day and thus to a better evaluation of light coatings compared to dark ones.
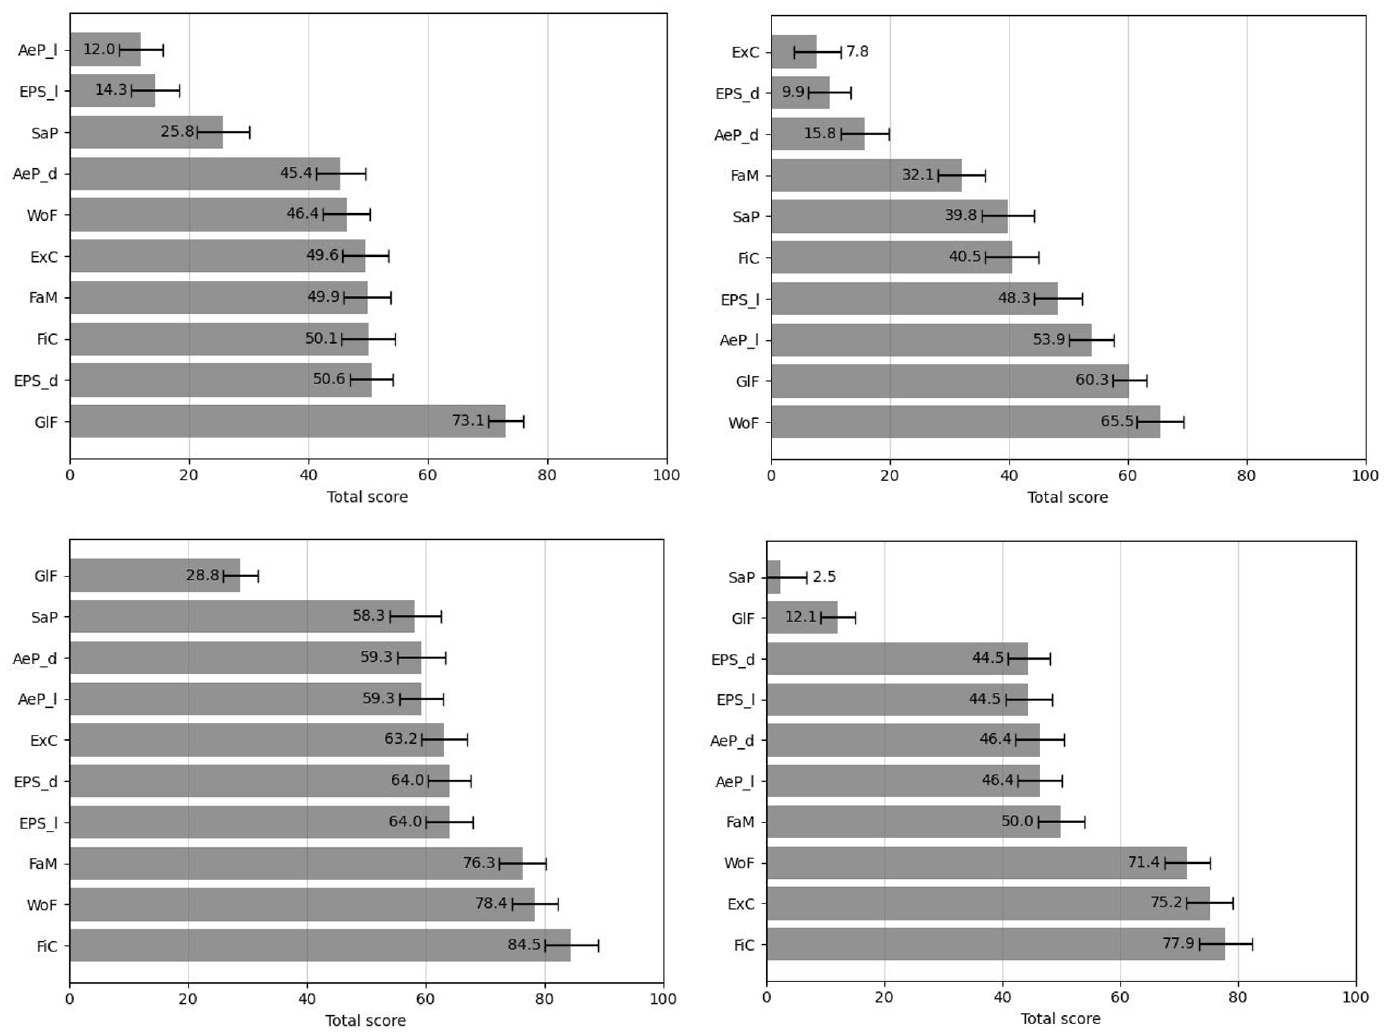
Results of the four scenarios with uncertainty range. Daytime comfort (top left), nighttime comfort (top right), cost factors (bottom left), gray energy (bottom right). A large score is to be interpreted “particularly suitable.”
Validation
Introduction
Validation is a central step in the process of building an MCDM model. Successful validation increases the acceptance of the model and guarantees the user that the model reliably represents the real world (Qureshi et al., 1999). Different types of validation are available depending on the subject area represented (Qureshi et al., 1999). The validation of models that output measurable quantities is usually less complex. For measurable quantities, real-world data can be found that can be compared to the output data of the model and used to evaluate the performance of the model.
Increased complexity arises when the model includes more than just measurable quantities (Qureshi et al., 1999). The evaluation criteria used in BASK are both quantitative and qualitative in nature. They describe physical, ecological, but also economic aspects of the environment. This results in an output quantity for which no real data is available against which to compare the reliability of the model output. The challenging task of validating such MCDM models is also reflected in the analysis of different MCDM models shown from (Qureshi et al., 1999). Of 13 models with qualitative data, only two show actual validation of results. For many of the models, only a sensitivity analysis is performed to check robustness, which is not a validation in the strict sense. For the actual validation of models where no real data can be obtained or generated, according to Qureshi et al. (1999), only the validation by interviewing experts is available. This type of validation is attempted for BASK.
Expert validation procedure
Attempting the validation of the MCDM model on the basis of expert opinions basically suggests itself, since without the supportive decision-making by BASK, an expert would be needed to advise regarding the construction choice. When selecting experts, care must be taken to ensure that they are knowledgeable in the relevant fields. Practical knowledge of construction materials is required, as well as an understanding of the physical background of heat stress or sound propagation, for example.
The procedure for validation used for BASK is similar to that shown from Deepa et al. (2019). Therein, the authors investigate different MCDM models with respect to their validity. For this purpose, a comparison is made between the ranking list based on the considered MCDM model and the one which is determined by a mathematical model regarded as correct. The “Spearman’s rank correlation coefficient” (SRC) serves as the measurement variable. The SRC can be used to calculate the correlation of two rankings. The SRC takes values from −1 to 1, where 1 corresponds to two identical rankings and −1 corresponds to two exactly reversed rankings.
The rankings from BASK (excluding the uncertainties explained in Section 6) are compared with the rankings established by experts for each weighting scenario. In doing so, the experts should establish the ranking lists based on the construction specification data as well as their experience. The correlation of both ranking lists can then be calculated with the SRC.
Validation results
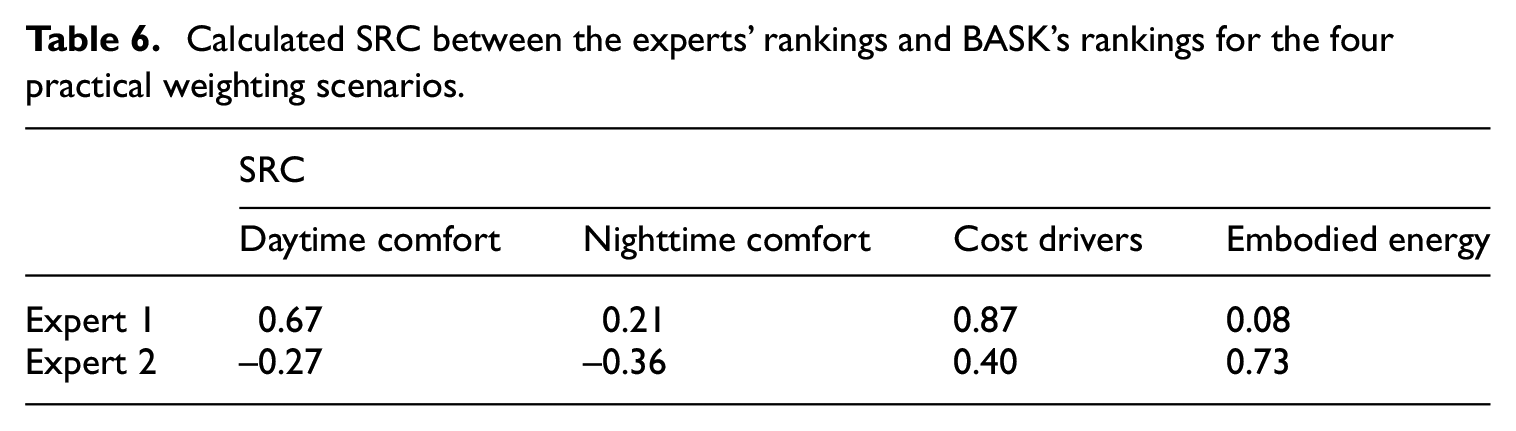
The present validation is based on two experts only. The results of the SRC from each weighting scenario are shown in Table 6. The results show that overall there is only a slight correlation between the experts’ rankings and BASK’s rankings. Some individual SRCs show strong correlations of the two rankings: For the scenario cost drivers and expert 1, an SRC of 0.87 is calculated, for the scenario embodied energy and expert 2, an SRC of 0.73 is found. However, very weak correlations of the rankings can also be found. The rankings of expert 2 even show a negative SRC for the scenarios daytime comfort and nighttime comfort. I must be noted though, that expert 2 pointed out that heat stress is not his field of expertise, which may be a reason for the negative values.
Calculated SRC between the experts’ rankings and BASK’s rankings for the four practical weighting scenarios.
Both experts provide feedback that they find it very difficult to form a ranking list. Despite the limitation of the scenarios to two to three top-level criteria, the evaluation of the construction systems seems challenging for a human being. The high complexity of the sub-criteria of sound absorption certainly represents another hurdle in this respect.
Future validation
A conclusive validation of BASK cannot be presented within the scope of this paper. The small selection of experts can only serve as a tendency. The tendency shown is also that there are non-negligible differences between the SRC of the rankings of the individual experts and certainly also between the individual scenarios (see table 6). Further expert opinions are necessary. If the feedback accumulates that it is difficult to get an overview of the construction systems and the weightings, the question arises whether BASK can be validated at all with the procedure shown. The next version of BASK, which is to evaluate about 30 construction systems based on eight top-level criteria, will probably have to be validated in a different way. The overview of the data of 30 construction systems and the formation of a ranking list will no longer be reliably possible by a human being. The complexity of validating an MCDM model mentioned by Qureshi et al. (1999) is confirmed.
One possibility of—at least rudimentary—validation is the construction of BASK based on another MCDM method. For example, the technique for order preference by similarity to ideal solution (TOPSIS) is an often used MCDM method (De Angelis et al., 2018; Işıklar and Büyüközkan, 2007; Singh et al., 2020). The basic idea of TOPSIS is to evaluate a construction with respect to a criterion by comparing it with the best possible construction (e.g. lifespan = 100 years) and the worst possible construction (e.g. lifespan = 30 years) in the data set. Construction systems that are close to the best possible construction are in principle rated better than those that are close to the worst possible construction.
However, comparing the results of BASK with those of another MCDM method - of whatever type - would be just one way of gaining a bit more confidence in the MCDM model. Finally, the validity of the new MCDM method cannot be guaranteed any more than that of BASK. In this respect, it is possible that the ranking of BASK is identical to the ranking of another MCDM method. The SRC is then calculated to 1. Nevertheless, this does not automatically mean that the rankings are correct in an absolute sense.
Conclusion
This paper describes the development of the MCDM model BASK, a tool which can evaluate construction systems based on ecological, economic and building practice criteria. The results shown illustrate the added value of BASK for construction planners: It can infer one or a few concrete construction recommendations from a database of technical specification data of any size. The focus of the planners can be set on desired criteria, which in turn can be weighted freely. Possible criteria that can be evaluated in the current version are heat stress, visual reflectance, CO2 equivalents, electricity production, retrofitability, sound absorption, construction costs, and life span. If required or desired this list could be extended with various other criteria. The introduced MCDM model can evaluate different construction systems based on the named criteria, supporting planners to choose the best-fitting construction system for their needs. In principle, the structure of BASK allows a web-based implementation and interactive use.
The sensitivity analysis carried out indicates that any uncertainties in the technical specification data must also be considered in the result output. In the implemented result output, this is achieved by specifying an uncertainty range. A successful validation of BASK was not possible within the scope of the underlying work. In general, it has been shown that the validation of MCDM models is complex. In this respect, future research should try to work out a suitable way of model validation.
Footnotes
Appendix
The course of the evaluation curves Z(Xi) is defined with the help of five parameters (Josa et al., 2020). By different parameter selection, either a linear, convex, concave or s-shaped course can be generated. Z(Xi) corresponds to the intermediate evaluation of a criterion. The factor B is needed to scale Z(Xi) to the range between 0 and 1.
Acknowledgements
The data basis of BASK comes from the research project “Building Materials for Cities and Climate Change – a Material Catalogue with Recommendations” (Hoffmann et al., 2021), launched by the City of Basel together with the FHNW and the University of Basel (Institute of Meteorology, Climatology and Remote Sensing (MCR)).
Declaration of conflicting interests
The author(s) declared no potential conflicts of interest with respect to the research, authorship, and/or publication of this article.
Funding
The author(s) received no financial support for the research, authorship, and/or publication of this article.