
Abstract
The article presents experimental studies of typical Finnish highly insulated (HI) envelopes with thermal resistance values (R value) for the wall and roof inside the ventilation cavity between 7.7 and 8.1 m2K/W and 13 m2K/W, respectively. The conditions in the ventilation cavities were studied by using typical and increased R values for the exterior part of the cavity, which were 0.18 m2K/W and 1.57 m2K/W in the walls, and 0.13 m2K/W and 2.13 m2K/W for the roof. With higher exterior R values of 1.57 m2K/W and 2.13 m2K/W, the cavity temperature increased only after closing the inlet gap of the cavities. If the cavity inlet was closed, the restriction of the outlet gap from 20–25 mm to 10 mm had no significant effect on the temperatures. A closed ventilation inlet resulted in increased absolute humidity in the cavity, which indicates that the restriction of cavity ventilation should be made with care to avoid impairing the drying-out ability. The computational analysis showed that the optimal air change rates in the wall and roof cavities of HI structures were 4–40 1/h and 20 1/h, respectively. The conventional 22-mm-thick wood cladding enables safe cavity conditions in HI walls if the vapor barrier is vapor tight and other moisture sources are low. A lower heat flux and additional heat loss caused by cloudless sky at night support the observation that HI roofs have a higher moisture risk. In HI roofs, a conventional exterior R value of 0.13 m2K/W should at least be increased to the range of 0.3–0.4 m2K/W, which is achieved, for example, by a 20-mm-thick mineral wool board under the roofing. The use of mold-resistant materials in the ventilation cavity is recommended to mitigate the possible ramifications of the moisture behavior of HI roofs.
Introduction
Highly insulated (HI) exterior assemblies are widespread in cold climate zones. The high thickness of thermal insulation layers in such structures effectively reduces the heat flow toward outdoor air. For example, typical HI walls and roofs in Finland have insulation thicknesses of 300 mm and 500 mm, respectively, with corresponding thermal transmittances (U values) of 0.12 W/m2K and 0.08 W/m2K. These assemblies usually incorporate ventilation cavities that are located directly behind the façade cladding or under the roofing. In the walls, thermal insulation is usually located inside the ventilation cavity, which creates a capillary break against water leakages through the façade and increases the drying ability of the structure by allowing airflow behind the cladding. The cavity is also a drainage plane, and in non-airtight facades, the cladding also serves as a pressure balancing layer decreasing the pressure difference across the cladding (e.g. Kumar, 2000; Salonvarra et al., 2007). In roofs, the increased drying ability and avoiding snow melting are the main benefits of a ventilation cavity (e.g. Blom, 2001). Snow melting may lead to standing water and icing at the eaves, which results in roof leaks and damage to the roof components, and can even endanger human safety.
TenWolde and Carll (1992) studied the effect of cavity ventilation on the performance of walls and roofs. The main problem with cavity ventilation was found to be its potential to increase exfiltration airflow; thus, the benefit of ventilation depends on the ratio of increased drying potential to the additional moisture loads from air leakages. They added, that a very low (0.2 1/h) air change per hour (ACH) in roofs is enough to compensate the vapor tight roofing. In numerical studies of Kehl et al. (2011) of the need of ventilation cavity in timber facades, the results of Mayer and Künzel (1980) were used for validation. The simulations showed that the assumption about a constant ACH gave reasonable results, which pointed out that both ventilated and non-ventilated facades perform well provided that the cladding includes large number of joints. They evaluated, that if the facade is practically airtight (e.g. large facade panels), an unventilated cavity does not work. According to Nore (2009), a cavity behind wooden cladding is necessary, yet a cavity opening of 4 mm works as well as a 23 mm opening even in weather-beaten facades. Nore added, that omitting the cavity results in moisture accumulation in the west facing facades, which are subjected to harsh weather. However, in the east facing cavities, which had little rain exposure, the optimal hygrothermal performance was obtained without ventilation in the cavity (Nore, 2009). According to Salonvarra et al. (2007), a ventilated cavity behind the facade cladding is primarily beneficial allowing drying out of the water that penetrates into the wall, but ventilation may also occasionally bring moisture to the cavity. Salonvarra et al. (2007) concluded that in practise the wall needs to be designed to withstand leakages.
Related to leakages, Calle et al. (2020) studied the amounts of rainwater infiltrated into brick cavity walls. They found that in practise the moisture caused by infiltrated rainwater may be substantially higher (as high as 21% of the rain reaching the facade) in older brick facades compared to new structures. These moisture loads are mostly directed to the inner face of the brick veneer siding and little moisture is transferred inward to the thermal insulation layer as the cavity acts as a drainage path. The rain tightness tests by Rüther and Time (2015) showed that unpainted wood claddings are relatively rain tight when mounted carefully. Painted wood claddings can therefore be assumed to be very rain tight. The importance to drain the water that enters the cavity applies also to wood claddings (Rüther and Time, 2015). Regardless of the facade material, the watertightness of a facade depends also on the amount of interfaces and installations and the quality of the workmanship and maintenance (see e.g. Sahal and Lacasse, 2005).
Dimouni et al. (2016) concentrated on the potential of ventilated walls to reduce the cooling load of a building. They found that, in summer, air circulation in the cavity reduces heat flow through the wall, which has a 50-mm-thick mineral wool (MW) insulation. Such heat gains may be much lower in HI envelopes regardless of the cavity ventilation, because the insulation thickness is at least six times higher. However, the importance of convective heat removal remains in HI walls as some facade materials do not withstand excessive temperature levels in the cavity, such as some plastered gypsum boards. A high efficiency of the building integrated photovoltaic panels also requires considerable ventilation of the cavity behind the panels (Zogou and Stapountzis, 2011). Solar irradiation generates thermal stresses in the outer parts of the wall (Viljanen, 1983), which can be reduced with cavity ventilation by decreasing temperature difference. On the other hand, high cavity temperatures are beneficial as they may pose lethal conditions to mold fungi; Sedlbauer (2001) noted, that mold fungi is not able to grow over 50°C and based on the methods used in food industry, most mold spores are destroyed in a short time at temperatures of 80°C. Susanti et al. (2010) studied a roof with a natural ventilation targeting to reduce heating by solar irradiation. In the roof cavity, the flow was always laminar. The results implied that the pressure losses were dominated by friction of the cavity surfaces with inlet and outlet gap heights in the range of 35–70 mm, and by the local loss at the eaves with a gap height of 10 mm. Gullbrekken et al. (2018) focused on the pressure losses in the cavity under brick roofing. They found that even small differences, such as the edge design and the height of tile battens may affect ventilation performance. Thiis et al. (2007) showed that a higher pressure loss at eaves prevents convective snow accumulation in roofs.
Regarding HI assemblies, an increased thermal insulation of the external envelope may raise the temperature of the interior surface of the structure (Leivo et al., 2019) improving living comfort and preventing cold bridges. However, as a low U value decreases the temperature on the other side of an HI assembly, the thermal conditions in the cavity are close to those of outdoor air (Technical Research Centre of Finland, 2008). It has been experimentally found that the temperature in the cavities of HI walls is close to, but slightly above, the outdoor temperature (Viljanen et al., 2020). The difference in the thermal behavior leads to a slightly higher relative humidity (RH) in the cavities of HI assemblies compared to a baseline (BL) wall, which may increase the risk of moisture damage (Viljanen et al., 2020). However, mold growth was observed at the bottom of the cavity battens of both HI and BL walls, for which the fundamental causes remained unresolved.
The risk of moisture damage is increased in HI roof structures, where the cavity temperature and RH are even closer to the outdoor level than it is in walls (Viljanen et al., 2020). Thermal conditions may be deteriorated further by thermal radiation toward the sky at night. Buoyancy effect creates pressure difference toward the roof, which can induce elevated moisture convection. Adaptive attic ventilation has been studied to improve the performance of cold attics (Hagentoft and Kalagasidis, 2010) with a conclusion that this method decreases attic RH by 10% during the cold season compared with conventional natural ventilation of the attic. An another study focusing on HI attics compared a 50-mm-thick additional insulation under the cold roof over the attic space, attic heaters, and reduced attic ventilation (Harderup and Arfvidsson, 2008). In the study, the lowest attic RH during the cold season was achieved with the additional insulation. The experiments by Jensen et al. (2020) showed that exterior insulation increased temperatures in an unventilated roof cavity, but the mold risk remained similar to the case without external insulation. It seems that increase of the exterior thermal resistance (R value) may improve cavity conditions in HI structures, but finding an optimal ventilation rate is challenging. The results of Macias-Melo et al. (2018), Langmans et al. (2016), Viljanen et al. (2020) and Jensen et al. (2020) suggest that exterior insulation may reduce the ventilation rate of cavity in summer, because it partially prevents the warming of the cavity by solar irradiation. Earlier studies aimed at improving the hygrothermal conditions in the cavities of HI walls have not been found.
The literature confirms that ventilated assemblies are complicated systems in terms of the diversity of their performance criteria, materials, facade- and roofing systems, and boundary conditions. This causes challenges to numerically assess ventilated structures, although more advanced models (e.g. Vanpachtenbeke et al., 2020) may relatively accurately simulate the interaction of heat- and moisture transfer even in solar exposed walls. The drawback of such models is a long solution time. Also, the consequences of cavity ventilation are somewhat contradictory (e.g. Nore, 2009). Due to these factors, experimental studies and calculation models with restricted amount of variables are viable approaches to study the performance of ventilation cavities of HI assemblies. They are also needed to validate numerical models.
As a small amount of mold in the ventilation cavity has traditionally not been considered as a health issue for the users of buildings (see e.g. Swedish National Board of Housing, Building and Planning, 2011), the previous research of HI structures has mainly focused on the moisture safety of insulation space or the wooden frame of a wall (e.g. Gradeci and Berardi, 2019; Gullbrekken et al., 2015; Nelson, 2017; Pihelo and Kikkas, 2016; Trainor et al., 2016; Viljanen and Lu, 2019; Wang and Ge, 2018). In principle, however, the airflow through lightweight assemblies can transfer the mold spores found in the ventilation cavity to indoor air (Airaksinen et al., 2004) as well as diffusion can transfer microbial volatile organic compounds to indoor air through polyethylene (PE) foils but significantly less through polyamide (PA) foils (Weckström, 2003). Combined with the aforementioned observations on the degraded hygrothermal conditions in the cavities of HI assemblies, which may increase the amount of mold growth in the cavity, these studies support further research on the behavior of the cavity and on the optimal implementation of the cavity. The objectives of the current study are to evaluate the performance of the ventilation cavity of HI assemblies using the probability of mold growth as a performance indicator and to identify the factors affecting this performance such as the exterior R value and the ventilation rate of the cavity. The study also assesses the likelihood to increase natural ventilation by increasing exterior R values and the methods for preventing excessive natural ventilation. The article introduces experimental tests, where hygrothermal conditions in the cavity are evaluated by using different exterior R values for the cavity and by constricting the cavity ventilation. The experiments include three HI walls that comprise variable tightness values for the vapor barrier, which may affect the conditions in the cavity. In addition, cavity conditions in a newly-built HI mono-pitched roof are measured. The measured results are compared to the results of a computational analysis used to evaluate typical hygrothermal conditions in the ventilation cavities of walls and roofs. The numerical analysis is also used to find optimal values for the ventilation rate and the exterior R value. Finally, the need to restrict the airflow in warmer cavities is evaluated with the hydraulic network method using the parameters defined experimentally.
Materials and methods
Studies on the experimental structures and the determination of pressurelosses in cavities
Two experimental tests were arranged to study the hygrothermal performance of the ventilation cavities of HI assemblies. The results were also used to evaluate the feasibility of an analytical model to describe the cavity behavior. Structural deficiency was identified from those experimental test periods to be analyzed further with the model.
The first test included four walls, which were set up in a test hut located in Southern Finland (latitude 60.18°N, longitude 24.83°E). The three test walls were HI walls, and the fourth was a BL wall with a higher U value (Figure 1). The second test included a HI mono-pitched roof of a newly-built dwelling house in Helsinki (Figure 2). All structures were exposed to a real outdoor environment. The tongue-and-groove cladding was painted twice and together with the black bitumen roofing, the outer parts of the test structures were airtight. Temperature and RH were measured in the ventilation cavities of the structures at three points, A–C, representing the lower, middle, and upper parts of the cavities (Figures 1 and 2). The measurement periods were 9.6.2017–30.12.2019 and 8.9.2017–28.12.2019 in the walls and roof, respectively. An additional insulation was assembled on the outer surfaces of the structures, inlets were shut to be airtight, and outlets were constricted between 5.3–18.4.2018 and 5.3–30.3.2018 in the walls and roof, respectively. In the walls, the additional insulation was a 50-mm-thick EPS (expanded polystyrene) board, and in the roof, a 70-mm-thick XPS (extruded polystyrene) board was used over the roofing. Later, a 10-mm-thick EPS board was kept on the façade during 5.6–16.7.2018 without changes in ventilation. The timing of these phases is presented in the results in Figures 5 to 9. The additional insulations were assembled in an airtight manner on the walls and on the roof; thus, the moisture capacity in the cavity was not affected, which was previously a problem with the additional foam insulation that was assembled under the external structure (Harderup and Arfvidsson, 2008). The outlets were constricted to a height of 10 mm. These changes aimed to study the possibilities of improving the hygrothermal conditions of the cavities. The Sd value (water vapor diffusion-equivalent air layer thickness) of the used vapor control membrane in the HI1 and BL walls, PE foil, was 76.5 m. The HI2 wall and RF2 roof included a moisture-adaptive PA foil as the vapor control layer, which had an Sd value of 0.77 m at 79% RH, 13 m at 50% RH, and 23 m at 40% RH, where the RH condition represents the average RH on both faces of the foil. The HI3 wall was vapor tight due to the polyurethane insulation with aluminum coatings. The exterior MW sheathings in the walls and in the roof had a factory-installed, synthetic, vapor open, airtight, and watertight coatings (see also Viljanen et al., 2020). The joints in the vapor control layers and in the wind barrier surfaces were taped airtight in all the studied structures. The wood cladding of the walls was removed after the experiment to visually inspect the occurrence of mold in the cavity surfaces. Additional information on the tests is presented by Viljanen et al. (2020).
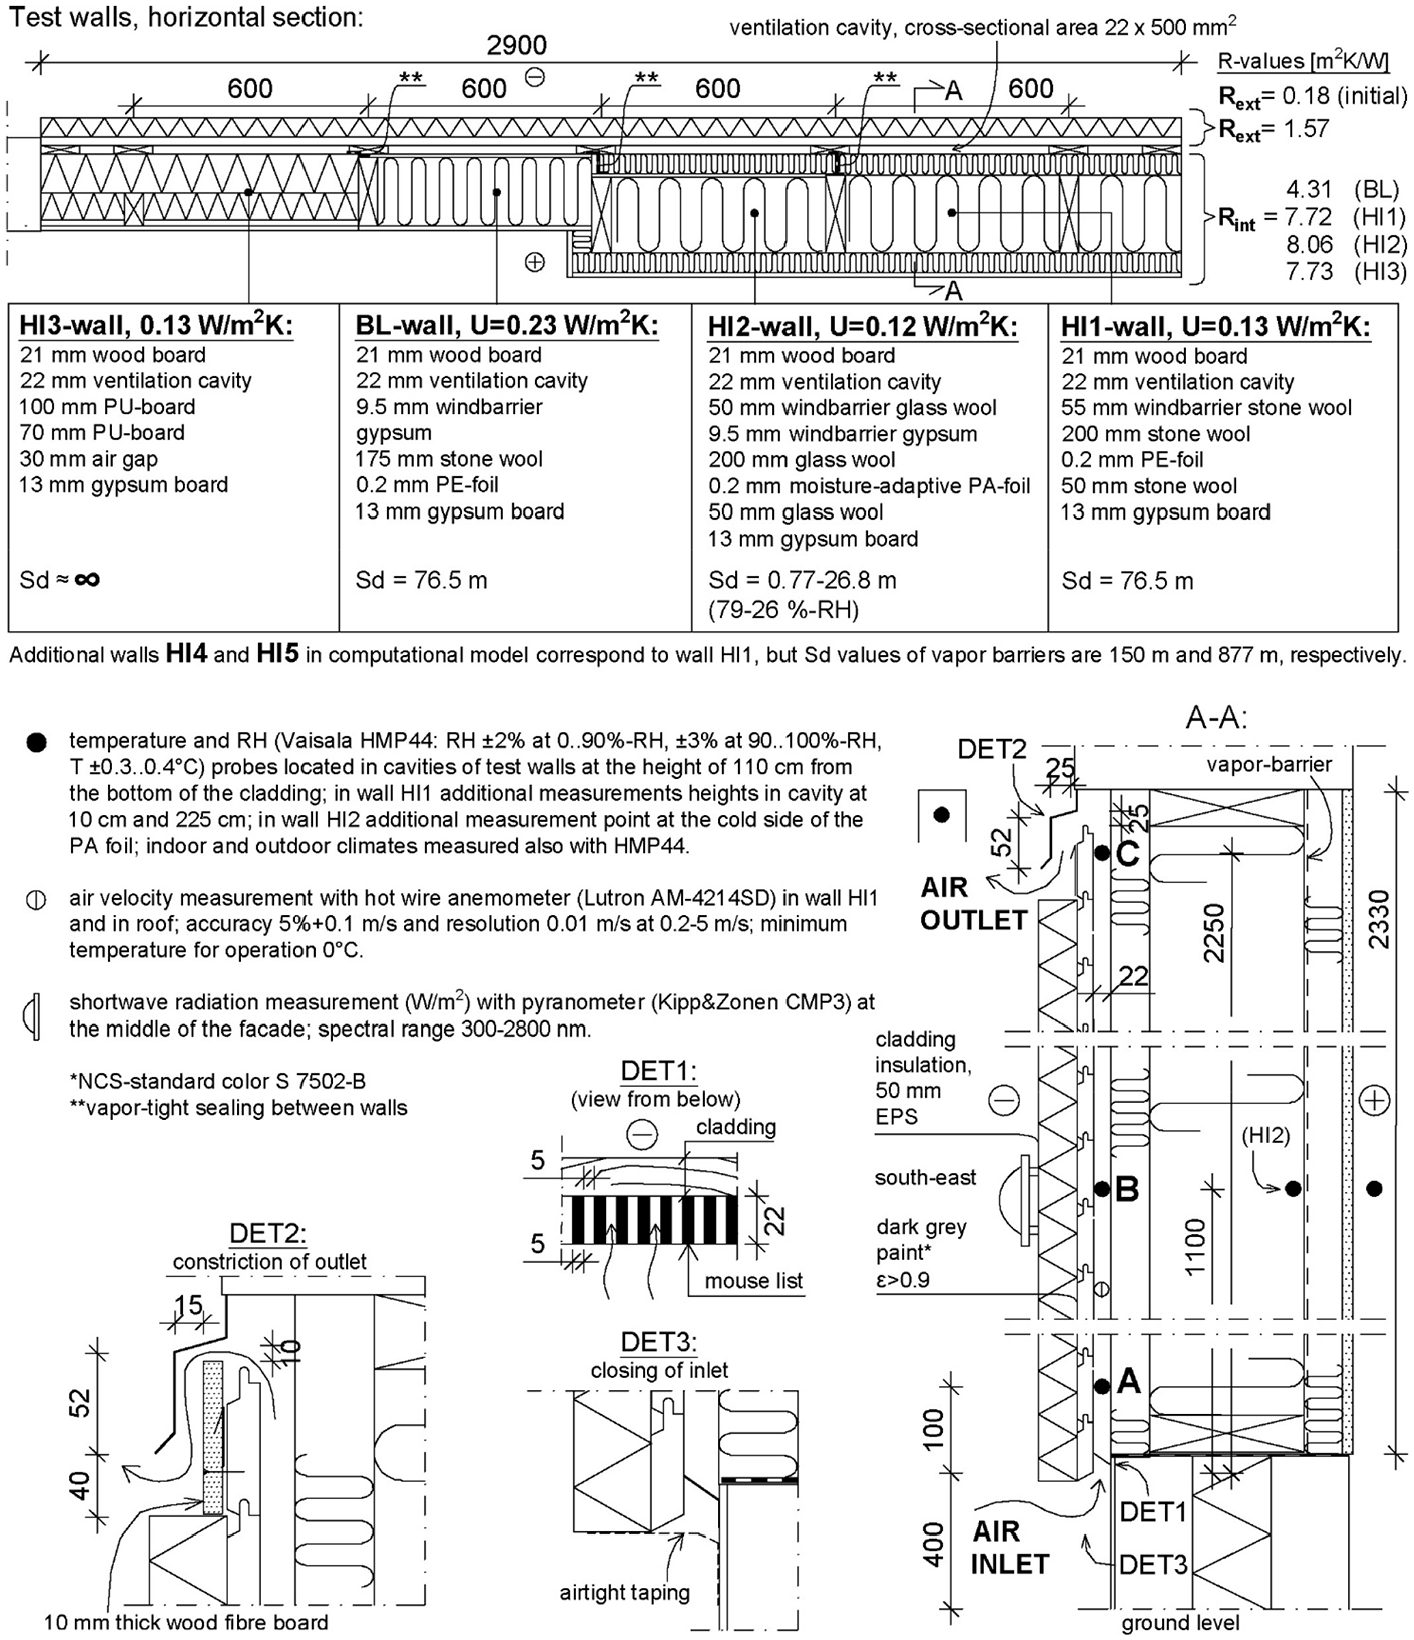
The experimental design in the wall test and description of the test walls.
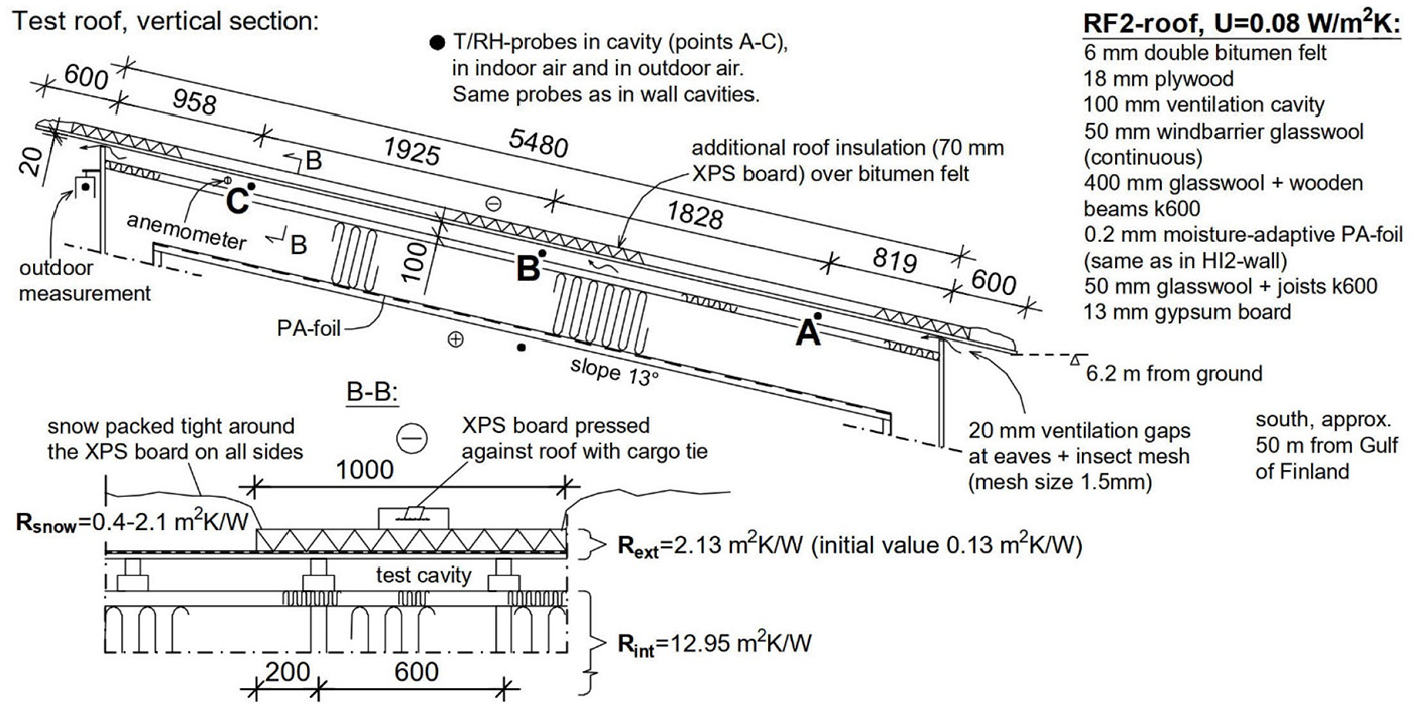
The experimental design in the RF2 roof test and description of the structure.
The R value outside the ventilation cavity (Rext) in typical Finnish external structures varies in the range of 0.012–0.18 m2K/W (Table 1), whereas the R values inside the cavity (Rint) of HI structures vary in the range of 8–13 m2K/W. Wood claddings have the highest R values among the most common siding materials. The experimental structures had significantly higher Rext values of 1.57 and 2.13 m2K/W in the walls and roof, respectively (Table 1).
Thermal conductivities and resistances of siding materials and façade/roofing assemblies.
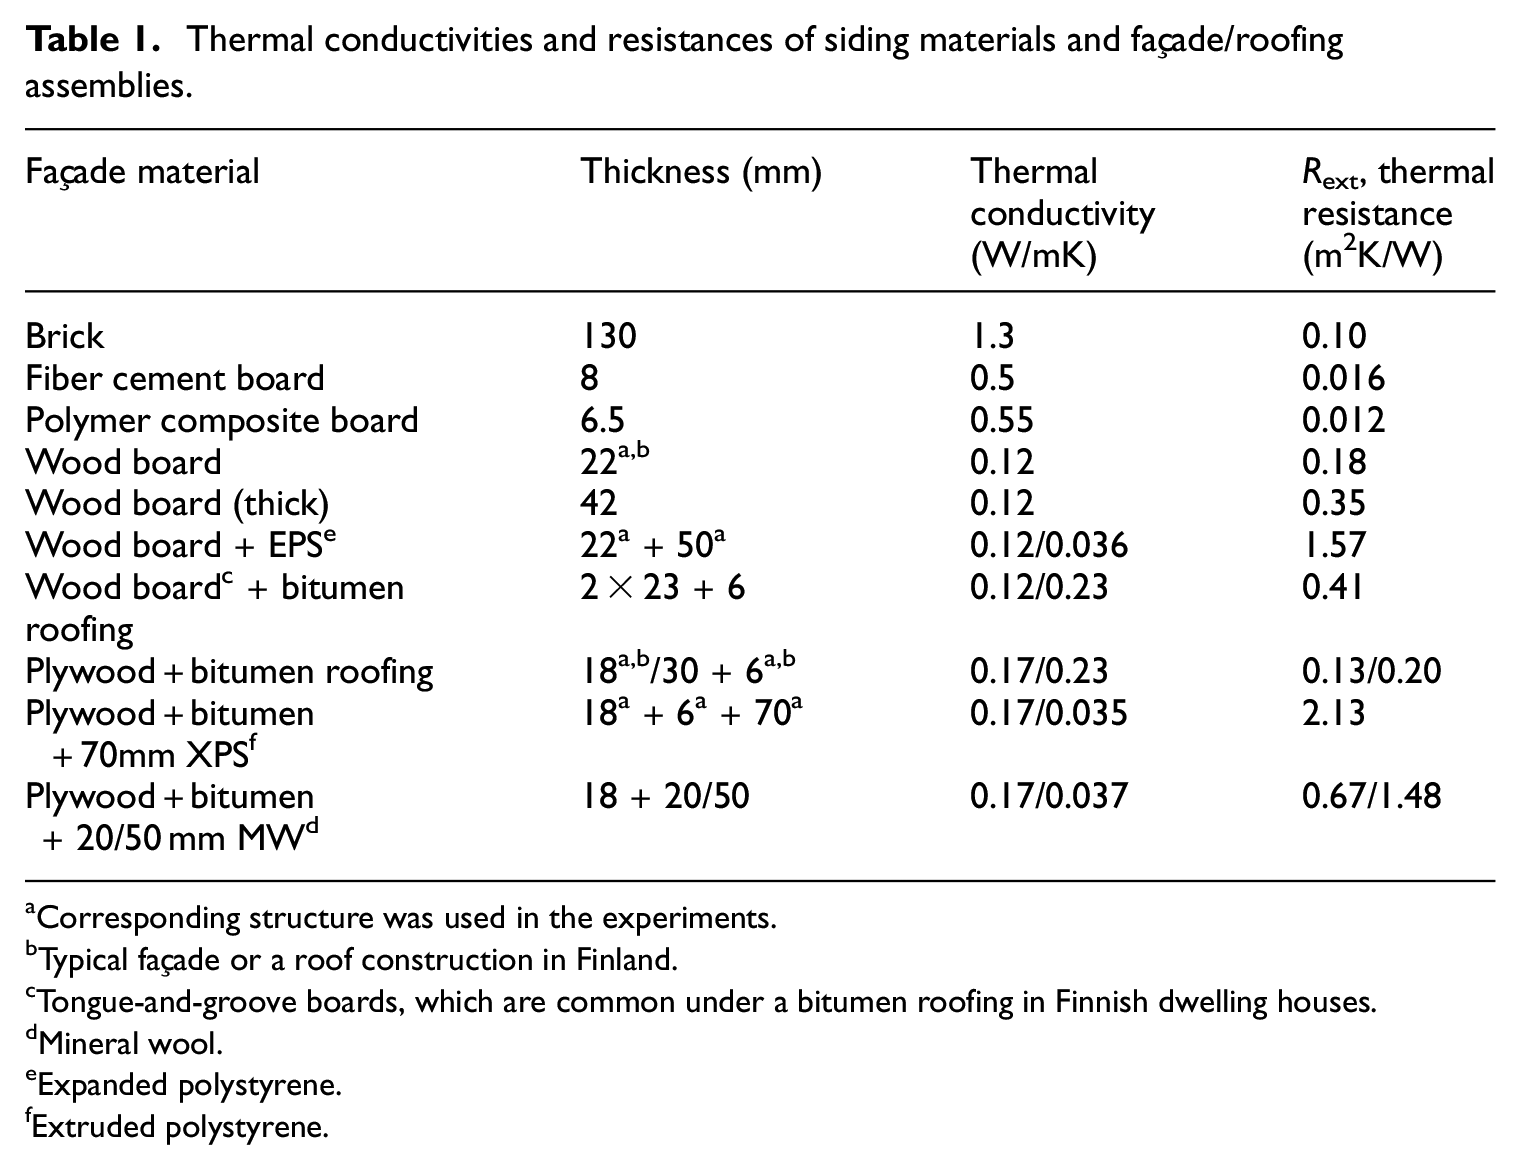
Corresponding structure was used in the experiments.
Typical façade or a roof construction in Finland.
Tongue-and-groove boards, which are common under a bitumen roofing in Finnish dwelling houses.
Mineral wool.
Expanded polystyrene.
Extruded polystyrene.
A Finnish mold growth model (Lähdesmäki et al., 2008; Viitanen et al., 2008), developed from the original work by Hukka and Viitanen (1999), was selected to evaluate the risk of mold formation in the ventilation cavities studied. The model calculates the development of a mold index (MI) based on the hourly temperature and RH conditions. The MI values are in the range of 0–6, corresponding to the following severity levels: (0) no mold growth, (1) small amounts of microscopic mold, (2) distinct microscopic growth, (3) growth visible to the naked eye, (4) distinct growth visible to the naked eye, (5) abundant growth visible to the naked eye, and (6) highly abundant mold growth. The sensitivity classes for both the maximum amount of mold and mold growth speed are as follows: (1) very sensitive, (2) sensitive, (3) medium resistant, and (4) resistant. The recession classes are 1 (strong), 0.5 (significant), 0.25 (relatively low), and 0.1 (almost no decline). The values for the sensitivity and recession classes represented in Figures 5(d), 6, and 8(d), were selected based on the materials in the assemblies (Viljanen et al., 2020).
A laboratory test was assembled to define the pressure losses of some common cavity and gap types of walls and roofs (Figure 3). The test setup was largely like that presented by Falk and Sandin (2013a). The equation used to convert the measurements to pressure losses was also employed to estimate the ACH rates in cavities with higher than normal temperatures. This equation is described in the next section. Due to the low velocities, the flow was assumed to be incompressible; thus, the volume flow of air was constant. A hermetic 6-m-long test track was used to measure the pressure losses by friction and in local obstacles. The airflow volume in an orifice plate pipe and pressure difference between the 3-m length of a cavity were used to determine the friction factors of different cavities. The cavity thicknesses were 22 mm, 22 mm + 22 mm (cross-strapping), 52 mm, and 98 mm. The 22-mm cavity was also equipped with 12 vented metal battens, with six located between the pressure measurements to measure the local loss of a single batten. Later, an eaves structure was attached to the other end of the track to determine the local loss in a 20-mm gap, which had an insect screen with a 2-mm mesh size.
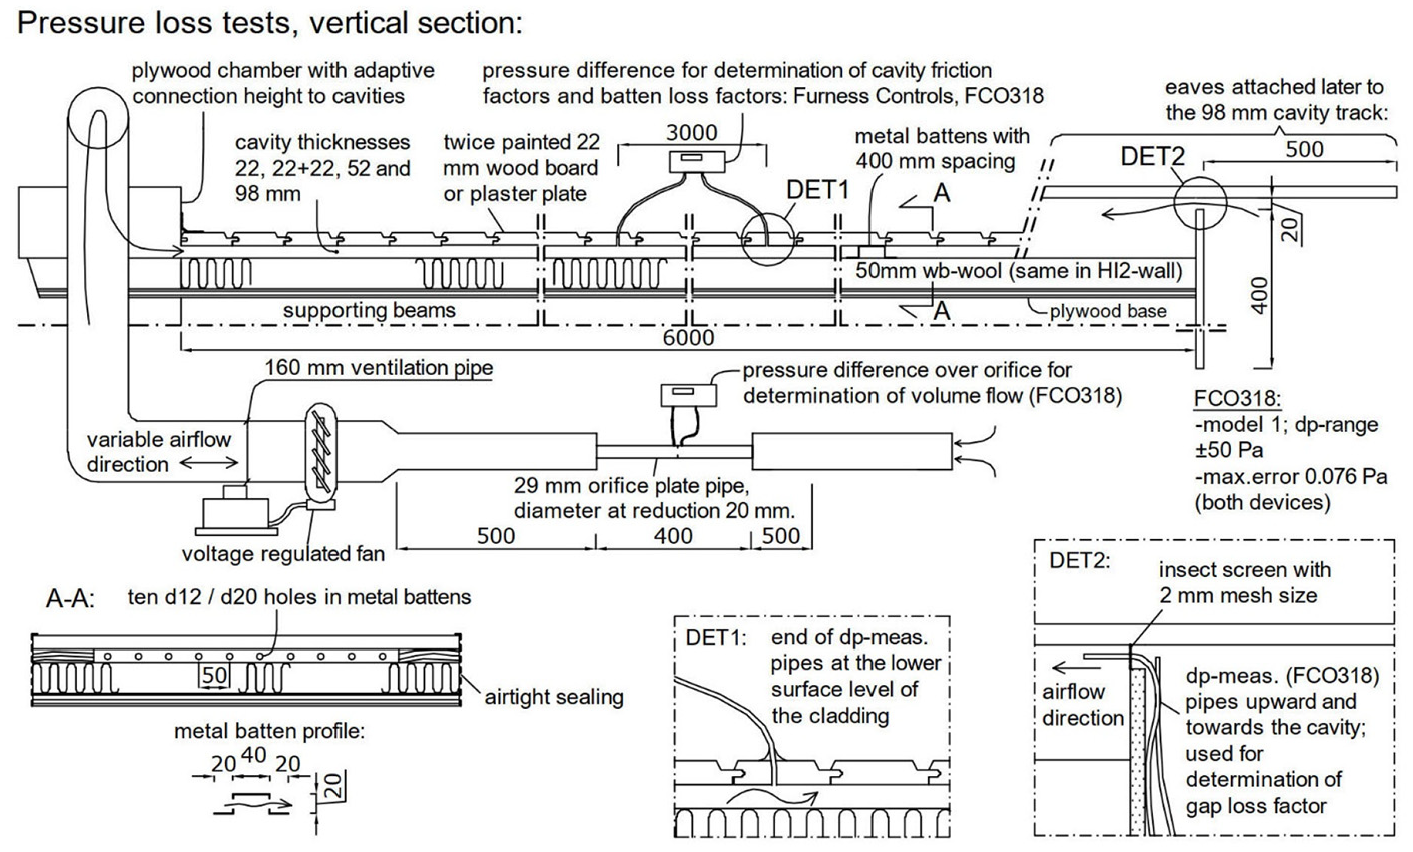
The 6-m-long test track used in the pressure loss experiments. In the second stage of the test, an eaves was constructed to the right end of the track and used to measure the local loss at its opening.
Description of the analytical model for the hygrothermalperformance of the cavity
A computational model was constructed to supplement the experimental studies with a wider range of both cavity ventilation rates and R values outside the cavity. The experiments included totally shut and relatively well-ventilated cavities, and thus, they lacked cavities with low ventilation rates. In the experiments, only single values were used for the increased exterior R values of the walls and roof. Based on the measurements, the computational model simulated the time of year when the outdoor weather presumably contributed to the mold growth in the cavity.
In the cavity, the heat and moisture balance is a complex subject, and its analysis usually requires computational effort. Most numerical models incorporate airflow in the cavity with an average number that describes how many times the cavity air changes in an hour. This ACH value is added as a source term at the external part of the structure. However, such methods ignore the development of the hygrothermal conditions along the cavity. Some detailed convection–diffusion models have been presented to evaluate the hygrothermal performance of the cavity (e.g. Van Belleghem et al., 2015). Despite the optimal accuracy of such models, challenges are usually affiliated with the long total time to create the mesh and boundary conditions, and ultimately, solve the model. In a multivariable analysis, these models are extremely difficult to exploit; thus, faster methods, such as analytical solutions to the heat equation, are appropriate. In this study, we use the steady-state equation (1) for the temperature distribution in the ventilation cavity (Hens, 2007) and the complementary equations (A.1)–(A.9) are presented in Appendix I.

where z is the distance from the inlet (m),

where
Mold growth is possible with temperatures over 0°C when the RH (%) exceeds a limit value that depends on the temperature (°C) (Hukka and Viitanen, 1999):
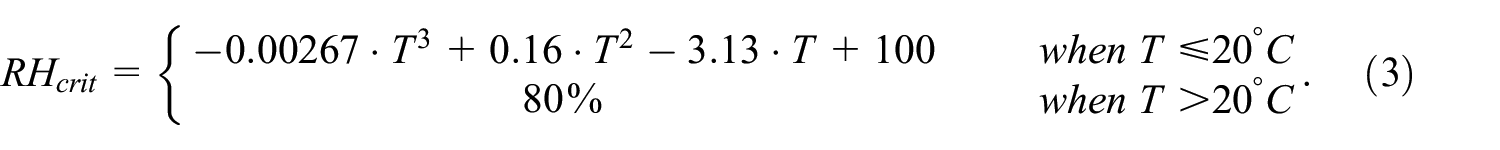
Equation (3) was used to evaluate whether mold growth is possible in the cavity conditions solved by equations (1) and (2). According to the Finnish mold model, mold growth is not possible under 85% RH with materials in sensitivity classes 3 or 4, which delimits the area described by equation (3).
The computational analysis included wall and roof structures that corresponded mainly to the experimental structures. In the HI walls, a same Rint value of 7.7 m2K/W was used, corresponding to a U value of 0.13 W/m2K. The BL wall and the HI roofs (“RF1–RF3”) had the same U values as the experimental ones (0.23 W/m2K, 0.08 W/m2K), whereas the U value of the BL roof (“BL-RF”) was selected as 0.15 W/m2K, which was the benchmark value in Finland in the years 2007–2010, before the value was lowered to 0.09 W/m2K (Finnish Ministry of the Environment, 2007, 2010). Structures included PE foil vapor barriers (HI1, BL, RF1, BL-RF) and PA vapor retarders (HI2, RF2). Indoor RHs of 40% and 50% were used to test the effect of increased vapor diffusion rates toward the cavity, which was largest in structures with a PA foil. In the HI3 wall and RF3 roof, the vapor diffusion rate toward the cavity was zero; thus, the cavity AH equaled the outdoor AH. Walls HI4 and HI5 had Sd values of 150 m and 877 m, respectively, of which the first one described a 0.4-mm-thick PE vapor barrier and the other an aluminum laminate vapor barrier. These walls were included in the analysis to evaluate the benefits of more vapor tight foils on the cavity conditions. The analysis comprised 3-m-high walls with 22-mm-thick cavities and 5.5-m-long roofs with 100-mm-thick cavities.
Cavity velocities (0.015 mm/s−0.31 m/s) corresponding to ACH values of 0.01–200 1/h and Rext values in the range of 0.016–1.0 m2K/W were used in equations (A.2), (A.11), and (A.16) and equations (A.3), (A.4), (A.8), and (A.9), respectively, to evaluate the effects of these potentially significant factors on the hygrothermal conditions in the cavities. The maximum velocity is close to the one (0.25 m/s) measured by Susanti et al. (2008) in a naturally ventilated roof with a 30° slope, a 78 mm high cavity, and no flow restriction at the eaves. Environmental conditions were constants; the outdoor temperature was 5°C, outdoor RH was 90%, and indoor temperature was 21°C in all cases. The outdoor values represented outdoor conditions during the experiments when the MI levels rose in the cavities of the experimental structures. With an outdoor temperature of 5°C, the critical RH based on equation (3) is 88%, above which mold growth is possible.
An additional, purely thermal model was developed to evaluate the risk of snow melting in roofs. In HI roofs, the risk of snow melting is lower compared to less insulated roofs, because the exterior of the roof is colder (Blom, 2001). However, the improvement of the cavity conditions by increasing the thermal resistance of the structure above the cavity may affect the prevalence of weather conditions, which enable snow melting. This was evaluated with equation (1) by using three thicknesses for the snow (0.1 m, 0.3 m, and 0.5 m), three thicknesses for the exterior MW (0 mm, 20 mm and 50 mm), and ACH rates between 0.01 and 100 1/h. The temperature under the snow was calculated from the cavity temperature solved using the R values of the exterior layers. The analysis omits the effect of solar radiation, which may generate snow melting when the snow thickness is low (Baker, 1967).
The airflow in a ventilation cavity is generated by the pressure difference between the cavity inlet and outlet. The pressure difference across the cavity is induced by wind and by the stack effect. The stack effect (Pa) is calculated with equation (4) (Langmans et al., 2016):

where
Langmans et al. (2016) showed, that the warmer the ventilation cavity compared to outdoor air, the higher the cavity ACH rate is. They continued, that this temperature difference is mainly caused by solar radiation. However, especially with increased exterior R values, such conditions may arise from heat conduction from indoors and the conditions are less influenced by solar radiation. This buoyancy-induced airflow may cool the cavity and impair the benefit of the increased exterior R value. To assess this, the cavity ACH rates in the selected wall and roof configurations were evaluated by setting the buoyancy force (equation (4)) to match the pressure losses along the ventilation cavity:

where
Results
Results from the experimental studies
The amount of solar radiation on the external surfaces varied with the season
Two nearby walls, one opposite and other adjacent to the four test walls, shaded the façade of the test walls. Therefore, the sky view factor of the test walls was 0.13 (Appendix II). As shown in Figure 4(a), in 2018–2019 the monthly global shortwave radiation received by the test walls corresponds to approximately 50% of the amount of radiant energy measured to a horizontal plate in Kumpula weather station (Finnish Meteorological Institute, 2020a). The global horizontal radiation may be used to evaluate the radiation toward the test roof, which was little shaded by the nearby obstacles. The bottom part of the wall facade received slightly less radiation, as in the morning the solar radiation hit this area 2 h after (based on visual observations) the first solar radiation was measured at the upper part of the façade. Such situations are probably common with dense urban structure. The diurnal radiation fluxes in February–October show, that the lower amounts of radiant energy directed to the facade originates from the shorter daily duration of incident radiation, whereas the peak solar irradiance is occasionally higher in walls compared to the roof (Figure 4(b)). In wintery Finland, the amount of global radiation is low regardless of the inclination or direction of the surface (Figure 4(a)).
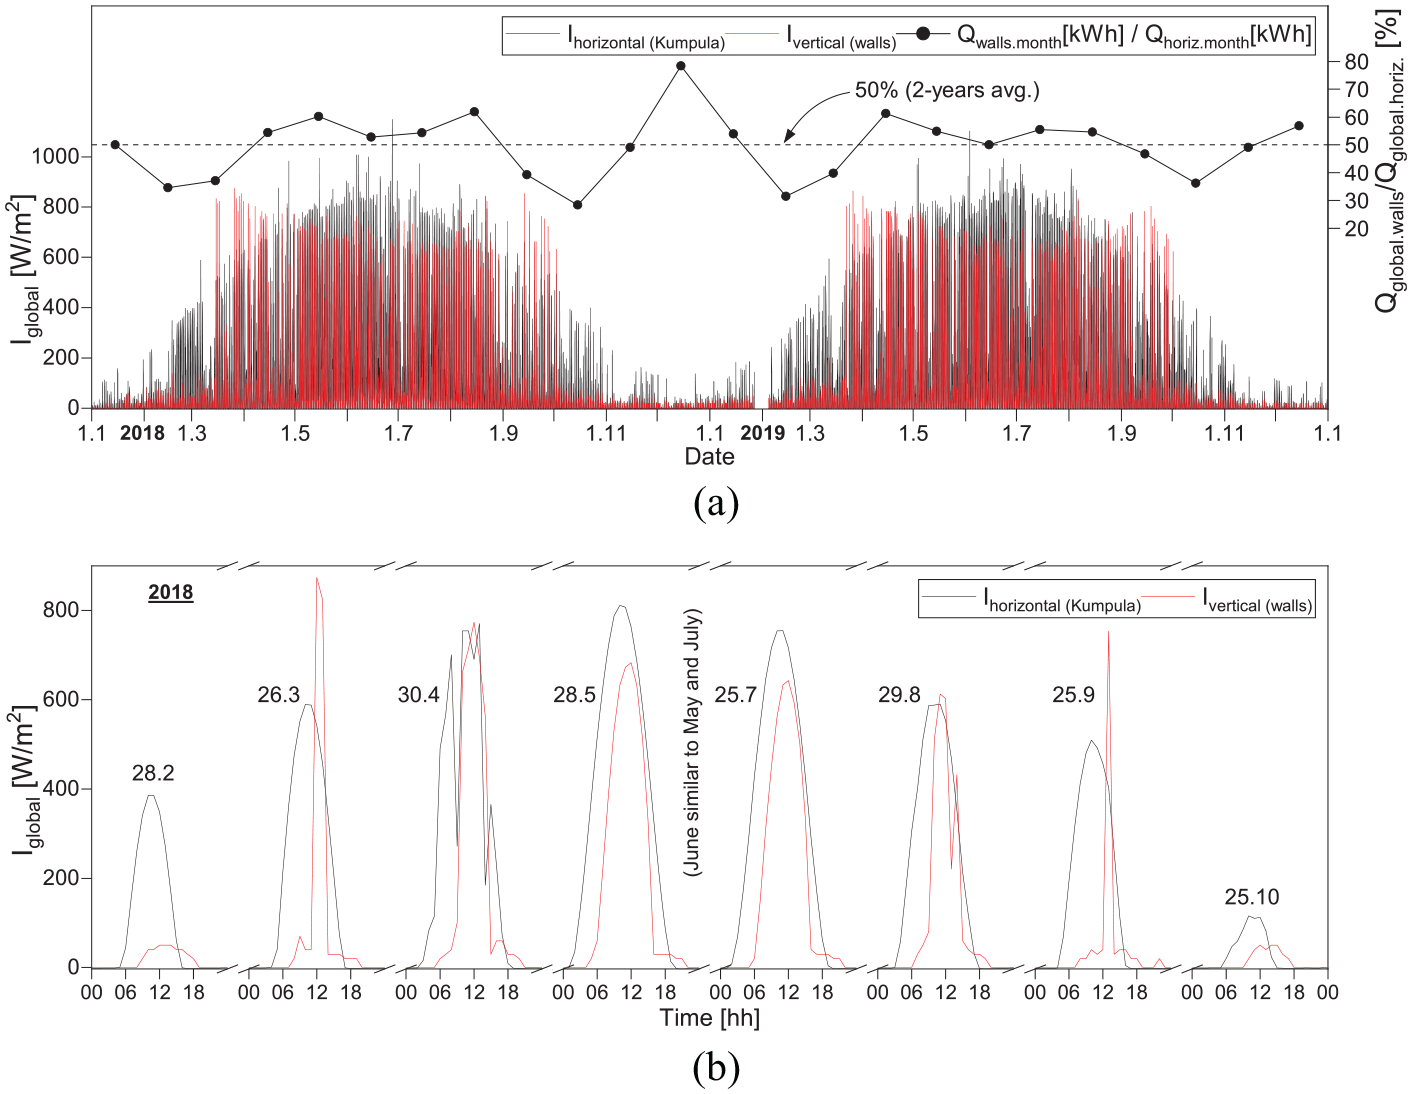
The measured global short-wave radiation flux to the vertical test walls and to a horizontal plane (Finnish Meteorological Institute, 2020a): (a) during years 2018–2019 and (b) typical diurnal radiation fluxes in February–October in 2018.
Cavity temperatures in walls
The measured cavity temperatures in the walls are presented in Figure 5(a). During the cold season, the average cavity temperatures were constantly 0°C–2°C over the outdoor level with a normal façade that had an R value of 0.18 m2K/W. The cavity in the BL wall was approximately 1°C warmer than the cavities in the HI walls. The warmest cavity among the HI walls was in wall HI2, which may have resulted from additional heat flux through the connection with the BL wall (Figure 1). Such temperature excess was not observed by Langmans et al. (2016) from walls with U values of 0.27 W/m2K, which is probably connected to the low exterior R values of 0.02 m2K/W and 0.04–0.1 m2K/W of the fiber cement and brick veneer facades, respectively, and to the lower indoor temperature around 18°C (Langmans and Roels, 2015) and higher ventilation rates in the walls with fiber cement sidings. The thermal conductivity of brick veneer increases significantly with higher moisture content of the material, which can be assumed to have been at least slightly elevated in their rain exposed test hut, thus, decreasing the insulation properties of the façade.
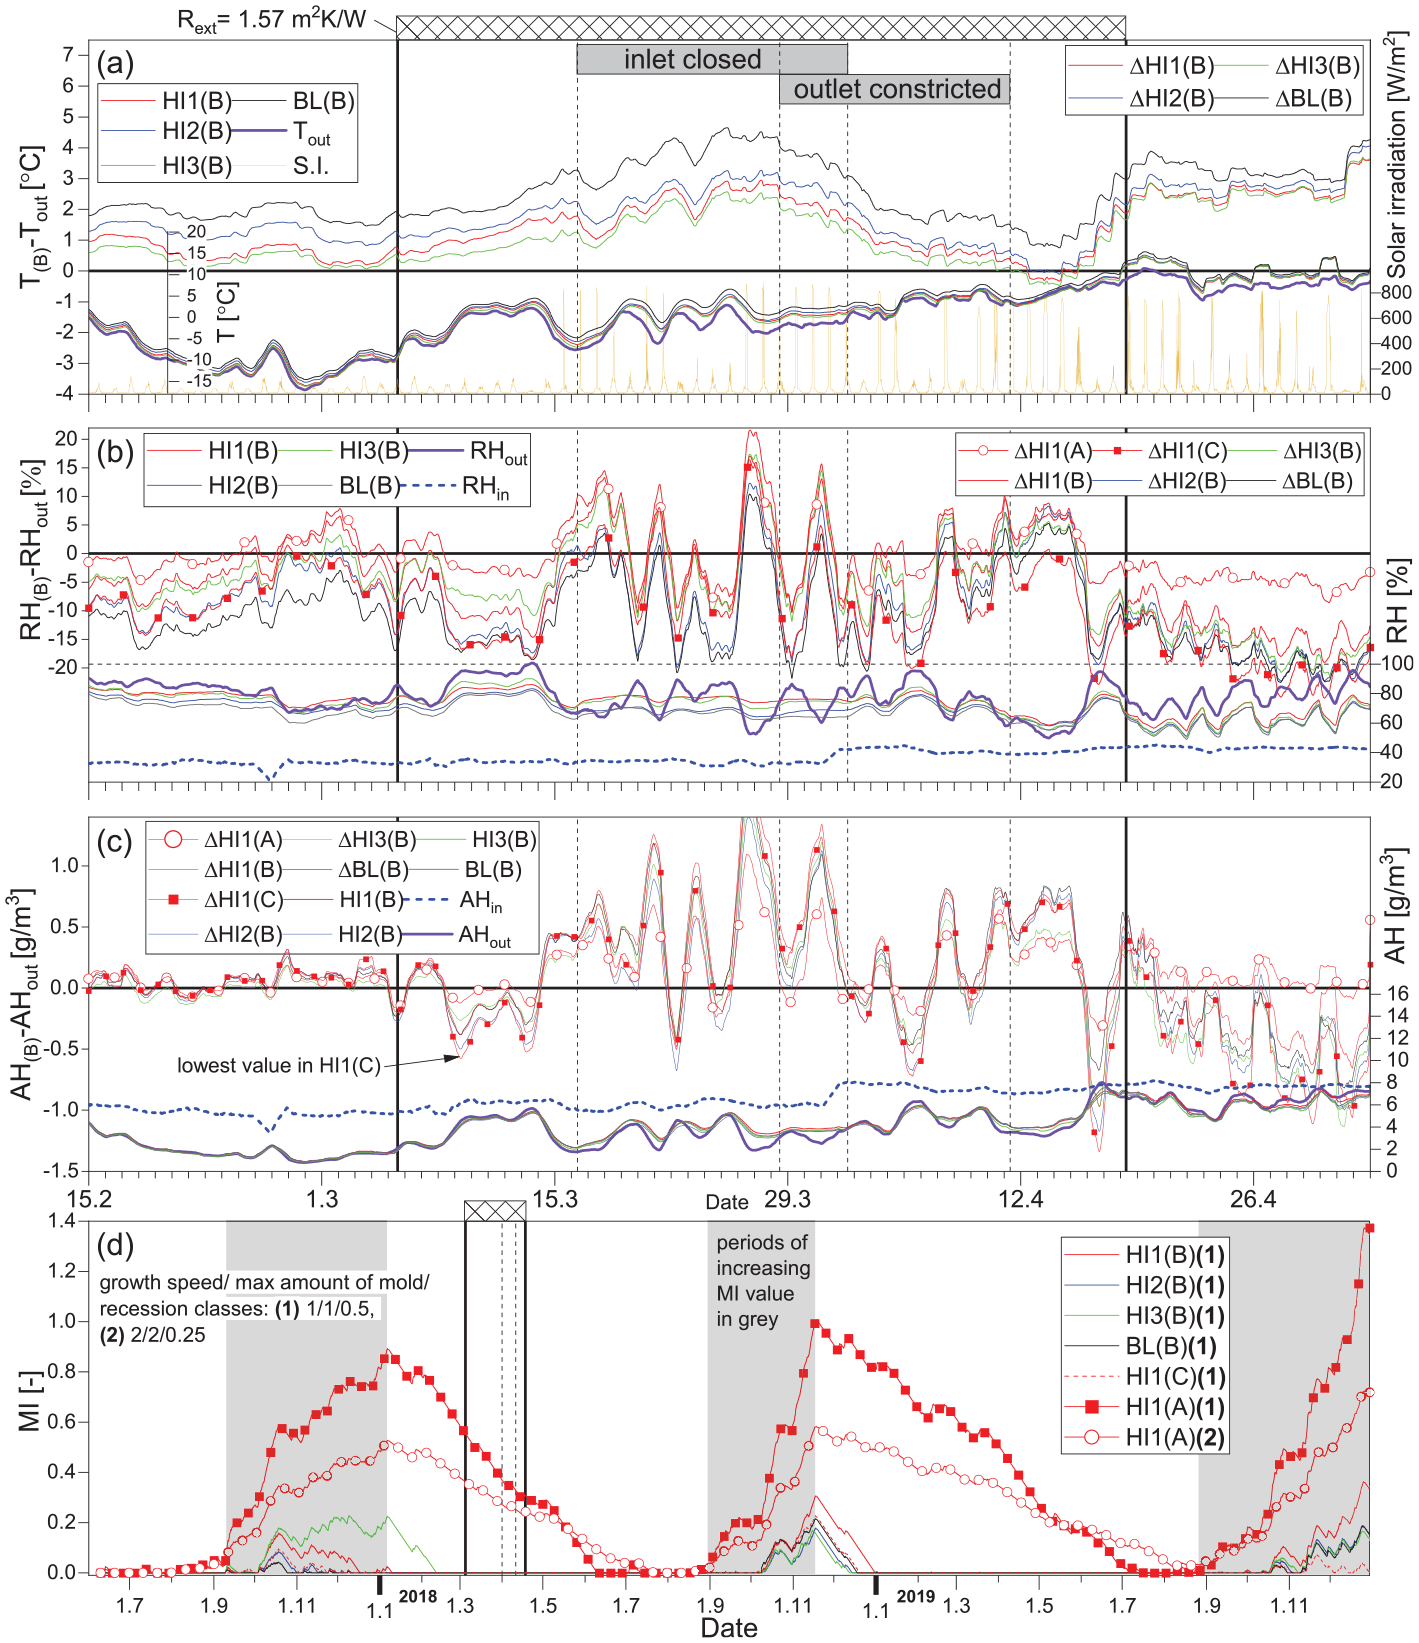
The results from the wall measurements: (a) temperature difference in the wall cavities compared with outdoor air and cavity temperatures, (b) RH difference in the cavities and cavity RHs, (c) AH difference in the cavities and cavity AHs. Values in subfigures (a)–(c) are 1-day averages, and (d) calculated MI values in the cavities during the whole test.
With a 50-mm EPS on the cladding, the temperatures increased only after the cavity inlet was closed. The average cavity temperature excess in relation to outdoor air was 2°C–3°C and 4°C–4.5°C in the HI and BL walls, respectively, which indicated the effect of different levels of U value on cavity temperatures. The temperature excesses varied in the range of 0°C–6°C due to the changes in the outdoor temperature. The constriction of the outlet gaps from 25 mm to 10 mm did not change the cavity temperature excesses. Opening the inlet returned the excesses to slightly below the level before the inlet was closed due to the increasing outdoor temperature.
Hygric conditions in wall cavities
In winter, with a normal façade, cavity RHs were typically 0%–5% below the outdoor level in walls HI1 and HI3, 0%–10% below the outdoor level in the HI2 wall, and 5%–15% below the outdoor level in the BL wall (Figure 5(b)). Placing the 50-mm EPS over the cladding slightly lowered the cavity RHs compared with the outdoor RH only when the outdoor RH increased. After the inlet was closed, cavity RHs varied over and below the outdoor level, which resulted from the variations in outdoor RH, whereas the cavity RHs were steadily below 80%. RHs in the cavities of the HI walls were at most 10% above the level in the BL wall, which showed that the effect of the U values on the cavity RHs remained in the walls. Opening the inlet raised the cavity RHs only a little, but the RHs gradually started to follow the outdoor level.
The cavity AHs were close to the outdoor air and each other during the cold season (Figure 5(c)). The 50-mm EPS assembled on the cladding lowered the cavity AHs slightly below the outdoor level, although at point HI1(A), as expected, the AH remained at the outdoor level. AH was lowest at point HI1(C), which was least influenced by the increase in the outdoor AH. Closing of the inlet increased the AH values over the outdoor level, which was especially evident when the outdoor AH decreased; the cavity AH did not follow the outdoor AH. This may be caused by the low ventilation rate and diffusive humidity from indoor air toward the cavity; indoor RH was 35%–40% during the phase with 50-mm EPS. The AHs decreased to the outdoor level after the inlet was opened, but variations over and below outdoor levels occurred with sunny and cloudy weather, respectively. The results from the HI2 wall do not imply an excessive amount of vapor diffusion from the indoor, which was influenced by the moderate indoor RH level, high Sd value of the PA foil (26.7 m during closed inlet, Figure A2), and short duration of the period (16 days) with the closed cavity inlet. During such short periods, the hygroscopic capacity of the wood cladding equalizes the fluctuations of AH in the cavity. Similar AH values in the HI3 cavity compared with the other cavities suggest that vapor diffusion rates were low enough in all the walls with respect to the ACH rates in the cavities. In winter, the ACH rate in the HI1 cavity was 40 1/h on average (Viljanen et al., 2020).
Mold growth potential in wall cavities
The MI values in the cavities did not respond to the increased R values of the façade (Figure 5(d)). This was based on the timing of the phases between March and July, since the MI values decreased or remained at zero annually between January and August. The decrease of the MI values at point HI1(A) slowed down after the removal of the 50-mm-thick EPS board. During the whole test, the MI values increased in point HI1(A) to 1.4 with the most sensitive model parameters. The MI results at point B during the whole test do not show risks connected to the moisture-adaptive vapor retarder in HI2 wall, although the Sd value of the PA foil was at times less than 5 m in the cold season based on the measured RH at the different sides of the foil (Figure A2). After the test, mold growth was visually observed only at the bottom of the wooden vertical cavity battens in the HI1 wall and between the BL and HI3 walls.
The first period, during which MI values increased in the wall cavities, was evaluated in more detail (Figure 6). In September, the MI value at point HI1(A) began to rise, when the cavity RH reached a level over 80%, which was a few percentage points under the outdoor RH level. The temperature at point HI1(A) was 0.5°C over the outdoor level, whereas temperatures were 1°C–1.5°C over the outdoor level at point B in all walls. The RH at point HI1(B) was 73% at that time. In the middle of October, RH at point HI1(A) had reached the outdoor level, which typically remained until April. However, MI values already started to decrease in November–January. These timings were influenced by the outdoor temperature, which prevented mold growth when decreased to below 0°C.
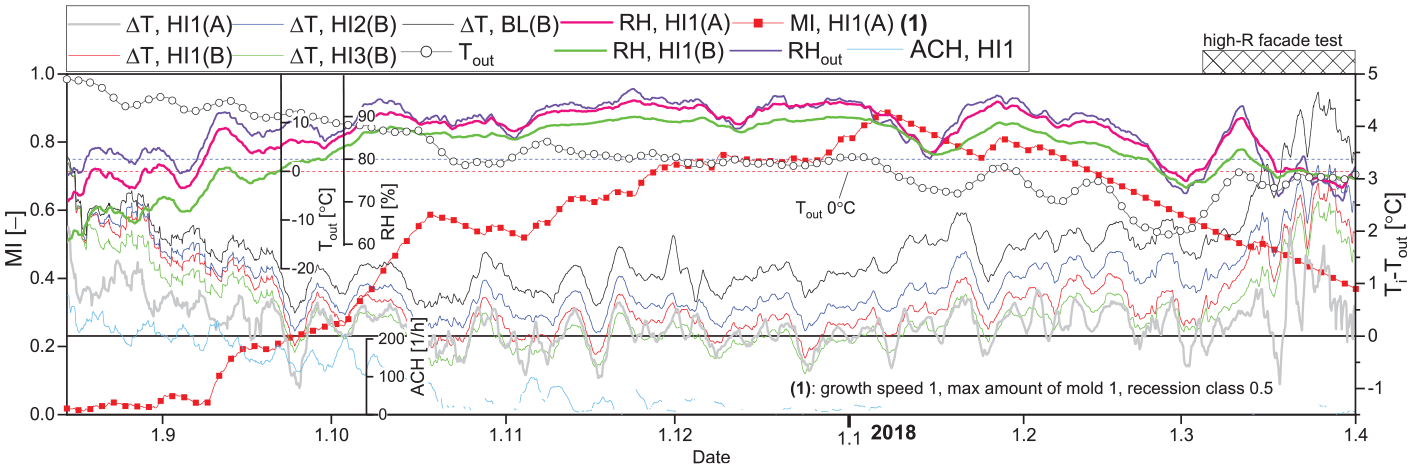
The evaluation of the conditions during which the MI value increased at point HI1(A): MI in point HI1(A) (unaveraged), outdoor temperature, RH in the HI1-wall cavity and outdoor air (1-week averages), cavity ACH in the HI1 wall (2-day averages), and temperature differences between wall cavities and outdoor air (4-day averages).
Inhibition of mold growth and enhanced drying in summer
The optimum growth temperature of 70% of the evaluated mold fungi species is between 20°C and 30°C, and this percentage rises to 84% with upper temperature limit of 35°C (Sedlbauer, 2001). The typical upper temperature limit below which mold fungi can grow is 50°C (Hukka and Viitanen, 1999; Sedlbauer, 2001), although according to Sedlbauer (2001) 5% of the evaluated fungi species are able to grow at higher temperatures. For mold fungi, the lethal temperature level lies around 80°C (Sedlbauer, 2001). In addition, based on the study by Tang et al. (2015) on ventilation filters, regular changes in temperature hinder mold growth. The critical low RH level, which inhibits mold growth on ventilation filters, lies between 11% and 43% (Tang et al., 2015); such RH levels may permanently prevent mold growth also in structures, even if RH subsequently rises to a favorable level.
The measured wall cavity temperatures reached typically the level of 40°C–50°C on sunny summer days (Figure 7, days 30.5 and 17.7) with a maximum measured temperature of 53°C. These high temperatures were based on the low exterior R value and the absorption coefficient of solar radiation of the dark façade, which had a value near one. The temperatures at the bottom parts of the cavities in walls HI1 and HI3 were lower compared to points B and C because of the cold inlet air; yet, they reached a level over 40°C on midsummer days (Figure 7, day 17.7). When a 10-mm-thick white EPS board was assembled over the façade (Rext 0.46 m2K/W), cavity warming was significantly reduced as the temperatures stayed below 30°C influenced both by the increased exterior R value and the decreased absorption coefficient. A 42-mm-thick wood cladding painted dark (Rext 0.35 m2K/W) would probably induce much higher cavity temperatures between 30°C and 40°C ensuring enhanced summertime drying of the cavity, the wall frame, and the insulation layer, which is an important feature of a well-performing solar-exposed wall.
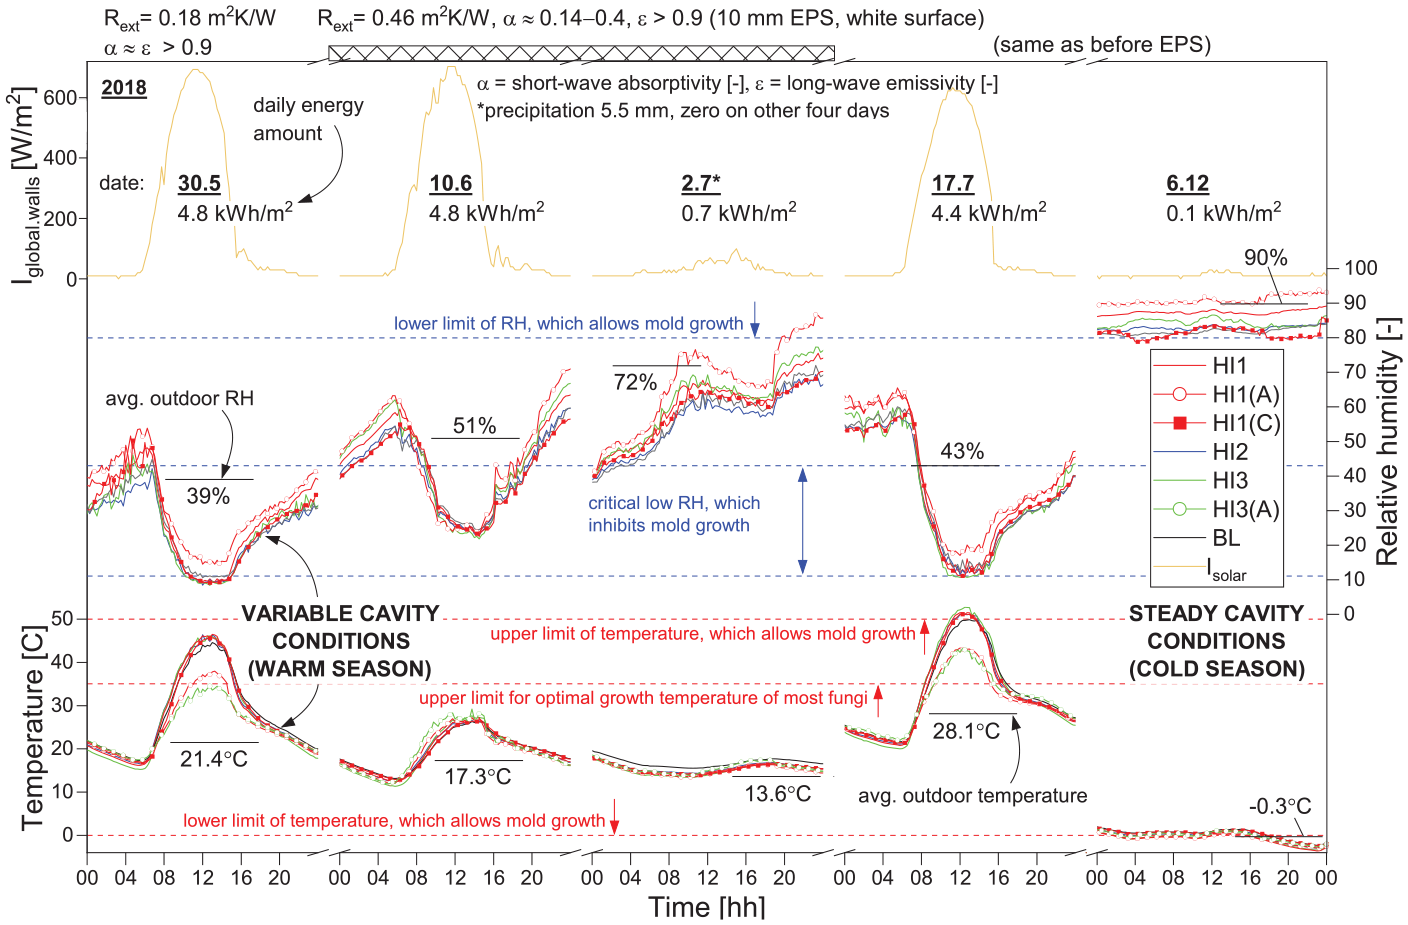
The measured solar irradiance and cavity conditions on five example days. The absorptivity and emissivity values of the facade surface are based on Cengel (2012) and Fraunhofer-Institute for Building Physics (2008). The horizontal dashed lines represent critical environmental conditions with respect to mold growth.
The observed fluctuation of the cavity temperatures and the momentary high cavity temperatures above 35°C were likely stressors for most of the fungal species. Cavity temperatures might reach higher levels like 60°C in wall cavities, where the ventilation is not as open as in the experimental walls. Nevertheless, the cavity temperatures remained well below the lethal level for mold fungi, which is in line with the observed mold growth at the bottom of the cavity battens. The lower peak temperatures in this area may have contributed to the mold growth, but a more significant factor was probably the higher RH levels in winter compared to the upper parts of the cavity.
During sunny days, very low cavity RHs between 10% and 30% were obtained simultaneously with the elevated temperatures even in the façade that had the additional EPS board, although in this case, the cavity RHs were slightly higher (Figure 7, day 10.6). The observed simultaneous change in the hygrothermal conditions in the cavity may not have been studied experimentally with respect to its impact on fungal growth, since usually either temperature or RH is kept constant (e.g. Johansson et al., 2013; Pasanen et al., 2000; Tang et al., 2015). Nevertheless, it is known that an intermittent dry environment inhibits mold growth (Johansson et al., 2013; Tang et al., 2015). The longer the phase with low RH, the larger the decrease in mold growth (Johansson et al., 2013). Therefore, low RHs either diurnally or covering a longer period during summer reduced mold growth in the studied cavities.
The above factors support the view, that mold growth is not likely in wall cavities during summer, but rather possible with steady and more humid cavity conditions in the cold season (Figure 7, day 6.12). In summer, the increased cavity temperatures allow for enhanced drying rates of the walls and the hygrothermal conditions may even inhibit mold growth. However, facades facing other direction than southeast may perform differently compared to the examined walls. In Finland on sunny spring days, the south facing facades warm up the most, east and west facing facades warm up significantly, and north facing walls remain close to outdoor temperature level (Viljanen, 1983). This is based on the differences in the solar irradiance on facades facing different directions (Seppänen, 2001). In summer, the difference in the daily amount of solar radiation energy between façade orientations east, southeast, south, southwest, and west becomes small (Seppänen, 2001); thus, enhanced summertime drying and the fluctuating hygrothermal conditions in the cavity occur in all such facades, but these phenomena are less present in the facades facing other directions. As the hygrothermal conditions of the cavity in the cold season in the facades facing northeast, north, and northwest are likely quite similar to those measured from the southeast facade, the possible slight mold growth at the bottom of the cavity may not be inhibited sufficiently in the warm season. Consequently, it is useful to study potential methods for equalizing the cavity conditions between facades with high and low level of solar-exposure. As an example, horizontal cavity battens made of metal may be utilized to conduct heat from warmer to colder parts inside the building exterior wall. Heat transfer by convection by connecting the adjacent air cavities, however, is not recommended, as possible high pressure differences around the corners of the building may cause driving rain leakages and wind washing of the thermal insulation.
The development of mold growth in solar-exposed cavities may not be precisely evaluated by mold models. The most relevant environmental conditions in the material tests that were used to calibrate the Finnish mold model considering summertime conditions in the cavities included alternating RH conditions of 50% and 97%, which lasted 8 and 4 weeks at a time, respectively, and a constant temperature of 22°C (Lähdesmäki et al., 2008). Therefore, the tests lacked increased temperature levels, very low RH levels, and short-term fluctuations in these conditions, all of which are typical to solar-exposed facades. The calculated MI value of 1.4 at point HI1(A) implied microscopic mold growth, whereas the observed mold growth in the battens corresponded to a MI value at the level of 3–4. The precise decline rate of mold growth may be challenging to model; this property is included only in the third of nine available mold models for wood (Gradeci et al., 2017). Nevertheless, the current model decently identified the mold risk at the bottom of the cavity and predicted the adequate performance in the upper parts of the cavity.
Cavity temperatures in the roof
During the cold season, the cavity temperature in the RF2 roof was close to the outdoor temperature (Figure 8(a)) influenced by the relatively high ACH in the roof cavity in winter, 44–131 1/h. Cavity temperatures rose to 0.5°C–1°C above the outdoor level in January–February 2018, which probably resulted from the snow on the roof at that time (Figure 8(d)). The thickness of the snow on the ground in February was 25 cm (Finnish Meteorological Institute, 2020b), which was in line with the visual observation of snow on the roof. Such cover of snow has R values of 0.4 m2K/W when the snow is dense and 2.1 m2K/W when it is soft. During the phase with the 70-mm XPS on the roof, the cavity temperature remained 0°C–1°C above outdoor air. After closing of the ventilation inlet, the cavity temperatures rose to 1°C–2°C above outdoor air on average, which corresponds to the temperature increase obtained by Jensen et al. (2020) in an unventilated roof cavity with 50-mm-thick exterior polystyrene insulation. The outdoor temperature increased 4 days later, and the cavity temperature excesses decreased to zero. The additional insulation blocked part of the heat from the increasing solar irradiation power. The outlet constriction had little effect on the cavity temperatures. The removal of the XPS insulation decreased the temperature excess of the cavity until later sunny weather raised the temperature excess to as high as 10°C.
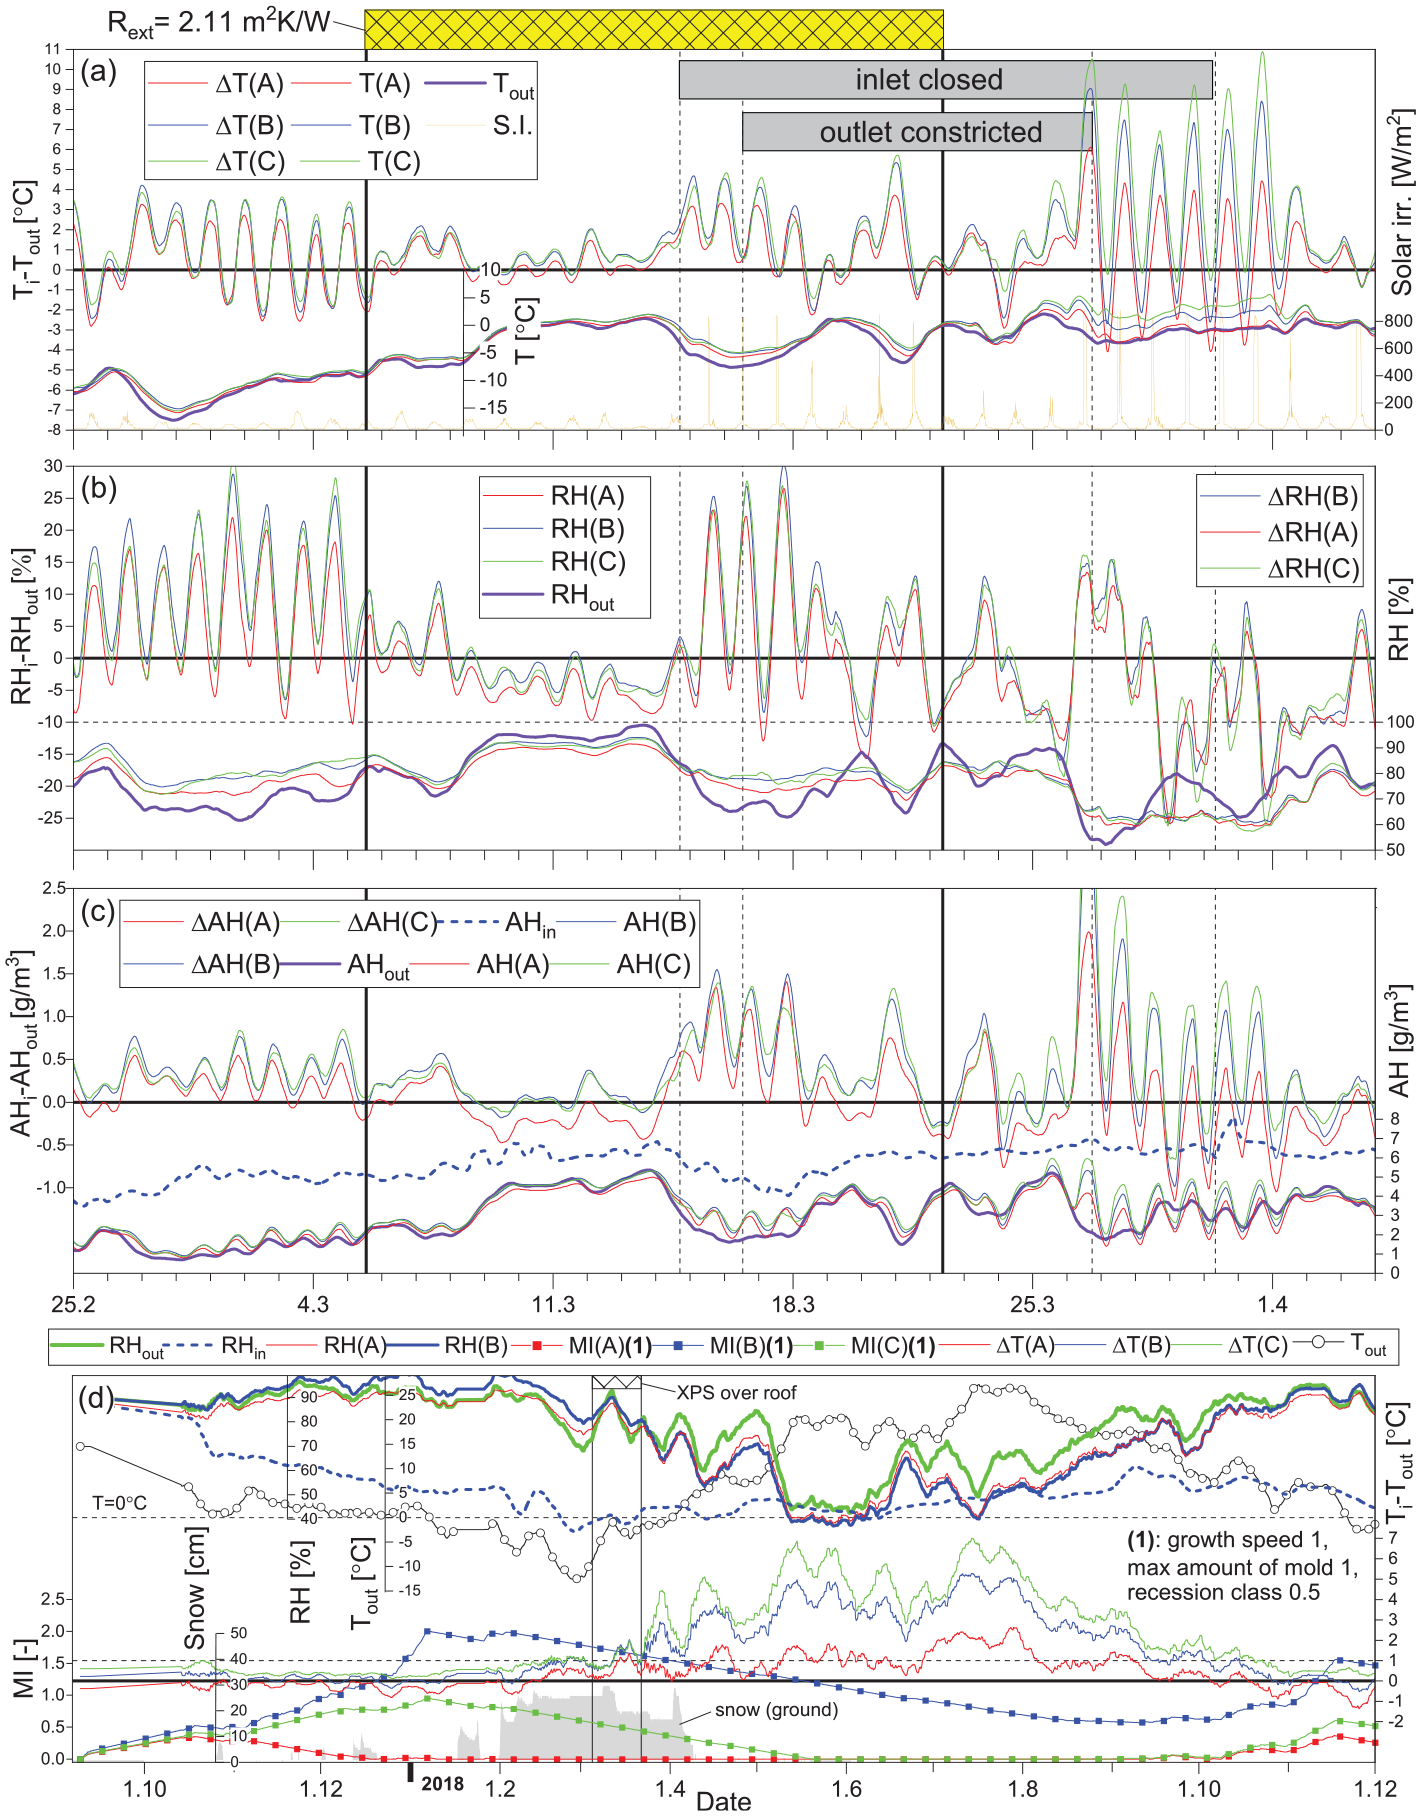
The results from the RF2 roof measurements: (a) temperature difference in the roof cavity compared with outdoor air (12-h averages) and cavity temperatures (1-day averages),(b) cavity RH difference compared with outdoor air (12-h averages), cavity RHs and outdoorRH (1-day averages), (c) cavity AH difference compared with outdoor air, cavity AHs, and environmental conditions (12-h averages), and (d) cavity MI (unaveraged) and RH values, environmental RHs, cavity temperature excess between outdoor air, outdoor temperature(1-week averages), and thickness of snow by the Finnish Meteorological Institute (2020b).
Hygric conditions in the roof cavity
The cavity RH was 10% above the outdoor level, on average, in the cold season (Figure 8(b)). In points B and C, RH was higher compared to point A, which may have resulted from built-in moisture and diffusive humidity from indoor air. The indoor RH was 40%–45% during the period represented in Figure 8(a)–(c). The addition of XPS on the roof decreased the cavity RH below the outdoor level. The closing of the cavity inlet increased the cavity RH over the outdoor air level after the outdoor RH decreased. The moisture transferred by diffusion toward the cavity from indoor air possibly accumulated in the cavity when the ventilation rate was reduced. Removal of the XPS had no clear effect on the RH levels in the cavity until the increase of solar irradiation levels. Then, cavity RH decreased in 3 days to 15% below the outdoor level. The cavity RHs approached the outdoor level after opening the cavity inlet, but the dominant effect of solar irradiation, which decreased the cavity RHs, remained.
Cavity AHs were 0.25–0.5 g/m3 above the outdoor level during the cold season (Figure 8(c)). The XPS insulation over the roofing and later the increase in outdoor AH declined the cavity AHs to that of the outdoor level or below it. The closing of the inlet raised the cavity AHs to a level that was distinctly above the outdoor AH; together with the RH results, this supported the view that there was moisture accumulation in the cavity. The AH was lowest in the cavity at point A throughout the period represented in Figure 8(a)–(c), which supports the possibility that a significant amount of moisture transferred from indoor air toward the cavity. The low air leakage rate of 0.19 m3/hm2 of the building envelope at a 50-Pa pressure difference suggests that this moisture flux was mainly based on diffusion. An another source of moisture may have been the excessive humidity in the wooden material of the cavity. The removal of the XPS and/or outlet constriction did not have significant effects on the AH curves before the solar radiation power rose. The warming of the cavities released humidity into the cavity, which was removed from the cavity in 3 days.
Mold growth potential in roof cavity and contributing factors
The MI values increased in autumn in the roof cavity, especially at points B and C (Figure 8(d)), the timing of which coincides with the calculation results by Nik et al. (2012). The main reason for this was that RH was between 85% and 100% at these points, which was partly influenced by the almost nonexistent temperature excess in the cavity. The MI values started to lower in January at points B and C when the cavity temperatures dropped below zero. In April, when the temperatures rose above zero, the decline of MI values continued because the cavity RHs had decreased below the outdoor level and were under 80%. This was mainly caused by the increased amounts of solar irradiation, which led to high temperature excess levels in the cavity. During the whole test period, the MI values rose to 0.95 and 2 at point C and B, respectively (Viljanen et al., 2020). The moisture risks in HI roofs may increase in the future implied by the high MI levels in the roof air space presented by Nik et al. (2012) and Viljanen et al. (2020).
A north facing low-sloped HI roof is expected to perform mainly the same way as the studied roof. With a high roof slope, however, the amount of incident solar radiation approaches the level of a north facing wall. For example, at the latitude of Helsinki (60° N) the solar elevation angle during the warm season is mostly between 30°–50° (Seppänen, 2001). The north facing roofs with a slope of this level receive little solar radiation decreasing the enhanced drying ability and inhibition of mold growth. Hence, a moderate roof slope between 10° and 20° in terms of solar radiation is recommended for north facing HI roofs, which still ensures a base level of cavity ventilation.
The cavity temperatures in the RF2 roof at points A–C, which were momentarily below outdoor air, were analyzed together with the cloud index and the humidity conditions in the cavity (Figure 9). In autumn, cavity temperatures in the roof declined to below outdoor air, especially at points A and B. Simultaneously, cavity RH rose as much as 10% above the outdoor level. The conditions coincided with the times when the sky was partially or completely cloudless. In the HI2 wall, which had the same vapor barrier, such cooling of the cavity or high RH levels did not occur. These results emphasized the lower impact of long-wave thermal radiation between exterior surfaces and cold sky to the hygrothermal cavity conditions in walls compared to roofs. This difference is based on the sky view factor of the exterior surface, which has maximum values of one in roofs and 0.5 in walls. The sky view factor of a wall surface is typically decreased more from these maximum values by the nearby obstacles.
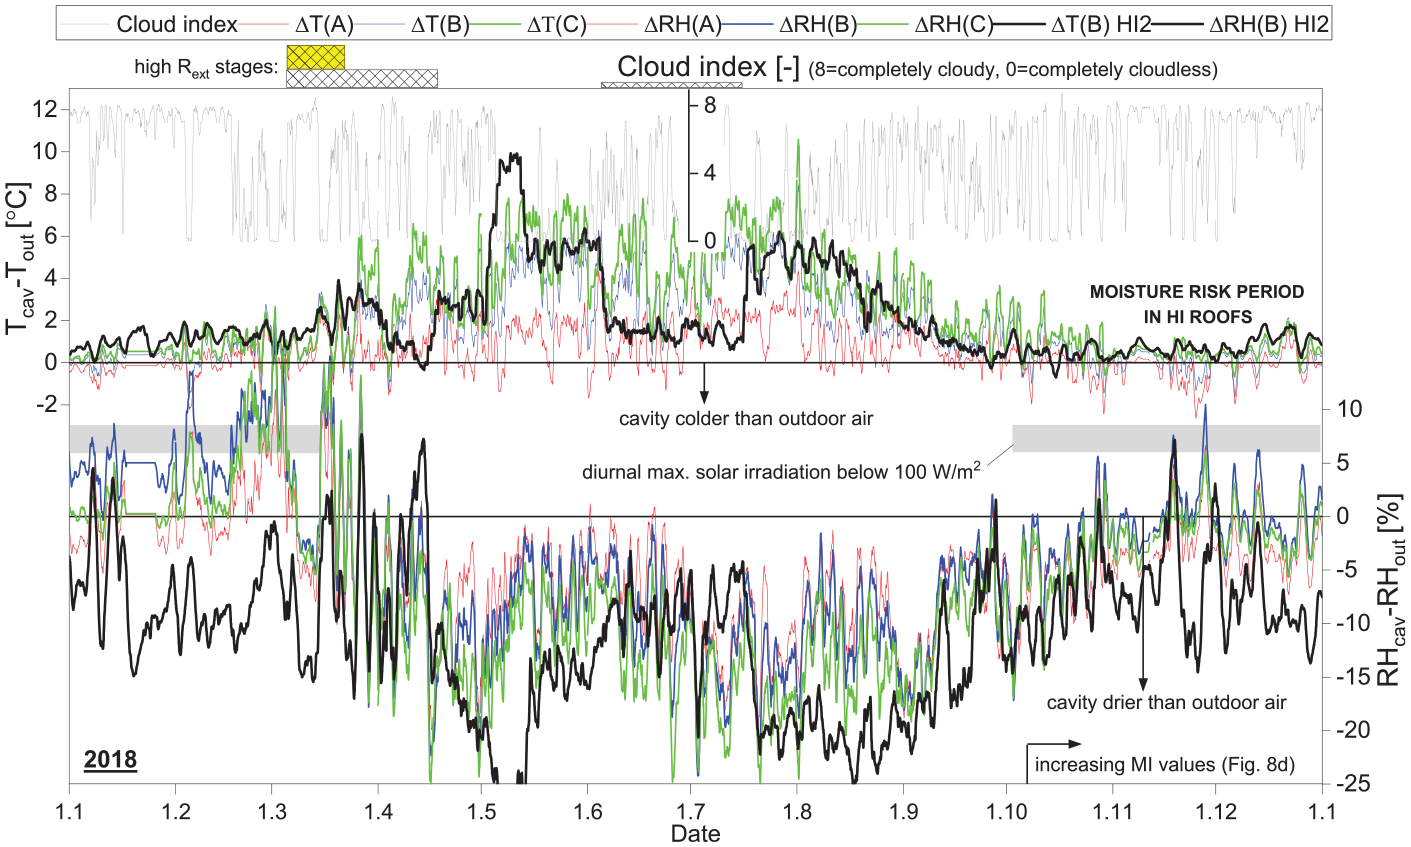
The measured temperature and RH differences (1-day averages) in RF2 roof and HI2 wall cavities compared with outdoor air. Cloud index values (12-h averages) by the Finnish Meteorological Institute (2020c).
The cloud cover in Finland was evaluated in Northern (Pudasjärvi) and Southern (Helsinki) Finland during the period of 2009–2019. The cloud cover is typically lowest in summer and higher in the cold season (Finnish Meteorological Institute, 2020c). In September–December, at 22:00–6:00, the sky is cloudless 20% of the time and completely cloudy 74% of the time. In the cold season, the most cloudless weather occurs in September–October, when cloudless and cloudy weather alternate between nights. These weather statistics suggest that the adverse thermal effect of nighttime radiation is intermittent; thus, the associated hygric risks are lower. However, in HI roofs, where the cavity temperature during the cold season is near the outdoor level and the humidity in the cavity may increase over the outdoor level, especially, after completion of the building, nighttime cooling of the cavity can aggravate the cavity conditions further.
Comparison of measurements and the analytical model
The described analytical model for the cavity temperature and humidity was compared with the measurements in the HI1 wall cavity to evaluate the ability of the model to describe the hygrothermal conditions in a ventilation cavity. Temperature and RH at point HI1(B) were solved during the 18-day period at the beginning of the wall study using the measured indoor and outdoor temperatures and RHs as boundary conditions. The measured velocity in the cavity was also used as model input, in addition to velocity values within the accuracy of the used anemometer. The calculated temperature by night differed by at most 0.25°C from the measurements when there was no solar radiation (Figure 10(a)), which is acceptable since the accuracy of the probe is 0.3°C–0.4°C. At the same time, the RH results obtained using the measured cavity velocity were 4%–7% above the measured RHs. With cavity velocities of 0.1 m/s below the measured values, which is the accuracy of the anemometer, the calculated RHs varied by at most 4% RH around the measured values (Figure 10(a)). Considering the accuracy of the RH probes, ±2% below 90% RH, and the accumulated error to the calculated RHs from the temperature-related error, the model could describe the level of humidity in the cavity with acceptable accuracy when there was no solar radiation. The variation of RH around the measured value may have occurred because the model ignores the hygric and thermal buffering effects of the materials adjacent to the cavity.
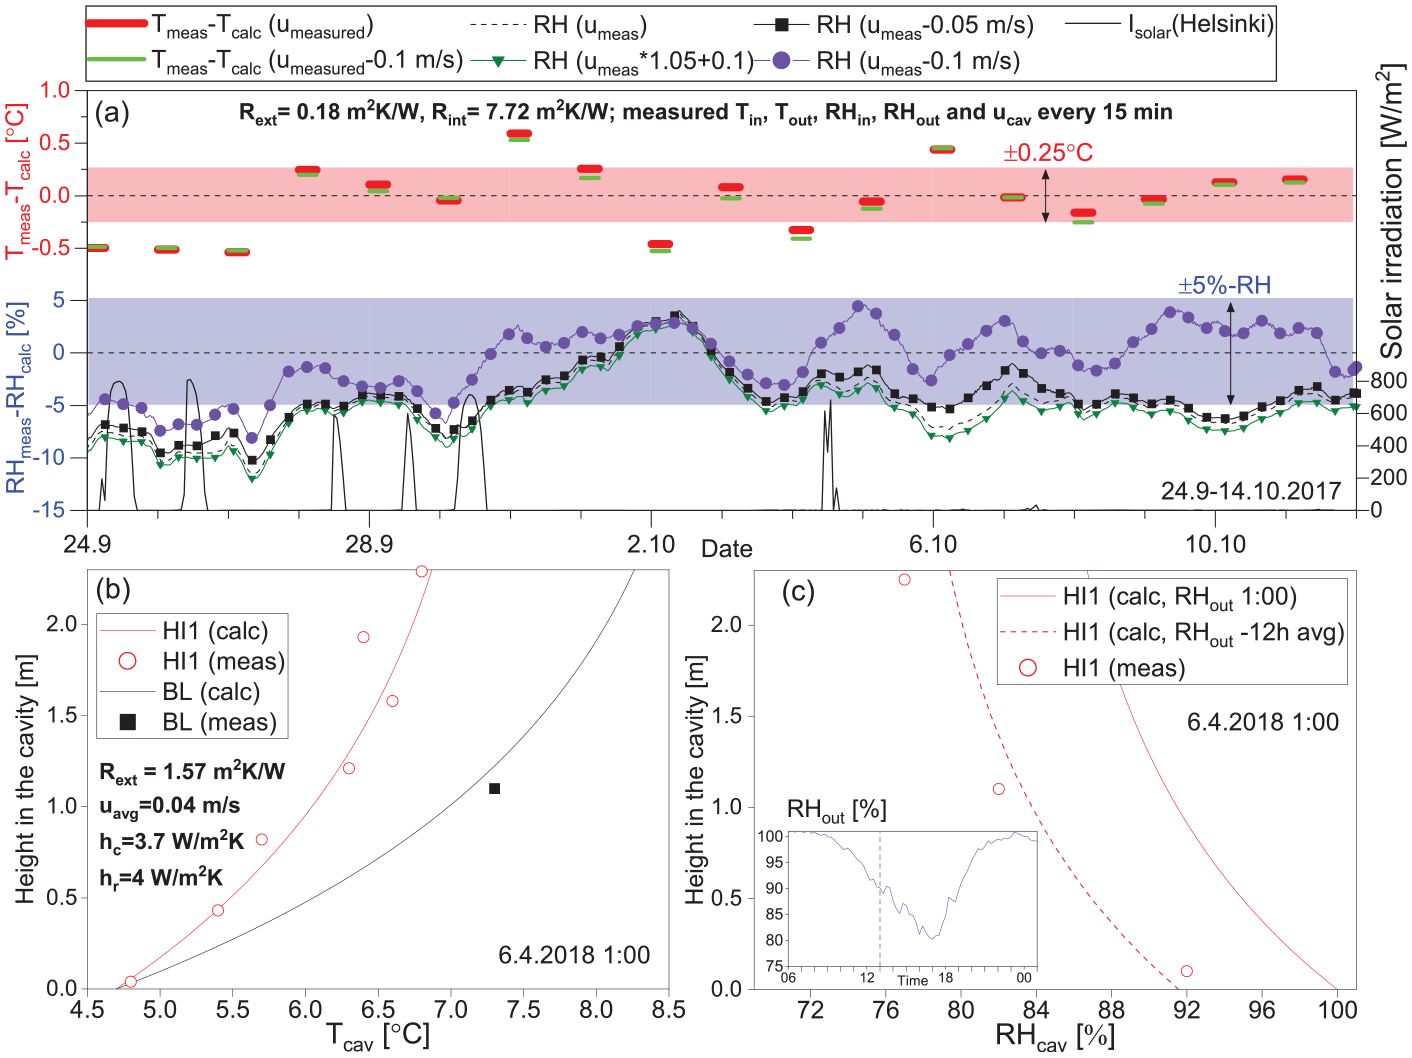
(a) The comparison of the measured and calculated temperature and RH at point HI1(B) at the beginning of the experimental study period. The measured cavity velocity was varied according to the accuracy of the anemometer. Measurements and calculations were performed in 15-min intervals. Solar radiation from the Finnish Meteorological Institute (2020a). Temperature difference is an average from times between 0:00 and 6:00 h, whereas RH results represents continuous data; measured and calculated momentary vertical, (b) temperature, and (c) RH distributions in the ventilation cavities during the tests with an increased R value outside the cavity, (c) inset depicts the outdoor RH a day before the calculation.
The calculated and measured vertical temperature distributions in the cavity of the HI1 wall were alike in times with no solar radiation onto the façade (Figure 10(b)). In addition, temperature at point BL(B) agreed with the model. The hc between the cavity surfaces of the walls and the cavity air was 3.7 W/m2K, which was calculated by equation (A.10). A significantly lower hc with values of approximately 1 W/m2K produced less accurate temperature distribution in the wall cavity. Such a heat transfer coefficient would be acquired from the formulas describing natural convection over vertical parallel surfaces (see formula by Hens, 2007). Therefore, equation (A.10) was selected to be used in the analysis for both the walls and the roofs. The modeled RH distributions in the cavity were close to the measurements when the inlet RH in the calculation was taken as a 12-h average from the measurements before the evaluation moment (Figure 10(c)). This shows that the moisture buffering of the cavity materials decreased the cavity RH after a distinct increase in the outdoor RH. The addition of nighttime radiation to the model was tested by utilizing the concept of equivalent outdoor temperature (see e.g. Nevander and Elmarsson, 2008). The difference between the measured and modeled cavity temperatures was too high; thus, this model was not used. The evaluation of the effect of nightime radiation therefore requires the use of numerical models.
Performance analysis and the options to improve the conditions in the cavities of HI assemblies
General remarks
The hygrothermal conditions in the wall and roof cavities were evaluated in the corresponding locations to the measurement points A–C (Figures 1 and 2). ΔT and ΔRH isolines were plotted in two dimensional (2D) graphs, where the x- and y-axes represented the Rext value and ACH in the cavity, respectively (Figures 11 and 12). The ΔT curves in Figures 11(a) and (b), 12(a) and (b) represent the temperature excess in the cavities compared with outdoor air. In walls, points A and C represent the average temperature excess values at a distance of 0–0.3 m from the cavity top and bottom. In roofs, the corresponding areas are at a distance of 0.6–1 m from the cavity ends. The results for the middle area of the cavities at point B represent average values at distances of 0.4–2.1 m and 2–3.5 m from the inlets of the walls and the roofs, respectively. The ΔRH curves in Figures 11(c) to (h) and 12(c) to (f) were calculated as the difference between the solved cavity RH and the critical RH according to equation (3). The ΔRH curves represent a 0% difference, so that mold growth is not possible in the area to the right of the curves. The results apply to materials in sensitivity classes 1 and 2, but the difference compared to materials with sensitivity classes 3 and 4 is small because the critical RH was slightly below 85% only in few cases in the BL wall and BL roof.
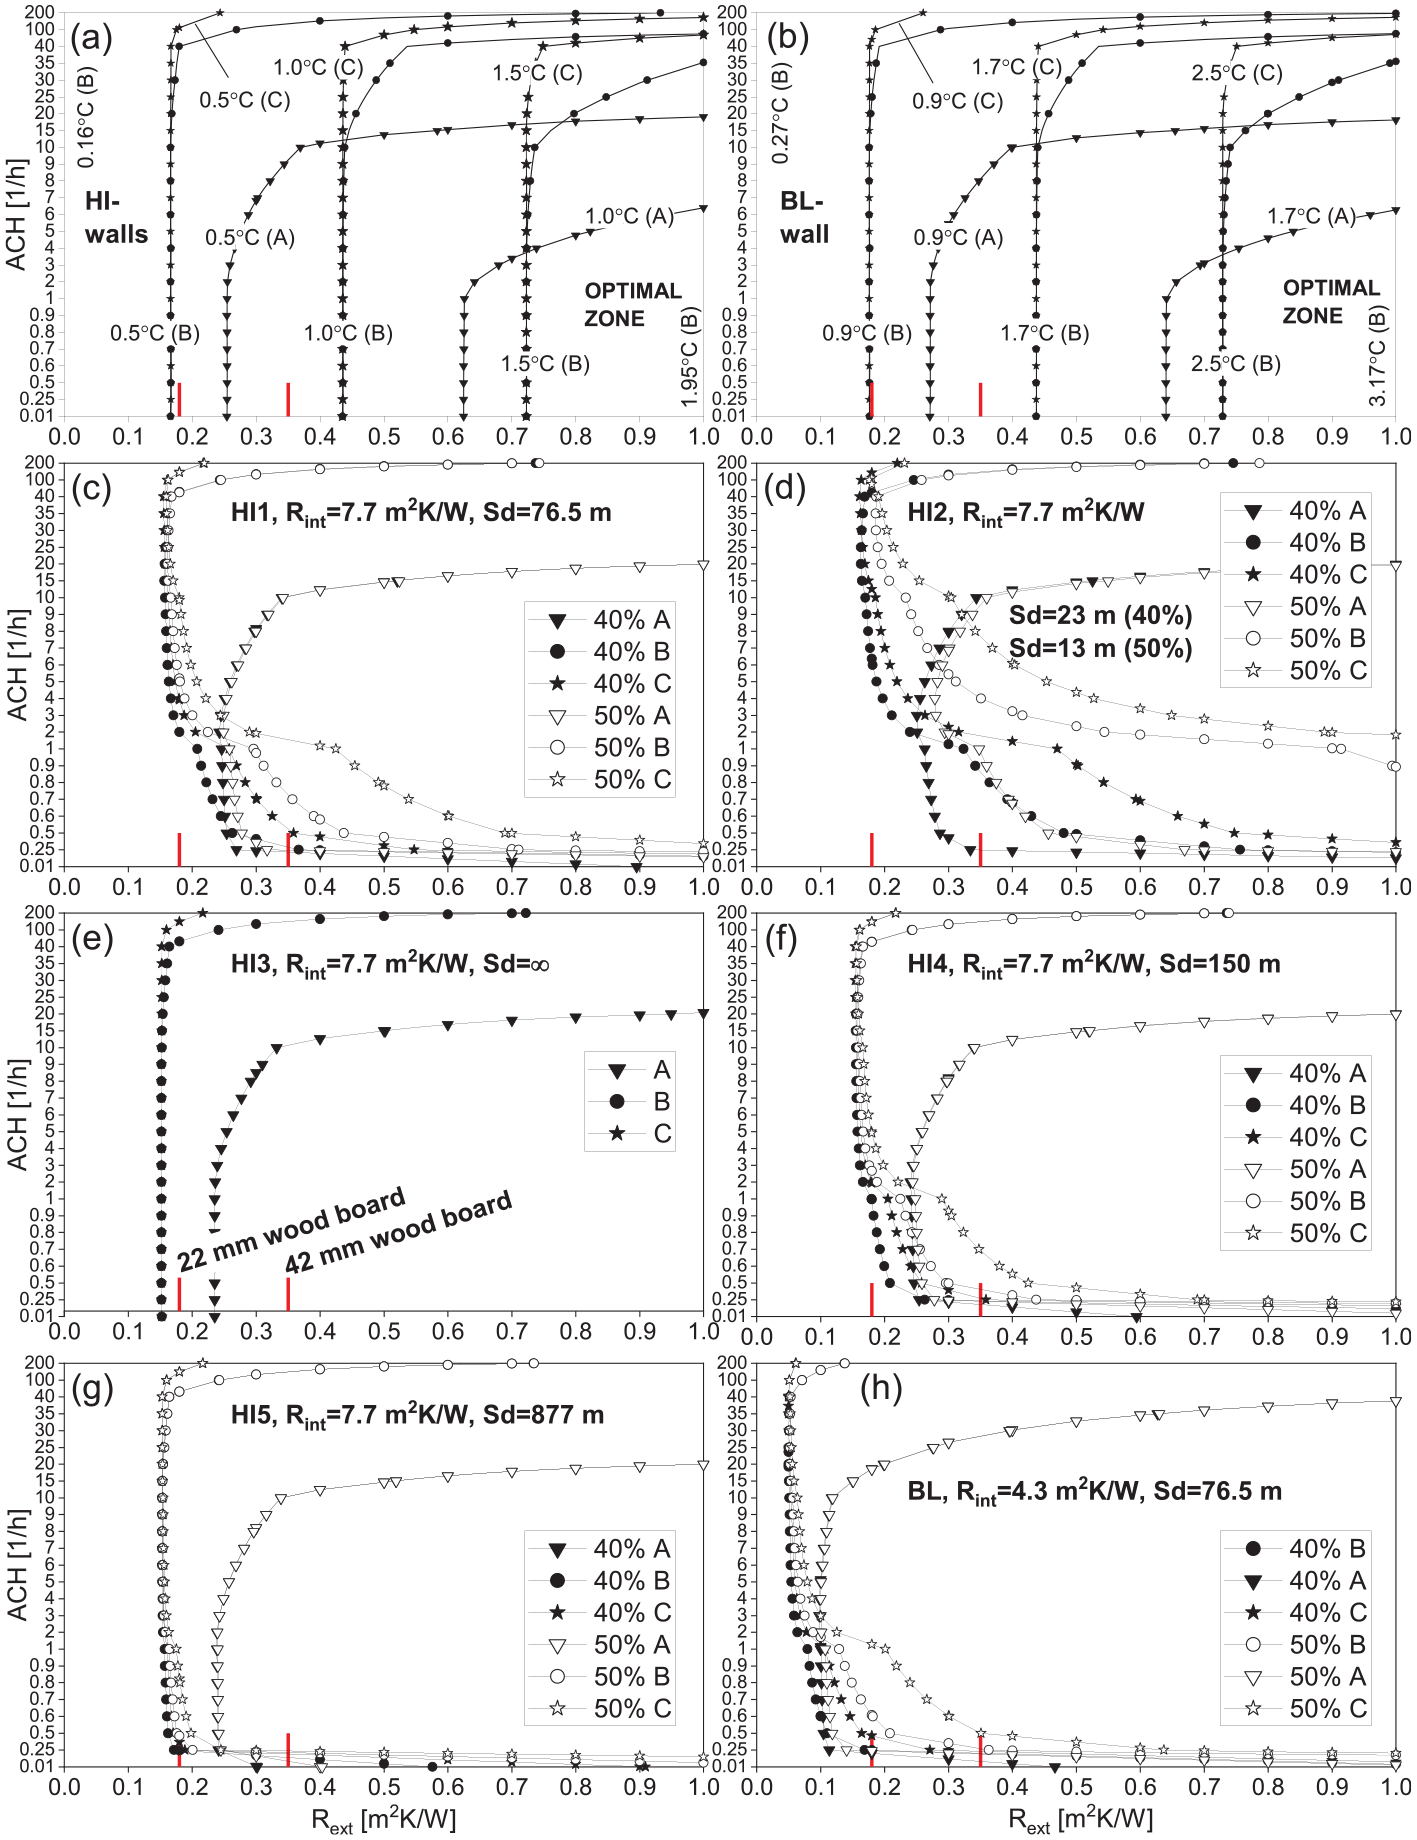
The results from the computational analysis of the walls: (a) and (b) wall cavity temperature excess compared with outdoor, and (c)–(h) isolines in which cavity RH equals the lower limit for mold growth. Mold growth is not possible in the regions on the right side of the curves; outdoor RH is 90% and outdoor temperature is 5°C in all cases.
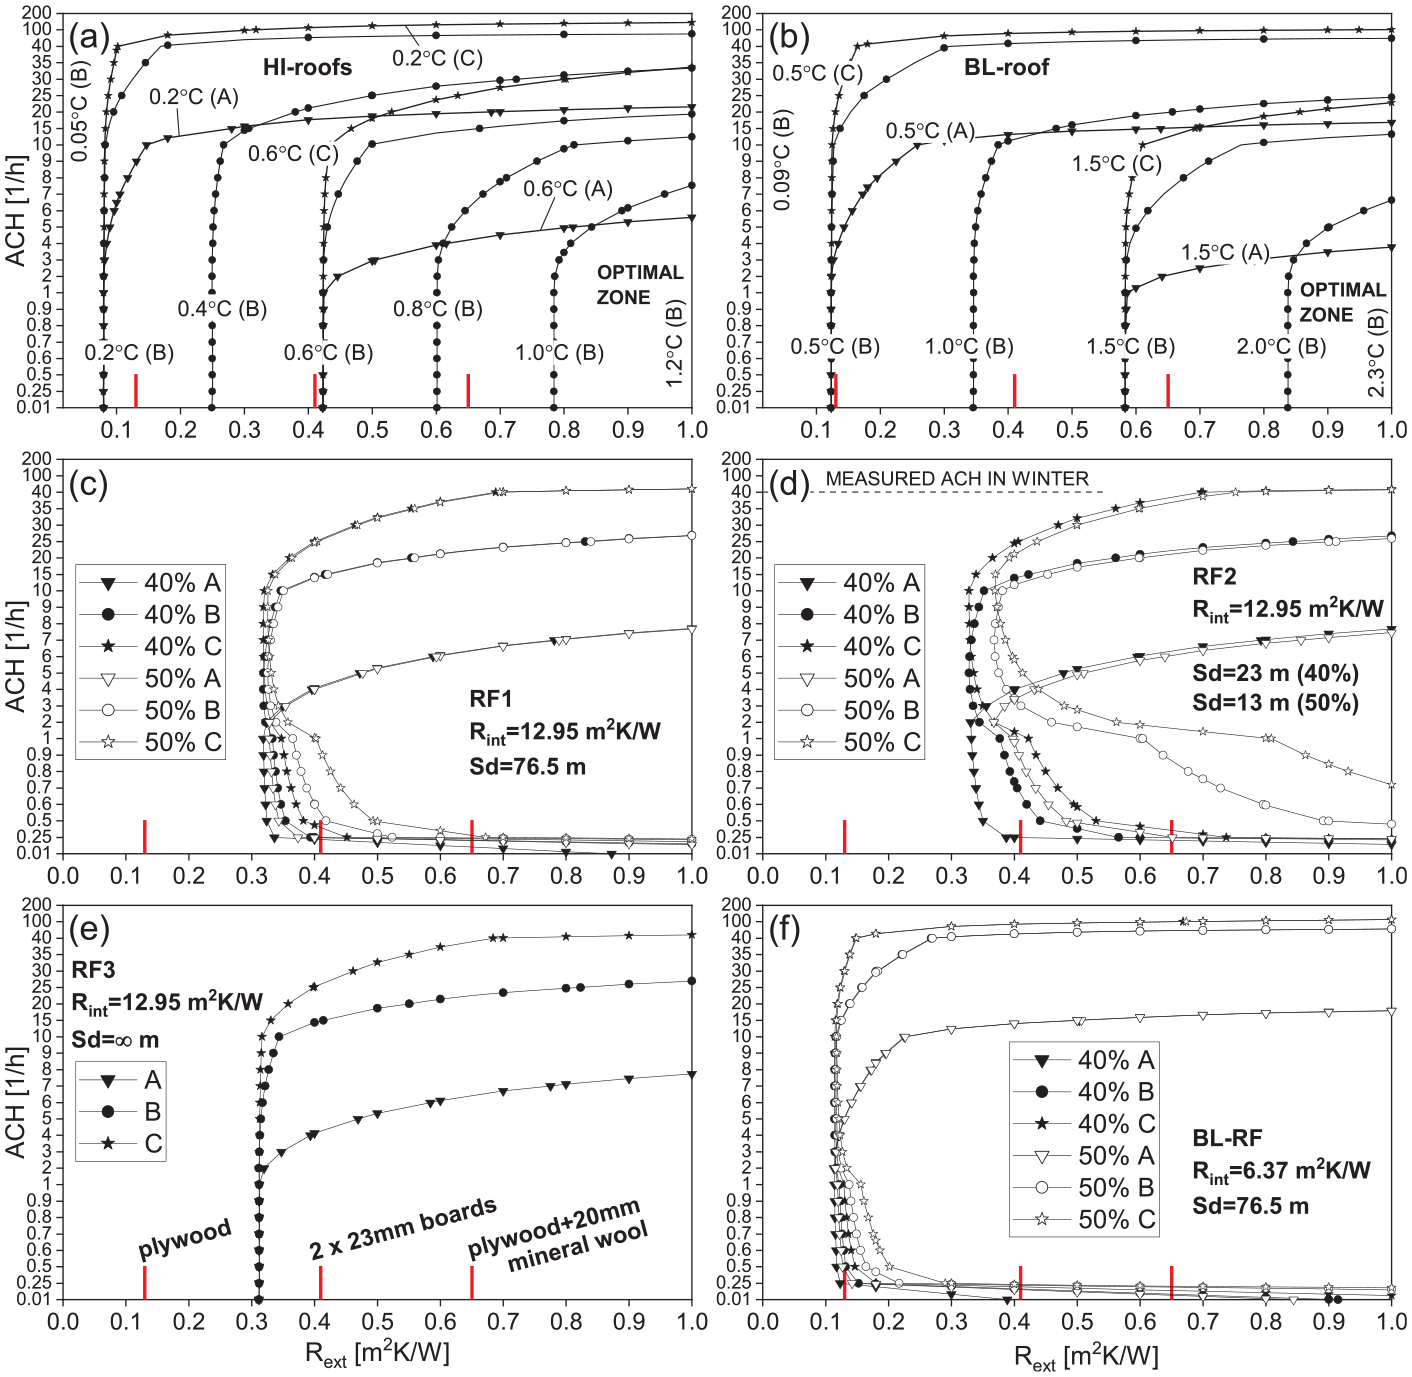
The results from the computational analysis of the roofs: (a) and (b) roof cavity temperature excesses compared with outdoor air. Vertical numbers indicate the extreme values at point B, and (c)–(f) isolines in which cavity RH equals the lower limit for mold growth. Mold growth is not possible in the regions on the right side of the curves; outdoor RH is 90% and temperature 5°C in all cases.
The maximum Reynolds (Re) numbers were 526 and 1935 in the walls and the roofs, respectively, which implied that the flow was laminar as assumed. However, the Re number was 3870 in the roofs with ACH rates of 200 1/h. This was considered acceptable, as the most important changes in the roof results already occurred with ACH 100 1/h.
Temperature conditions in walls
The calculated temperature excesses in the wall cavities (Figure 11(a) and (b)) were aligned with the measurements (Figures 5(a) and 6). The calculated cavity temperatures were 0.4°C–1.2°C higher in the BL wall compared with the HI walls, whereas in the measurements, the BL cavity was approximately 1°C warmer compared with the HI cavities in the cold season. The calculated cavity temperatures were at most 2°C–3°C over the outdoor temperature, with a 0.01 1/h ACH rate and 1.0 m2K/W Rext value, whereas in the experiment, the cavity temperatures were 2°C–4.5°C over the outdoor level, with an Rext value of 1.57 m2K/W and a closed inlet gap. In the HI and BL walls, cavity ACH rates over 10 1/h begin to decrease the average cavity temperature; especially, with the higher temperature excesses and ACH rates over 40 1/h, it decreased strongly. The temperatures at the bottom of the cavity already decreased with the ACH rates over 2; thus, the thermal performance of the wall cavities was weakest at the bottom part of the cavity. Therefore, if not necessary in terms of the drying-out ability of the walls, unnecessarily large ACH rates should be avoided by restricting the ventilation rate, which aids to keep the cavity warmer. With higher R values of the cladding, the cavity temperatures increased and the temperature difference grew between the HI and BL walls.
Adequate hygric performance of wall cavities
An unventilated cavity results in moisture risks without a complete vapor barrier (Figure 11(c)–(h)), which is in accordance with the results by Kehl et al. (2011). The comparison of the HI1 and BL walls reveals that the interior R value is the major factor that determines the prerequisites for safe cavity conditions (Figure 11(c)–(h)). In the BL wall, Rext values of 0.06–0.1 m2K/W and ACH rates of 4–100 1/h ensured adequate cavity conditions. In the HI1 wall, this required Rext values of 0.18–0.24 m2K/W and ACH rates of 4–40 1/h. This is consistent with the measured average ACH of 40 1/h and the acceptable hygrothermal conditions at points B and C in the cavity of the HI1 wall in winter. In the inlet areas, however, higher Rext and lower ACH values were required compared with points B and C to ensure safe cavity conditions. An exterior R value of 0.35 m2K/W and ACH rate of 10 1/h provide such conditions in all of the studied walls. The observed mold growth in the cavity battens near point A in the HI1 and BL walls coincided with the calculation; even in the case of the BL wall the maximum ACH of 15 1/h, which by calculation supported safe cavity conditions at points A–C, was not realized in the experiment, because the ventilation rate was likely above this level enabling mold formation at point A. Therefore, the restriction of cavity ventilation is the principal method to improve the cavity conditions especially in the inlet area in HI and BL walls. This approach generally requires restricting vapor diffusion from indoor toward the cavity; thus, it may not be applicable to walls with air barrier papers, which can have an Sd value below 1 m. Other moisture sources like construction moisture, indoor air exfiltration and rainwater leakages, which were not addressed by the model, should be prevented in cavities with constricted ACH rates. The lowest viable Rext value among the HI walls was 0.16 m2K/W in the HI3 wall, which supports the importance of minimizing the moisture loads from the indoor air toward the cavity in HI structures. Practically the same Rext value was required with the aluminum laminate vapor barrier in the HI5 wall, but 0.2-mm and 0.4-mm-thick PE foils, together with the PA foil performed worse, especially with lower ACH values. The effect of the indoor RH level on the cavity conditions was low in the HI5 wall. In the HI2 wall, the optimal ACH value was 7–40 1/h at points B and C, where the lower limit is higher than those in the other walls. With the higher indoor humidity, the optimal ACH was in a narrower region of 20–40 1/h, and the exterior R value was at least 0.25 m2K/W. Ensuring safe conditions also at point A required a higher exterior R value of 0.35 m2K/W, but the very limited range of ACH between 8 and 10 1/h suggests to restrict the use of moisture-adaptive foils to buildings with moderate indoor RH.
Low temperature excesses typical to roofs
The temperature excesses in the roof cavities are presented in Figure 12(a) and (b). Cavity temperatures were at most 1.1°C higher in the BL roof compared with the HI roofs. Cavity temperatures were 0.25°C and 0.5°C above the outdoor level in the HI and BL roofs, respectively, with normal Rext values and ACH values of at most 3 1/h. The low temperature excess in the HI roofs corresponds well with the measured values (Figure 8(d)), and is influenced by the low U values of such roofs; thus, only a small temperature excess in the cavity is inevitable, and it decreases to zero with typical ventilation rates of roofs. With an Rext value of 2.11 m2K/W, the roof cavity temperatures rose 2°C above the outdoor level in the test phase with low ventilation, whereas the model gave at most 1.2°C temperature excesses with an Rext value of 1.0 m2K/W and near zero ventilation. ACH rates in the order of 10 1/h and above result in lower temperature excesses in the HI and BL roofs, and ACHs above 40 1/h decrease the temperature excess to near zero, regardless of the Rext value. The effect of the ventilation rate on the cavity temperature excess was dominant in the inlet area with ACH rates of 2–3 1/h and over, which is consistent with the lowest temperature at point RF2(A) in winter.
Moisture challenges in HI roofs
The 0% ΔRH curve required an Rext value of 0.31–0.32 m2K/W (Figure 12(c) and (e)) in RF1 and RF3 roofs, which was much higher than the conventional Rext value in roofs of 0.13 m2K/W (Table 1). The vapor retarder in RF2 roof increased the required Rext value to 0.33–0.38 m2K/W depending on the indoor RH; thus, with Sd values 13 m and over, the difference in the performance of the cavity compared to the roofs with vapor barriers is relatively small. Challenges may arise with vapor retarders if the indoor RH is elevated and the cavity ventilation is low. Therefore, construction moisture may cause moisture risks. The discrepancy between the typical and required Rext values explains why the measured mold risk was higher in the roof than it was in the walls. Supporting this conclusion, the roof measurements showed, that the hygroscopicity of cavity materials, the effect of which was omitted in the calculation, does not prevent the development of mold risk in the cavity. Another issue is that in the HI roofs, low cavity RHs occurred within ACH rates between 2 and 10 1/h, which is a more restricted range compared with the HI walls. The lower boundary is based on the humidity transferred by diffusion from indoors. With typical ventilation approaches, the ACH levels in roofs are usually above 10 1/h. These challenges were not met with the BL roofs, where moisture-safe cavity conditions were achievable even in the inlet area with ACH values between 0.25 and 4 1/h and normal Rext values (0.12 m2K/W). The minimum value coincides with the value of 0.2 1/h that compensates the effect of a vapor tight roofing (TenWolde and Carll, 1992). Excluding the inlet area, the ACH rates could rise to as high as 10–15 1/h in BL roofs. The results emphasize the deterioration of the hygrothermal performance of the cavity in the HI roofs (0.08 W/m2K) compared to the roofs of previous U value levels (0.15 W/m2K).
Methods to improve the performance of roof cavities
The above results suggest, that it may be necessary to restrict the ventilation of HI roofs to elevate the cavity temperature. This can be achieved by dimensioning the inlet and outlet gaps at the eaves and ridge. The positive outcome of such measures, according to the literature, includes lower wind washing of insulation, less convective humidity from outdoor, and the prevention of snow penetration into the roof. Nevertheless, the restriction of the cavity ventilation should be carefully considered, because it requires very low moisture transfer to the cavity, and thus, for example, the sensitivity of the structure to rain leakages increases. The drying stage of construction moisture may also weaken the cavity performance of the HI roofs (Harderup and Arfvidsson, 2013; Viljanen et al., 2020); therefore, the restriction of the ventilation should be implemented only after the initial drying period. The use of a roof underlay, which in the test roof was partially represented by the coated wind barrier wool, equally prevents wind washing of the thermal insulation. A self-supporting underlay may prevent condensation under the roofing, but the solution is not recommended in Finland with continuous roofings (Finnish Association of Civil Engineers, 2012), such as the studied roofing. The reasoning behind this is that such solution constitutes two cavities where the diffusion of indoor humidity directs to the lower cavity while the upper cavity is subjected to a higher amount of temperature changes and ventilation.
In any case, the moisture transferred by the diffusion and convection from indoor air toward the cavity should be minimized in roofs. Moisture-adaptive vapor retarders work relatively well in ventilated roofs, but very low ventilation rates combined with high indoor RH limit their use. Thus, they may not be the best option in low-sloped roofs, where low ACH rates occur during windless weather or in roofs, where the ventilation is intentionally restricted. In these cases, vapor barriers are a preferable option. The advantages of moisture-adaptive vapor retarders, in turn, are highlighted in non-ventilated compact roofs with enhanced drying ability inwards (e.g. Künzel, 1999).
Additional measures include the increase of the R value of the structure above the cavity, which has been confirmed also earlier as a promising approach (Harderup and Arfvidsson, 2008; Nik et al., 2012). With only 20 mm of additional insulation under the roofing (Rext, 0.65 m2K/W), mold risk was preventable in the HI roofs equipped with vapor barriers and with ACH values of at most 6 1/h. Practical implementation of additional MW insulation is feasible under a bitumen roofing and over a plywood or tongue-and-groove boards, a solution which largely corresponds to MW insulated low-sloped compacts roofs, where the roofing is also directly above the MW and ventilation is implemented with ventilation grooves and underpressure vents resulting in ventilation rates of 5–50 1/h (evaluated after Technical Research Centre of Finland, 1999). The deformations of the roofing membrane are lower in the roof with a ventilation cavity compared to a compact roof, because the rigid base structure under the additional insulation allows less movement compared to the 200–300 mm thick MW layer.
Snow melting in roofs with increased exterior R values
The calculated temperature isoline curves, which correspond to a 0°C temperature under the snow, consistently approach the 0°C outdoor temperature with increasing ACH values (Figure 13). The risk of snow melting is highest with outdoor temperatures in the range of −2°C to 0°C, which occurs 17%–25% of the time during which the outdoor temperature is below zero in Finland (Figure 13(e)) (Finnish Meteorological Institute, 2020d). Snow melting may however occur with outdoor temperatures as low as −6.5°C and −13°C in the HI and BL roofs, respectively, which is in line with the previously proposed temperature range of −9°C to 0°C that allows snow melting (Baker, 1967). The results imply that the probability of snow melting is roughly double in the BL roofs compared to the HI roofs (percentage values in Figure 13). The increased exterior R values move the isolines slightly to the right decreasing the probability of snow melting; thus, exterior R values can be increased without apprehension of accelerating snow melting. Figure 13 also shows, that snow melting occurs least near the inlet and most at the upper eaves, which is consistent with the results by Blom (2001). In addition, higher thickness of the snow, 0.3 m or more, increases the probability of snow melting, the risk of which can be mitigated by increasing the ACH rate to the level of 40–100 1/h. In winter, the ventilation of the test roof was at this level, and no snow melting was observed, which together support the analysis results. Therefore, the cavity ventilation rate in roofs with increased exterior R values should not be restricted to 1–10 changes in an hour, but rather closer to the value of 20 1/h, which still promotes adequate hygrothermal conditions in the roof cavity excluding the inlet area (Figure 12). In the absence of moisture sensitive materials in the cavity, a much higher ACH rate of at least 40 1/h is recommendable to further reduce the risk of snow melting.
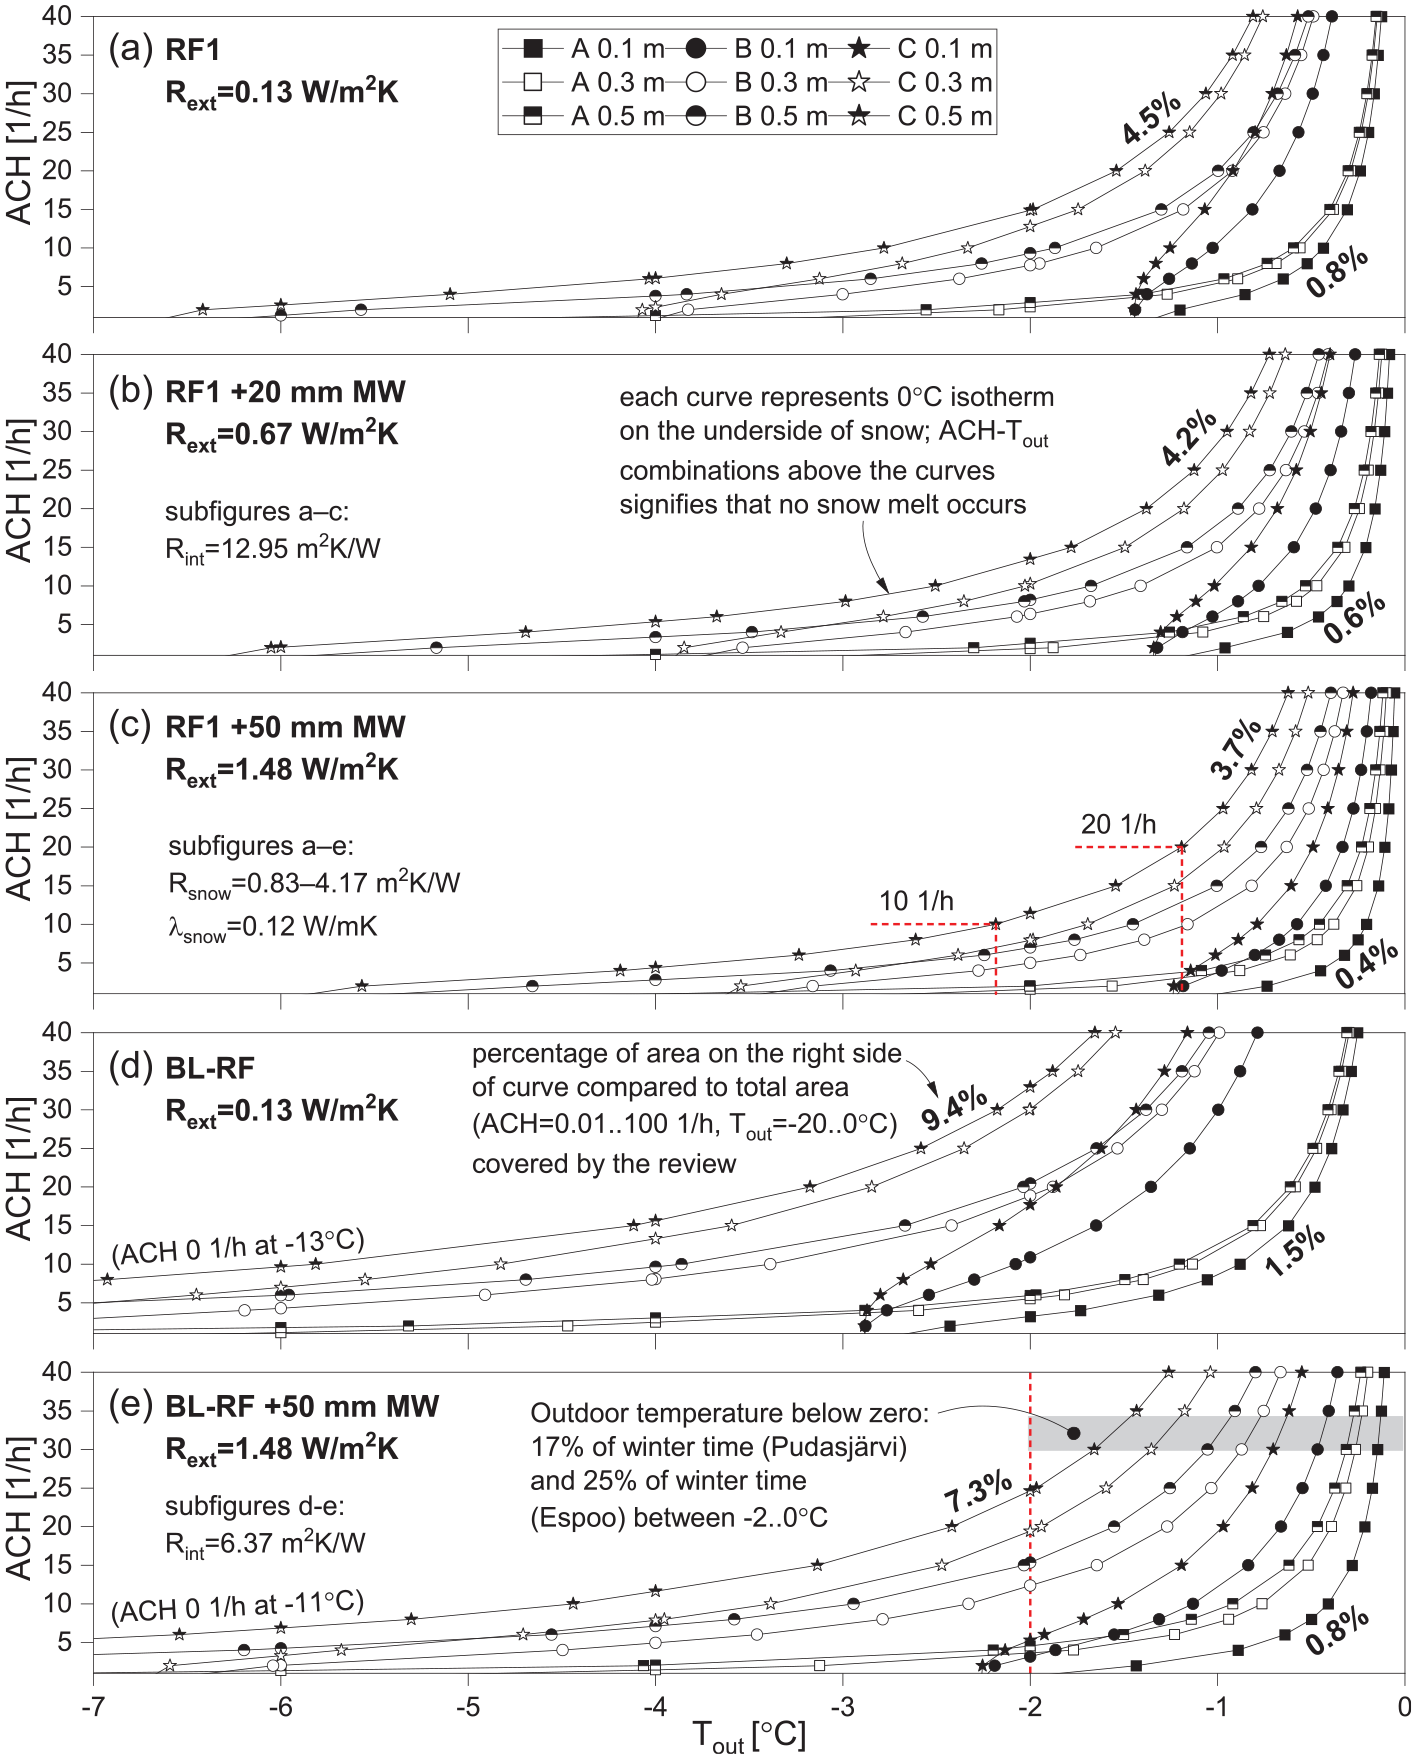
The snow melting risks for the RF1 roofs in items (a)-(c) and for the BL-RF roofsin items (d) and (e) calculated at points A–C with different Rext values and snow thicknesses(0.1 m, 0.3 m, and 0.5 m). The isolines represent 0°C temperature between the roofing and the snow; thus, snow melting is possible with ACH–Tout combinations on the right side of the isolines, and the probability of snow melting is proportional to the area on the right side of the curves.
The effect of increased volume force on the cavity air change rate
Loss factors
The measured loss factors were usually between 1 and 6, but they increased strongly with cavity velocities below 0.07–0.13 m/s (Figure 14(a)). Such low velocities were difficult to measure except for the vented metal battens, where pressure losses were higher. Similar challenges has been reported by Falk and Sandin (2013a). The velocity range corresponding to buoyancy-induced cavity airflow is often below 0.1 m/s (Figure 14(b) and (c)). Therefore, the determined ACH values utilized extrapolated loss factor values, where values for vented metal battens were extrapolated with third- to sixth-degree polynomial fittings, and the values for the 2-mm mesh gap were extrapolated with linear fitting from the two lowest velocity measurement values. A single batten was used in a cavity to approximate the flow constrictions in inlet and outlet that incorporate perforated metal sheets. In addition to the measured values for metal battens and 2-mm insect mesh, loss factors for the inlet and outlet of 0.5 and 1.0 (see Hens, 2007), respectively, were used to account for wall cavities, where separate meshes or corresponding airflow obstacles were not used. These cases are illustrated in Figure 14(b) with only the cavity thickness value.
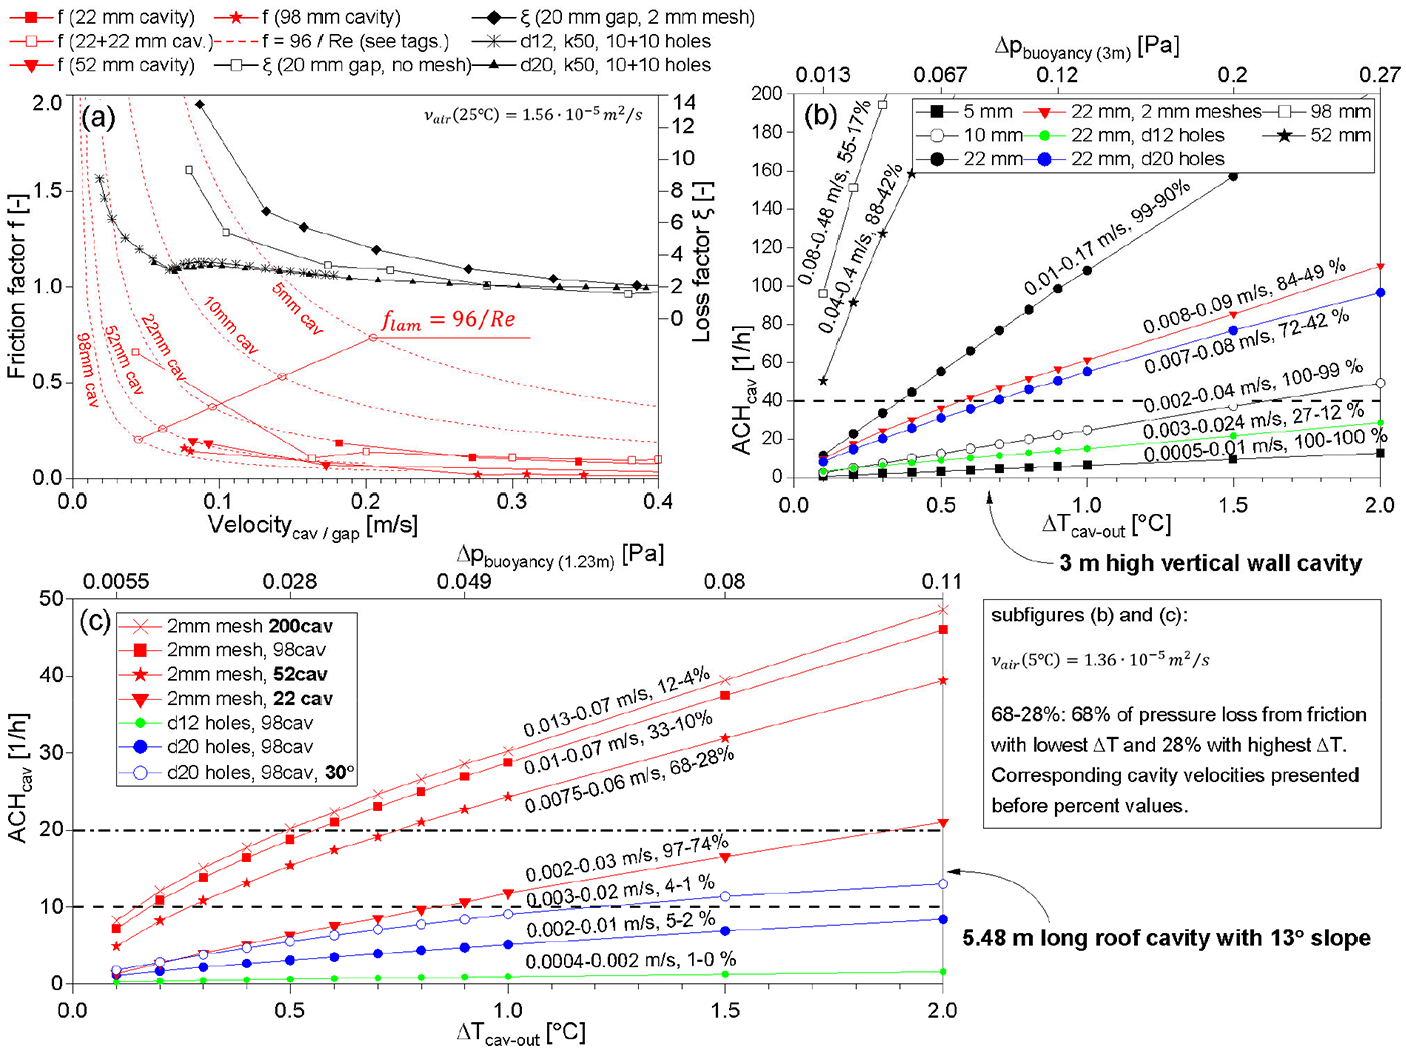
The results from the pressure loss experiments and the cavity ACH computations: (a) measured friction factors in cavities of different thicknesses and loss factors in different gaps and other airflow obstacles, (b) and (c) calculated ACH rates depending on the temperature excess of the cavity and the cavity structure. The corresponding pressure difference exerted by the stack effect is presented in the upper x-axis, which do not apply to case with 30° roof slope. Maximum recommended ACH rates, based on Figures 11 and 12, that prevent excessive cooling of the cavities are presented with horizontal dashed lines. In roofs, the prevention of snow melting increases the recommended ACH rate to 20 1/h.
Wall cavities
The calculated cavity ACH rates varied significantly between the cavity setups (Figure 14(b) and (c)). With temperature excesses of 0.5°C–1°C in the HI wall cavities, which ensure moisture-safe conditions (Figure 11(a) and (c)), the 5-mm and 10-mm-thick cavities and the cavity with d12 (diameter 12 mm) holes in the inlet and outlet had ACH values of 3–25 1/h. Other cavity setups had ACH values above 30 1/h in this temperature excess range. However, the 22-mm-thick cavity with 2-mm meshes or d20 holes had ACH rates below 40 1/h when the temperature excess was just 0.5°C. Therefore, the typical wall configuration, a 22-mm cavity with insect meshes in the inlet and outlet, has enough flow constriction to create moisture-safe conditions in the cavity. The cross-strapping with two 22 mm wood boards does not significantly increase the pressure loss in the wall cavity compared to the 22 mm vertical strapping. The friction coefficient of the cross-strapping depending on the Re number was equivalent to the one presented by Gullbrekken et al. (2018). Gullbrekken et al. (2018) used counter batten heights 23–72 mm for roof cavities, whereas the current results obtained with equation (A.17) imply a significant increase in the friction loss with cavity heights 5–10 mm. With perforated plates, the local pressure loss depends highly on the hole size; holes up to 12 mm in diameter generate significant resistance to the airflow, which can be utilized to restrict the ACH rates of the cavities. Higher hole sizes induce higher pressure losses only with a short batten spacing, like 400–600 mm, which is common in exterior walls with metal battens. The results suggest that insect meshes are not particularly effective as an airflow obstacle.
Roof cavities
In the 98-mm roof cavities, the ACH rate stayed below 10 1/h with d12 and d20 holes and with temperature excesses at most 1°C. With d20 holes, the increase of the roof slope from 13° to 30° rose the ACH from 5 1/h to 9 1/h; thus, the ACH rate was still determined by the pressure drop in the eaves. With a 2-mm mesh in the 22-mm cavity and a temperature excess of 1°C, the ACH was slightly over 10 1/h. The ACH can be lowered significantly from the values obtained with 20 mm high gaps by using a lower opening height such as 10 mm, which increases the local loss (Susanti et al., 2008, 2010). In 52-mm, 98-mm, and 200-mm cavities with 2-mm mesh, ACH values were distinctly higher, around 20 1/h with temperature excess of 0.5°C–0.8°C, which helps to reduce snow melting. The high ACH level explains why the measured temperature of the RF2 roof cavity increased only after the closing of the inlet. The effect of cavity thickness on the pressure losses is low, which somewhat contradicts the Finnish national guideline (Finnish Association of Civil Engineers, 2012), where the recommended depths of the ventilation cavity are 100 or 200 mm in steep roofs and 200 or 300 mm in low-sloped roofs, depending on the specific roof slope. The current results suggest that the pressure losses with 52–200 mm cavity depths vary little, which is consistent with the previous observations that a cavity thickness of 48 mm works well in insulated pitched roofs of single-family houses, but cavity heights below 23 mm raise icing issues (Blom, 2001). Considering the high initial thickness of the HI roofs, unnecessarily thick ventilation cavities can be avoided; thus, a 50 mm high roof cavity is a viable option. In the Finnish guideline, the directive open area of the gaps at the eaves of steep roofs is 2‰–2.5‰ from the roof area. The results show that the airflow obstacle type has a high effect on the pressure loss and not just the open area at the gaps.
Discussion and conclusions
The measurements pointed out that in southeast facing HI walls with U values of 0.12–0.13 W/m2K in Finnish weather conditions during the cold season the cavity temperature is lower and RH higher compared to the structure with a higher U value. However, significant mold growth in the cavity is possible only near the inlet area, where the temperature is the lowest and RH the highest. The mold risk is highest during humid weather from September to January, when the solar irradiance is low and if the outdoor temperature stays above zero. In the warm season, mold growth may be inhibited by fluctuating cavity conditions in roofs and in facades that are exposed to solar irradiation. As in the north facing walls and steep north facing roofs this fluctuation and the solar-driven drying are limited, their moisture sources should particularly be minimized. In HI roofs, the cavity is even colder and moisture risks higher than in HI walls because the U value of such roofs is typically as low as 0.08 W/m2K. In the middle of the roof cavity, a MI value of 2 was obtained, which also resulted from the built-in moisture, the diffusive humidity from indoor air, the humid outdoor weather, and the radiation heat loss to a cloudless sky at night. The effect of radiation heat loss to the sky is distinctly greater in roofs than in walls. Nighttime radiation may not be the deciding factor to the performance of external assemblies as such weather conditions occur intermittently, but it may impair the conditions further.
The analytical model identified the parameters that most affect the hygrothermal conditions in the cavity, which were found to be: the internal and external R values, the ACH of the cavity airspace, and the vapor tightness of the vapor control layer. In BL walls and roofs, typical external R values of 0.18 and 0.13 m2K/W, respectively, are enough to keep the cavity conditions at a safe level. In HI wall assemblies, a standard 22-mm wood cladding (R value 0.18 m2K/W) is usually sufficient if the moisture loads directed into the cavity are low. For example, vapor barriers with high Sd values should be favored, such as PE foils and multilayer laminates. However, higher R values outside the cavity and a moderate indoor RH support the use of more vapor-open foils, such as PA foils, as vapor barriers in walls. Moisture-adaptive foils have varying vapor tightness values between products, and therefore their suitability as a vapor control layer in ventilated external assemblies should be reviewed on a case-by-case basis. In the renovation of old buildings, the PA foil can be favored as it prevents the diffusion of microbial volatile compounds to indoor air more effectively than PE foils, but in new construction the water vapor transfer properties of these foils are the most important factors. In HI roofs, a typical external R value 0.13 m2K/W is less than the suitable range from 0.31 to 0.38 m2K/W determined by the model. This adequate level of external R value is decreased only little by using an effective vapor barrier. Therefore, an exterior R value higher than typically used for roofs may be a feasible method to improve the cavity conditions, which is a conclusion supported also by the literature. As the low probability of snow melting in HI roofs is mainly determined by the high R value inside the cavity, an increased exterior R value reduces the likelihood of snow melting only slightly. The ACH rate in roofs should be however kept at least at the level of 20 1/h to restrict the probability of snow melting. Such higher ventilation rates in the cavity are also beneficial in terms of the drying ability of the structures, but they result in cooler cavities; ACH values over 40 1/h and 10 1/h in walls and roofs, respectively, lower the cavity temperature excess in respect of outdoor air. The minimum ventilation rates needed to remove the moisture transferred by diffusion toward the cavity from indoor air with 40% RH are 4–7 1/h in HI walls and 2–3 1/h in HI roofs. Thus, the optimal ACH rates in the cavity are 4–40 1/h and 20 1/h, respectively.
The hydraulic network analysis showed that in wall cavities with thicknesses of at most 10 mm friction alone is high enough to maintain elevated temperatures by restricting cavity ventilation. As in external wall structures the cavity thickness is usually 20 mm or more, ventilation needs to be restricted to control the enhanced buoyancy-induced airflow when aiming to increase the cavity temperature. For example, perforated metal sheets and opening heights of 10 mm or lower work well, but in roofs, typical insect meshes, that restrict airflow less than perforated sheets, are more appropriate. Roof ventilation is significantly affected by roof slope; thus, restricting the flow more may be necessary with a steep roof pitch. The analysis ignored the effect of wind-induced cavity ventilation and hence, depending on the local wind conditions and the related pressure effect exerted on the ventilation openings, the actual ACH rates may be higher than the calculated ones. Nevertheless, restrictive measures in the cavity design affect also the wind-induced ventilation, which decreases the uncertainty in the current analysis considering the conventional, relatively exposed openings designed. As the aforementioned ranges of optimal ACH rates in the cavity neglect the impact of rainwater penetration through the façade, indoor air exfiltration, and the level of built-in moisture, the restriction of cavity ventilation, when implemented, should be designed considering the potentially high moisture loads that may arise from these sources.
Only individual studies that focus on the methods for improving the conditions in ventilation cavities and cold attics are available to date. The current results accentuate the need for experimental and numerical studies that concentrate on the possibilities to improve the conditions in the ventilation cavities of HI assemblies. Particularly, the performance of roofs and north facing walls should be studied more. Long-term experimental studies should incorporate slightly increased exterior R values and restricted cavity ventilation combined with elevated moisture loads. Based on this study, for example, a wooden cladding with a thickness of 42 mm and an additional MW insulation below the roofing with a thickness of 20 mm are possible means of improving the hygrothermal conditions in the cavities of HI assemblies. The thermal resistance outside the cavity should be optimized in terms of the solar-driven drying and fluctuating hygrothermal conditions in the cavity in the warm season. The possibilities to equalize the cavity conditions between facades facing different directions should be further studied. As these solutions should be implemented without changing the moisture-buffering capacity of the cavities substantially, for example, placing foam insulation directly next to the cavity is not recommended. The research topics presented above emphasize the demand to calibrate the available mold models to improve their accuracy at the conditions occurring in ventilation cavities.
Because of the complex behavior of ventilation cavities, changes to the conventional implementation of the ventilation and to the structural solutions of the exterior parts of external assemblies should be made carefully favoring small gradual changes to avoid undesirable ramifications. Considering this, the study supports the following measures in the design and construction of ventilated HI walls and roofs within Nordic or similar weather conditions:
The selection of mold-resistant materials to the cavity is advisable in HI assemblies. For example, it is recommended to use planed or fine sawn timber instead of rough sawn timber and to use moisture resistant gypsum boards.
The use of increased exterior R values generally improves the cavity conditions, but may require to constrict the ventilation openings. Exterior R values above 0.35–0.5 m2K/W and 0.7 m2K/W in walls and roofs, respectively, should be avoided to maintain the solar-driven drying and to prevent mold growth in the warm season. Dusky façades and roofs support these desirable phenomena.
The constriction of the ventilation openings alone is a feasible method to improve the cavity conditions in wooden facades, but in roofs, increased exterior R values with conventional openings work better.
The use of an effective vapor barrier in a ventilated assembly improves its performance especially during the drying of built-in moisture. During this period, indoor RH should be limited to below 50% with moisture-adaptive foils to prevent excessive vapor diffusion toward the cavity.
Footnotes
Appendix I
Appendix II
Appendix III
Declaration of conflicting interests
The author(s) declared no potential conflicts of interest with respect to the research, authorship, and/or publication of this article.
Funding
The author(s) disclosed receipt of the following financial support for the research, authorship and/or publication of this article: The research presented in this article was funded by the PhD-program of Ramboll Foundation/Ramboll Finland Oy and by the doctoral programme position in the Aalto University School of Engineering.