
Abstract
Hygrothermal models are important tools for assessing the risk of moisture-related decay mechanisms which can compromise structural integrity, loss of architectural features and material. There are several sources of uncertainty when modelling masonry, related to material properties, boundary conditions, quality of construction and two-dimensional interactions between mortar and unit. This paper examines the uncertainty at the mortar-unit interface with imperfections such as hairline cracks or imperfect contact conditions. These imperfections will alter the rate of liquid transport into and out of the wall and impede the liquid transport between mortar and masonry unit. This means that the effective liquid transport of the wall system will be different then if only properties of the bulk material were modelled. A detailed methodology for modelling this interface as a fracture is presented including definition of material properties for the fracture. The modelling methodology considers the combined effect of both the interface resistance across the mortar-unit interface and increase liquid transport in parallel to the interface, and is generalisable to various combinations of materials, geometries and fracture apertures. Two-dimensional DELPHIN models of a clay brick/cement-mortar masonry wall were created to simulate this interaction. The models were exposed to different boundary conditions to simulate wetting, drying and natural cyclic weather conditions. The results of these simulations were compared to a baseline model where the fracture model was not included. The presence of fractures increased the rate of absorption in the wetting phase and an increased rate of desorption in the drying phase. Under cyclic conditions, the result was higher peak moisture contents after rain events compared to baseline and lower moisture contents after long periods of drying. This demonstrated that detailed modelling of imperfections at the mortar-unit interface can have a definitive influence on results and conclusions from hygrothermal simulations.
Introduction
Hygrothermal models are important tools for assessing durability risks in building envelopes, such as biological growth (mould and wood rot fungi), corrosion and freeze-thaw action in masonry. These pathological conditions can compromise structural integrity, affect the health and wellness of occupants and lead to irreversible loss of architectural material and features; some which may have historical significance.
Hygrothermal modelling is known to have numerous weaknesses and gaps in our understanding. First, there are significant uncertainties relating to model inputs including material properties, boundary conditions, quality of construction and two-dimensional interactions between adjacent materials. Second, it is difficult calibrate predicted model performance to that which is measured in the field. Part of this relates to the previously mentioned uncertainties and to difficulties obtaining accurate in-situ moisture measurements. Third, two and three-dimensional interactions are poorly understood and are rarely modelled in practice. The presence of these gaps can reduce our confidence in the model’s ability to accurately capture the true extent of moisture issues in an assembly.
It is common procedure to make the following assumptions for hygrothermal modelling:
Materials are homogeneous. There are no localised variations in pore structure, physical properties or chemical composition.
Adjacent materials are in perfect contact with each other.
There are no imperfections in the materials or assembly.
For masonry walls, these assumptions are not always valid. This is most apparent at the interface between the mortar and the unit where there are imperfections such as cracks or imperfect contact conditions between adjacent materials. An example of this is shown in Figure 1. On this heritage sandstone building, a combination of stone displacement, shrinkage and repointing of varying composition and quality have led to physical separations between mortar and unit. This is evident in several ways from an open joint, hairline crack or an imperfect contact between the two. Intuitively, it is reasonable to assume this would lead to an increase of liquid water absorption into the wall from wind-driven rain. Many experienced masons and conservation professionals will say this a gateway for water to penetrate into the wall. The question is to what extent will absorption into the wall change, and is there a risk for increased moisture-related damage?
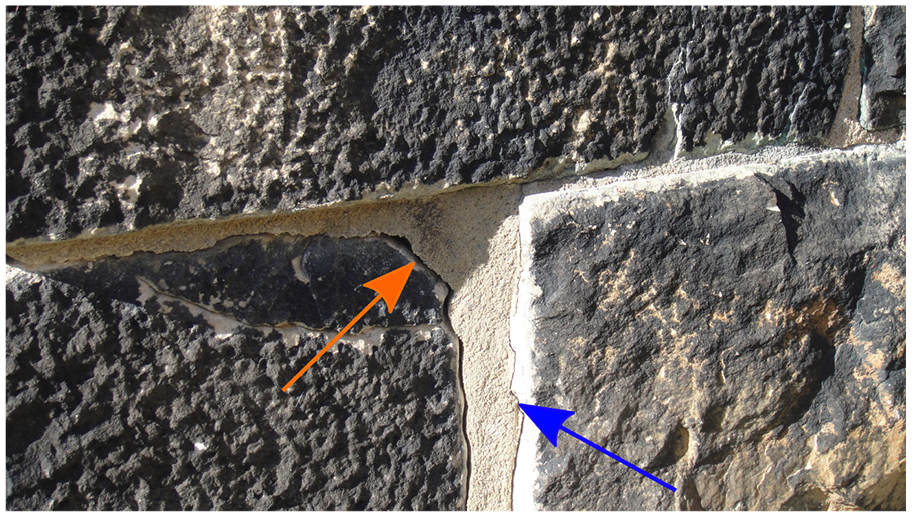
Sandstone masonry wall with open joint (orange) and hairline crack (dark blue) between stone and mortar.
This paper outlines a generalisable method for modelling these imperfections by introducing a fracture interface into a hygrothermal model. This model combines two different phenomena which are often modelled in isolation; interface resistances and increased fluid flow through fractures. Different size fractures (apertures) were modelled between unit and mortar, with and without an interface resistance in between. Simulations were performed under absorption, drying and natural (cyclic) conditions. The latter two are often neglected in studies and should be considered because masonry is often under drying conditions. The change in moisture content over time was compared to a baseline scenario without the fracture and perfect contact is assumed.
Literature review
The mortar-unit interface is a complex area in the context of moisture transfer, especially considering when there are imperfect contacts, cracks or other damages. Many studies have examined the presence of an interface resistance which slows the liquid transport from mortar to unit or vice versa. The interface resistance affects transport perpendicular to the interface and not parallel to the interface. Moisture transport should also be considered parallel to the unit interface. Several studies have examined moisture transport in fractured building materials, and the the absorption rate when exposed to liquid water. Often, the fractures are in a homogeneous material such as concrete and the presence of fractures and required detailed geometric mapping.
Both of these phenomena are often studied in isolation, and not in tandem. There isn’t a simple and generalisable modelling method developed which connects the magnitudes of the interface resistance, and increased liquid flow via the fracture. By generalisable method, we are referring to a model which is based on one or two observable parameters and utilises a more upscaled approach. In this case the parameters are the visible level of damage, or more specifically the assumed aperture of the fracture. Furthermore, these studies often focus only on the wetting phase and do not consider the drying phase, or the transient cyclic weather conditions a building envelope will experience.
Mortar – Unit interface resistance
Previous studies have demonstrated that there is an interface resistance (RIF) between the mortar and unit which inhibits liquid moisture transport across the interface. This is caused by two reasons. The first reason is there are gaps between the two materials which formed either immediately after curing or by cracking/displacement over time. Water lacks the capillary traction forces to efficiently traverse the gap and needs to travel across the gap via vapour diffusion instead of through quicker capillary action. The nature of the gap may be inconsistent along the interface ranging from a perfect contact to an open fracture (Figure 2). The second reason is migration of fine particles towards the mortar joint during the curing stages (Brocken, 1998). The fine particles form smaller pores near the interface and this reduces liquid flow. The interface resistance can be modelled in several ways. It can be modelled with as an explicit infinitesimal layer analogous to contact resistances in heat transfer (Calle et al., 2019; Derluyn et al., 2011; Janssen et al., 2012; Qiu et al., 2003); or as an air layer between materials as in equation (1) (Brocken, 1998).

where h = height of air layer (m), δa = vapour diffusion coefficient for still air (s), Pc = Capillary Pressure (Pa), Pv = Vapour Pressure (Pa)
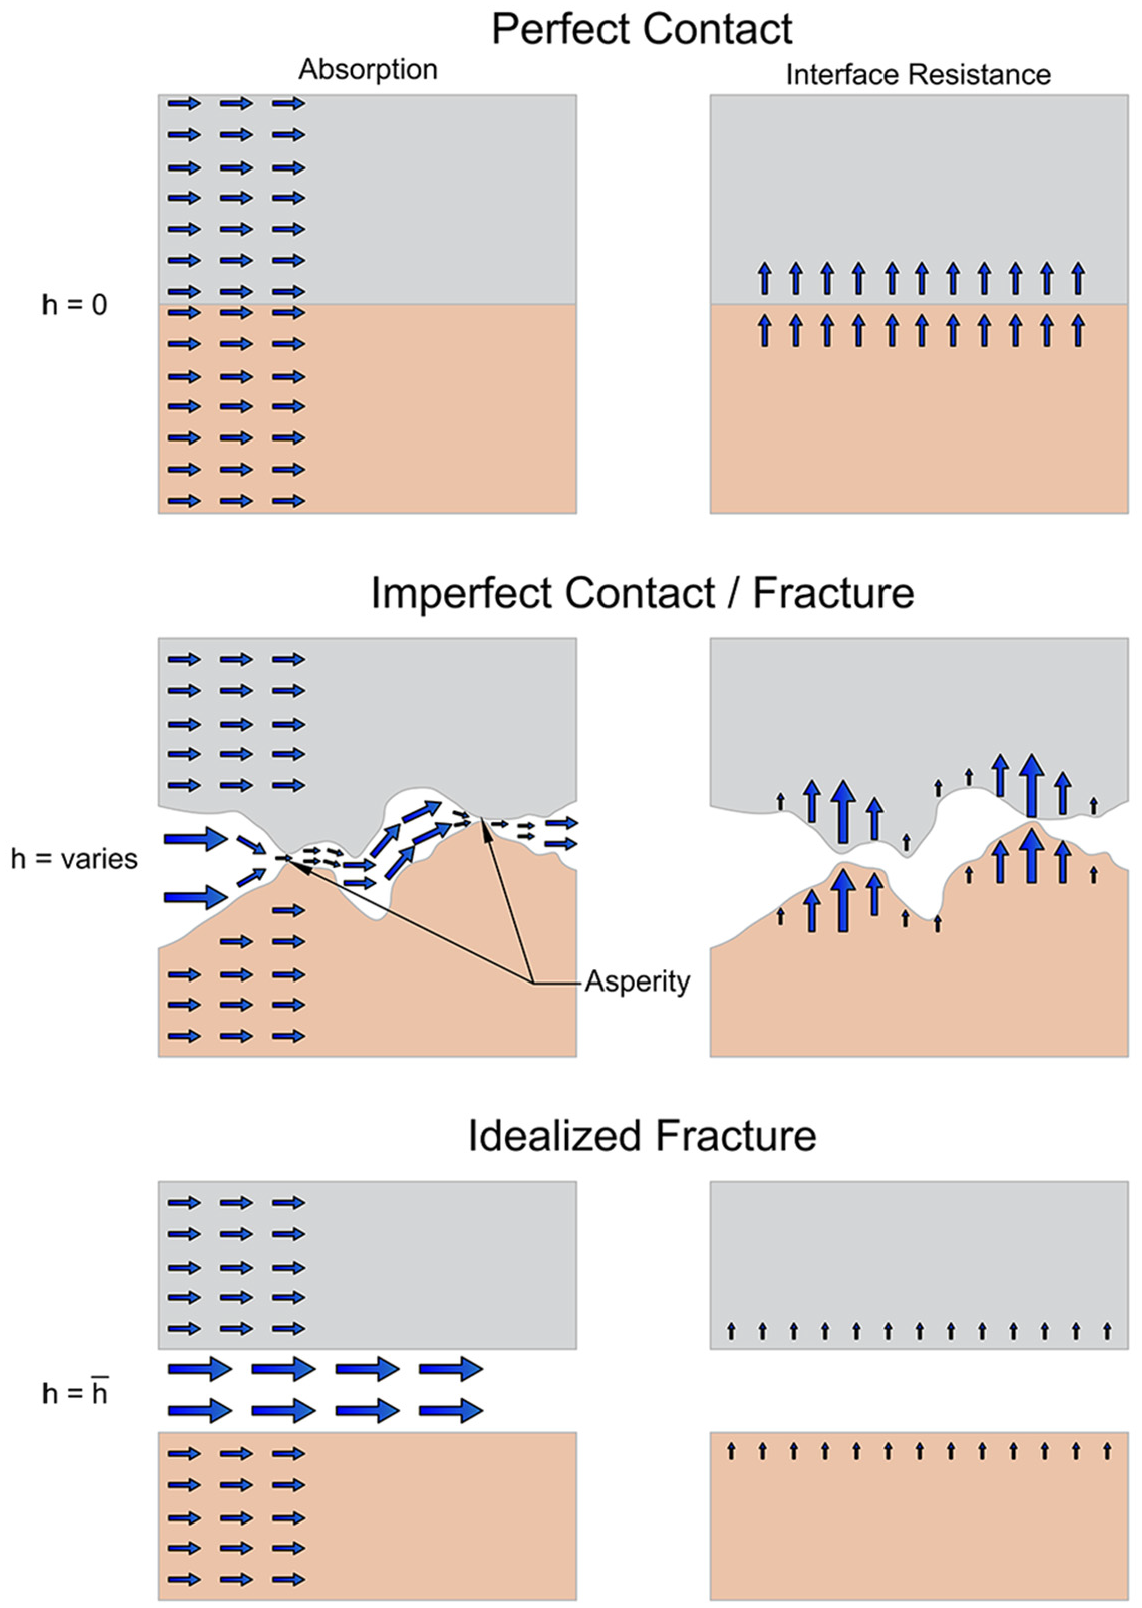
Illustration of various contact conditions and how it affects moisture transfer in the interface.
Laboratory tests have measured the interface resistance between 1.0E08 and 1.0E12 m/s (Calle et al., 2019; Derluyn et al., 2011; Qiu et al., 2003). These values changed depending on the combination of materials, whether the mortar was dry or wet cured and whether the joints were oriented vertically or horizontally. Simulations have also demonstrated the effect that the interface resistance has on moisture absorption when exposed to realistic wind-driven rain and rising damp conditions (Vereecken and Roels, 2013; Zhou et al., 2018). A different laboratory test performed by Zhou et al (2020) designed to measure water uptake while considered interface resistances found a noticeably quicker advance in the wetting front adjacent to an interface with a visible crack. The authors noted a need for an absorption model for masonry with cracks at the interface.
The interface resistance is assumed to be a constant value in simulation and laboratory tests. It is possible that this is not true, and it changes depending on degree of saturation. If the case of a fracture is considered, as the moisture front approaches and the fracture is wetted, water would be able to bridge across the upper and lower surfaces of the fracture, and the resistance will diminish. As simulation study by Alfaiate et al. (2010) indicates that the interface resistance may be moisture-dependant. Here a fracture was modelled with a fixed boundary condition, next to the porous media and separated by a surface transfer coefficient. This value was estimated to be in the range of 106 m/s and is several orders of magnitude lower than what was found by laboratory tests. The possibility of a non-constant interface resistance would be important if both drying and wetting cycles are considered; or if water is coming parallel to the interface. Because the fracture is more likely to be dry under natural cyclic conditions, RIF will be assumed to be constant for the simulations in this paper and calculated from equation (1).
Fracture modelling
The interface resistance does not explicitly consider transport parallel to the interface. Water absorption in fractured materials (brick and concrete) has been studied by Roels and Rouchier in 2D (Roels et al., 2003; Rouchier, 2012) and by Li and Smyl in 3D (Li et al., 2018; Smyl et al., 2016). In all scenarios, the rate of water absorption increased through the porous media. These studies had a few procedural weaknesses in their applicability to masonry. First the fractures required detailed geometric analysis and discretisation into a finite-volume grid. This requires increased effort and computational costs and is difficult to generalise for large sections of wall or the variety of crack patterns which could be encountered. The second is that the testing and simulations were done on homogenous materials, meaning that the material was the same either side of the fracture. In a masonry interface this is not true as the hygroscopic properties of the two adjacent materials may be quite different. And third, these studies primarily focused on the wetting phase only. Considering these weaknesses, a simplified model is proposed where cracks at the mortar-unit interface are explicitly modelled as fractures.
Liquid water transport in fractures is similar but distinct to that of traditional capillary mechanics in porous media (bundle of capillaries model). Fluid flow in fractures is bounded only on two sides, whereas in capillaries it is bound in all directions. A fracture will also have fewer obstructions than the bundle of capillaries model and have less resistance to moisture flow.
To calculate the hygric properties of a fracture, we start with the Navier-Stokes equation and the assumption that the fracture be modelled as two smooth parallel plates. If external forces are neglected, one-dimensional flow and steady-state conditions are assumed, then the Navier-Stokes equation can be transformed into the Cubic Law which calculates mass flow rate across the width of the fracture.

where: Q = mass flow rate of liquid (kg/−s ), ρ = density (kg/m3), w = width of fracture (m), h = aperture (m), ∇Pc = capillary pressure gradient and μ = dynamic viscosity (kg/m-s)
This can also be expressed on a per area basis by dividing by the width and aperture (wh):

The first term of equation (3) is the liquid conductivity of the fracture and is similar in form to the Hagen-Poiseuille equation for liquid flow through tubes. The difference between the two is the denominator being 12 instead of 8, and that aperture is used instead of the capillary radius.
The aperture is the distance between the upper and lower boundary surfaces of a fracture. One assumption for the Cubic Law is that the aperture remains constant throughout the fracture. In reality, fractures are non-uniform; the aperture widens and contracts, changes direction, and generally follows a tortuous path as fluid travels along its length (Figure 2). This means that the aperture is difficult to quantify at all points along the fracture length, and an alternative and simpler method is required.
Two methods are to use the average aperture height of the fracture (
Asperities also effect the flow path in a fracture. Asperities are points where the upper and lower walls of the fracture are in contact with another and the aperture height effectively becomes zero. In the context of masonry, these are the points where mortar and unit bond and transmit normal forces to one another (See imperfect contact in Figure 2). There have been many models and formulas developed to calculate the effect of asperity that depend on the size, shape and distribution of the asperities. Kirkpatrick (1973) developed a theory on how asperity changes hydraulic aperture and therefore conductivity by the use of effective medium theory. From this method, the following equation predicts that:

where hH = hydraulic aperture (m), h0 = average aperture (m), c = contact area or concentration of asperities (−).
The greater the number of asperities, the lower the effective hydraulic aperture will be and therefore reduced liquid transport. More complex equations have been proposed and it has been found that in some cases, using the above equation with asperities considered, versus only using only the mean aperture, resulted in differences in hydraulic conductivity of more than an order of magnitude (Zimmerman and Bodvarsson, 1996). The difference between mean aperture and hydraulic aperture has been reported to be a factor of between 1.1 and 1.7 (Hakami, 1995). Typical apertures in subterranean rock are reported to be in the 1–100 μm magnitude range (Pyrack-Nolte et al., 1987) and fractures in building materials range are in a similar range (Roels et al., 2003; Rouchier, 2012). Anything much smaller than this and liquid transport is greatly reduced.
The advantage of using hydraulic aperture over the mean aperture is that it avoids investigating and describing the complex geometry of the fractures. For the remainder of this article when using the term aperture or the symbol (h), we are referring to the hydraulic aperture.
Hygrothermal simulation tools
A two-dimensional finite volume software is required for simulation of fractured material of this type. Commercially available hygrothermal software which can handle this type of problem include WUFI 2D (Fraunhofer Institute for Building Physics, 2019) and DELPHIN (Bauklimatik Dresden, 2018). Other software such as COMSOL or hydrogeological modelling software could also be used for this problem, but lacks the set-up for hygrothermal problems. A custom finite-element code a la Roels et al. (2003) was not considered practical to develop. DELPHIN was chosen because it has the ability to easily model contact resistances and can handle very small (<μm) grid elements needed for the fracture models.
Synthesis
There have been many studies of the interface in masonry which focus on moisture transport in only one direction; either parallel or perpendicular to the interface, but not both. These studies primarily focus on the absorption phase and little attention is given to the drying phase or exposure to realistic boundary conditions. The methods and results can also be difficult to generalise for various cracking patterns, crack widths and states of decay.
This paper proposes a generalised methodology for modelling the mortar-unit interface by idealising the system as a fracture. The method simultaneously considers transport both parallel and perpendicular to the fracture and examines the absorption, drying phases and natural cyclic weather conditions. The models use a simplified geometry and can be transferred to any combination of material properties and dimensions of mortar and unit. The hygric properties of the fractures and adjacent materials can be determined from basic principles.
Methodology
A series of two-dimensional hygrothermal models were created which explicitly modelled the mortar-unit interface as a fracture. The wall typology simulated is an uninsulated double-wythe brick masonry wall with cement-based mortars. The fracture was modelled with different size apertures ranging from 1 μm to 500 μm.
Five distinct models were created, which included three different interface models and three different boundary conditions:
Absorption: Fracture without interface resistance
Absorption: Interface resistance only
Absorption: Fracture with interface resistance
Drying: Fracture with interface resistance
Cyclical: Fracture with interface resistance
Models 1–3 examine the absorption phase only. They are intended to mimic a water absorption test held at a constant boundary condition. Three different ways of modelling the interface were tried combining the fracture model and interface resistance model together and in isolation. Model 4 examines the drying phase to examine how the fracture may help or hinder drying from near-saturation conditions. Model 5 represents a simple double-wythe wall assembly exposed to realistic exterior and interior boundary conditions, to examine its behaviour under cyclic wetting and drying periods.
DELPHIN model
DELPHIN 6.0 was chosen to perform the simulations (Bauklimatik Dresden, 2018). The model was kept geometrically simple, consisting of three materials: mortar, interface and clay brick Figure 3. The interface’s height and properties change depending on the aperture chosen. The dimensions of the brick were based on standard North American sizes.
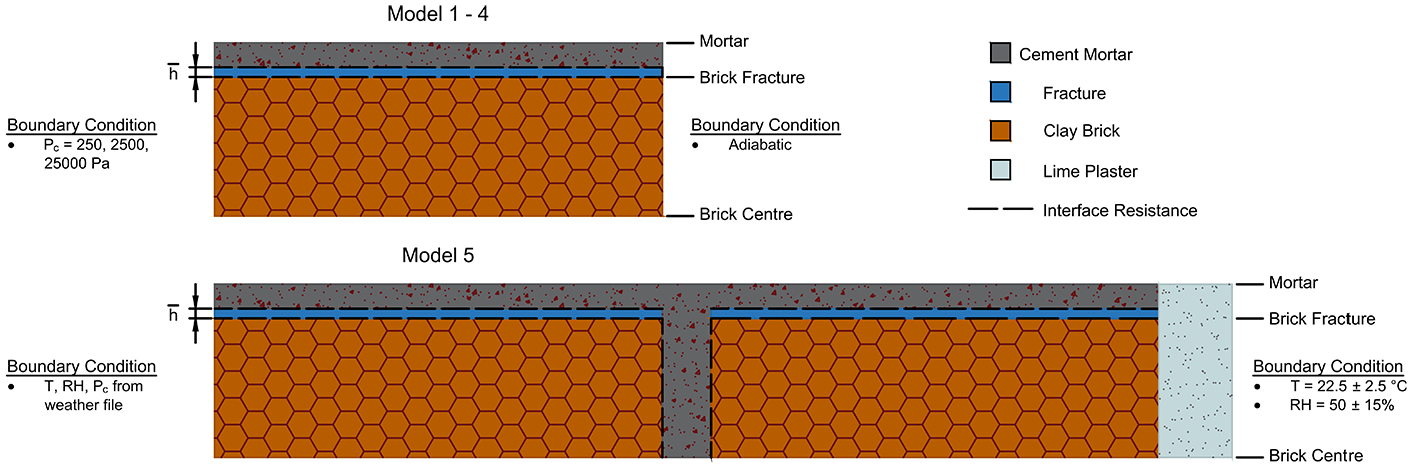
Geometries used in the DELPHIN simulations.
Adiabatic and impermeable (zero-gradient) boundary conditions were assumed on the top and bottom taking advantage of symmetry. For the absorption models (Models 1–3), the exterior boundary condition was held at a fixed capillary suction pressure. Three levels of capillary pressure were used (250 Pa, 2500 Pa, 25,000 Pa) to simulate three different degrees of wetting. The 250 Pa boundary condition was used to simulate immersion in water. Ideally this would be set to 0 Pa (the transition point from hydrostatic pressures) if a water absorption experiment were simulated. However, some numerical stability issues were encountered at very low suction pressures. Trial simulations below 250 Pa did not produce substantially different outcomes. The 2500 Pa boundary condition was used to simulate a heavy rain event and the 25,000 Pa boundary condition was used to simulate a light to moderate rainfall event. The interior was modelled with zero-gradient boundary conditions. The initial RH of the three materials was set to 50% and heat transfer was not modelled.
Model 4 (drying) had the same geometry and material properties as the absorption models. The initial MC was set at near saturation. The ambient boundary condition was set to RH = 50%. The vapour convection coefficient was set to 3*108 s/m. Again, the interior was modelled with zero-gradient boundary conditions and heat transfer was not considered.
For Model 5 (cyclical), the exterior boundary condition was determined from the 1 in 10 year weather year for the Ottawa International Airport using the RHT method (Zhou et al., 2016). This weather file had an average temperature of 7.6°C, average RH of 73.0% and annual precipitation of 945 mm. The interior boundary conditions were based on annual sine curves: T = 22.5°C ± 2.5°C and RH = 50% ± 15%. In general, the default model parameters in DELPHIN such as convection coefficients and solar absorption coefficients were used. The only exception being the rain exposure coefficient being increased to FDFL = 1.0 to put more stress on the wall assembly (ASHRAE, 2016).
Care was needed when defining the finite-volume grid. Because of the sub-millimetre height of the aperture layer, individual grids in the y-direction are very small. A smooth transition between neighbouring elements is needed and a relatively large number of grids were required. An expansion ratio of 1.2 was used throughout with grids concentrated around the wetting boundary condition and fracture. The mass balance absolute tolerance was set to 5*10−5 kg at each timestep. DELPHIN’s solver parameters were adjusted based on the needs of each simulations.
Material properties - Bulk materials
The hygrothermal properties of the clay brick and the mortar are shown in Table 1.
Bulk material properties used in DELPHIN simulations.

They were determined by taking the median values of all similar types of materials in the DELPHIN library. The moisture retention curves and liquid conductivity curves were calculated using single-mode Van Genuchten curves (van Genuchten, 1980). For each database material, the n and α parameters were calculated via least-squares regression. The median values of n and α were then used to generate the moisture retention curve for the clay brick and cement mortar. The material property curves are shown in Figure 4.
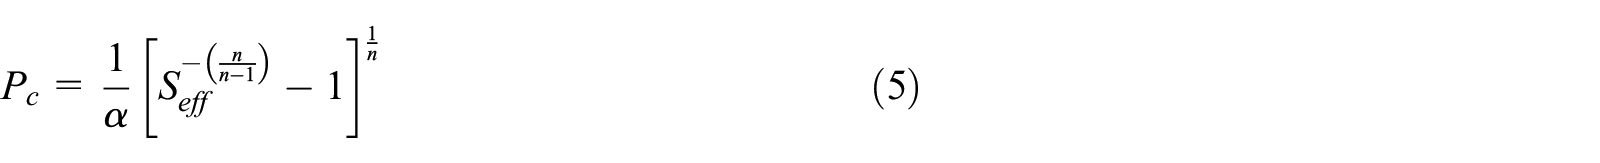
Van Genuchten Equation where Pc = capillary pressure (Pa), Seff = effective saturation (−), n = material-specific fitting parameter (−), α = material-specific fitting parameter (kPa−1).
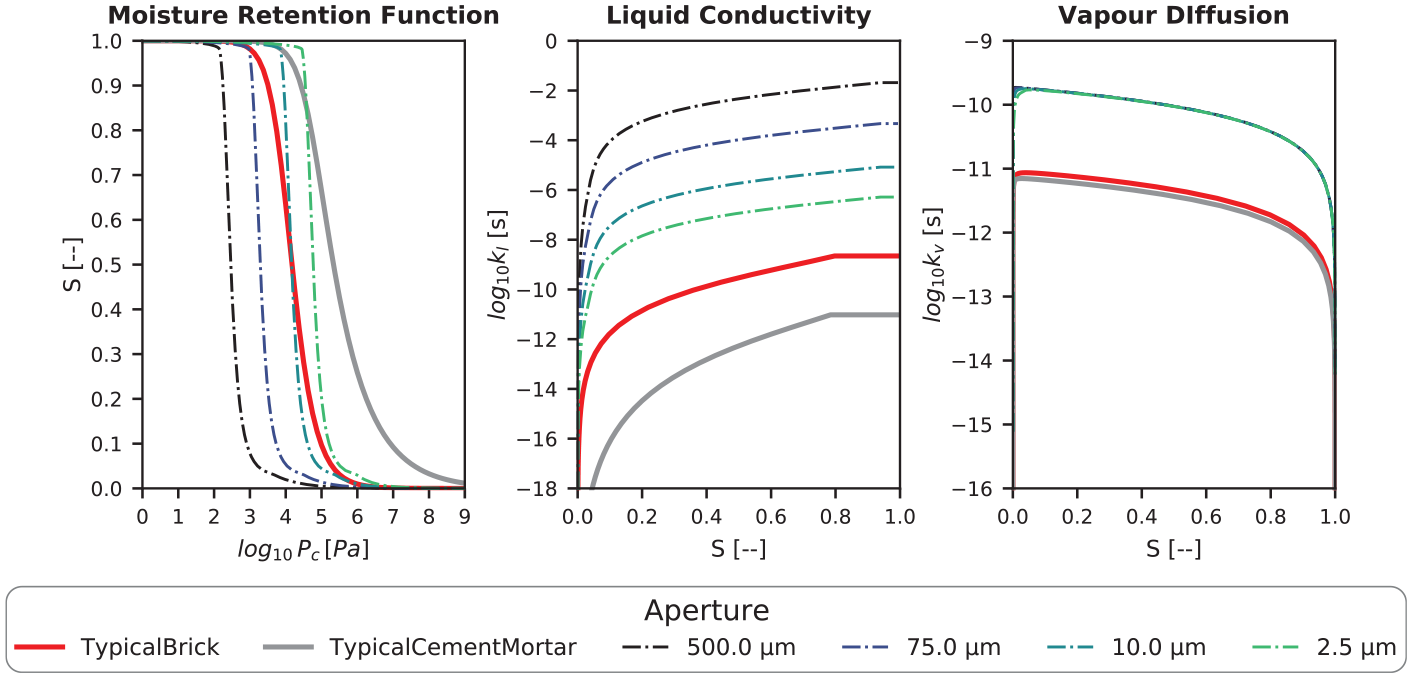
Material property curves used in simulation.
The approach for liquid conductivity was to use the theoretical Van Genuchten curves and the Hagen-Poiseuille equation to create the moisture-dependent curve (kl(θl)). The pore size distribution can be inferred through the Young-Laplace equation which equates capillary pressure (Pc) into capillary radius (r). The liquid conductivity through a capillary can be calculated using the Hagen-Poiseuille equation. At low degrees of saturation, only the small capillaries are filled and available for liquid transport. As the media becomes more saturated the liquid conductivity increases as the more open and freer flowing pores become active. Integrating over the range of active capillaries yields the following equation (Burdine, 1953; Scheffler et al., 2004):
Where kl(θl) = moisture-dependent liquid conductivity (s), ρ = density (kg/m3), τ = tortuosity (−), r = capillary radius (m), μ = dynamic viscosity (kg/m-s), n = number of capillaries of that size.
This equation was reduced by a tortuosity factor (τ) which was determined by scaling the liquid conductivity to the effective liquid conductivity at saturation (kl,eff).

Where kl(θcap) = liquid conductivity at capillary saturation from equation (6), and kl,eff is the liquid conductivity obtained from physical testing in the DELPHIN library.
The vapour diffusion coefficients were calculated using the following equation:

Where kv(θl) = moisture-dependent vapour permeability (s), δa = vapour diffusion coefficient for still air (s), μ = vapour resistance factor (−), Seff = degree of saturation (−).
Fracture Properties
The hygric properties of the fractures can also be calculated using (equations (6) and (8)). The main difference is that the capillary radius (r) is substituted for the aperture (hH). Capillary media has a pore radius distribution whereas the fracture is idealised as having a constant aperture. This leads to issues when defining the moisture retention curve as it turns into a step function with an abrupt transition from fully saturated to bone dry. This will lead to numerical issues in the simulation program. To counter this, the fracture apertures were modelled as a normal distribution with mean (h) and standard deviation (h/2) which gives an aperture size distribution. This improves the numerical issues and is more representative of the geometry of an actual fracture.
The aperture distribution was translated into a moisture retention curve using the Young-Laplace equation. On the moisture retention curve (Figure 4), the larger apertures are located towards the left (low capillary suction) while the smaller apertures are shifted towards the right and resemble more traditional curves for porous media. Larger fractures require lower capillary suction pressure to fill and activate the fracture for liquid flow while smaller fractures become active at more common capillary suction pressures.
With the aperture distribution determined, the moisture-dependent liquid conductivity curve can be calculated using equation (7) and the moisture-dependent vapour permeability curve can be conducted using equation (8). Larger apertures allow for higher liquid conductivity than smaller fractures but require low capillary suction to become fully active. As seen in Figure 4, the liquid conductivity of the fractures are several orders of magnitude greater than the brick and mortar. Even though the exposed area of the fracture is small it can contribute to an increase in overall moisture transport.
The fractures were assumed to be fully open (θ = 0.99) and vapour resistance factor (μ) equal to 1.0. As a result, the vapour diffusivity in the fractures is considerably higher than the bulk material.
Models 2–5 have an interface resistance included. The interface resistance was calculated using equation (1). RIF ranged from 3.0 e-08 - 1.5 e-11 m/s (h = 1 -500 μm) which fits in the range given by literature values. Model 1 is assumed to have an RIF = 0.
Model 2 does not include the aperture and one resistance was included in the model equal to RIF. Models 3–5 have two resistances either side of the aperture equal to RIF/2. In Model 5, an interface resistance was included between the centre mortar and two brick wythes. An explicitly modeled fracture was not modelled at these interfaces. The capillary pressure differential is not as great along this direction as it is into and out of the wall and therefore liquid transport would not be as great. Adding this would also increase the size and complexity of the grid.
Results and discussion
Results are presented for the five models. Nine monitoring positions were selected for presentation (Figure 3). The ‘Mortar’ line was taken at the upper most row of the finite-volume grid (centre of mortar considering symmetry); the ‘Brick Fracture’ line was taken just below the fracture; and the ‘Brick Centre’ line was taken at the lowest row of the grid (centre of brick considering symmetry). Each of the three lines were monitored at 20 mm, 50 mm and 80 mm from the exterior boundary conditions.
Model 1 – Absorption: Fracture without interface resistance
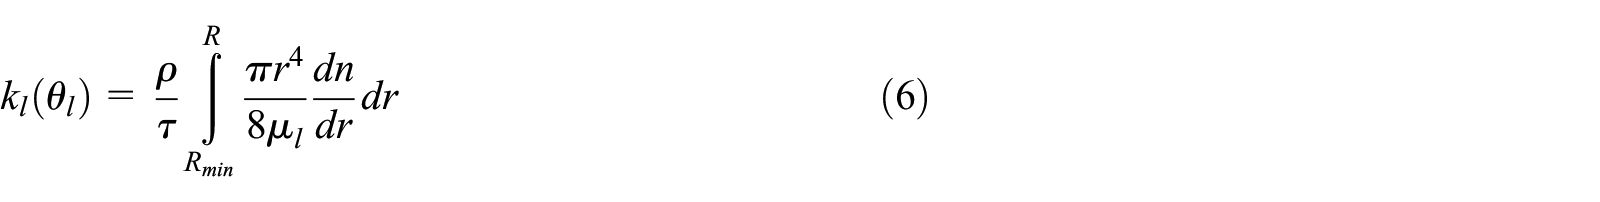
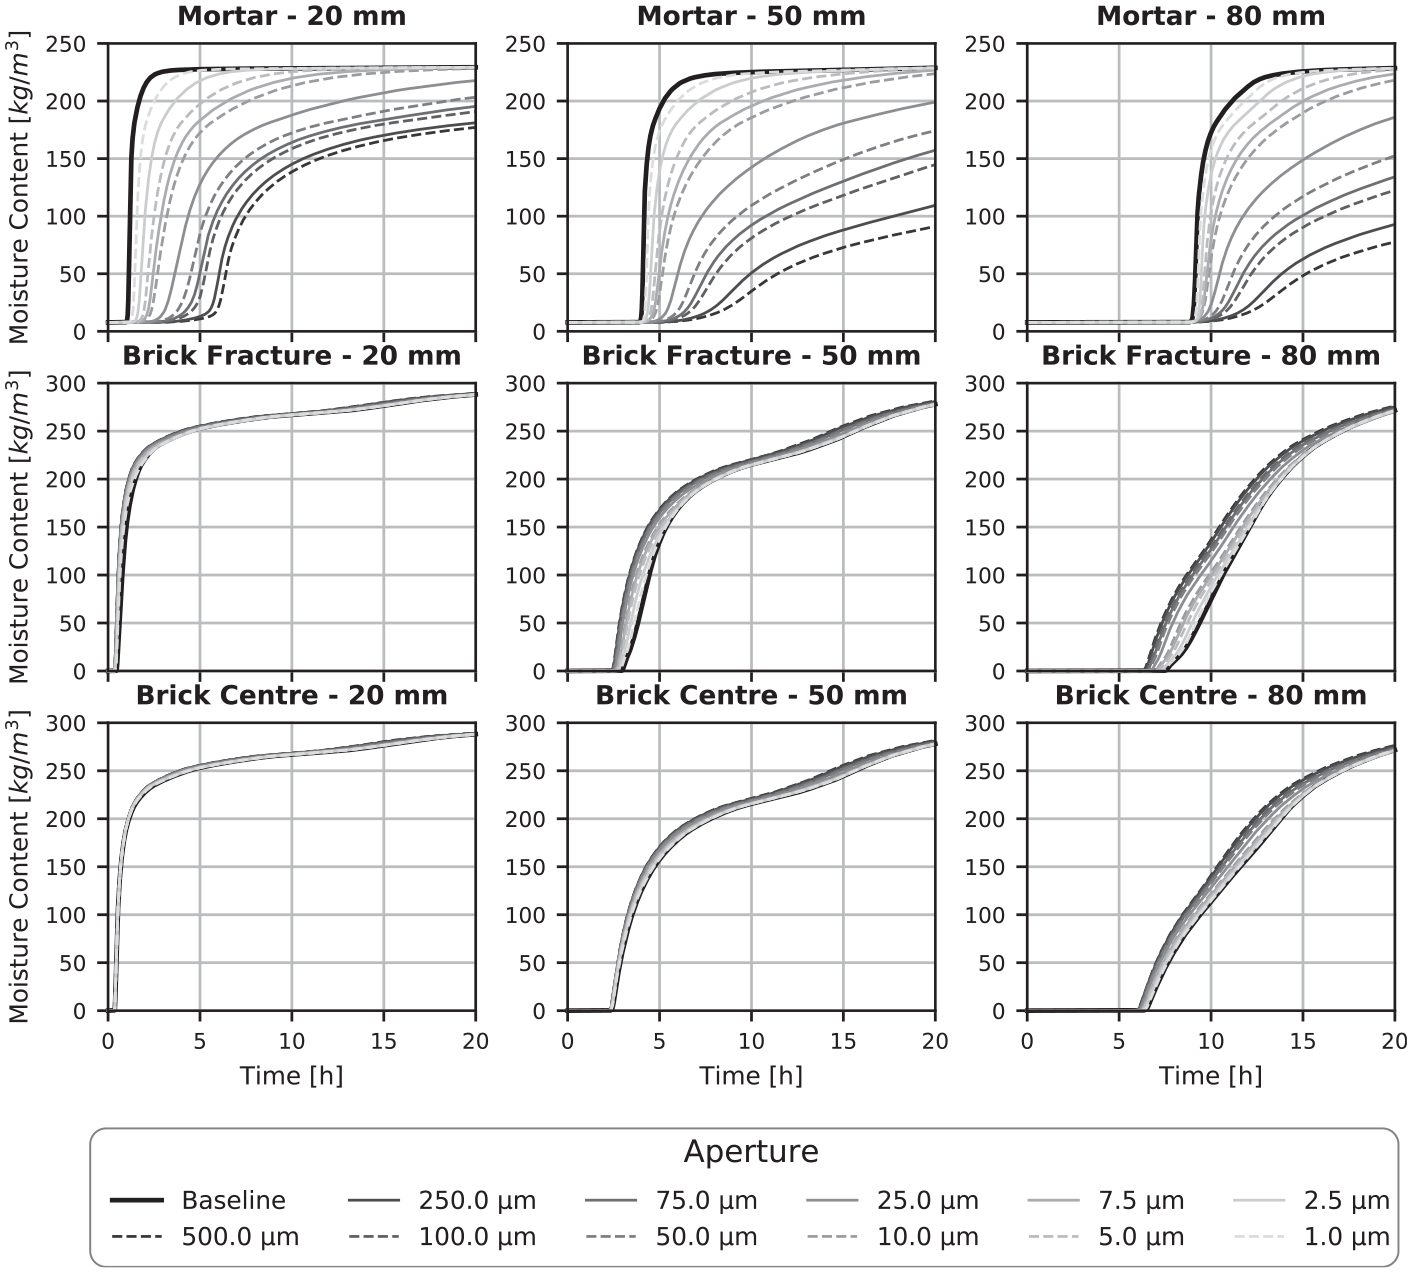
The results for Model 1 at the 250 Pa boundary condition are shown in Figure 5. The results show a significant increase in moisture content at all nine monitoring locations compared to the baseline. The larger fractures saw the most significant increase in moisture content while smaller fractures saw a less significant increase. The relationship between aperture and maximum moisture content is monotonically increasing. Higher moisture contents were achieved at all locations and they were achieved much quicker. This was most noticeable in the mortar and at the centre of the brick. Fractures as small as 5 μm led to a measurable increase throughout the mortar, while fractures as large as 25 μm caused the mortar to approach saturation after 5 h, whereas previously the moisture content had barely increased at this time. At the centre of the brick, saturation levels were achieved after less than 2 h of wetting for the larger fractures. This was in part contributed to the geometry of the brick. The larger fractures are efficient at transporting water and effectively recreates the 250 Pa wetting boundary condition inside the fracture. Instead of the distance from the boundary condition being 50 mm or 80 mm, the distance to the boundary condition becomes 28.5 mm.
Moisture content comparison for Model 1 (250 Pa).
When this model is run with different boundary conditions, a few things of note happen. First, the maximum moisture contents are lower in both the brick and mortar, and it takes more time to obtain those moisture contents. This was expected because there is less wetting at the boundary condition. The second thing of note is that the relationship between aperture and maximum moisture content is no longer monotonically increasing. This is shown in Figure 6.
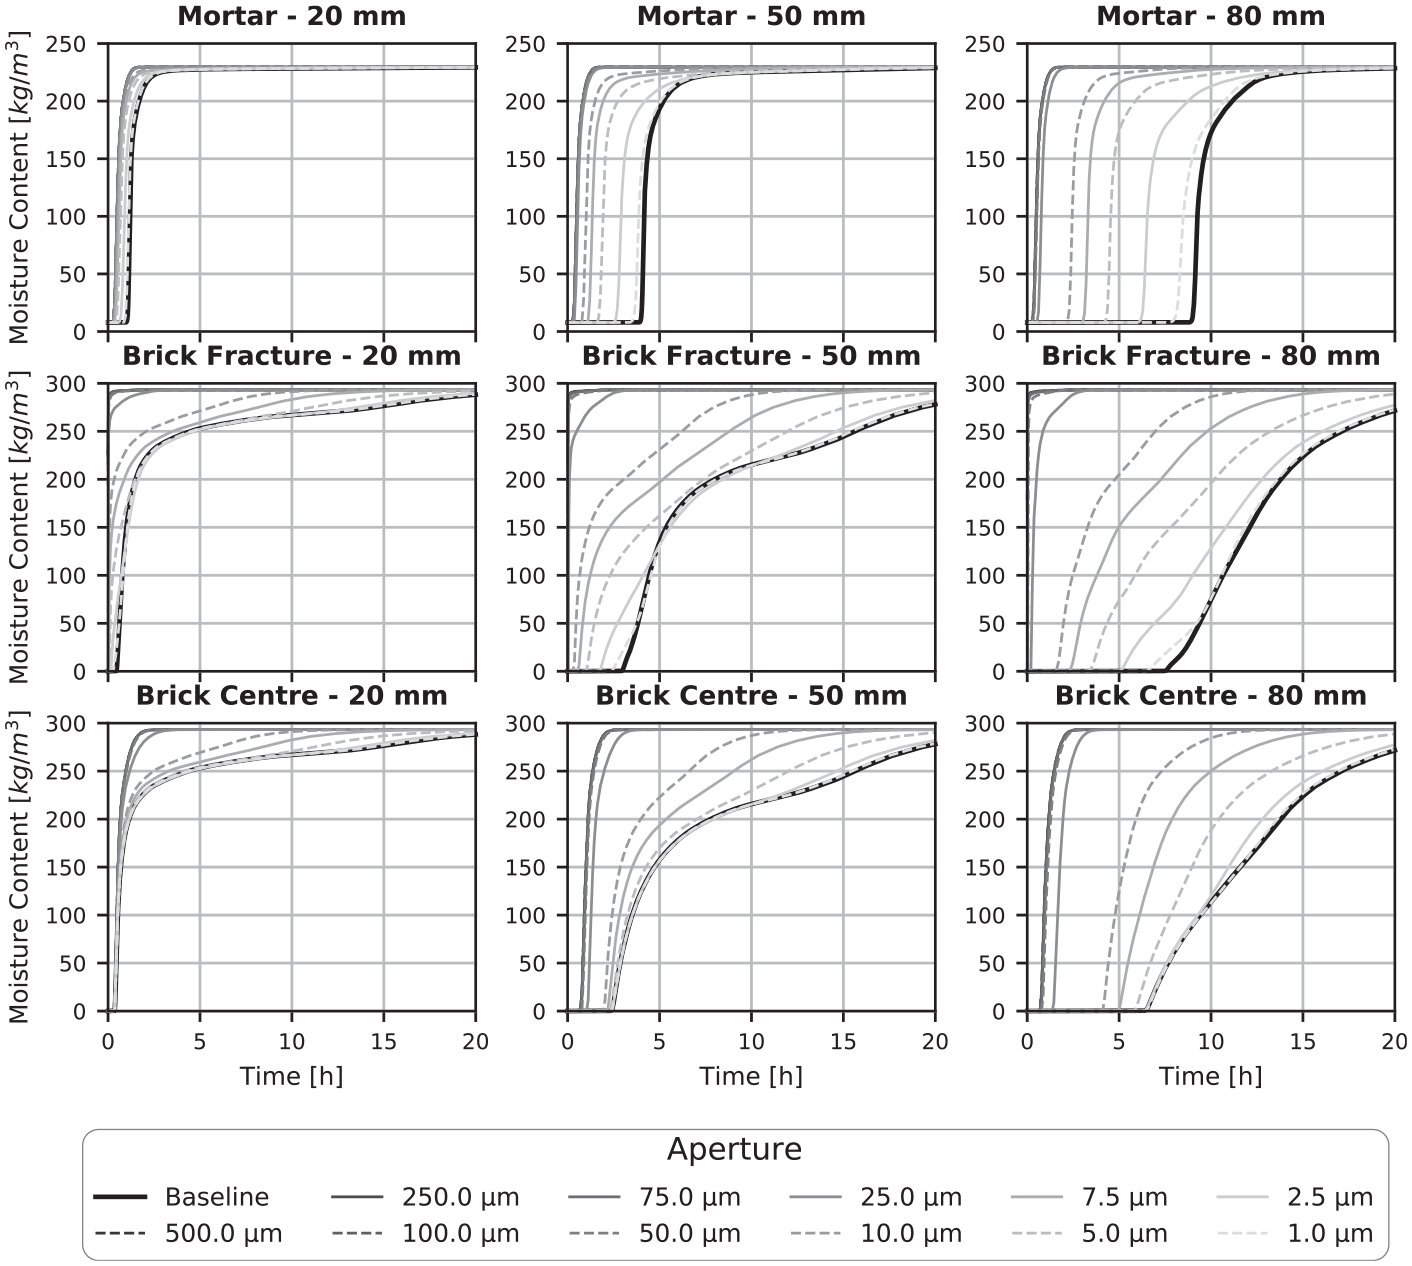
Moisture content at centre brick – 50 mm for three different boundary conditions. The bottom graphs illustrate the moisture contents from t = 0 (light gray) to t = 24 h (black). Note that there are different y-axis scales.
At 2500 Pa, the maximum absorption occurs in the 25–75 μm aperture range. Apertures smaller than this show a relatively similar pattern to the 250 Pa simulation. The larger apertures are unable to fill to the same degree at this capillary pressure and therefore have a reduced liquid conductivity.
At 25,000 Pa, the monotonically increasing relationship begins to break down further. At various points in the model, the 5–10 μm aperture range has the maximum moisture content, while in other areas, the largest apertures have the maximum. Universally, the 25–75 μm range had one of the lowest moisture contents, opposite to what was found in the 2500 Pa simulations.
It is difficult to put numbers to the difference in moisture content between the baseline model or other size apertures because it is very location and time dependent. Consider the Centre Brick −80 mm graph in Figure 5 for example. The relative difference between the 500 μm and 5 μm are quite extreme after a few hours, but after the 24-h simulation period, the lines begin to converge. The difference is less pronounced if we consider moisture at shallower depths into the wall. Generally, with the increase in capillary pressure, the variation in moisture content between the various apertures decreases compared to the 250 Pa model. The duration of the wetting event will have a significant effect on water absorbed, with the larger fractures still able to transport water deep into the assembly under brief rain events.
Model 2 – Absorption: Interface resistance only
The results for Model 3 at the 250 Pa boundary condition are shown in Figure 7. The biggest change from the baseline model was in the mortar. When the interface resistance is included in the model, the moisture content in the mortar over time decreases proportionately to the aperture size. The decrease is indicative that moisture was being transferred from the brick into the mortar in the baseline model.
Moisture content comparison for Model 2 (250 Pa).
As can be seen in Figure 7, there is little change throughout the brick from the baseline or different size apertures. The moisture that got prevented from entering into the mortar from the brick by the interface remained in the brick. There was a very small increase in moisture content in the brick (difficult to see in graphs), with the larger apertures having a slightly greater increase than the smaller apertures. Overall, a nearly identical quantity of water was being absorbed into the assembly between the baseline and various sized apertures. This was not the case in Model 1, where there was a significant increase in the total amount of water absorbed. Results were similar for the 2500 Pa and 25,000 Pa simulations.
In isolation, the effect of the interface resistance appeared to have minimal impact on absorption into and out of the wall.
Model 3 – Absorption: Fracture with interface resistance
The results for Model 3 at the 250 Pa boundary condition are shown in Figure 8. The difference compared to the baseline is not as great as Model 1. The presence of an interface resistance has dampened the increases in moisture of the open fracture.
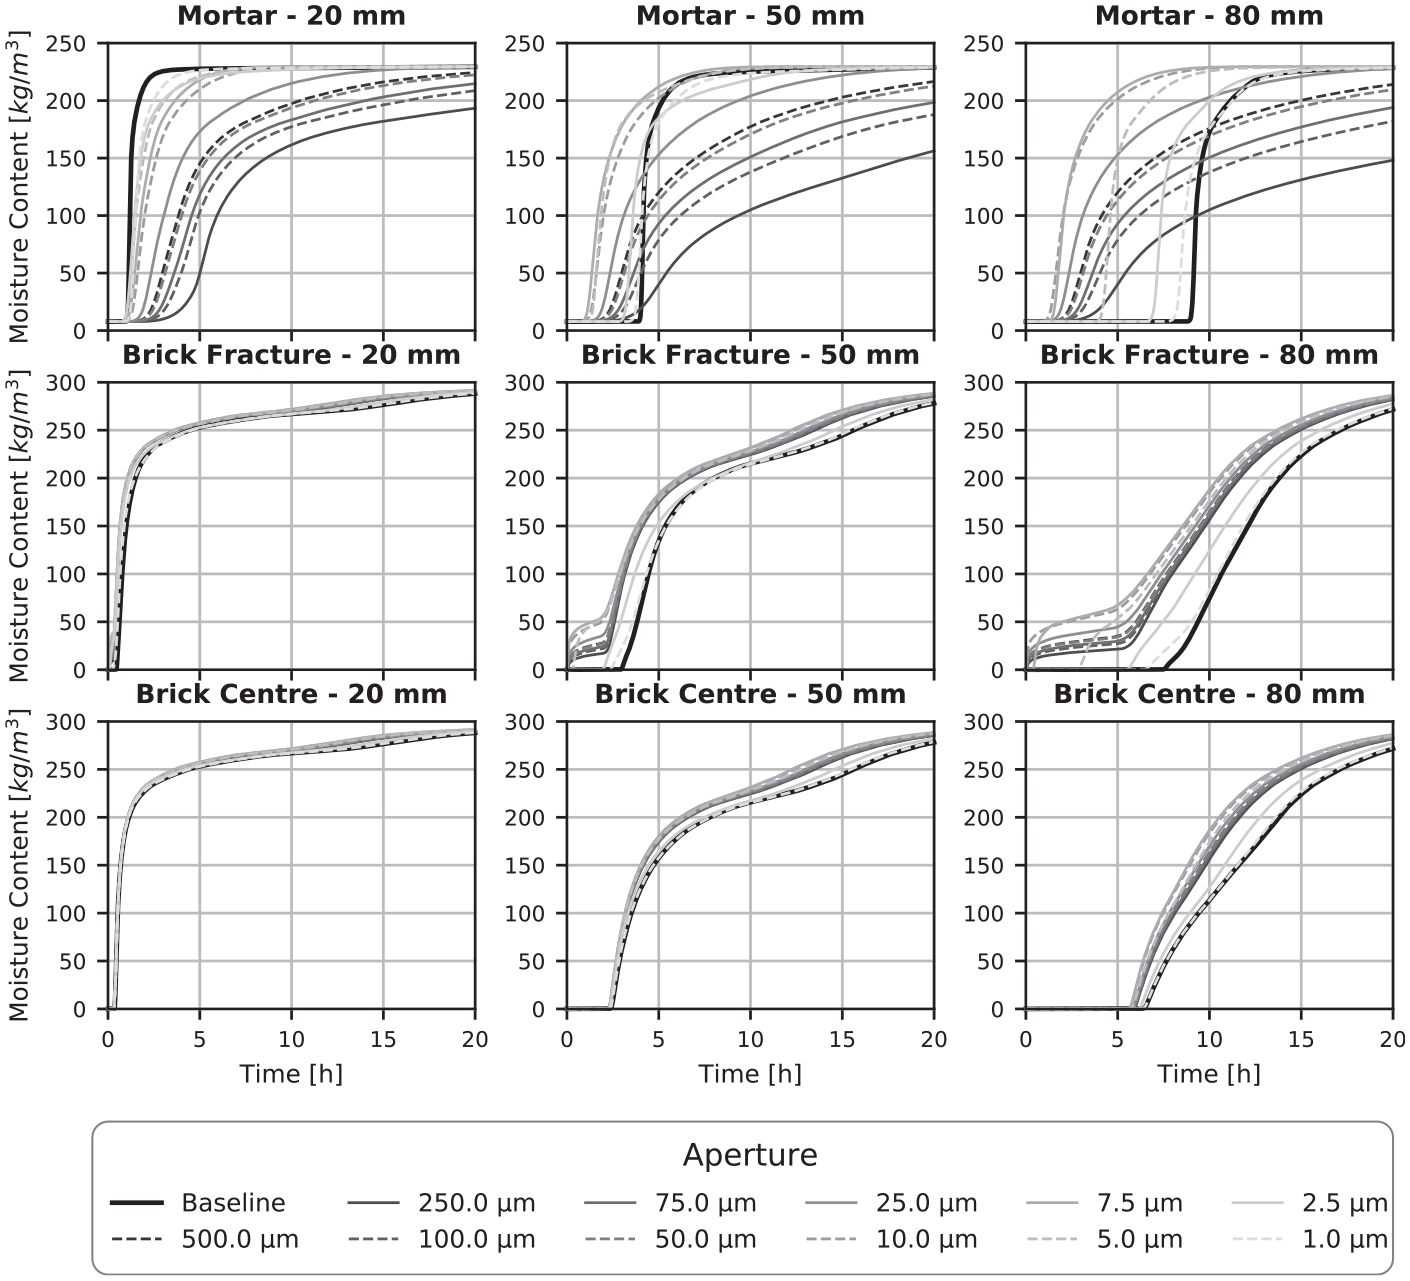
Moisture content comparison for Model 3 (250 Pa).
The moisture content of the mortar nearer the exterior tends to be lower than the baseline. A similar effect was noted in Model 2. However, this effect begins to be negated as we go deeper into the assembly and the moisture content becomes greater than the baseline for some apertures. This is because the fracture is filled and there is a larger capillary pressure gradient to overcome the interface resistance. The larger fractures exhibit some interesting behaviour. There is a relatively fast advancement of the wetting front followed by a gradual square-root-of-time wetting pattern. This is the influence of the interface resistance and a larger percentage of the moisture in these fractures is arriving parallel to the fracture.
Like the mortar, the increases in moisture content in the brick are not as significant as with Model 1. Near the fracture, there isn’t as sharp, or as immediate an increase in moisture content, especially for the larger fractures. There is a significant increase in moisture content near the fracture in the early moments of the simulation once the fracture quickly fills towards saturation and causes a large pressure gradient. Apart from that mentioned, the lines in Figure 8 generally follow a similar curve to that of the baseline.
Figure 9 shows the moisture content relative to aperture size at three different capillary pressures. At 250 and 2500 Pa, the moisture contents at each time interval are relatively flat, with an apparent maximum around 5 μm. At 25,000 Pa, the lines are no longer flat, and a pattern similar to Model 1 (Figure 6) begins to show with a maximum around 5 μm and minimum around 25 μm. At 25,000 Pa, the moisture content curves for all monitoring points starts to approach the curves in Model 1 with the same boundary condition. This is not true at the other capillary pressures modelled.
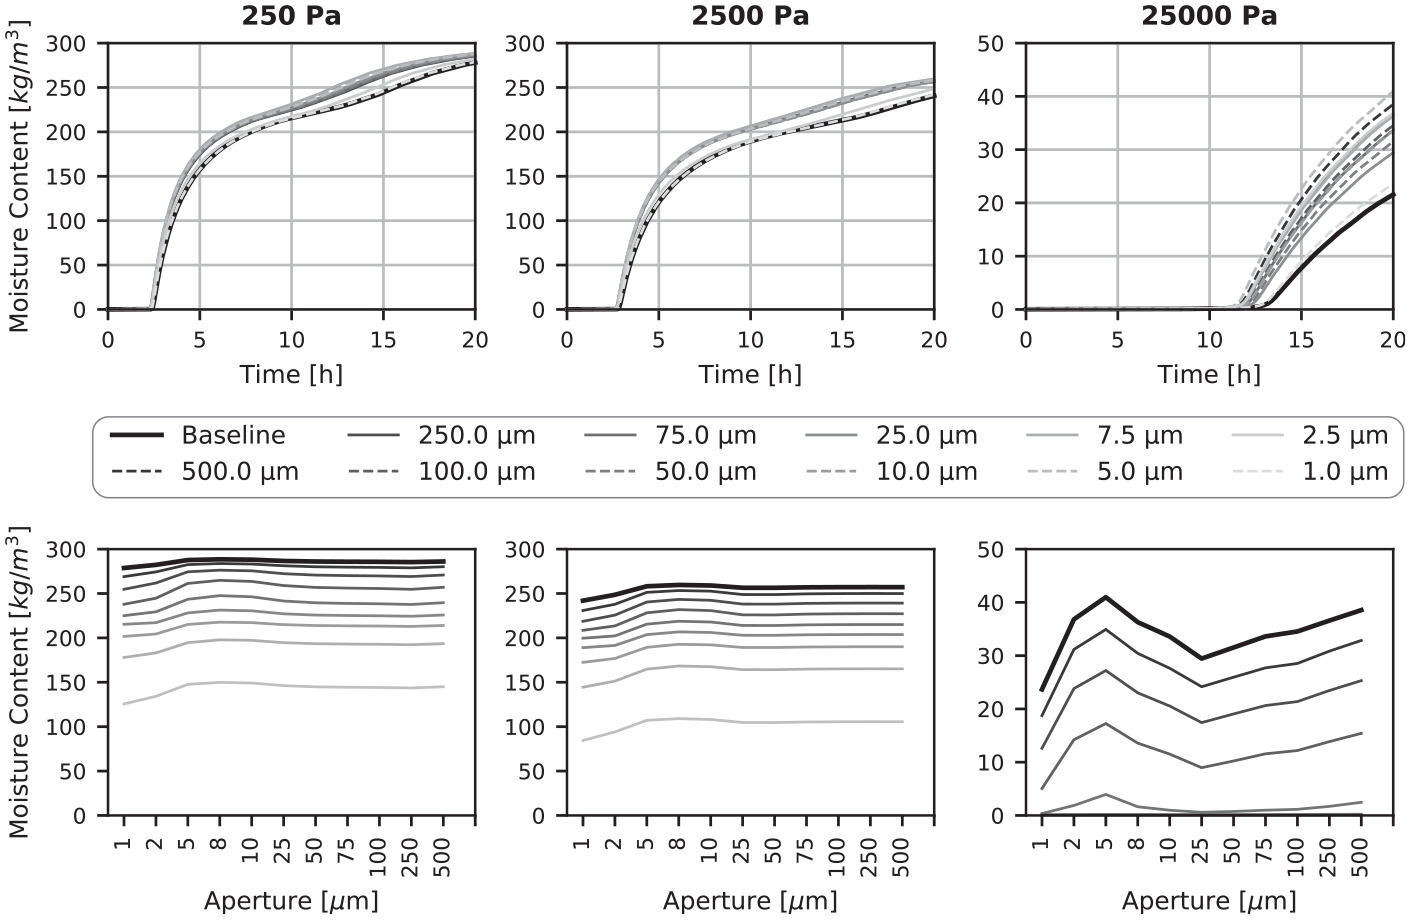
Moisture content at Centre Brick – 50 mm for three different boundary conditions. The bottom graphs illustrate the moisture contents from t = 0 (light gray) to t = 24 h (black). Note that there are different y-axis scales.
Model 4 – Drying: Fracture with interface resistance
Results for Model 4 are shown in Figure 10. All nine monitoring position demonstrated a similar pattern to that showed in Figure 10. The important takeaway is that the fracture encourages drying of the material, and the larger the fracture, the quicker it dries. The potential magnitude of this effect was surprising at first. However, a material with efficient transport properties in one direction (absorption) will also be efficient at transport when the sign of the differential is switched (drying).
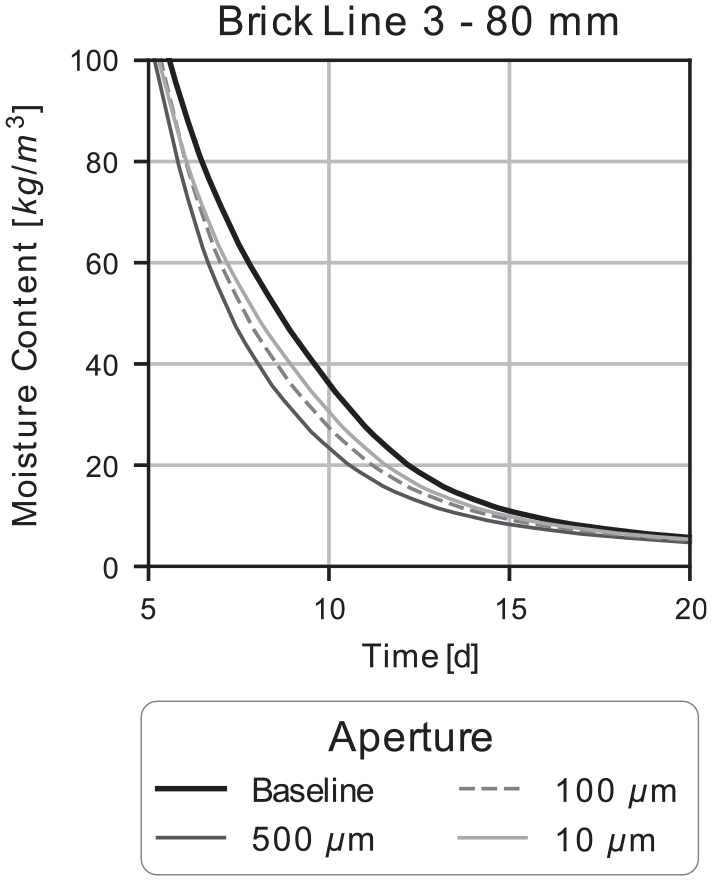
Moisture content comparison for Model 4.
During, the first phase of the simulation (partially cropped in Figure 10), the simulations closely match the baseline model and dries at a constant rate. In this early stage, the flow rate is largely governed by the vapour convection coefficient which dominates mass transfer resistance and is the controlling layer. The high liquid conductivity of the fractures offers little resistance and has negligible impact on transport when combined with the convection coefficient. As the assembly dries, the rate of drying decreases and we reach an apex in the curve. This is caused by a combination of reduced vapour pressure differential which slows the transfer to the ambient air (vapour convection); and the liquid conductivity of both bulk material and the fractures diminish adding resistance to the system. However, the liquid conductivity of the larger fractures doesn’t diminish to the point where their resistance is significant in relation to the system and mass transfer continues at a rate similar to the first phase of the simulation for a longer period of time. It should be noted that the if a higher vapour convection coefficient (typical of exterior conditions) were used the slope in the first phase of the simulation will be steeper and the behaviour at the apex may change.
Some drying simulations were performed with different values of μ for the fractures. It was found that the vapour diffusion through the fracture had minimal impact and that the effect seen was driven primarily by transfer in the liquid phase. The model does not consider hysteresis in the moisture retention curve. Hysteresis causes porous media to release moisture at slower rate than it is absorbed. This may lessen the increased drying rate if modelled.
The results indicate that drying may have a significant contribution in the cyclic model, especially if wetting brings the moisture content in the apex range of the drying curve.
Model 5 – Cyclical: Fracture with interface resistance
The results for Model 5 are shown in Figure 11 for one calendar year. The results are presented for the centre of the exterior brick.
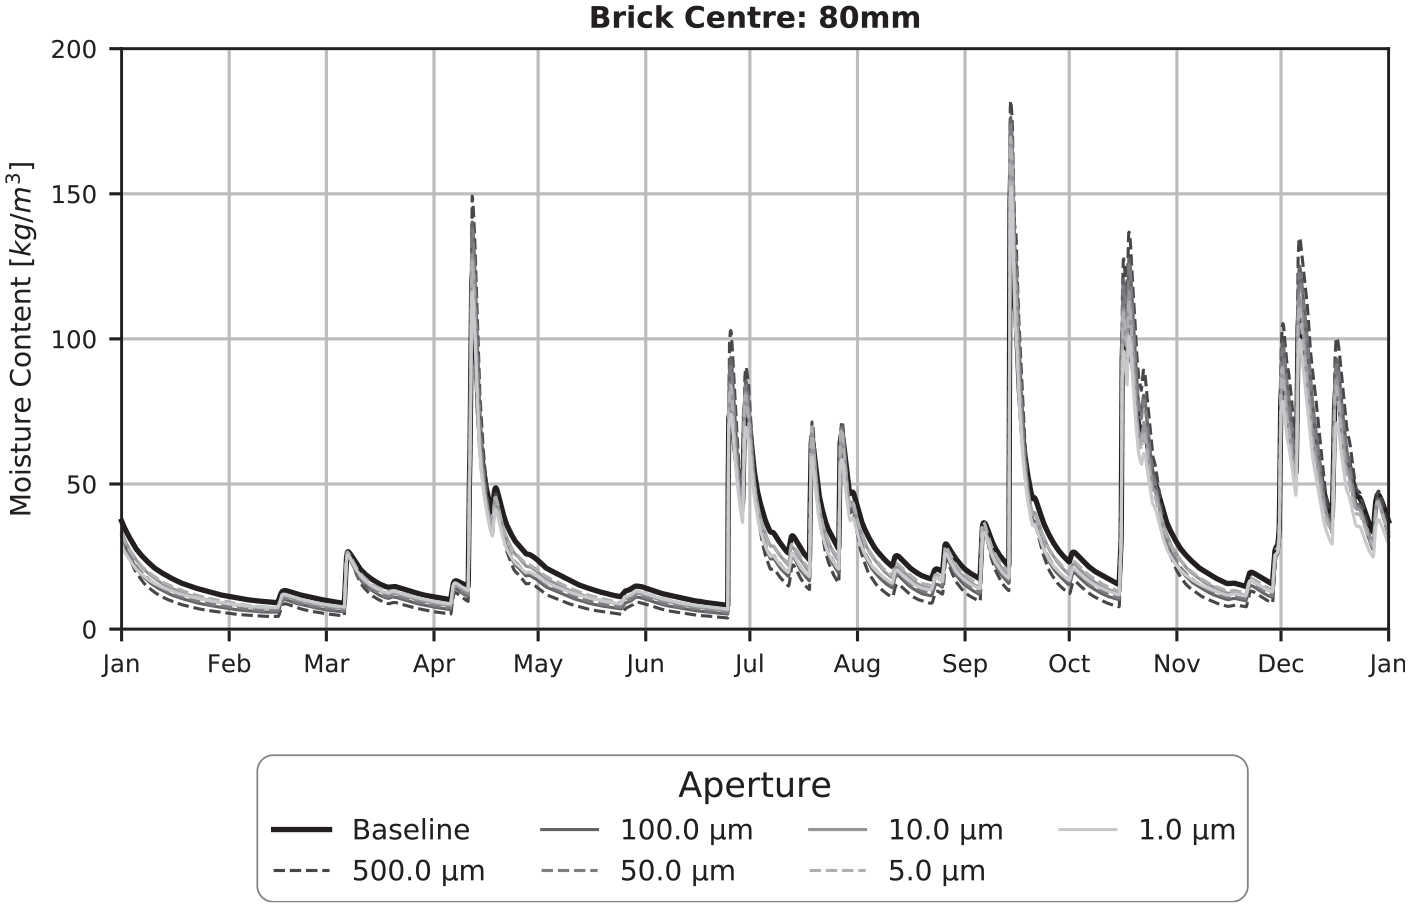
Annual MC for the baseline model and select apertures.
Figure 11 shows that there are several significant wetting events which caused a spike in moisture content over the course of the year. Figure 12 shows the same data zoomed in for the summer months. During each wetting event, the fractures are able to absorb more moisture than the baseline model can. Depending on a combination of factors such as wind-driven rain intensity, duration or relative difference in moisture content at the beginning of wetting, the moisture content may exceed the baseline model. The wetting phase is succeeded by a drying phase, and the assembly begins to dry quicker than the baseline. The drying is enhanced because we are often in the apex region described in the discussion of Model 4. Drying periods occur more often than wetting periods which means that drying behaviour is more dominant than absorption behaviour under realistic weather conditions. As a result, the fracture model tends to reduce the moisture content in the masonry over the long term. For the larger apertures, the drying is more pronounced than the smaller fractures, where it is not as definitive whether moisture content is reduced.
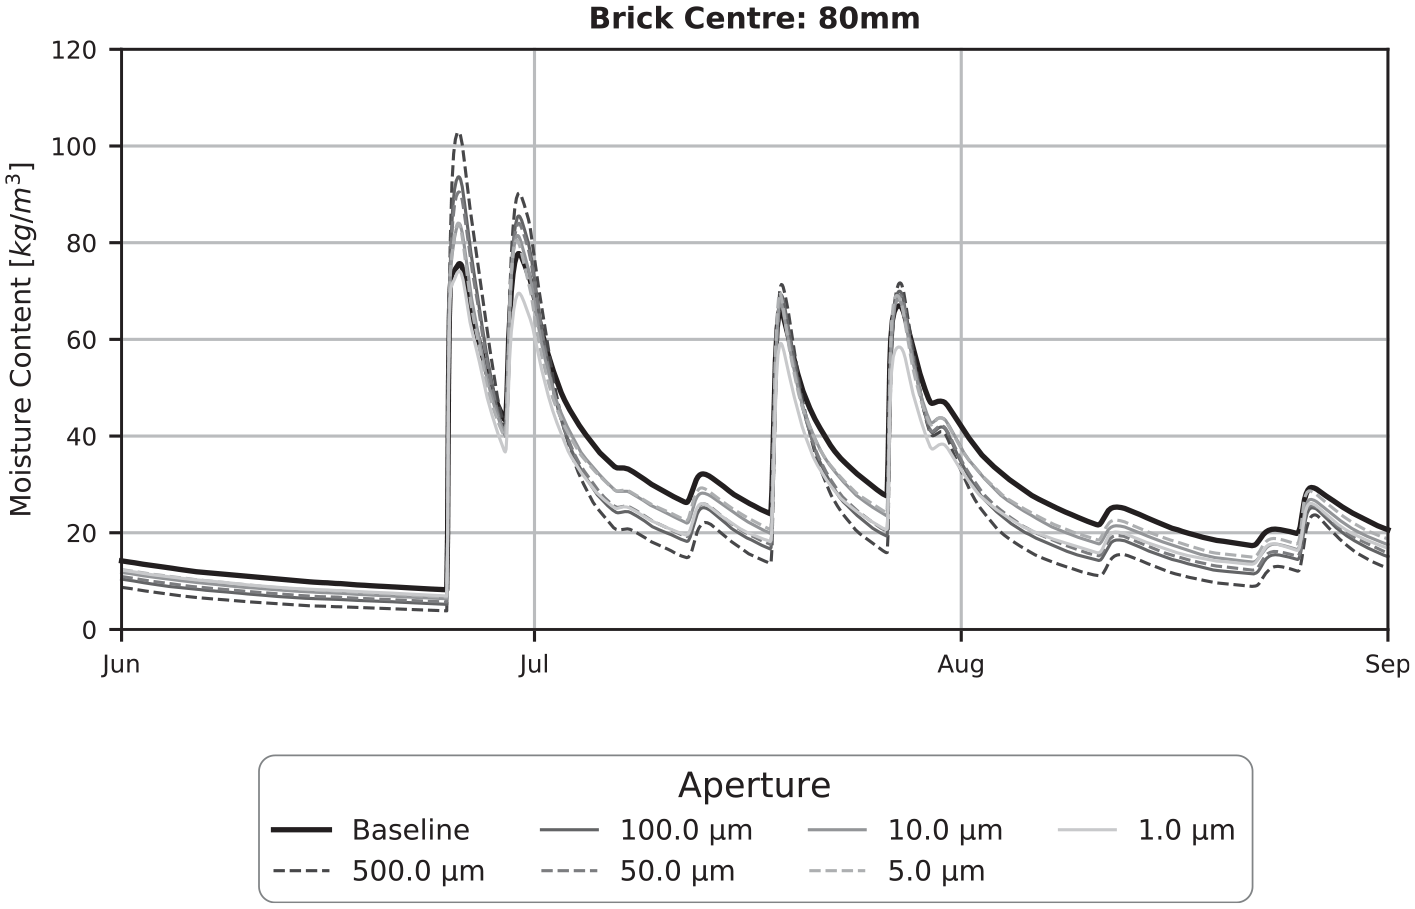
Moisture content for the baseline model and select apertures during the summer months.
Throughout the first wythe of brick, the shape of the curves follows a similar pattern to Figure 11 regardless of material or depth. The results in the second wythe followed a different pattern largely because an interface resistance was placed in between slowing absorption into this region of the wall. Here the moisture content is lower than the outer wythe and the wetting spikes are not as pronounced, but a similar story occurs. There is a decrease in moisture content relative to baseline and the larger the aperture, the lower the moisture content.
It is important to note that the significance of the results shown in Figures 11 and 12 will be dependent on climate and material properties. Even with a relatively high rain exposure and deposition factor, the walls were not able to continuously reach the types of capillary pressures that would allow for the increased absorption rates shown in Model 1 and Model 3 at very low capillary pressures (Figures 5 and 8). The highest intensity rainstorms had short durations (<5 h) and not enough liquid water can be absorbed to fully activate the larger fractures.
Material properties such as the moisture retention curve and liquid conductivity curve can also affect the behaviour under cyclic conditions. If materials with comparatively low pore size distribution (high residual moisture content) are used for either the mortar or unit, the relative difference in MC between the baseline and different sized fractures decreases. This is partly because we begin at higher points in the liquid conductivity curve than a low residual moisture content material and water can be more readily absorbed into the materials and not penetrate as deep into the fracture. Materials with lower liquid conductivities will siphon less liquid water as it travels in the fracture allowing it to fill more and penetrate further along the fracture.
Additional notes
Other geometries and combinations of materials may produce different results than presented here for the clay brick and cement mortar. Some simulations were run for a sandstone – lime mortar combination comprising of larger stones than the bricks. Here the effect in the absorption phase was not as pronounced, especially at the centre of the unit. This is because the fractures have more material to transfer water into and that the bulk materials used were better liquid conductors than the clay brick and cement mortar.
This model has applications other than vertical walls exposed to wind-driven rain. One application is at foundation level where contact with damp soils leading to rising damp. Here the boundary conditions will be similar to the absorption simulations in Models 1–3 and its appropriate to model with a capillary suction pressure. The degree of wetting will be greater and more constant than what was used in Model 5 and there will be reduced time in the drying phase. Here, we may see that moisture contents increase under realistic conditions. Gravity was not considered in this model, but the fracture model could be utilised to estimate direct leaks from above into the assembly. The model would be applicable to other combinations of hygroscopic materials in building envelopes with imperfect contact conditions, not just masonry. It may also be able to be utilised with non-hygroscopic materials such as junctions between flashing and masonry.
Future applications for this work including determining an ‘effective’ liquid absorption coefficient which can account for the degree of decay in a wall and can be plugged into either 2D or 1D hygrothermal models. Determining what the hydraulic aperture should be for an actual masonry wall is another challenge that needs to be addressed. This would be dependent on many things including the techniques and skill of the mason (e.g. do they wet the stone), level of deterioration (good, fair, bad) and types of materials used and specification of the mortar mix. As mentioned, determining what the effects of a possible moisture-dependent interface resistance are is another challenge that needs to be addressed.
The results from this proposed model still require experimental validation. It will be a challenge to create reliable and replicable test specimens with fractures of varying width. Mortar segments can be cast separately from the brick and then spaced a set distance apart, or the fracture can be closed using compression forces. The specimens should be evaluated under both absorption and drying conditions.
Conclusion
The results of the DELPHIN simulations show that modelling imperfections at the masonry unit-mortar interface as fractures can affect simulation results when compared to the baseline model which only used bulk material properties. Simulations were performed for a clay brick/cement mortar assembly with an explicitly modelled fracture interface. Hygrothermal properties for the bulk materials and fracture were built from fundamental principles. Five sets of simulations were performed which assessed the effect of the various sized apertures under absorption, drying and cyclic boundary conditions.
The simulation results showed that the inclusion of a fracture models had a significant impact. The rate of absorption increased, but this was countered with an increased rate of drying. Under cyclic conditions the drying effect of the fracture outweighed the increased absorption during wetting events. This led to the wall being drier than the baseline model over the long-term.
Footnotes
Declaration of conflicting interests
The author(s) declared no potential conflicts of interest with respect to the research, authorship, and/or publication of this article.
Funding
The author(s) received no financial support for the research, authorship, and/or publication of this article.