
Abstract
Background and Aims:
This study investigated the depth-related bias and the influence of scan plane angle on performance of point-shear-wave elastometry in a chronic hepatitis C patient cohort.
Materials and Methods:
We included 104 patients affected by chronic liver disease related to the hepatitis C virus. Liver surface nodularity was the reference to diagnose cirrhosis. The ultrasound platform was the Siemens S2000, equipped with point-shear-wave elastometry software. Measurements were obtained in left lateral decubitus from the liver surface to the maximum depth of 8 cm in two orthogonal scan planes according to a standard sampling plane. Scatterplot and box plots explored the depth-related bias graphically. The area under the receiver operating characteristic was used to determine the point-shear-wave elastometry diagnostic performance at progressive depths according to liver surface nodularity.
Results:
Of the 104 patients, 68 were cirrhotics. Depth-related bias equally modified point-shear-wave elastometry in the two orthogonal scan planes. A better point-shear-wave elastometry diagnostic performance was observed between depths of 4 and 5 cm. The frontal scan plane assured better discrimination between cirrhotic patients and non-cirrhotic patients.
Conclusion:
Depth is crucial for point-shear-wave elastometry performance. Excellent diagnostic performance at a depth between 4 and 5 cm can also be obtained with a smaller number of measurements than previously recommended.
Introduction
Chronic liver diseases (CLDs) represent a significant health problem worldwide since they are related to progressive liver damage, end-stage cirrhosis and tumours. 1 Although histological evaluation remains the reference standard for the diagnosis and staging of CLD, 2 liver biopsy has several limitations that do not allow for its widespread use or its repetition along the course of the disease. 2
Several noninvasive methods have been proposed to avoid biopsy, such as serological or imaging-based tests. 2 In the field of imaging, liver surface nodularity (LSN) represents one of the most specific signs for the diagnosis of cirrhosis,3,4 but recognizing LSN requires operator experience and quality ultrasound devices, and it is a useful tool only for the macronodular form of cirrhosis.
In recent years, a radical change in the clinical approach to CLD has occurred with the application of quantitative elastometry in ultrasound examination. 2 Ultrasound devices with elastometric software applied (USED) track and measure the velocity of the shear waves (SWVs) resulting from an applied force. 5 Since SWVs are related to stiffness, which is mainly related to fibrosis, elastometric ultrasound systems can act as surrogates for liver biopsy to measure fibrosis in CLD and recognize minimal/mild liver disease, advanced liver disease, or cirrhosis.2,6,7
USEDs have rapidly changed the clinical scenario of noninvasive evaluation of liver damage because they are broadly diffused, the examination is inexpensive and rapid, and USEDs provide a digital numeric output independent of the operator that is risk free and repeatable without limits.
Over the past 20 years, several successive USEDs have been produced: one-dimensional (1D) and two-dimensional (2D) elastometry. The most widespread and evaluated pioneering technologies are 1D elastometers, in particular FibroScan by Echosens and point shear-wave elastometry (pSWE), developed by Siemens and called Virtual-Touch-quantitative.6,8 In contrast to FibroScan, pSWE is a simple software; it can run on a traditional sonographic platform and offers the opportunity to choose with precision the sampling depth in a mesoscopic region of interest (ROI) measuring 1 × 0.5 cm that is moveable ad libitum until 8 cm.5,8 pSWE software for each position of the ROI chosen, showing the distance from the transducer in millimetres, allows the operator to precisely control the depth variable. Guidelines adopted by several countries state that pSWE or FibroScan is sufficient for staging viral hepatitis and regulating access to new antiviral therapies.2,6
However, despite these favourable characteristics, SWV measurements are affected by some bias and technical limitations that hamper reproducibility. 9
Due to these unclarified sources of errors, it is possible to observe an overlap in liver stiffness measurements, mostly between adjacent intermediate stages of hepatic fibrosis. One of the most critical causes of bias is the distance between the ultrasound probe and the site of sampling, called the depth-related bias (DPB).9,10
DPB regarding USED diagnostic performance has been explored in homogeneous phantoms or in healthy subjects, but there has been a lack of an adequate number of translational studies of the detrimental effect of DPB on SWV diagnostic performance in the real world of subjects affected by CLD.
The European Federation Societies of Ultrasound in Medicine and Biology (EFSUMB) Guidelines and Recommendations on the Clinical Use of Liver Ultrasound Elastography recommend optimal measurement quality of pSWE with the ROI placed a minimum of 1–2 cm and a maximum of 6 cm beneath the liver capsule. 6 Instead, Ferraioli et al. 11 in 2018 updated the World Federation For Ultrasound In Medicine and Biology (WFSUMB) guidelines and recommendations to recommend the optimal location of ROIs at 4 or 4.5 cm from the transducer. It is also not clear how much the force of gravity (FG) interferes with DPB since it is not ascertained but is not excluded by phantom tests. 10
To resolve this issue, this study aimed to evaluate the diagnostic performances of different progressive depth pSWE sampling in patients with chronic hepatitis C in comparison with LSN. We also explored whether orthogonal scan plane with respect to the ultrasound table plane, that is, FG, could influence the diagnostic performance.
Methods
Study population
One hundred four consecutive outpatients affected by HCV-related CLD followed in two liver centres (Gastroenterology Unit of General Hospital and Infectious Diseases University Department) were enrolled. The mean age was 62.5 years old, 58 patients were men, and 68 patients had a diagnosis of cirrhosis (65.4%) (Table 1). Data from the patients were inserted into the regional network Rete Sicilia Selezione Terapia HCV (RESIST), which is acknowledged by the Regional Health Authority for registering all patients with chronic HCV infections assessed for direct-acting antiviral agent treatment.
Demographic and clinical features of patients with chronic hepatitis C enrolled in the study.
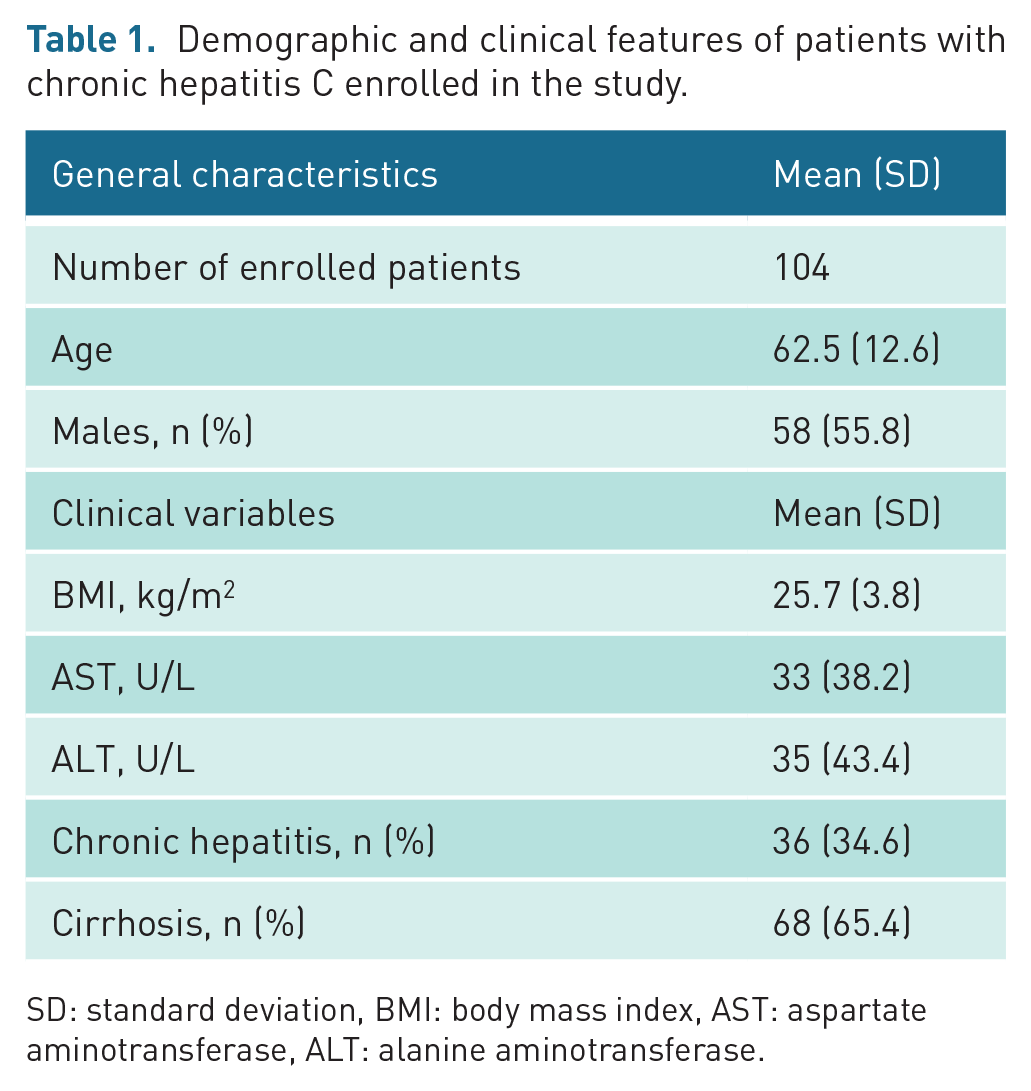
SD: standard deviation, BMI: body mass index, AST: aspartate aminotransferase, ALT: alanine aminotransferase.
For each patient, an ultrasound examination with pSWE was offered. The ultrasound examination was performed by a single skilled operator.
The study was approved by the ethical committee and met the ethical principles of the Declaration of Helsinki. The patients adhered to the study and signed informed consent forms. Respect of individual privacy and clinical data was guaranteed.
Ultrasound equipment and operator
The ultrasound examination was performed with an S2000 echographic platform (Siemens, Erlangen, Germany) implemented with pSWE technology and equipped with a 4C1 probe.
The ultrasound examination was performed by a single operator with more than 30 years of ultrasound experience and more than a decade of experience with pSWE in a standardized three-step procedure.
The sonographic procedure
Each exam was carried out in fasting status and following the below steps.
First step
The operator started by identifying a description of several anatomic landmarks and captured their images, saving them in the standard Digital Imaging and COmmunications in Medicine (DICOM) format on a dedicated server. To establish LSN, three images of the liver surface were needed for each patient. LSN images were saved on a DICOM server.
Second step
The elastosonographic procedure was performed entirely with the patient in LLD, always with the axis of the probe perpendicular to the skin plane, as recommended by EFSUMB and WFSUMB.6,11 The operator chose two different sites in the intercostal spaces for elastometric sampling (Figure 2, as displayed in Results). The first, on the frontal plane, anatomically corresponded to hepatic segment 7, and it was perpendicular to the ultrasound table surface; on this plane, progressive depth pSWE sampling could be exposed to FG influence. The second, on the sagittal plane and at approximately 90° with respect to the other, anatomically corresponded to hepatic segments 7 or 8 according to the individual thoracic shape, and it was almost parallel to the ultrasound table surface; on this plane, progressive depth pSWE sampling could be less influenced by FG. The ROI axis was positioned in the median position with respect to the scan plane. Then, the operator followed the sampling steps (Table 2). The depth was measured in centimetres and indicates the distance between the probe and the ROI. The patients were instructed to maintain a regular breathing pattern, and each pSWE measurement was obtained during the pause between inspiration and expiration. The ultrasound images captured the pSWE measurements of all of the participants and were saved on the DICOM server.
Sampling steps stratified by scan plane and depth.
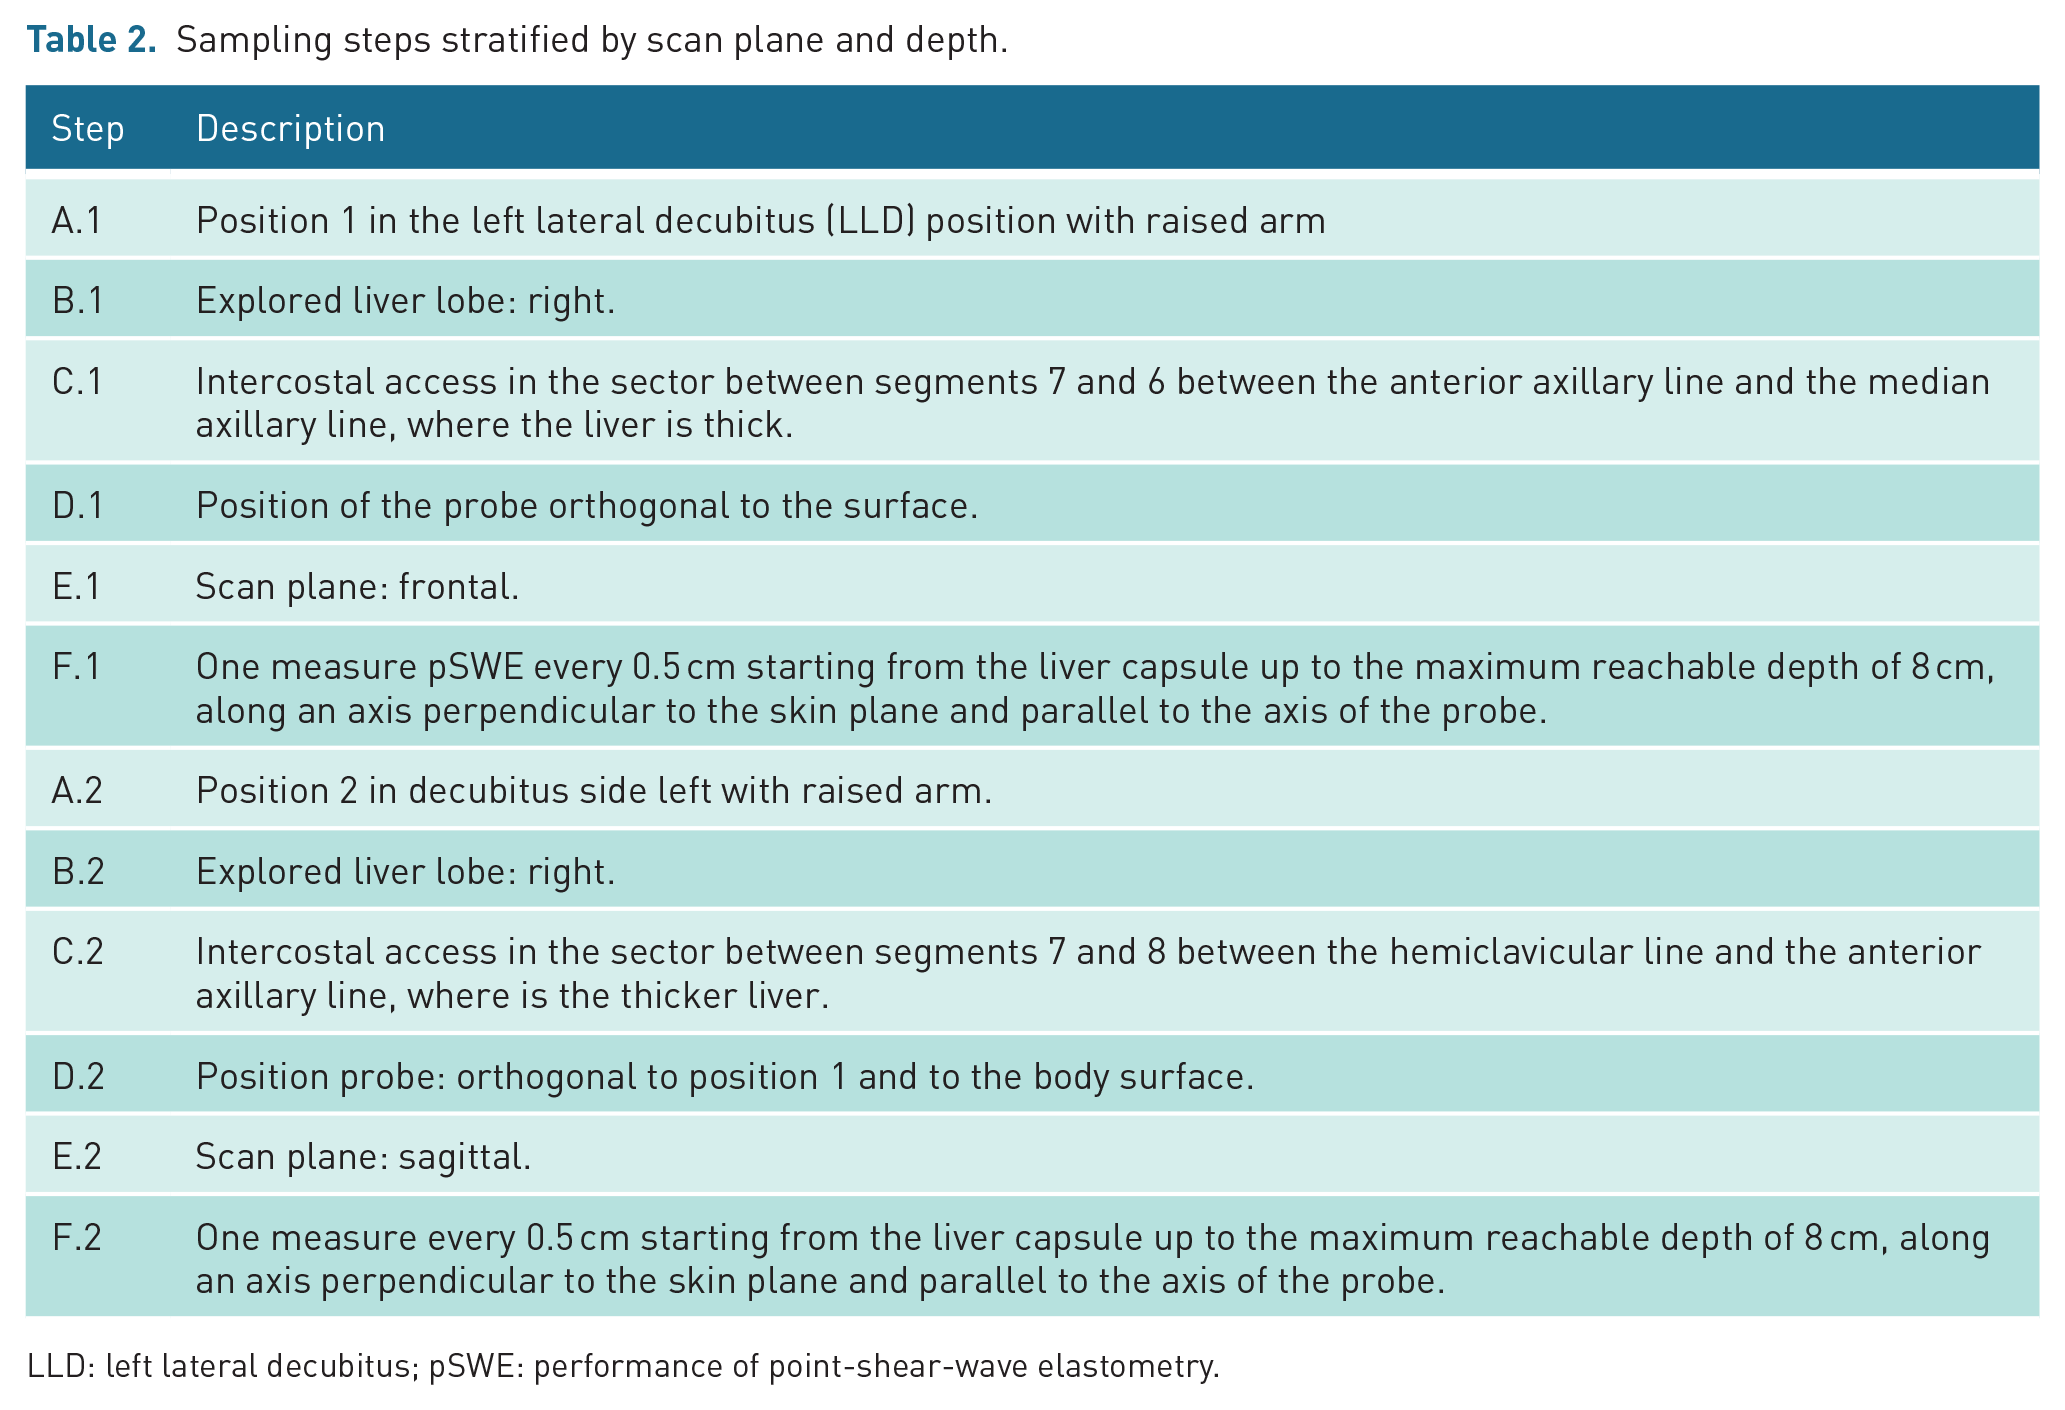
LLD: left lateral decubitus; pSWE: performance of point-shear-wave elastometry.
Third step
After the conclusion of the time of collection of the ultrasound data of all patients, the data were classified in the two subpopulations for comparison. The statistician was blinded to the clinical data. The pSWE measurements were interpreted according to previously published cut-off values. 19 In particular, to evaluate the estimated performance of SWV to diagnose cirrhosis, a cut-off value of 2 m/s was assumed according to our previous work established with respect to liver biopsy. 19 Finally, blinded pSWE and the clinical data and images of the liver surface were received by the expert ultrasound operator, who classified them as positive or negative for LSN.
Statistical analysis
Statistical analyses were performed using the R computing environment (R Development Core, Rstudio, Open Source). Characteristics of the study population are expressed using the mean and standard deviation (SD) or the percentage for categorical variables. Outcomes (shear wave velocity) between the two groups are expressed using medians and plotted using boxplots, the area under the receiver operating characteristic curve (AUROC) and scatterplots.
The relationship between the outcome and depth was examined using a generalized linear mixed model. A p value less than 0.05 was considered statistically significant.
Results
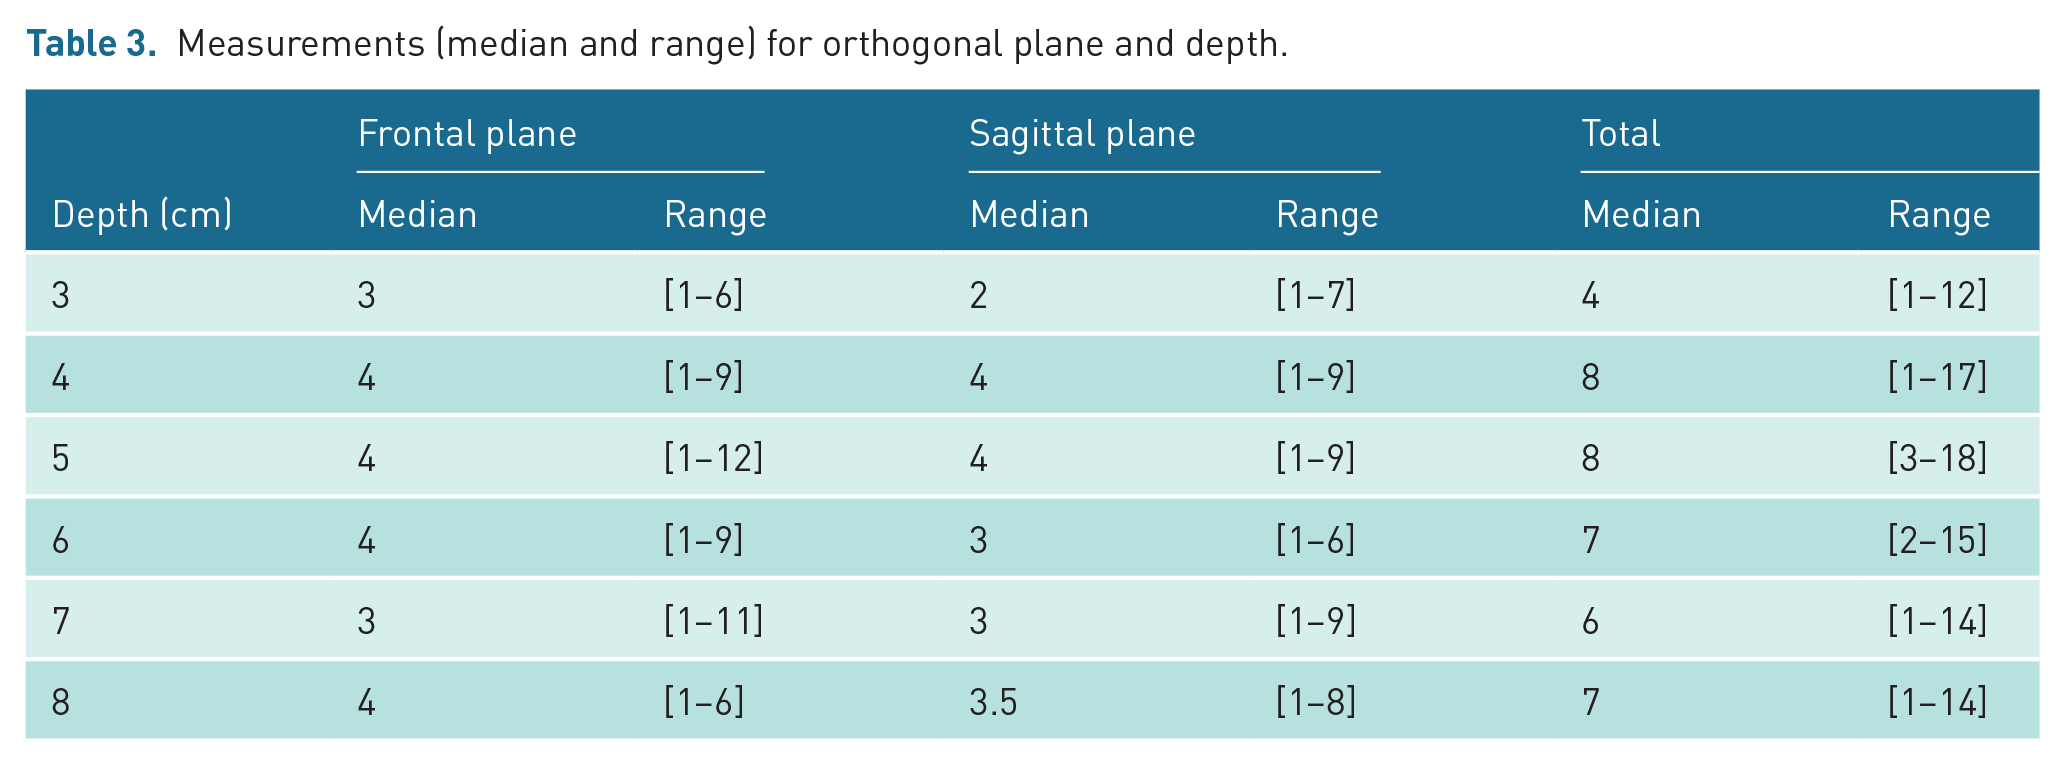
Tables 3 and 4 report the measurements conducted in 104 patients according to the sampling design mentioned below. The median number of measurements per patient was 40, ranging from 12 to 76, while the median numbers of measurements centred at depths of 3, 4, 5, 6, 7, and 8 cm were 4, 8, 8, 7, 6, and 7, respectively. The numbers of measurements for each depth were different due to the different thicknesses of the chest wall in the different patients. The difference between the two planes was negligible.
Measurements (median and range) for orthogonal plane and depth.
Means and ranges (in brackets) of the shear waves measurements (m/s) by orthogonal plane, depth and disease.
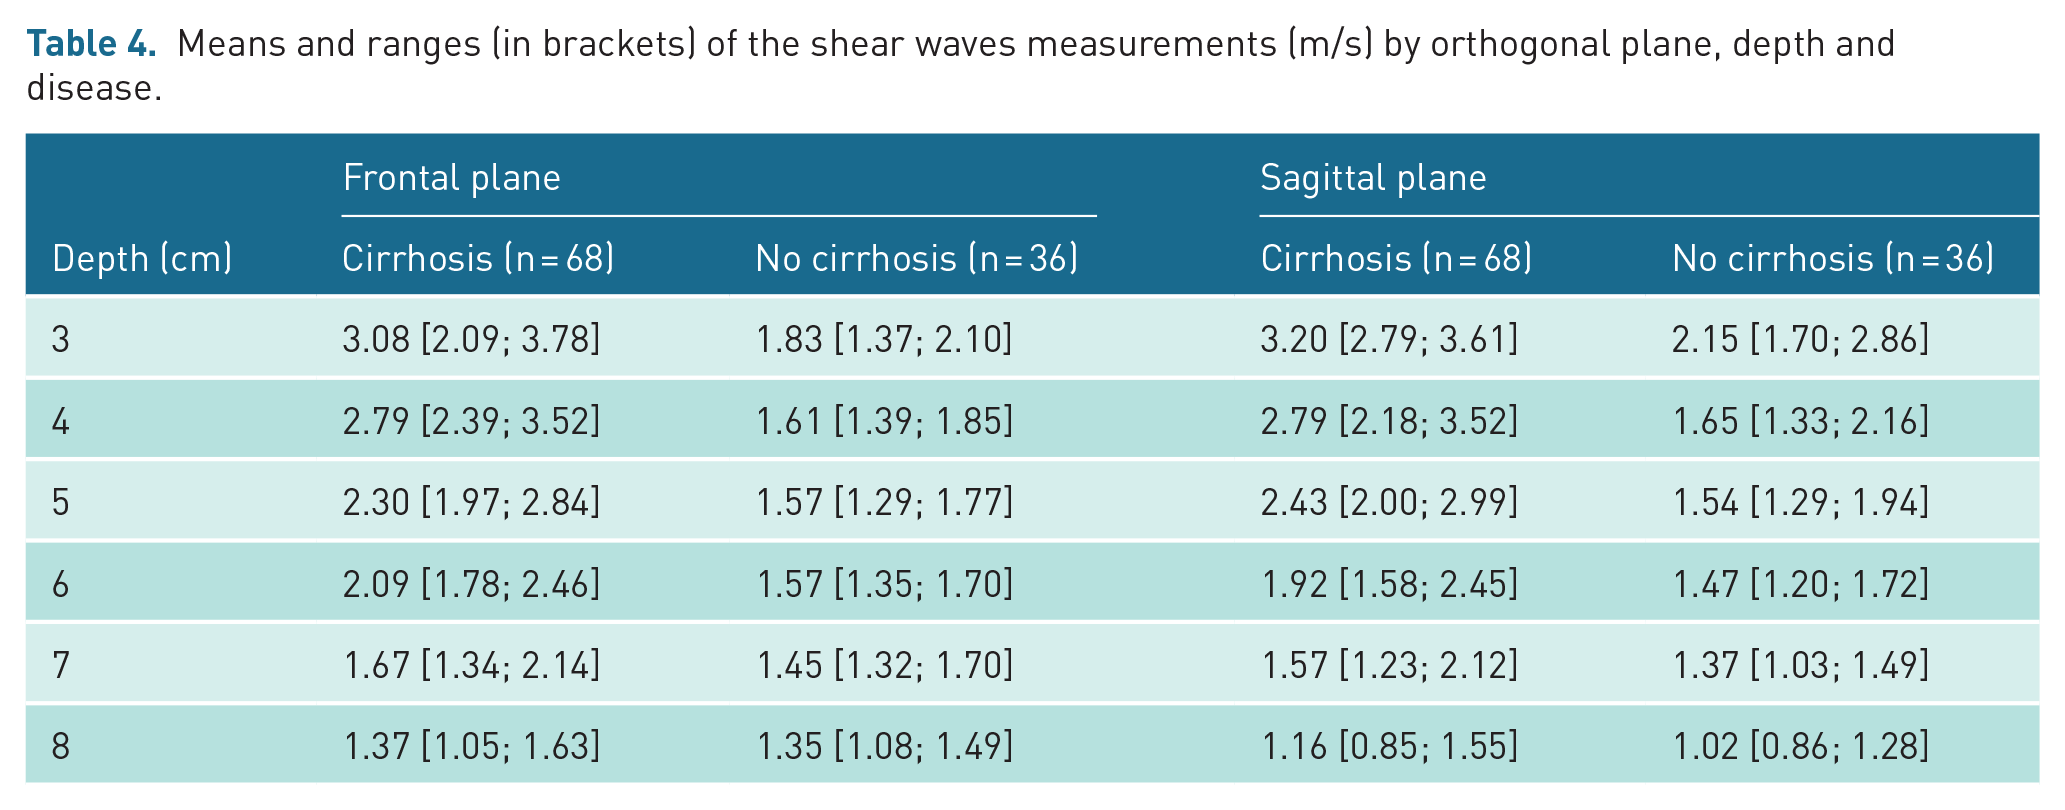
Figure 1 shows the box plots of liver stiffness at different depths for the cirrhotic group and the non-cirrhotic group.
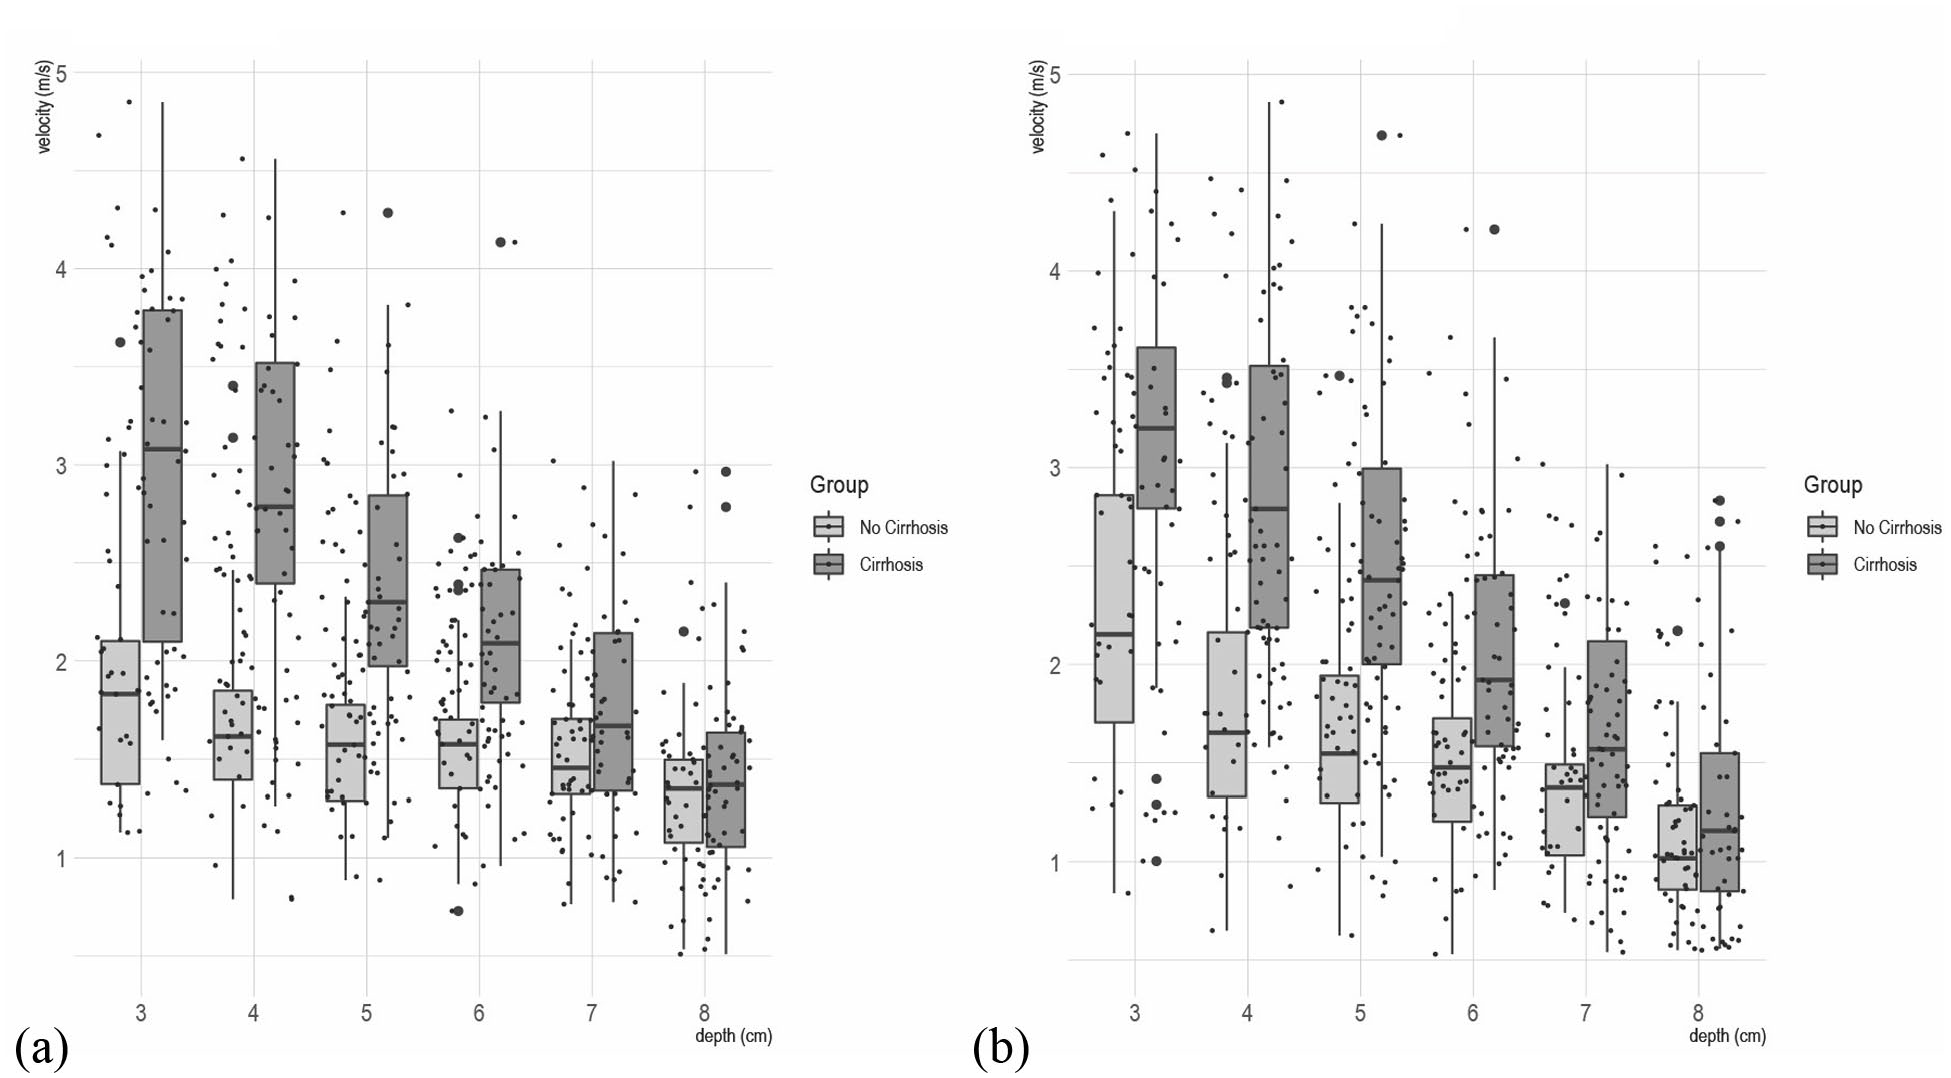
Point-shear-wave elastometry [pSWE] measurements for the cirrhotic group and the non-cirrhotic group at different depths in frontal [left] and sagittal plane [right]. Dashed black lines are the slopes over the cirrhotic group and the non-cirrhotic group: [a] frontal plane and [b] sagittal plane.
The measurements were centred at 3 (in the interval of 2.5 cm to 3.5 cm), 4 (interval 3.5 cm to 4.5 cm), and so forth until 8 cm (interval 7.5 cm to 8.5 cm).
Assuming the interquartile range as a rough measurement of variability, both planes discriminated well between cirrhotics and non-cirrhotics. However, the frontal plane seemed to discriminate better than the sagittal plane, which depicted fewer distinctions between the two groups.
As shown in Figure 1, the ‘best’ discriminating depth was between 4 and 5 cm on the frontal plane. In contrast, measurements at further depths showed some overlap; in other words, reliability decreases as depth increases, as expected. 10
Furthermore, Figure 2 shows that, in the non-cirrhotic group, the measurements did not change much as depth increased, while in the cirrhotic group, SWV decreased steadily from 3 to 8 cm with a significant difference in slope (p < 0.001) for each orthogonal plane.
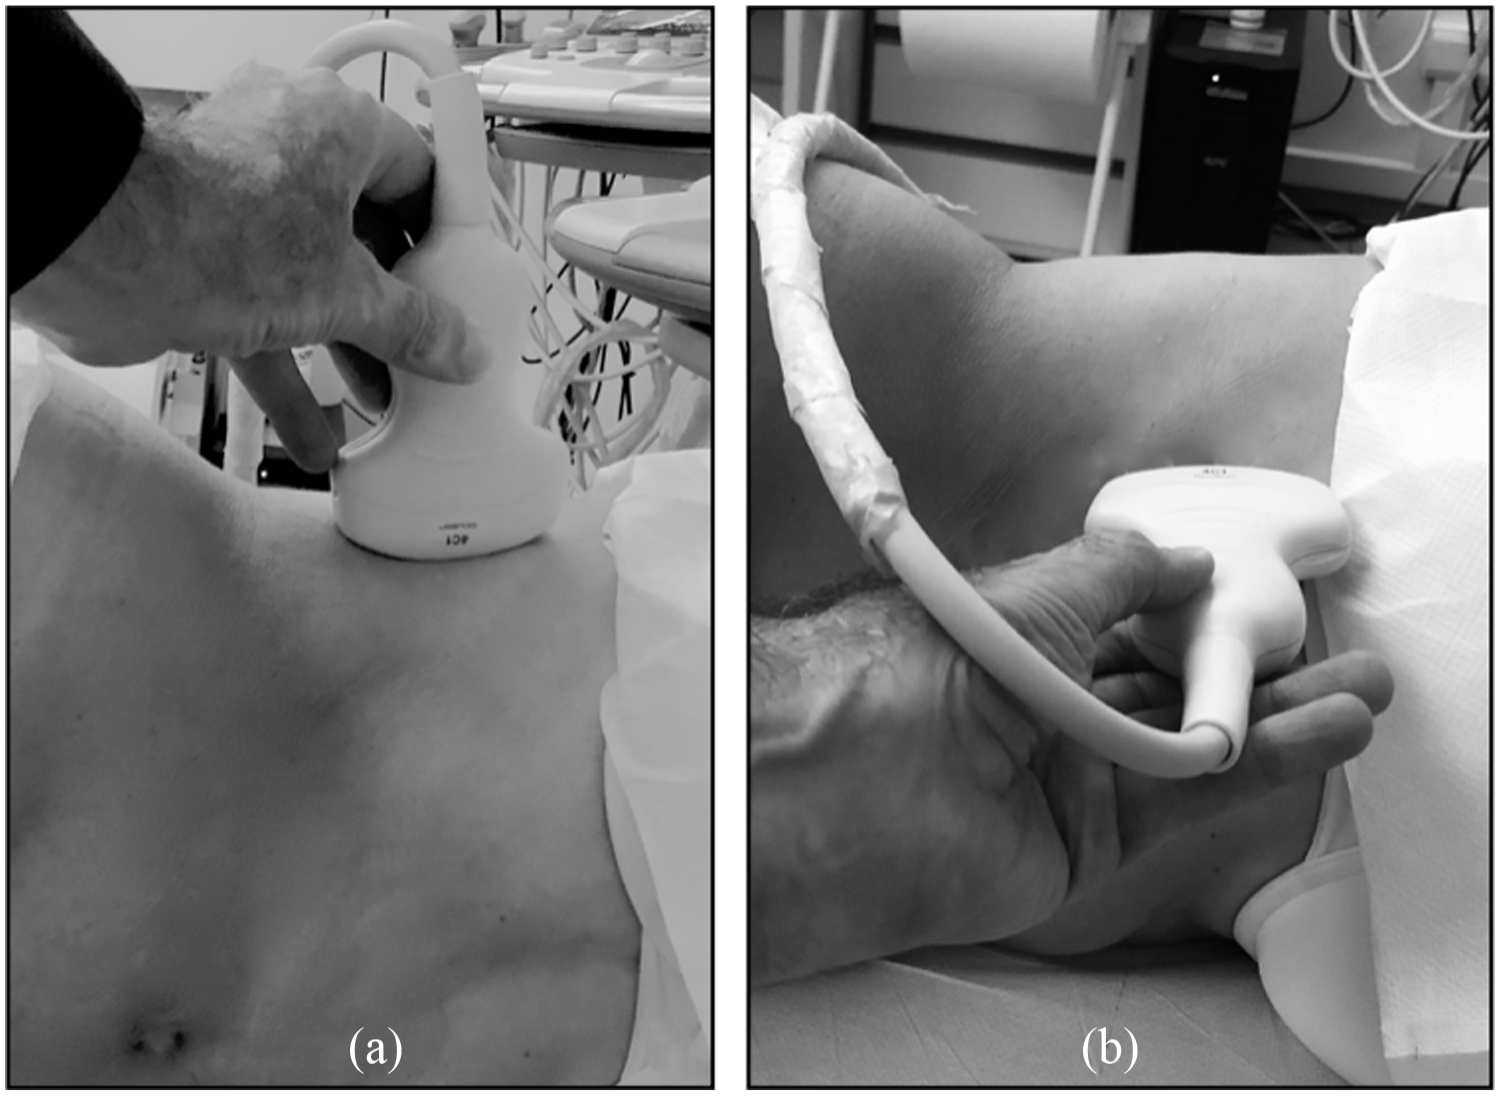
(a) scan in the frontal plane [patient in the left lateral decubitus]; (b) scan in the sagittal plane [patient in invariant left lateral decubitus].
To obtain further evidence on the ‘best’ depth and to discriminate between cirrhotic patients and non-cirrhotic patients, we constructed area under the receiver operating characteristic (AUROC) for the two planes (Figure 3). The analysis strongly confirmed that a depth of 4–5 cm had the best discriminatory power on both planes, with a slight difference in favour of the frontal plane (AUROC 0.89 and 0.88 for depths of 4 and 5 cm, respectively).
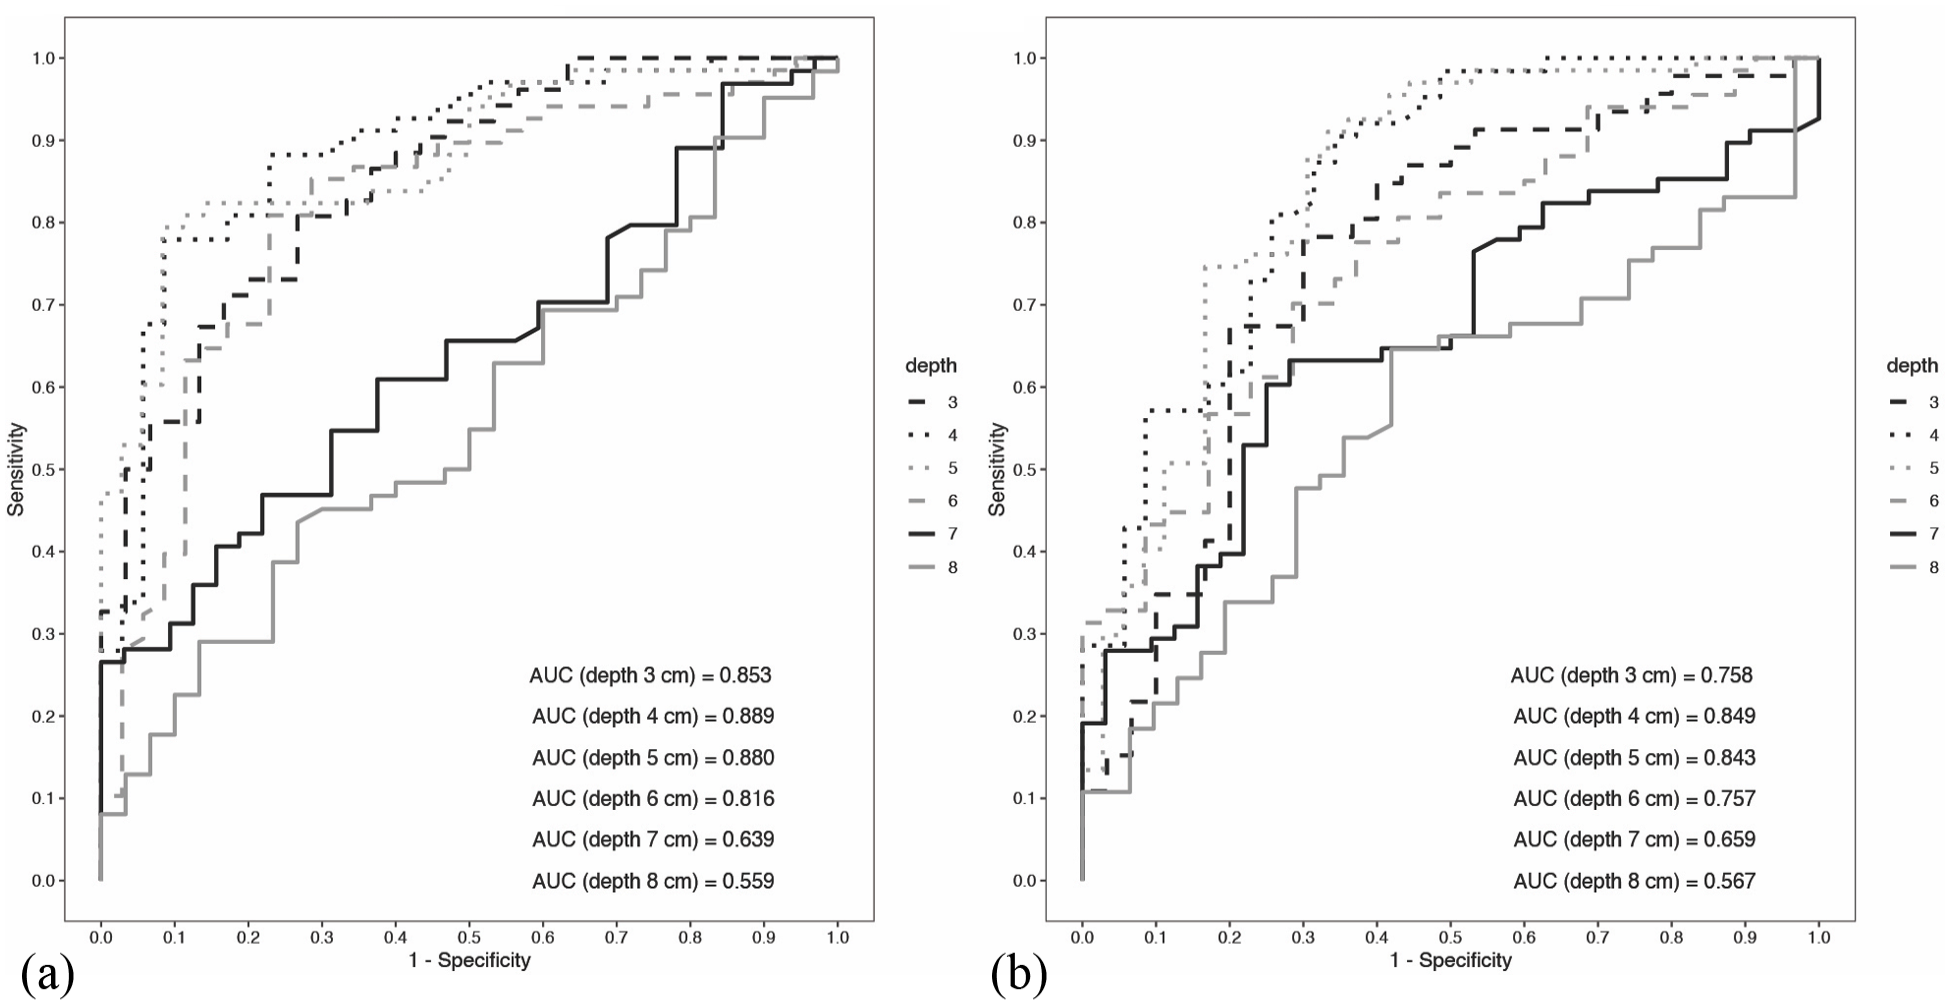
ROC curves for frontal and sagittal planes at different depths. AUROC values reported inside the figures at different depths: [a] ROC curves for coronal plane and [b] ROC curves for sagittal plane.
Discussion
By adopting two predetermined orthogonal scan planes, we explored both the DPB and the in vivo FG effect on the liver as potential causes of bias on pSWE and attempted to determine on which of the two planes pSWE achieves better performance in discriminating between cirrhotic and non-cirrhotic in comparison with LSN, which has shown high reliability in this specific set.3,4
Our in vivo study demonstrated that liver stiffness sampling at between 4 and 5 cm in depth achieved a better AUROC to distinguish cirrhosis from milder fibrosis stages, with slightly on the frontal plane, where the greatest interference was expected, did not exert other detrimental DPB effects with respect to the other scan plane. We hypothesize that gravitational traction on hepatic suspensory ligaments, although not capable of modifying the DPB, determines the difference in performance between the two scan planes. These data show that the main interference on the SWV estimate is exerted by DPB, concordant with several previous studies.
Chang et al. 12 and Yamanaka et al. 13 using the same device and probe as our study, showed better results at 5 cm and between 4 and 5.5 cm in depth on homogeneous phantom and phantom targets, respectively.
Ferraioli et al. 14 conducted an agreement study among SWV estimations with 6 different USEDs, both 1D and 2D, in 21 individuals affected by CLD and 5 healthy volunteers, fixing the topographic landmark and depth at 4 cm and obtaining very good agreement among SWV estimations.
Our data show that DPB is relevant to the estimated SWV, regardless of scan planes. These results agree with those of tests in 2013 developed by the Technical Ultrasound Modality Committee. 10
In these tests, the committee demonstrated in homogeneous isotropic phantoms that there was a statistically significant difference in DPB with all imaging systems, with differences in SWV estimated according to the devices tested.
In addition, in phantoms with high deep stiffness targets, Shin et al. 15 tested various commercial USEDs equipped with pSWE and 2D-SWE, demonstrating that the shear wave measurements at various depths showed a marked reduction compared to the real value regardless of the USED manufacturer.
Other authors with the same pSWE and the probe of our study have reported similar findings in healthy volunteers,16,17 demonstrating the relevance of DPB.
Our study was performed in more than 100 CLD patients. It was conducted on the largest sample among those published and explored the effect of DPB on CLD. In subjects with a ‘cirrhotic profile’ characterized by SWV ⩾ 2 m/s, the DPB was more marked and progressive than in subjects with a ‘non-cirrhotic profile’, who were characterized by SWV < 2 m/s, the DPB being less marked and pSWE reliability also being achieved at up to 6 cm in depth.
Our study demonstrated that heterogeneity was greater in ‘cirrhotic’ livers than in ‘non-cirrhotic’ livers. However, at depths of 7 and 8 cm, the heterogeneity was smaller on both the planes and in both groups. Moreover, at these depths, the mean stiffness values of the two groups overlapped, implying a strong reduction in the discrimination capacity between chronic hepatitis and cirrhosis. In our study, the greater heterogeneity was found at the capsular level on the frontal plane in the cirrhotic patients and on the sagittal plane in the normal group, producing overlapping box plots (Figure 1). This result suggests that both position and capsular fibrosis can influence stiffness.
WFUMB guidelines refer to these phenomena close to the liver capsule. 18 In addition, other authors, such as Chang et al. 12 and Zhao et al., 17 analysing S2000 elastometric devices on phantoms, have shown elevated SWV and heterogeneity of results at depths near the probe. They reported that the cause of this phenomenon had to be ascribed to the technology and the compression on the viscoelastic phantom.
At depths with better diagnostic performance, we also observed a certain degree of variance in cirrhotic patients, but it was present without overlapping on the non-cirrhotic box plot; thus, we hypothesized that this variance could be expressive of expected individual differences in cirrhosis. As already demonstrated in a previous study, 19 the variability within cirrhotic patients was greater than that within non-cirrhotic patients.
In other words, we hypothesized that cirrhotic patients, all classified as A5 according to Child–Pugh classification, likely had more accurate stratification of liver fibrosis progression by pSWE when cleared of DPB. It is noteworthy that, at between 4 and 5 cm, we obtained an excellent AUROC value with only four measurements on the frontal plane. This outcome was possible due to the low SD established in a previous statistical analysis published by Attanasio et al. 20
We preferred the 1D pSWE to 2D elastometry to explore DPB, as it allows optimal control of depth of the ROI.
We adopted the pSWE shared by Siemens because each measurement fitting the ROI is validated by the system, according to Palmeri et al. 5
Furthermore, this technique used the probe that is most frequently applied in abdominal studies and the most tested in phantom tests conducted on DPB.
We adopted systematic sampling according to that used in phantoms to elicit and analyse the DPB. The standardization of topographic and anatomical landmarks (Table 2) contributed to the reliability of the procedure. We assumed LSN as the reference standard for the diagnosis of cirrhosis 21 because biopsy is not routinely proposed in liver diseases in our country to access DAA therapy according to the guidelines of the National Health Care system.
Our study has some limitations. To evaluate LSN, an expert operator of ultrasound devices is needed. This limitation is responsible for different results in specificity that have ranged from 59% to 95%, with the lowest specificity obtained in retrospective studies with different operators and devices 22 and the highest in a large, prospective study with a single operator. 21 However, as already stated, the radiological community recognizes LSN as one of the most characteristic imaging signs of cirrhosis.3,4
Further studies to test DPB on other probes and on other echographic platforms will be needed. Software to automatically recognize LSN could ameliorate the differences in reliability with different operators, as already proposed. 23
Conclusion
Our study analysed the effects of DPB on the assessment of liver stiffness and its agreement with liver fibrosis in patients with CLD.
pSWE sampling at between 4 and 5 cm showed a better AUROC for distinguishing cirrhosis from other fibrosis stages in hepatitis C virus (HCV)-related CLD, confirming the results of several other studies performed in phantoms and normal subjects. The major variance at this level observed in cirrhotic patients could represent the individual differences in cirrhotic liver damage. The best performance was obtained via the frontal scan in patients in the left lateral decubitus (LLD) position, and the number of measurements necessary to achieve good diagnostic performance was small, confirming the simplicity of the procedure.
Footnotes
Acknowledgements
There are no sources of funding to disclose. All authors had full access to all of the data (including statistical reports and tables) in the study and can take responsibility for the integrity of the data and the accuracy of the data analysis.
Contributors
The corresponding author attests that all the listed authors meet authorship criteria and that no others meeting the criteria have been omitted.
L.R. designed the study, performed the sonographic examens and wrote the manuscript; L.L. coded the methods and performed the statistical analysis; M.A. contributed to the statistical analysis and to write the manuscript; A.M., S.M., L.L.R. selected patients for the study; V.C. revised the manuscript. The authors had full access to all the data (including statistical reports and tables) in the study and can take responsibility for the integrity of the data and the accuracy of the data analysis.
Data availability
The data sets generated during and/or analysed during the current study are available from the corresponding author on reasonable request.
Declaration of Conflicting Interests
The author(s) declared no potential conflicts of interest with respect to the research, authorship, and/or publication of this article.
Funding
The author(s) received no financial support for the research, authorship, and/or publication of this article.
Ethics approval
Not required.
Permission from patient(s) or subject(s) obtained in writing for publishing their case report
No case report.
Permission obtained in writing from patient or any person whose photo is included for publishing their photographs and images
No, because we used only anonymized and de-identified ultrasound images.
Confirm that you are aware that permission from a previous publisher for reproducing any previously published material will be required should your article be accepted for publication and that you will be responsible for obtaining that permission
No previous published.
Guarantor
LR is the guarantor for this study.