
Abstract
Introduction
Assessment of tendon stiffness in vivo traditionally involves maximal muscle contractions, which can be challenging in pain populations. Alternative methods are suggested, although the clinimetric properties are sparse. This study investigated the concurrent validity and the intrarater reliability of two ultrasound-based methods for assessing patellar tendon stiffness.
Methods
Patellar tendon stiffness was assessed in 17 healthy adults with (a) the dynamometer and B-mode ultrasonography method (DBUS) and (b) the strain elastography method. Correlations between the two methods were analysed using Kendall’s Tau-b. The relative reliability of both methods was evaluated using intraclass correlation coefficient (ICC). The absolute reliability was presented by Bland–Altman plots, standard error of measurement (SEM) and minimum detectable change (MDC).
Results
No correlation was found between the two methods, irrespective of reference tissue in strain elastography (Kendall’s Tau-b Hoffa = –0.01 (p = 1.00), Kendall’s Tau-b subcutis = 0.04 (p = 0.87)). Tracking of the tendon elongation in the DBUS method had good to excellent relative reliability (ICC = 0.95 (95% confidence interval – CI: 0.85–0.98)) and high absolute reliability (SEM = 0.04 mm (1%), MDC = 0.11 mm (3%)). The strain elastography method had good to excellent relative reliability, regardless of reference tissue (ICC Hoffa = 0.95 (95% CI: 0.86–0.98), ICC subcutis = 0.94 (95% CI: 0.82–0.98)), but low absolute reliability (SEM Hoffa = 0.06 (20%), MDC Hoffa = 0.18 (60%), SEM subcutis = 0.12 (41%), MDC subcutis = 0.32 (110%)).
Conclusions
No concurrent validity existed for DBUS and strain elastography, suggesting that the two methods measure different tendon properties. The overall reliability for the DBUS method was high, but the absolute reliability was low for strain elastography stiffness ratios. Therefore, the strain elastography method may not be recommended for tracking differences in patellar tendon stiffness in healthy adults.
Introduction
The ability of tendons to transmit forces, store and release energy, and to function as biological springs and/or dampers are essential to human locomotion.1,2 The mechanical properties of tendons are dynamic, and tendon stiffness may change in response to daily activity, exercise and loading. 2 Recent studies have shown that tendon stiffness is reduced with ageing and inactivity,3,4 and increased with resistance training.5,6 Mechanical properties of tendons play a role for function of the muscle–tendon unit, and optimal stiffness is considered relevant for performance and hypothetically also to reduce injury risk.2,7 The ability to evaluate mechanical properties of the tendon, such as structural stiffness, is therefore important in relation to clinical rehabilitation and likely also in performance settings.
Assessment of tendon stiffness in vivo in humans requires sophisticated equipment and specialized knowledge.2,8 Different direct and indirect methods using acoustoelastic strain gauges 9 or measurement of electromechanical delay10,11 have been applied. However, assessment of tendon stiffness based on corresponding values of tendon force (measured by force dynamometer) and tendon deformation (measured by use of B-mode ultrasonography) is considered best practice, and has shown to be valid and reliable.2,8,12,13 Nonetheless, certain limitations to the method do exist. 8 In particular, the assessment of tendon stiffness by use of dynamometer and B-mode ultrasonography recordings (DBUS) can be somewhat challenging, as participants are required to perform a ramped maximal voluntary contraction (MVC).
Recently strain elastography (SEL) has been applied to assess tendon stiffness in the patellar tendon14–19 and the supraspinatus tendon.20,21 SEL measures the amount of tissue strain in specific regions of interest (ROIs) after application of an external compression and is often related in relative terms to stiffness of the surrounding tissues.22,23 In this way, SEL can provide information of the relative stiffness between different types of tissues.22,23 During measurements with SEL, the participant remains passive, which can be an advantage for injured or fragile populations. Two recent studies focused on intra- and interrater reliability for SEL applied to the patellar tendon and concluded that tendon site, operator experience and US system influence the reproducibility.18,19 However, this method is still in its infancy and requires further validation. When applying SEL, use of a reference stiffness of an adjacent tissue is recommended. An adjacent tissue to the patellar tendon could be Hoffa’s fat pad15,16 or subcutaneous fat,14,17 but whether one type of tissue is superior to another in terms of reliability is unknown.
The aim of this study was two-fold: (1) to investigate the concurrent validity of the DBUS and the SEL method for assessing patellar tendon stiffness in a healthy, adult population and (2) to evaluate the intrarater reliability of both methods.
Materials and methods
Participants
A random sample was recruited among staff and students via flyers and social media at two higher educational institutions in Denmark. Heterogeneity of the sample, with regard to age, sex and daily activity level, was intended in order to ensure variation in tendon stiffness measures. Inclusion criteria were adults aged 18–75 years. Exclusion criteria were general and known rheumatic or neurological diseases, diagnosed patellar tendinopathy, a body height exceeding 190 cm (due to length of ultrasound transducer), pregnancy, childbirth or knee surgery within the past year, and inability to speak and understand Danish. The experimental protocol was approved by The Regional Scientific Ethics Committee for Southern Denmark (jnr. S-20170052 HJD/csf), reported to the Danish Data Protection Agency and written informed consent was obtained from all participants.
Procedures
On the same day, the patellar tendon stiffness of the participants was assessed using two methods: (1) the DBUS method8,12,24 and (2) the SEL method with both Hoffa’s fat pad15,16 and the subcutaneous fat14,17 as reference tissues.
Upon arrival, the participants’ height and weight were recorded. The femur length was measured as the distance between the superior part of the greater trochanter and the lateral condyle of the femur in a standing position. After a standardized warm-up protocol, consisting of five minutes of ergometer cycling at 100 W to 120 W, the participants’ patellar tendon stiffness was assessed; firstly, from DBUS recordings, and immediately after from SEL. The procedures lasted 30–40 minutes in total.
Dynamometer and B-mode ultrasonography recordings
Participants were placed and strapped into a rigid custom-built chair with the hip and knee joint positioned in 90° flexion. A strain gauge was mounted perpendicular to the dominant lower leg, 3.5 cm proximal to the lateral malleolus via a steal rod and a cuff. The external moment arm was measured as the distance from the lateral aspect of the knee joint line to the point of force application at the centre of the strain gauge cuff (Figure 1).
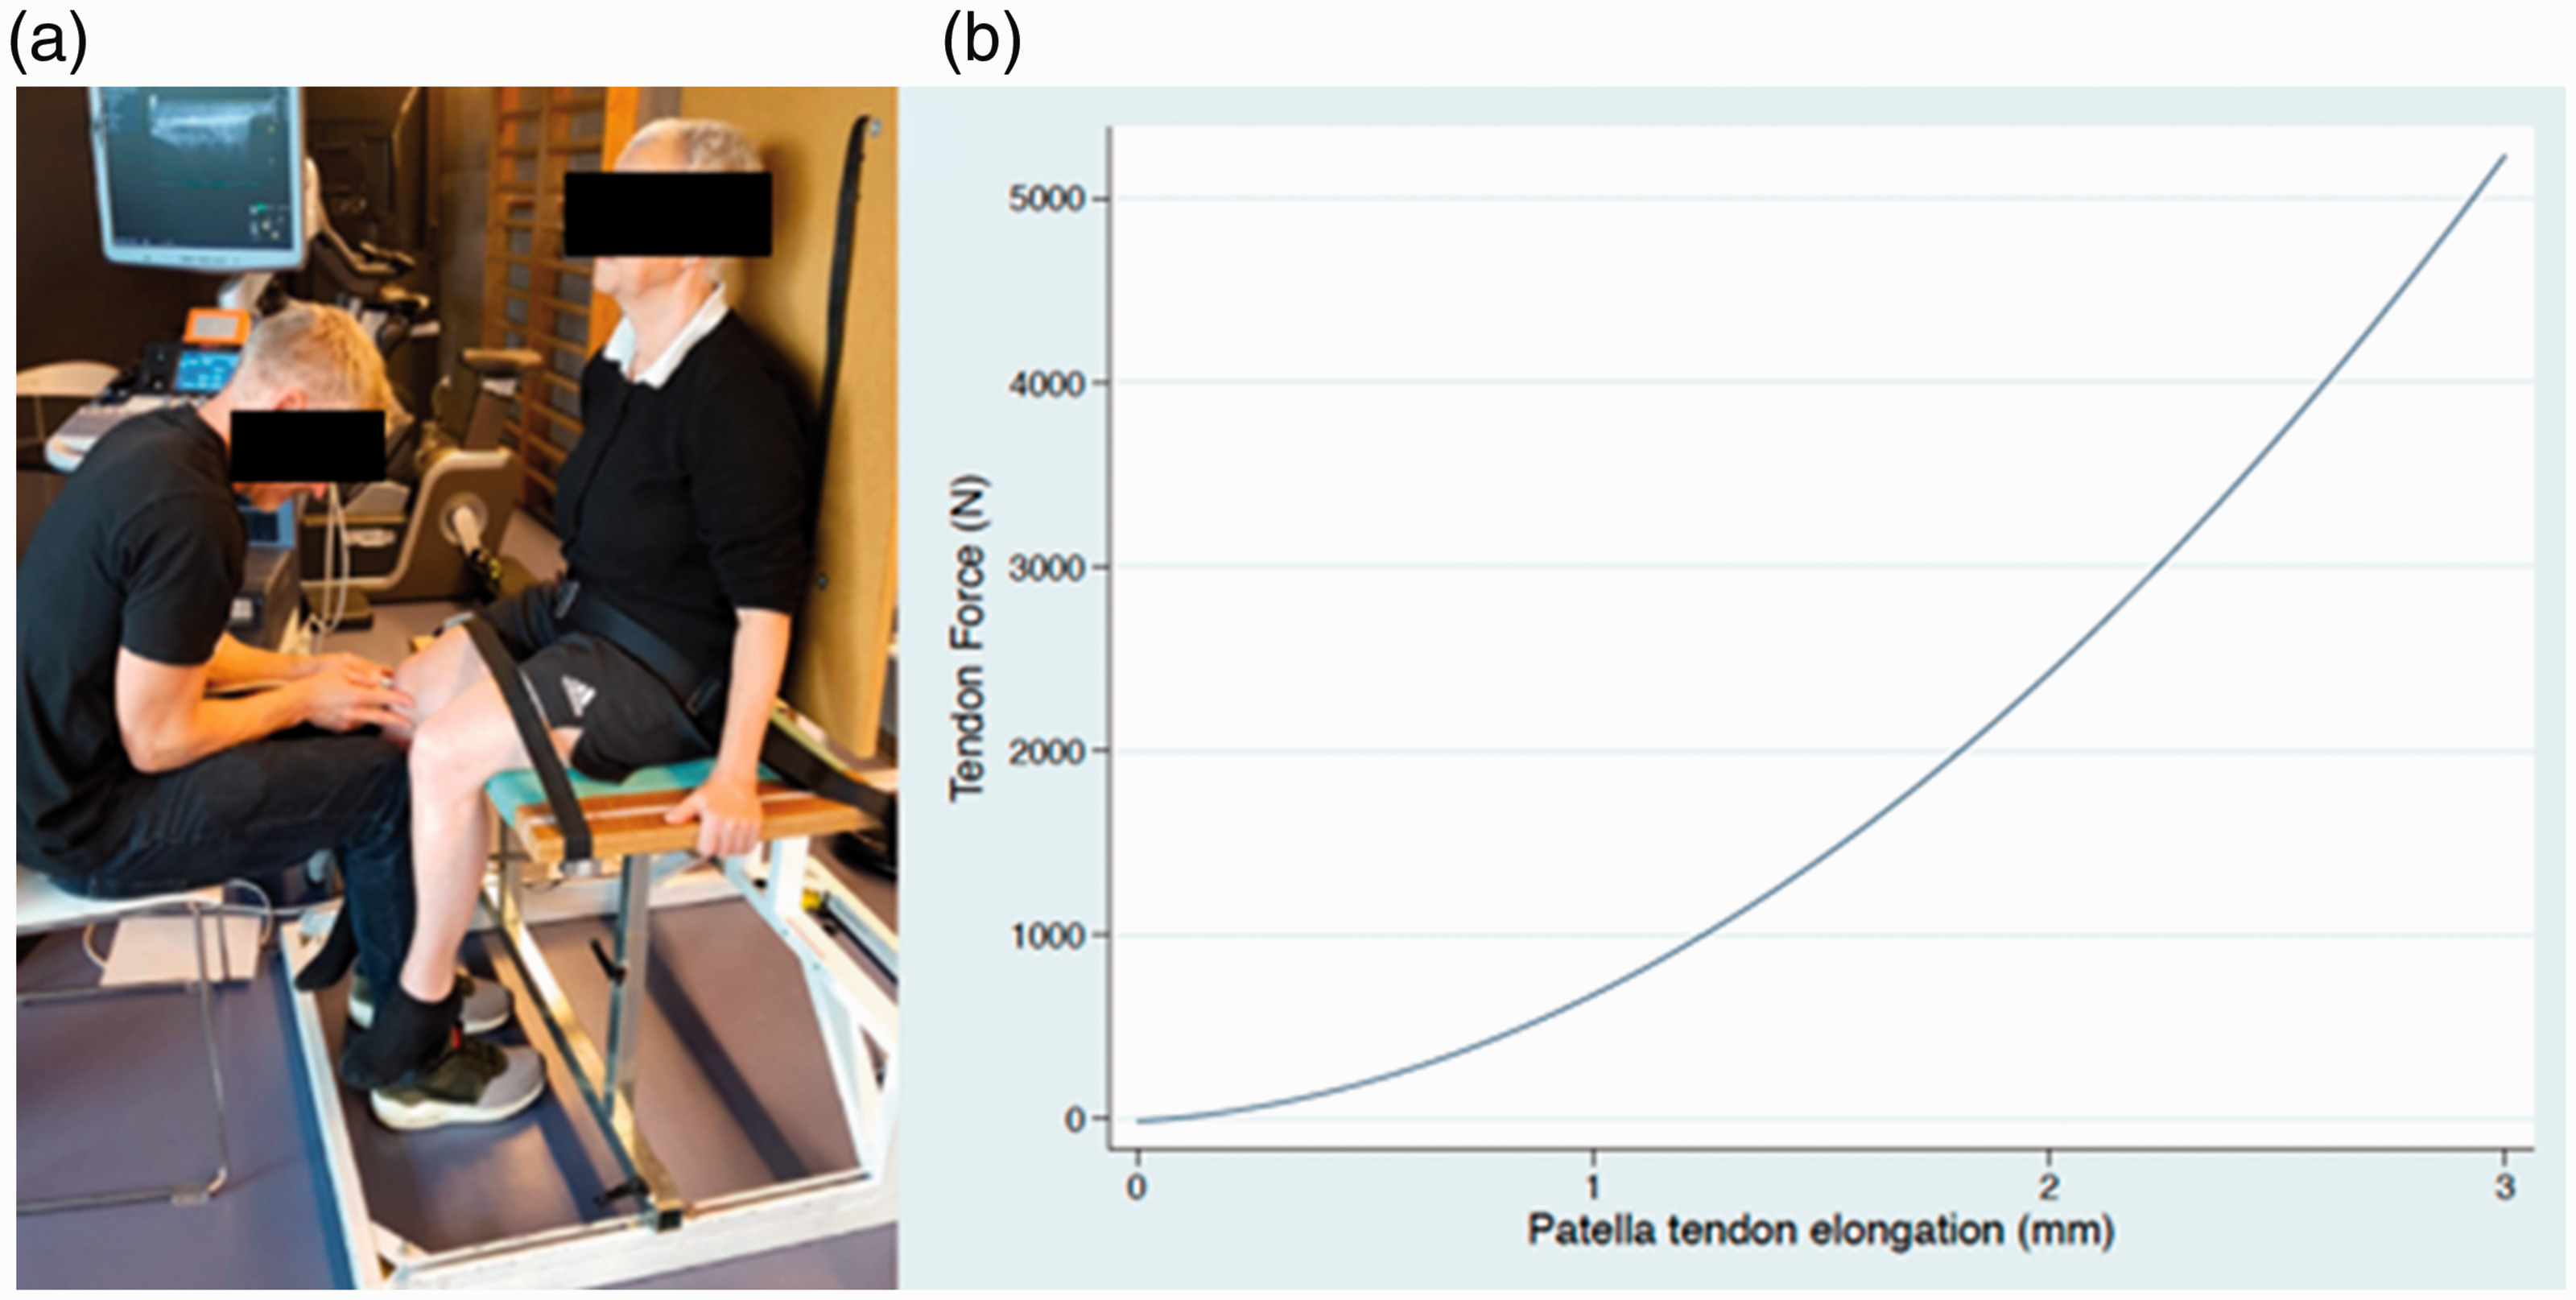
A 15 MHz linear ultrasound transducer (Logiq S7, GE Healthcare, Milwaukee, USA) was positioned anteriorly ensuring that the distal part of the patellar, the patellar tendon and the proximal part of tibia were visible within the US image field to enable recording of tendon length changes during contractile efforts.8,12,24
The procedure has previously been described in detail.12,24,25 In brief, participants performed a preconditioning procedure consisting of five isometric submaximal knee extension contractions with increasing intensity, ranging from approximately 40–80% of their self-estimated MVC in an attempt to ensure stable tendon mechanical properties.13,26 After the preconditioning, participants performed a maximal isometric contraction to assess isometric knee extensor MVC. The MVC was used to compare to the ramped contractions (see below), to ensure that the tests were within the similar relative range of loading rate properties. 8 After a 3-minute rest, a linear ramped MVC contraction was conducted lasting 7 to 10 seconds. During ramp contractions, force data were acquired synchronously with an ultrasonographic recording. A reference image of the target (force-time) slope was presented and real time visual feedback of the force signal was provided to ensure consistent strain rate. US recordings were sampled at 38 Hz, while force data were sampled to a separate PC at 2000 Hz (CED micro 1401, Cambridge Electronic Design Limited, using software Spike2 (ver.5.13)). Synchronisation of US and force data recordings were ensured via a custom-built trigger device using the electrocardiogram module on the US device. The ramped contractions were repeated three times each separated by three minutes. In case of unwanted US transducer displacement during contractions or other sources of error, the attempt was repeated. Ramp efforts reaching less than 80% of isometric MVC were discarded.
Data processing
Of the remaining attempts, the US recording best suited for analysis was tracked frame by frame using specific software (Tracker 5.0.5., Open Source Physics). Force data were amplified (gain 100) and filtered with a 400 Hz lowpass by a bridge amplifier (CED 1902) and sampled with CED micro 1401 (Cambridge Electronic Design Limited, Cambridge, UK) at 2000 Hz (16 bit) using software Spike2 (ver.5.13) and downsampled to match the US frame rate.
The internal moment arm was estimated from the individually measured length of femur24,25,27 and used to calculate the tendon force from the total knee joint extension moment. No correction for antagonist co-contraction was made as the accuracy of such estimations remains questionable. 8
Tracking of the tendon elongation is the most operator dependent part of this method. In order to assess intrarater reliability, US recordings were tracked twice with at least eight days apart.
An average of the two tracking sessions was then used for the force–deformation plot. A second-order polynomial fit was applied to the force–deformation curve (Figure 1), and tendon stiffness expressed in N/mm was then determined as the slope of the final 10% of the plot.12,24,28,29
Strain elastography
Following the ramped contractions, participants were placed in a supine position. The test leg was positioned with the hip and knee joint in a 90° flexion, supported by splints. SEL measurements were then performed with the same ultrasound equipment and transducer, following the manufacturer's recommendations for settings. This included a transducer movement rate of approximately 120 cycles/min, an axial smoothing of 3, a frequency of 10 and a soft/hard compression of 5.
SEL capturing was performed in the longitudinal plane in the centre of the patellar tendon. In order to minimize intraobserver variation and to avoid transient temporal fluctuations, our measurements were based on examination of two separated sets of three entire 20 seconds cine-loops rather than on single static images, as previously described. 20 To mimic a clinically relevant intrarater reliability, the first three scans were performed without removing the transducer from the skin, which was followed by two minutes rest (where the participant was allowed to move the leg) after which an additional three scans were performed and saved.
Tendon characteristics were assessed semi-quantitatively using ratios to the subcutis tissue (ROI circle diameter = 2 mm) and Hoffa’s fat pad (ROI circle diameter = 6 mm). Three ROIs were drawn midway between the femur and the tibia on the patellar tendon (ROI circle diameter = 2.8 mm) (Figure 2).
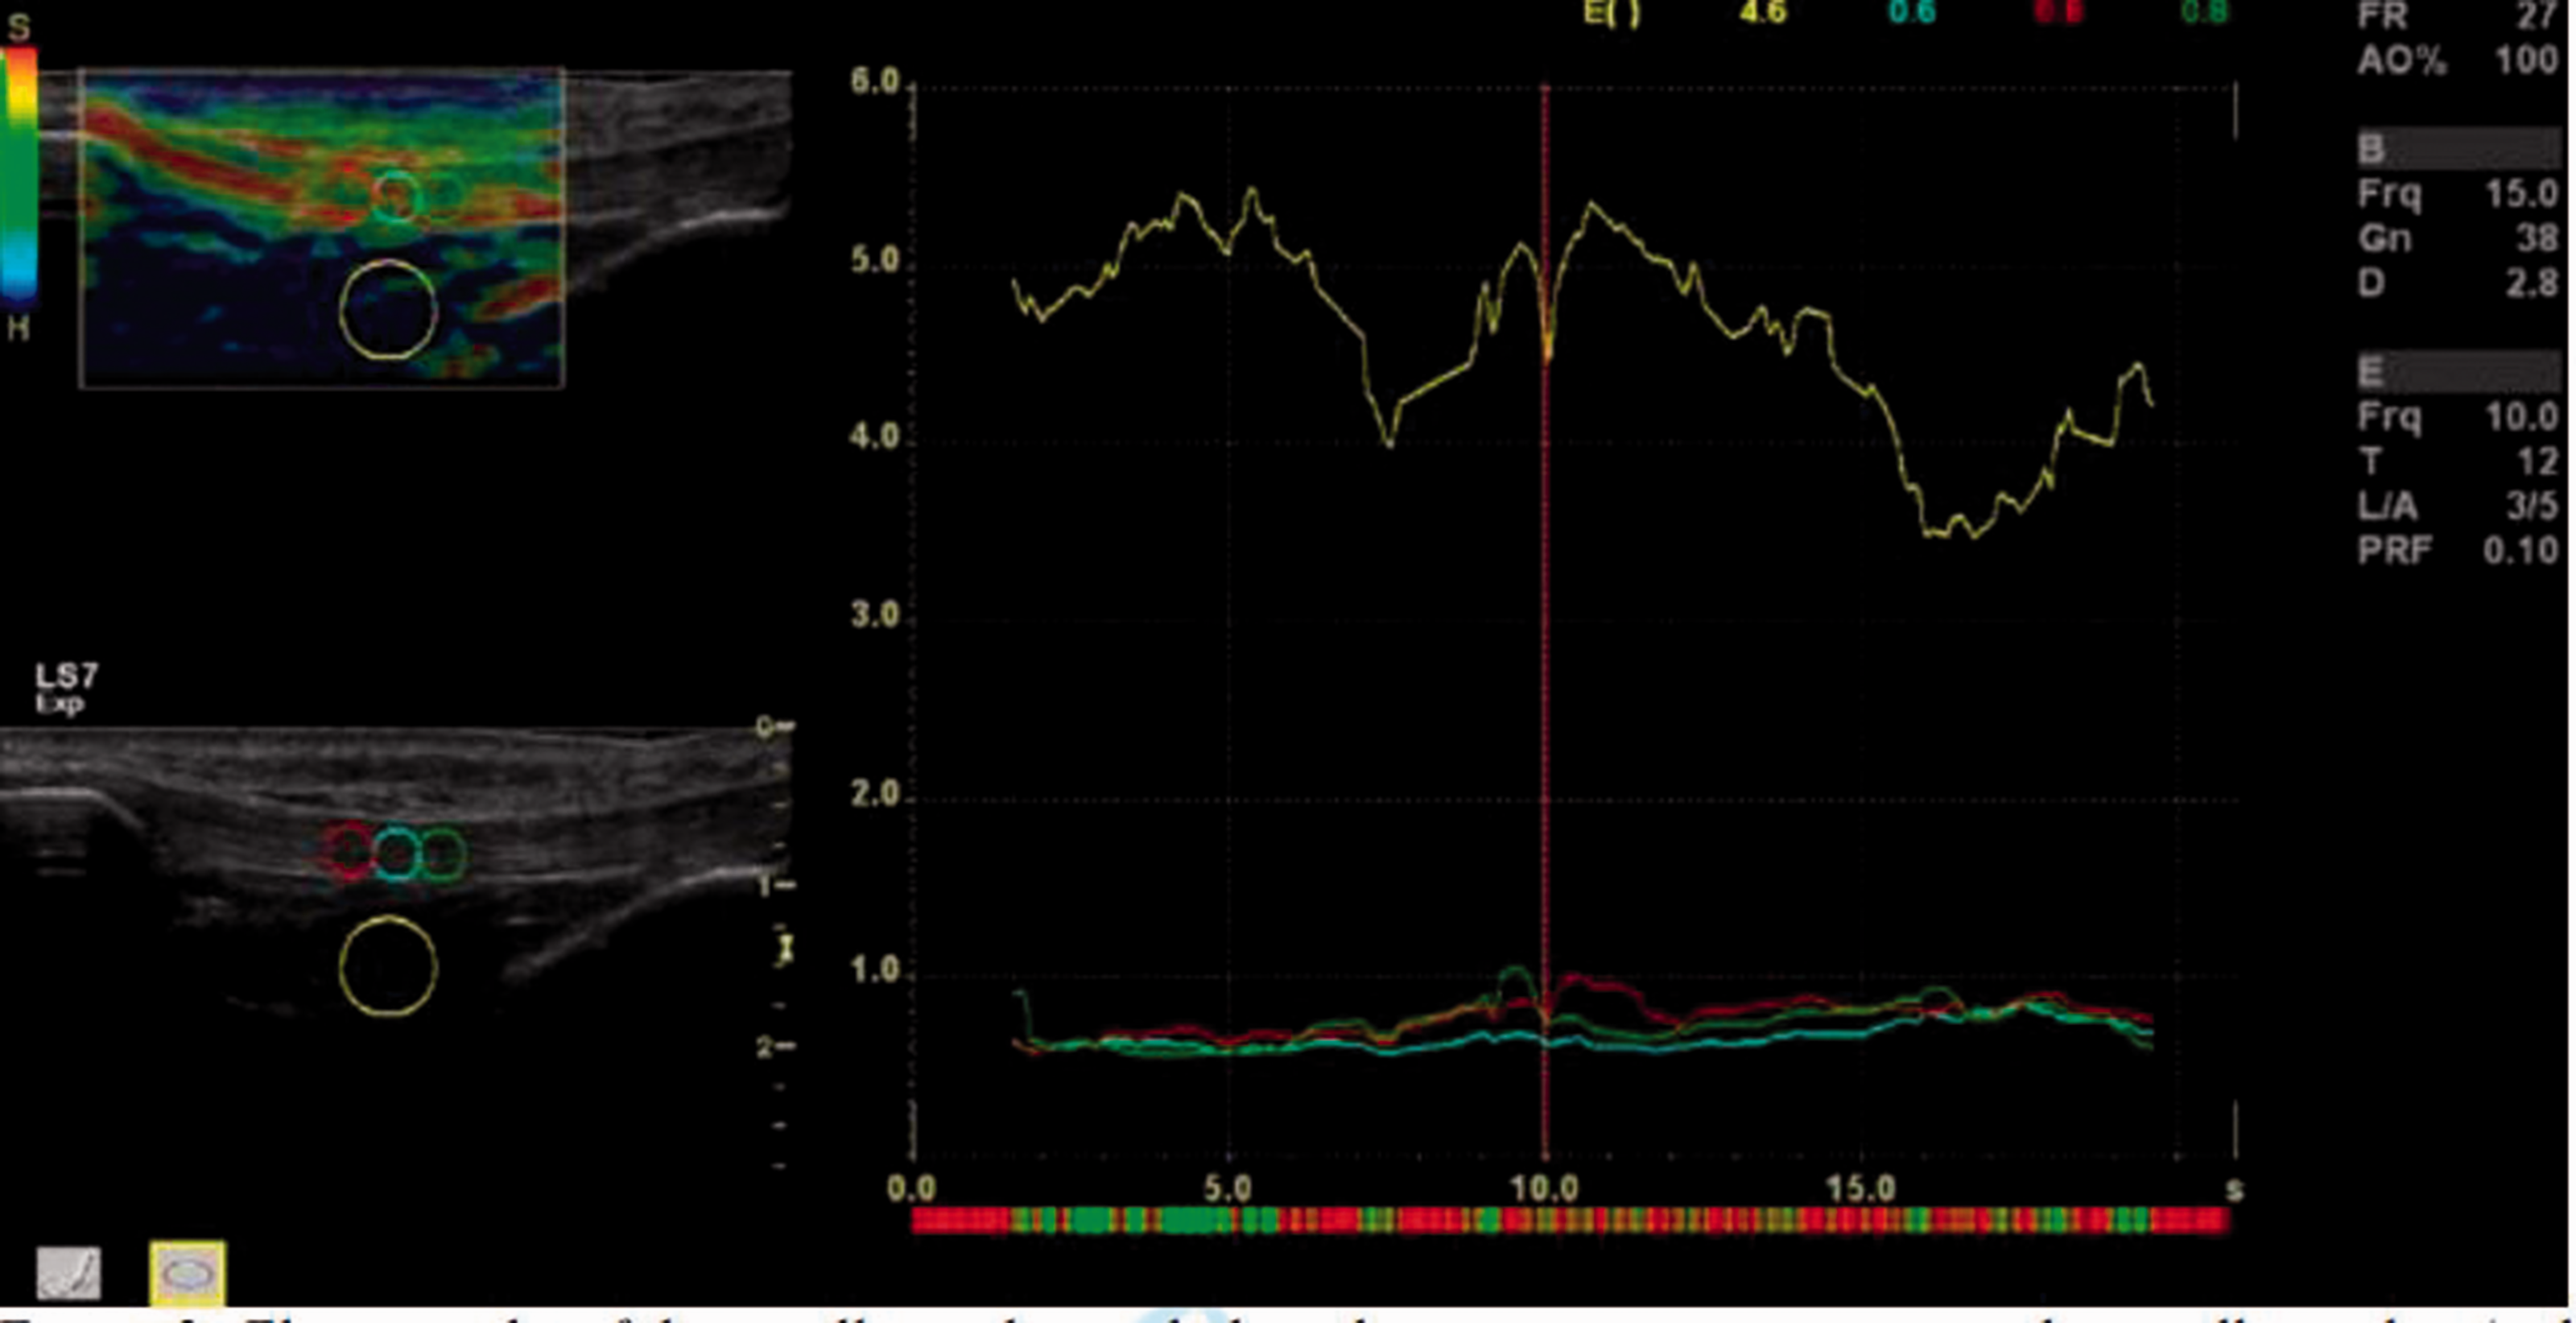
Elastography of the patellar tendon including three measurement areas in the patellar tendon (red, blue and green circles) and one reference area (yellow circle) in Hoffa’s fad pad with elastography characteristics (raw data/strain index) during the time of measurement. Quality bar in the top left corner.
The scale ranged from 0 to 60, with 0 being softest and 60 being stiffest.20,30 Results were based on the mean of three cine-loops as recommended. 31 A software incorporated quality control bar, displaying one to five green bars with five bars being the most acceptable, was used to evaluate the acceptable compression size, and data from 5 to 15 seconds of the 20-second cycle were obtained, including only high-quality images (five green points on the quality bar) (Figure 2).
Data processing
Assessments I and II, each containing three scans, were analysed with 14 days in between to ensure blinding in the assessment of the intrarater reliability of SEL image capturing. The results were reported in means. Different studies base their strain ratios on different equations. 20 In the current study, the strain ratio was calculated with the ROIs of the tendon as the numerator and the ROIs of the reference tissue as the denominator.
Statistics
For concurrent validity, tendon stiffness was assessed on two different and somehow incomparable scales; N/mm in the DBUS method, and a relative stiffness ratio scale ranging from 0 to 60 for the SEL. Therefore, correlations between the two different stiffness measures were analysed using Kendall’s Tau-b. A value of one indicates that the pair of ranks is correlated and concordant, a value of minus one that they are correlated and discordant and a value around zero that the two methods are not correlated.32,33
The relative intrarater reliability of the tracking process in the DBUS method and of the SEL method using both reference tissues was evaluated using the intraclass correlation coefficient (ICC), two-way mixed effects model, 34 reflecting absolute agreement among ratings. Based on the 95% confidence interval (CI) of the ICC estimate, values below 0.5 indicate poor reliability, values between 0.5 and 0.75 moderate reliability, values between 0.75 and 0.9 good reliability, while values greater than 0.9 indicate excellent reliability. 34
The absolute reliability, indicating how much dispersion and error the single measurement contains, is visualised by Bland–Altman plots with 95% limits of agreement. 35 A visual inspection of the Bland–Altman plots was made to check for funnel effects and systematic differences. 36 The absolute reliability was calculated using standard error of measurement (SEM) as the standard deviation (SD) of the mean differences between the two measurements divided by √2. 37 Also, minimum detectable change (MDC) was calculated as 1.96 × √2 × SEM. 37 Furthermore, relative SEM and MDC were calculated as a percentage of the average values from assessment I and assessment II in each method.
All statistical analyses were performed in STATA/IC 16.0 (StataCorp. 2019, Stata Statistical Software: release 16, StataCorp. LLC, College Station, TX).
Results
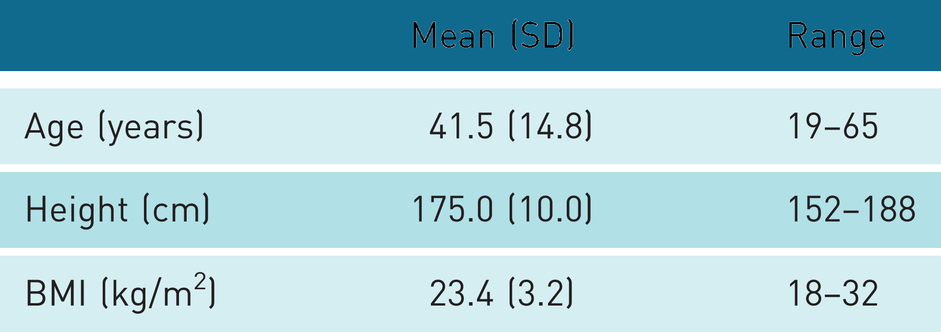
In total, 14 men and 6 women were included in the current study. It was a mixed population ranging from athletes to office workers, with wide variation in age, height and body mass index (BMI) (Table 1). Data from three men were excluded from the analysis because of a disproportionate fast rise of force in the beginning of the ultrasound recordings, which made later analyses impossible. The final sample used in the analysis comprised 17 patellar tendons from the dominant leg of the 17 participants.
Anthropometric data (n = 17, 11 men and 6 women).
Concurrent validity
Mean MVC, patellar tendon stiffness and SEL stiffness ratios are presented in Table 2.
Strength and stiffness measurements (n = 17).
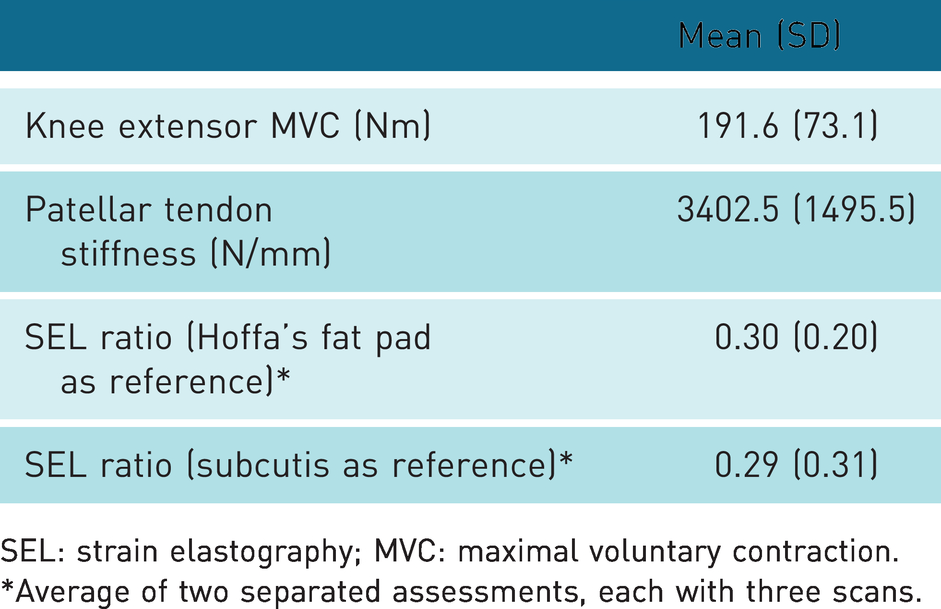
SEL: strain elastography; MVC: maximal voluntary contraction.
*Average of two separated assessments, each with three scans.
No correlation was found between assessments of patellar tendon stiffness with the DBUS and the SEL method, irrespective of reference tissue used in the SEL (Figure 3). Kendall’s Tau-b was –0.01 (p = 1.00) with Hoffa’s fat pad as reference tissue, and 0.04 (p = 0.87) with subcutis as reference tissue (Figure 3).
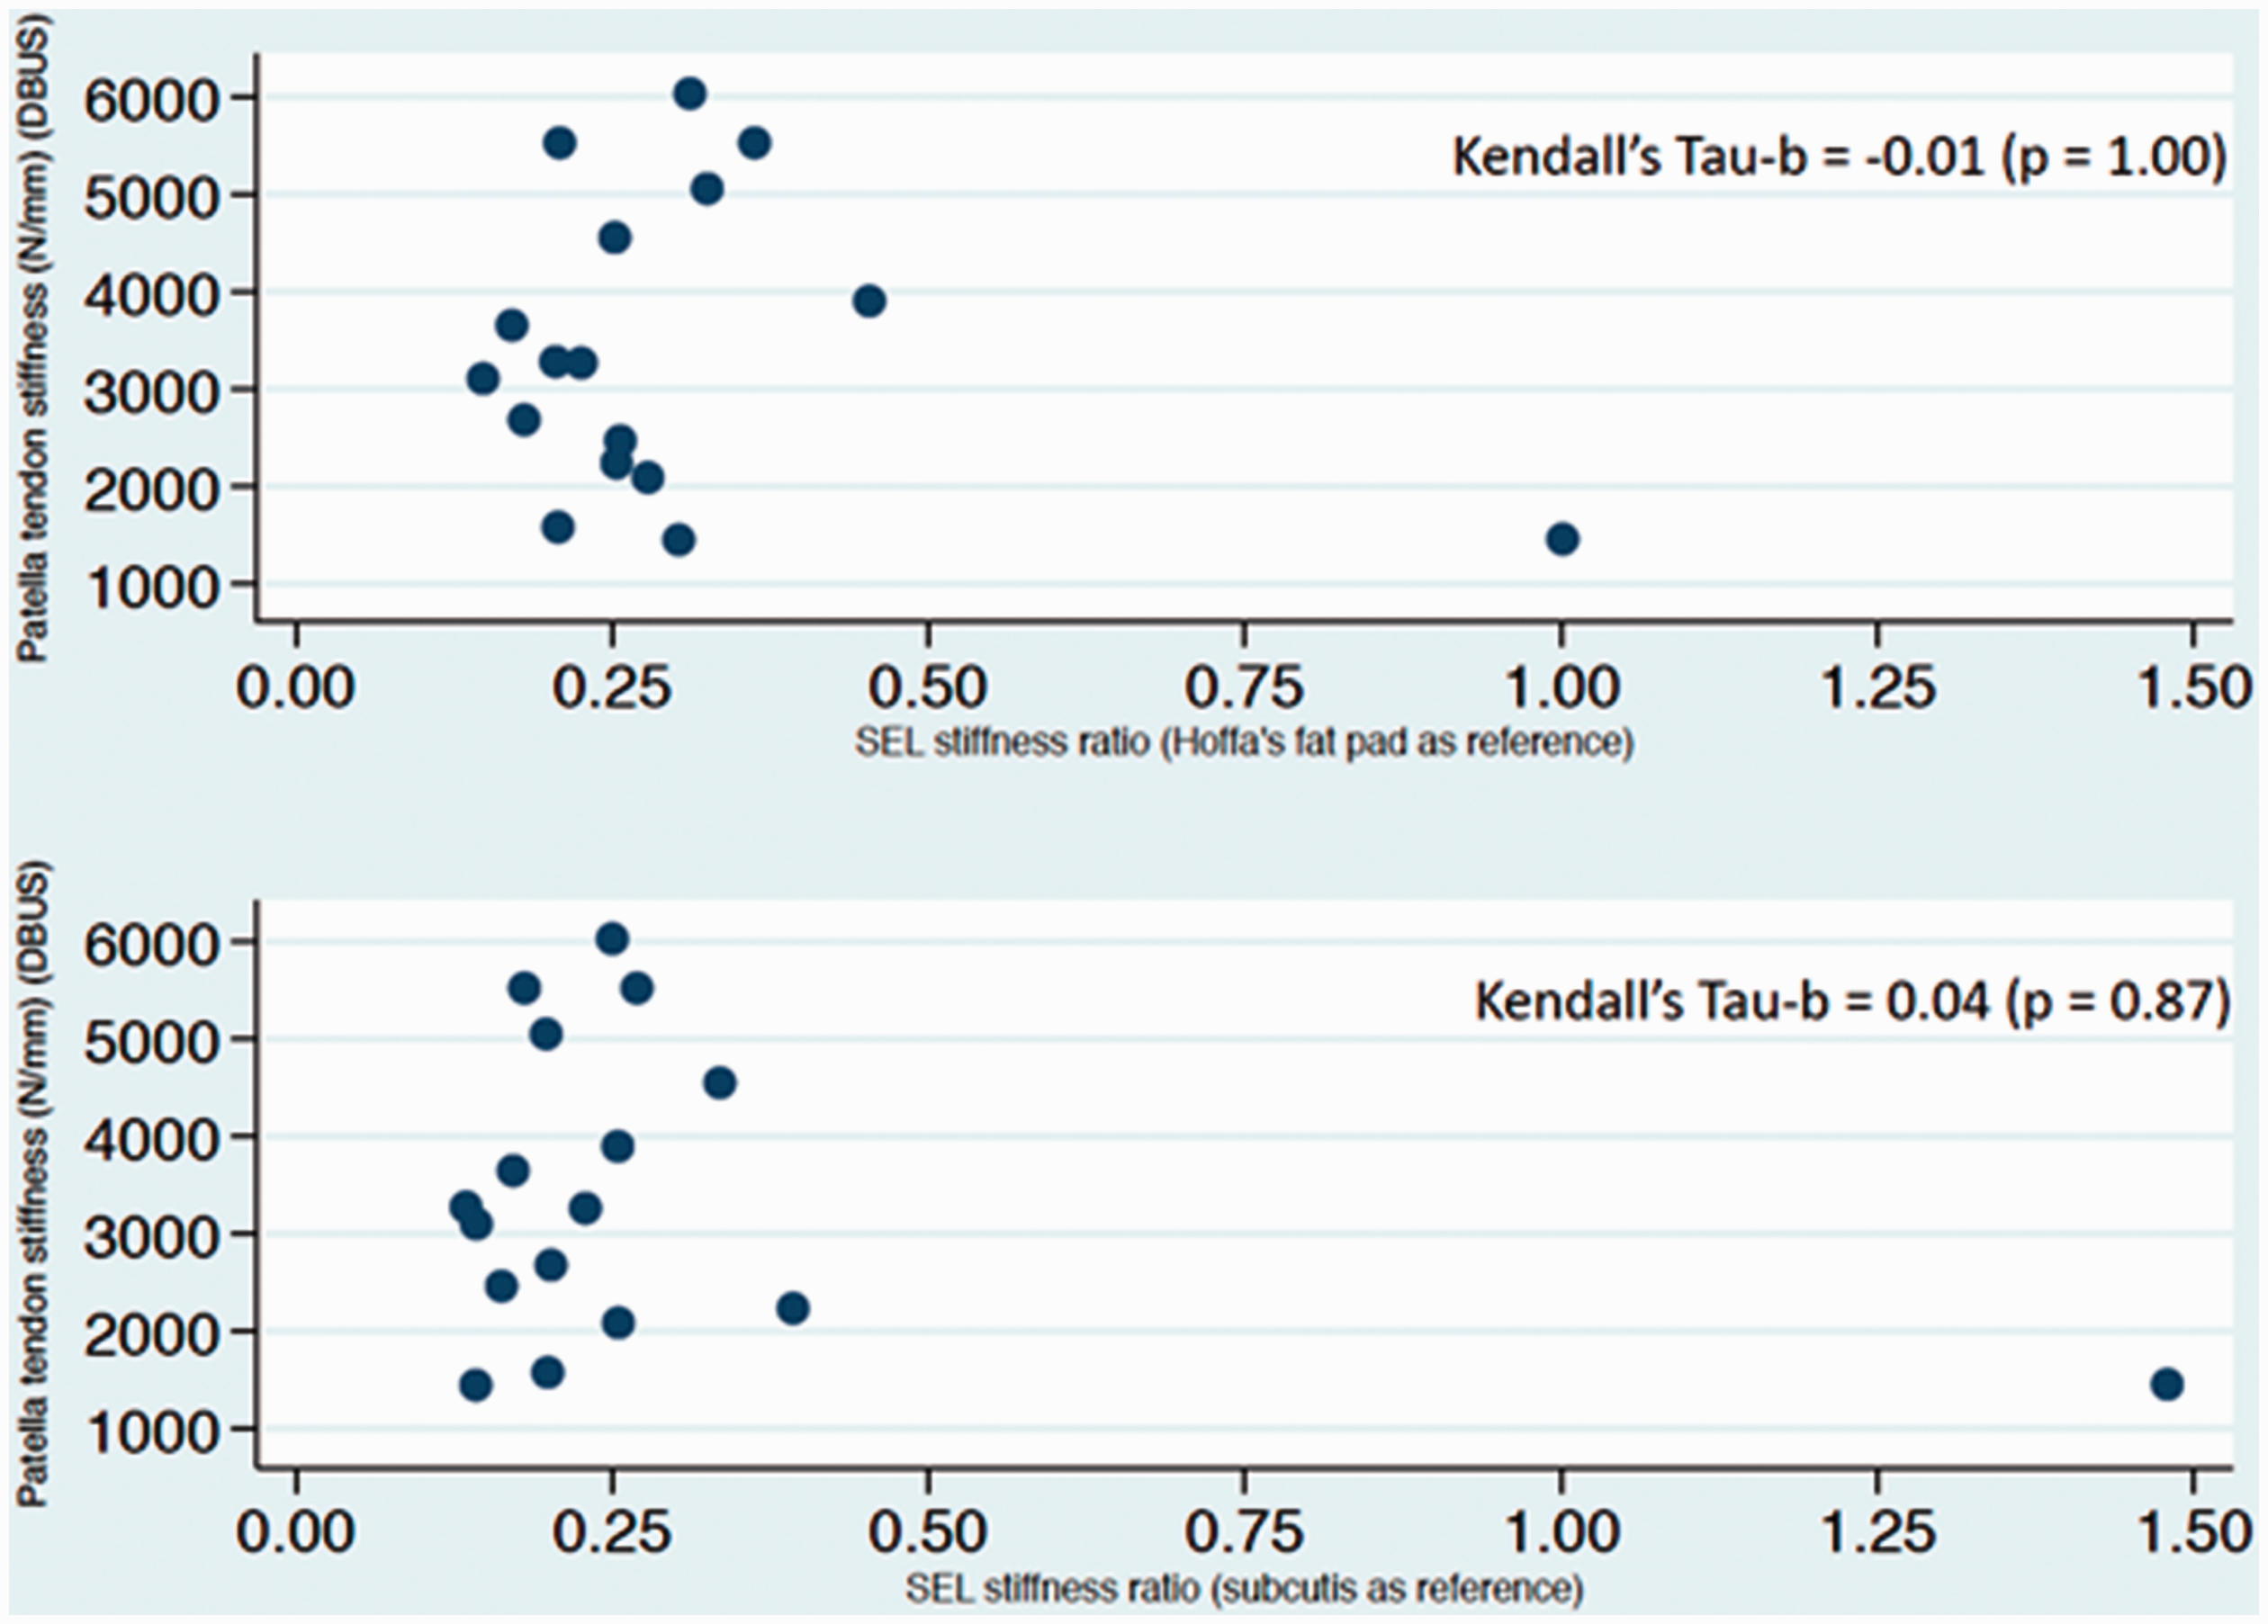
Scatterplot showing no immediate correlation between the DBUS method and the SEL method. Inserted are the Kendall’s Tau-b values confirming that no correlation or concordance existed.
Intrarater reliability
The relative reliability was good to excellent (ICC = 0.95, 95% CI: 0.85–0.98) for tracking of tendon elongation on the ultrasound recordings (Table 3). Also, good to excellent reliability/agreement was observed in the SEL both with Hoffa’s fat pad as reference tissue (ICC = 0.95, 95% CI: 0.86–0.98) and with subcutis as reference tissue (ICC = 0.94, 95% CI: 0.82–0.98) (Table 3).
Intrarater reliability for tracking of tendon elongation in the dynamometer and B-mode ultrasonography recording method (DBUS) and for the SEL with both reference tissues (n = 17).
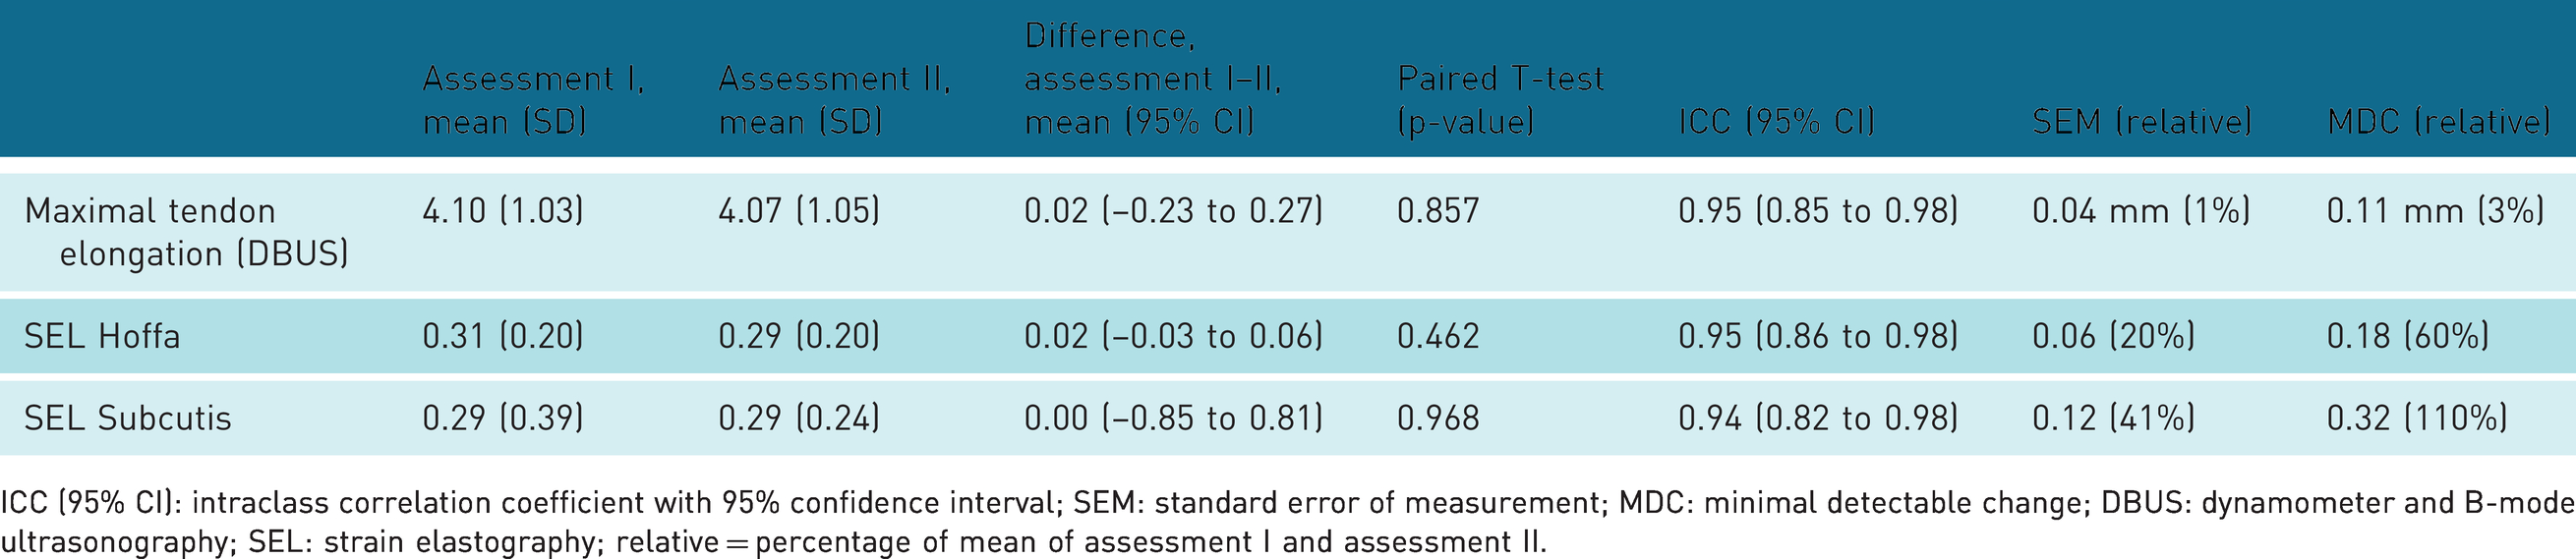
ICC (95% CI): intraclass correlation coefficient with 95% confidence interval; SEM: standard error of measurement; MDC: minimal detectable change; DBUS: dynamometer and B-mode ultrasonography; SEL: strain elastography; relative = percentage of mean of assessment I and assessment II.
The Bland–Altman plots did not show any funnel effects, meaning that the difference between the pair of measurements did not increase systematically with increasing mean size (Figure 4).
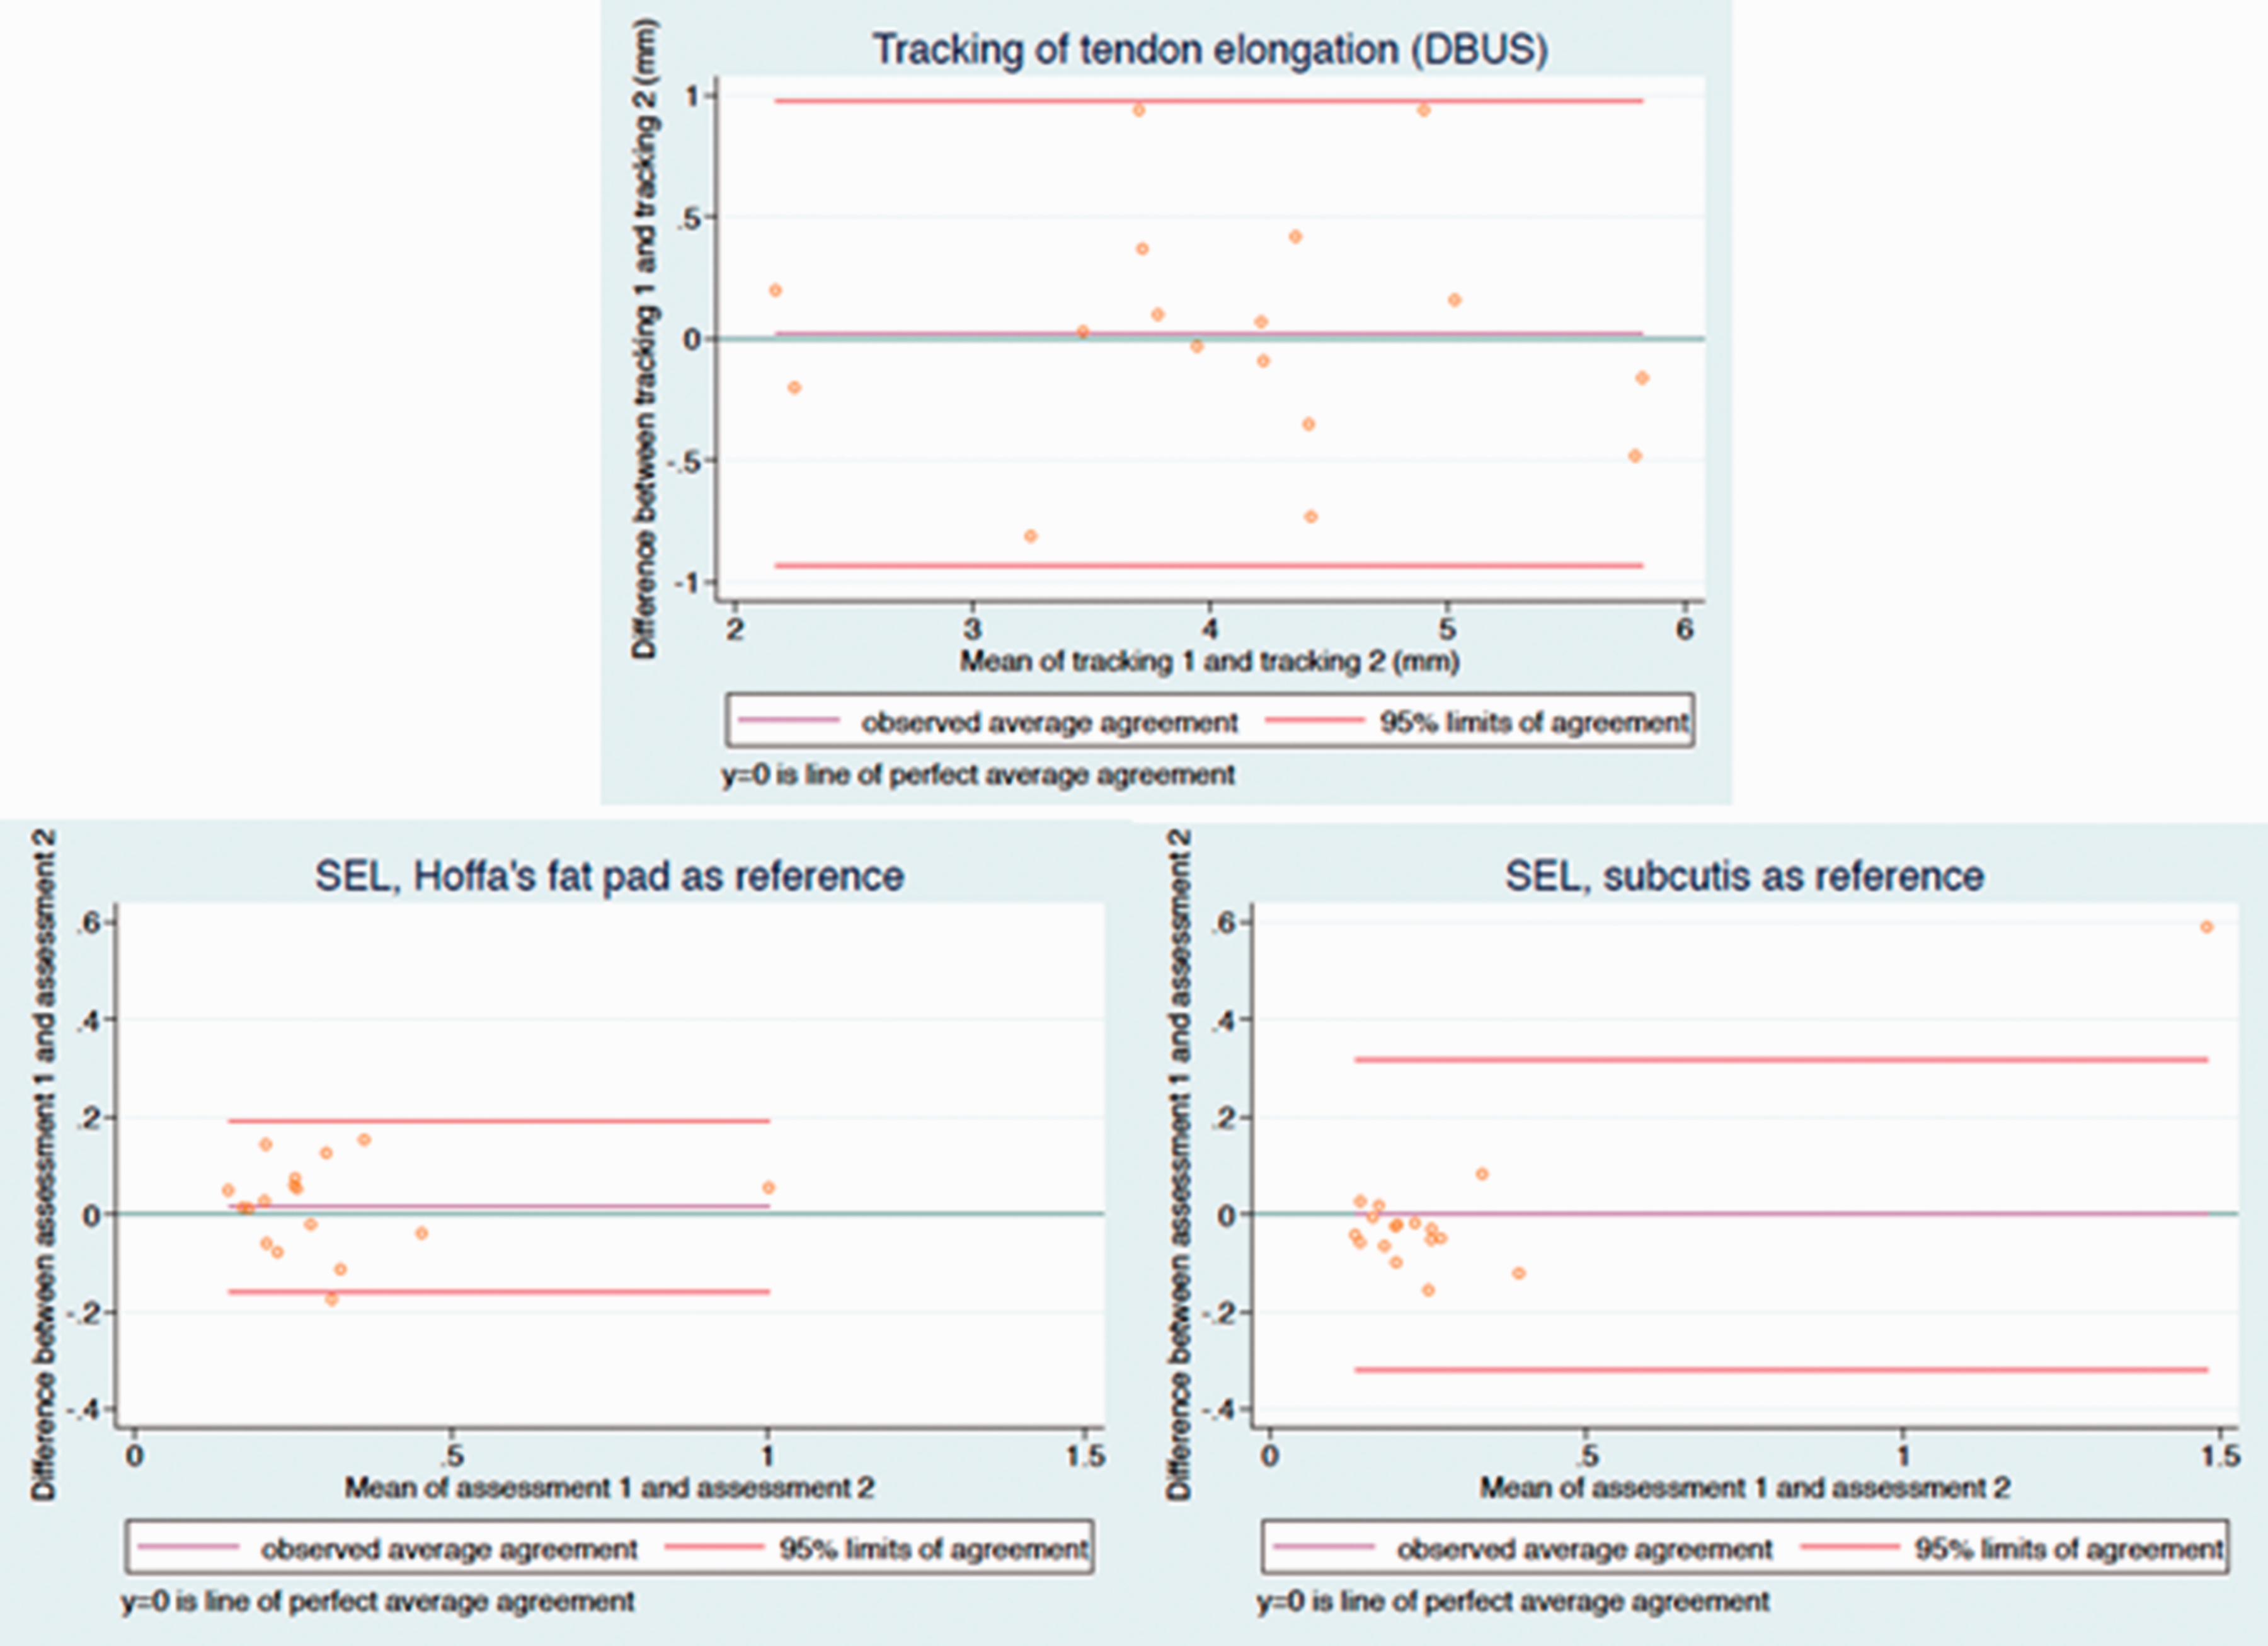
Bland–Altman plots with 95% limits of agreement for the tracking process using the dynamometer and B-mode ultrasonography recording method (DBUS) and for the stiffness ratios obtained in the SEL method, using either Hoffa’s fat pad or subcutis as reference tissues. The dark green horizontal line (intersecting zero at the y-axis) indicates perfect agreement, whereas the purple horizontal line represents the observed mean difference. The closer the purple line is to the dark green line the less disagreement between tracking one and two, resp. assessment one and two.
No significant difference was found between assessments I and II (Table 3). For tracking of the tendon elongation in the DBUS method, SEM and MDC were low, meaning small measurement error. In the SEL, SEM and MDC were large, especially with subcutis as reference tissue (Table 3).
Discussion
No correlation was found between the DBUS and the SEL method, indicating that the two methods are not comparable (i.e. no concurrent validity). The intrarater reliability was good to excellent in both the DBUS and the SEL method, irrespective of reference tissue. The absolute reliability was high for the DBUS method, but low for the SEL, i.e. SEM and MDC were large, especially with subcutis as reference tissue.
Concurrent validity
No concurrent validity for the DBUS method and the SEL method was found. This could be explained by the differences in test conditions of the tendons and the difference of tendon parts (a part of or the whole tendon) being tested. The DBUS method represents a stiffness value for the whole tendon structure obtained during a dynamic condition near maximal force and elongation, while the SEL is suggested to represent the stiffness relative to a reference tissue in a specific part of the patellar tendon during a passive condition. Also, in the SEL, differences in stiffness ratios could be due to differences in the stiffness of the reference tissues and not in the tendon stiffness per se.
The mean MVC and stiffness values for the DBUS method obtained in the current study are comparable with other studies applying this method.24,38–40 As expected, the observed MVC and stiffness values had a relatively large variation due to participant heterogeneity. In the current study, the recommendations concerning the DBUS method given by Seynnes et al. were followed 8 ; however, technical challenges remain. No correction for tendon deformation due to passive motion was done, even though it was recommended in earlier studies.25,28 The reason was that present pilot-attempts with a goniometer (Biometrics Ltd, UK) revealed maximally 3° change in the knee joint angle during contractile efforts. Since recent studies have established that correction is not necessary when knee joint movement is minimal, and since both the tibia and the patella movement were tracked in the present study, joint angle corrections were omitted.5,12,24
Another reason for the absent concurrent validity may be the relatively large measurement error found in the SEL method. The SEL results seem more challenging to compare with other studies, since there is considerable inconsistency in the reported stiffness ratios due to choice of reference tissue, measurement location, population type, calculation methods, testing positions, size of ROIs and US-equipment.18–20 Using Hoffa’s fat pad as reference tissue, the present study found a mean stiffness ratio of 0.30 in healthy adults (middle tendon part, passive 90° knee–joint flexion). This is lower than reported in a mixed group of athletes and controls, where the stiffness ratio was 0.55 (proximal tendon part, passive 20–30° knee–joint flexion), 16 and much lower than in healthy adults, where a ratio of 1.50 was found (proximal tendon part, passive 30° knee–joint flexion). 15
Using subcutis as reference tissue, the current study found a mean stiffness ratio of 0.29 in healthy adults (middle tendon part, passive 90° knee–joint flexion). Also this ratio is somewhat lower than what was found for the non-operated leg in a group of patients who had undergone anterior cruciate ligament reconstruction, where the stiffness ratio was 0.42 (middle tendon part, passive 30° knee–joint flexion), 17 and much lower than reported in healthy adults, where a stiffness ratio of 4.38 was found (middle tendon part, passive 30° knee–joint flexion). 14
As mentioned above, this inconsistency in the SEL results relates partly to methodological differences. For instance, some studies use the ROIs of the tendon as the denominator, while others as the numerator (as in the current study) when calculating stiffness ratio. 20 The calculation method is not clearly stated in the study by Porta et al. reporting remarkably high stiffness ratio values, but if the ROIs of the tendon are used in the denominator, it would potentially explain the large difference in stiffness ratio compared with the current study (4.38 vs. 0.29). Calculating the reciprocal value of 4.38 reported by Porta et al. actually results in a ratio of 0.23, 14 similar to the current findings. Still, previous reported SEL values show some variation, which could be due to different testing positions. In the present study, knee joints were placed in 90° flexion, while previous studies used 20 or 30° knee flexion.14–17 Moreover, different tendon parts are examined across studies, and while the current study examined the middle tendon part, others examined the proximal tendon part.15,16 Both stiffness ratio and reproducibility are influenced by the selected measurement placement.16,18,19 Furthermore, the selected size of the ROIs is not uniform in all studies. Finally, different US devices were applied across studies, which makes it difficult to compare results, due to the different algorithms used by different manufacturers.19,20
All DBUS measurements were performed by the same researcher (PH), and the SEL measurements and analyses were performed by an experienced radiographer (KB), and repeated trackings and measurements of SEL were analysed blinded with 8–14 days in between. The DBUS and the SEL method were applied in one session in the same order for all participants, with standardized procedures and minimized risk of diurnal variation in tendon stiffness due to for instance variations in water content of the tendon. 2
Reliability
In the current study, ICC was good to excellent in the most operator dependent part of the DBUS method, which is tracking of the tendon elongation from the US recording. Also the absolute reliability was high when tracking the tendon elongation, i.e. both SEM and MDC was small. Other studies report a moderate interrater reliability, 13 and also a satisfactory inter-session and between-day reproducibility. 12 Thus, the present data add to the notion that the DBUS method is reliable.8,12
Good to excellent intrarater reliability for the SEL method was observed, irrespective of reference tissue. This is in line with one of the previous studies. 14 In contrast, two other studies reported only poor to fair intrarater reliability looking at the middle tendon part with the knee in a 30° flexion position, with Hoffa’s fat pad as reference tissue. They further concluded that the reliability was highly dependent on operator experience.18,19 A very experienced radiographer (KB) conducted the SEL measurements in the present study, which may explain the high relative reliability observed. Also, the heterogeneity of the current population may have made it easier to discriminate between participants and therefore increase the ICC in the present study. Furthermore, given that the sample size of this study was modest and heterogeneous, the sample may not be representative of the population in the entire age span and level of physical activity. The absolute reliability of SEL was poor when using both reference tissues, but based on the current results Hoffa’s fat pad seems superior as reference tissue, as it resulted in lower SEM and MDC compared with subcutis as reference tissue. As displayed in the Bland–Altman plots, an outlier was noticed for the SEL measurements. Removing the outlier from the analyses did not affect the concurrent validity noticeably, but did result in a lower ICC (poor to excellent) for the SEL method. The poor absolute reliability calls for caution when using SEL stiffness ratios to monitor difference in stiffness on an individual level in healthy people.
Conclusion
In the current study, no concurrent validity was found for the DBUS and the SEL method when measuring tendon stiffness, advocating that the two methods do not measure the same tendon properties. The relative intrarater reliability was good to excellent when tracking the tendon elongation in the DBUS method, and the small SEM and MDC values indicate a high absolute reliability. With SEL, a good to excellent relative intrarater reliability was seen, but very high SEM and MDC values indicate a low absolute reliability. Therefore, the SEL method may not be recommended for tracking differences in patellar tendon stiffness in healthy individuals. Using Hoffa’s fat pad as reference tissue during SEL on the patellar tendon seems preferable, but future research is needed to confirm this.
Footnotes
Ethics Approval
The experimental protocol was approved by The Regional Scientific Ethics Committee for Southern Denmark (jnr. S-20170052 HJD/csf) and the study was reported to the Danish Data Protection Agency.
Declaration of conflicting interests
The author(s) declared no potential conflicts of interest with respect to the research, authorship, and/or publication of this article.
Funding
The author(s) disclosed receipt of the following financial support for the research, authorship, and/or publication of this article: This study was supported by the UCL University College, Odense, Denmark.
Guarantor
PH.
Contributorship
All authors contributed to the study conception, design and data interpretation. Data collection and analysis was performed by PH, KB and TJ. All authors edited, reviewed and approved the final version of the manuscript.
Acknowledgments
The authors would like to thank the engineers Henrik Baare Olsen and Tue Skallgård at the Department of Sports Science and Clinical Biomechanics, University of Southern Denmark for direct technical assistance.