
Abstract
Monitoring the conduct of phase III randomized controlled trials is driven by ethical reasons to protect the study integrity and the safety of trial participants. We propose a group sequential, pragmatic approach for monitoring the accumulating efficacy information in randomized controlled trials. The “Population Health Research Institute boundary” is simple to implement and sensible, as it considers the reduction in uncertainty with increasing information as the study progresses. It is also pragmatic, since it takes into consideration the typical monitoring behavior of monitoring committees of large multicenter trials and is relatively easily implemented. It not only controls the overall Lan–DeMets type I error probability (alpha) spent, but performs better than other group sequential boundaries for the total nominal study alpha. We illustrate the use of our monitoring approach in the early termination of two past completed trials.
Introduction
Monitoring the conduct of phase III randomized controlled trials (RCT) is driven by ethical reasons to protect the study integrity and the safety of trial participants. Interim analyses are conducted to guide whether the accumulated information provides clear evidence of benefit or harm, or is likely to be inconclusive. They inform whether a trial should be terminated before the scheduled end, so that trial results could be disseminated early. Monitoring is usually conducted by individuals independent of those conducting the study—an independent statistician or statistical coordinating center, along with a data and safety monitoring board (DSMB). 1
Interim efficacy analyses require repeated testing of the accumulating data in a trial, while trying to control the overall probability of a type I error (alpha). Methods for interim monitoring vary, from Bayesian approaches for adaptive designs, 2 approaches based on conditional power projections,3,4 the repeated confidence intervals approach, 5 to the more commonly used group sequential frequentist methods.6–10 The group sequential design divides the total number of necessary participants into equal-sized groups, and repeated significance testing is conducted sequentially on the accumulated data. 11 These designs control the overall alpha at the desired and planned level, typically set at 0.05.
The most common monitoring guidelines used for efficacy in superiority trials are the group sequential designs. Haybittle 6 and Peto et al. 7 suggested simply using the large Z-score critical value of 3 during the entire study and then 1.96 (for a two-sided alpha of 0.05) at the final look, with a very slight increase in overall type I error probability. The Pocock approach controls the overall type I error by specifying a few equally spaced times for the interim testing, and by “raising the bar” to a constant critical value at each of the looks, including the final look at the end of the study. Depending on the number of looks, the Z-score critical value at the end of the study may be substantially higher than 1.96. Both the Haybittle–Peto and Pocock approaches do not adjust the Z-score critical value during the conduct of the trial with increasing information from the accumulating data. The O’Brien and Fleming approach is more appealing, since it preserves the overall type I error probability, makes it very difficult to stop a study very early when there is less information (higher variability, higher uncertainty), and gradually reduces the critical value as more information is accumulated, so that the Z-score critical value at the end of the study is not so high. Whitehead and Stratton 10 introduce triangular continuation regions and show they offer the potential of earlier stopping when the null hypothesis is true.
A common practice by DSMBs, when a stopping boundary has just been crossed, is to recommend that the investigators conduct a “sweep” and update the status of all participants to ensure that the data are as up-to-date as possible, and then request another look at the study primary outcome results soon after, to ensure that recommendations are not being made based on a “random high” difference observed only at a single timepoint. For example, they may request “let us see the results within 2–3 months to reassure ourselves that the effect is still there.” None of the group sequential approaches described above incorporate this practice.
This article describes a simple, sensible and pragmatic approach that the Population Health Research Institute (PHRI) has been using for two decades for monitoring the accumulating efficacy information in randomized controlled trials, one that combines the principles of the O’Brien–Fleming approach (considering the reduction in uncertainty with increasing information as the study progresses) and the simplicity of the Haybittle–Peto approach. In addition, it also takes into consideration the monitoring practice of DSMBs, 1 where it is common to request another review shortly after the initial boundary crossing, prior to making recommendations on study termination. We illustrate the use of our monitoring approach in the early termination of the Heart Outcomes Prevention Evaluation (HOPE) trial,12,13 and more recently in the Cardiovascular OutcoMes for People using Anticoagulation StrategieS (COMPASS) trial.14,15
Implementing group sequential monitoring of superiority trials
The repeated testing group sequential procedure proposed by Pocock inflates the critical Z-score of the test statistic depending on the number of interim looks and uses the same critical value throughout the conduct of the trial and for the final analysis at the end. Similarly, the Haybittle–Peto approach raises the critical Z-score during the conduct of the trial, but always to the value of 3, and uses the unadjusted Z-score critical value of 1.96 at the end-of-study analysis. The O’Brien–Fleming procedure uses a decreasing Z-score critical value as information increases and uncertainty decreases.
These group sequential monitoring designs are typically implemented using the Lan–DeMets
16
alpha-spending function approach, which relaxes the need to pre-specify the number of interim looks, their timing and the amount of information observed. The classic group sequential procedures are based on information time (
The alpha-spending function approach can be used to approximate the Z-score boundaries for these two methods


where Φ denotes the standard normal cumulative distribution function.
Pragmatic monitoring guidelines
The “pragmatic” monitoring guideline we propose is in the spirit of both the O’Brien–Fleming approach, since it considers the reduction in uncertainty with increasing information as the study progresses, and the Haybittle–Peto approach, since it is simple and does not require complex statistical calculations. It also takes into consideration the monitoring practice of DSMBs, which typically tend to not start reviewing efficacy information until a substantial amount of information on events has been accumulated, which is usually around midway during the conduct of a trial, and may not consider possible early termination of a trial when it is very close to the scheduled end of the study. 18 DSMBs are likely to request repeated examination of the efficacy hypothesis when results are close to the critical Z-score critical values. The latter behavior comes from the board wanting to be re-assured that the observed Z-score that may have just crossed the critical boundary was not due to a “random high blip” and is thus consistent over time. The comfort that boards may feel in making a recommendation for early termination due to crossing a superiority boundary will, of course, depend on the size of the effect and the consistency in the trend for increasing effect in prior looks. Note also that, given the importance of the recommendation for possible early termination, DSMBs are typically hesitant to recommend early termination based solely on the statistical analysis of the accumulating data on the primary hypothesis, but to consider the consistency of the results in secondary outcomes, the consistency of the results in subgroups and over time, and the balance of the apparent beneficial effects on the safety/harm outcomes, that is, by examining the “totality of the evidence.” 19
Our proposed pragmatic approach, the PHRI (Population Health Research Institute) boundary, allows three timepoints at which the primary hypothesis is tested: two interim looks at 50% and 75% of the information, and the final test at the end-of-study (with 100% of the information). At the first interim look, the Z-score critical value is 4; at the second interim look, the Z-score critical value is 3, and the end-of-study Z-score critical value is 1.96. At each of the interim looks, if the critical value is exceeded, another look is conducted around 90 days later, to ensure that outstanding data are included in the analysis (during study conduct, DSMB reports are usually based on data with several weeks of lag time due to delays in reporting events from centers and in data processing) and to establish consistency over time of the result prior to considering recommending early termination due to efficacy. The timing for the “repeated look” will depend on the expected event rate as well as the number of events that could reverse the boundary crossing. In our experience in trials in cardiovascular disease patients, approximately 2 to 3 months are reasonable to update the data and repeat the analyses. Figure 1 provides the actual implementation steps of the proposed approach.
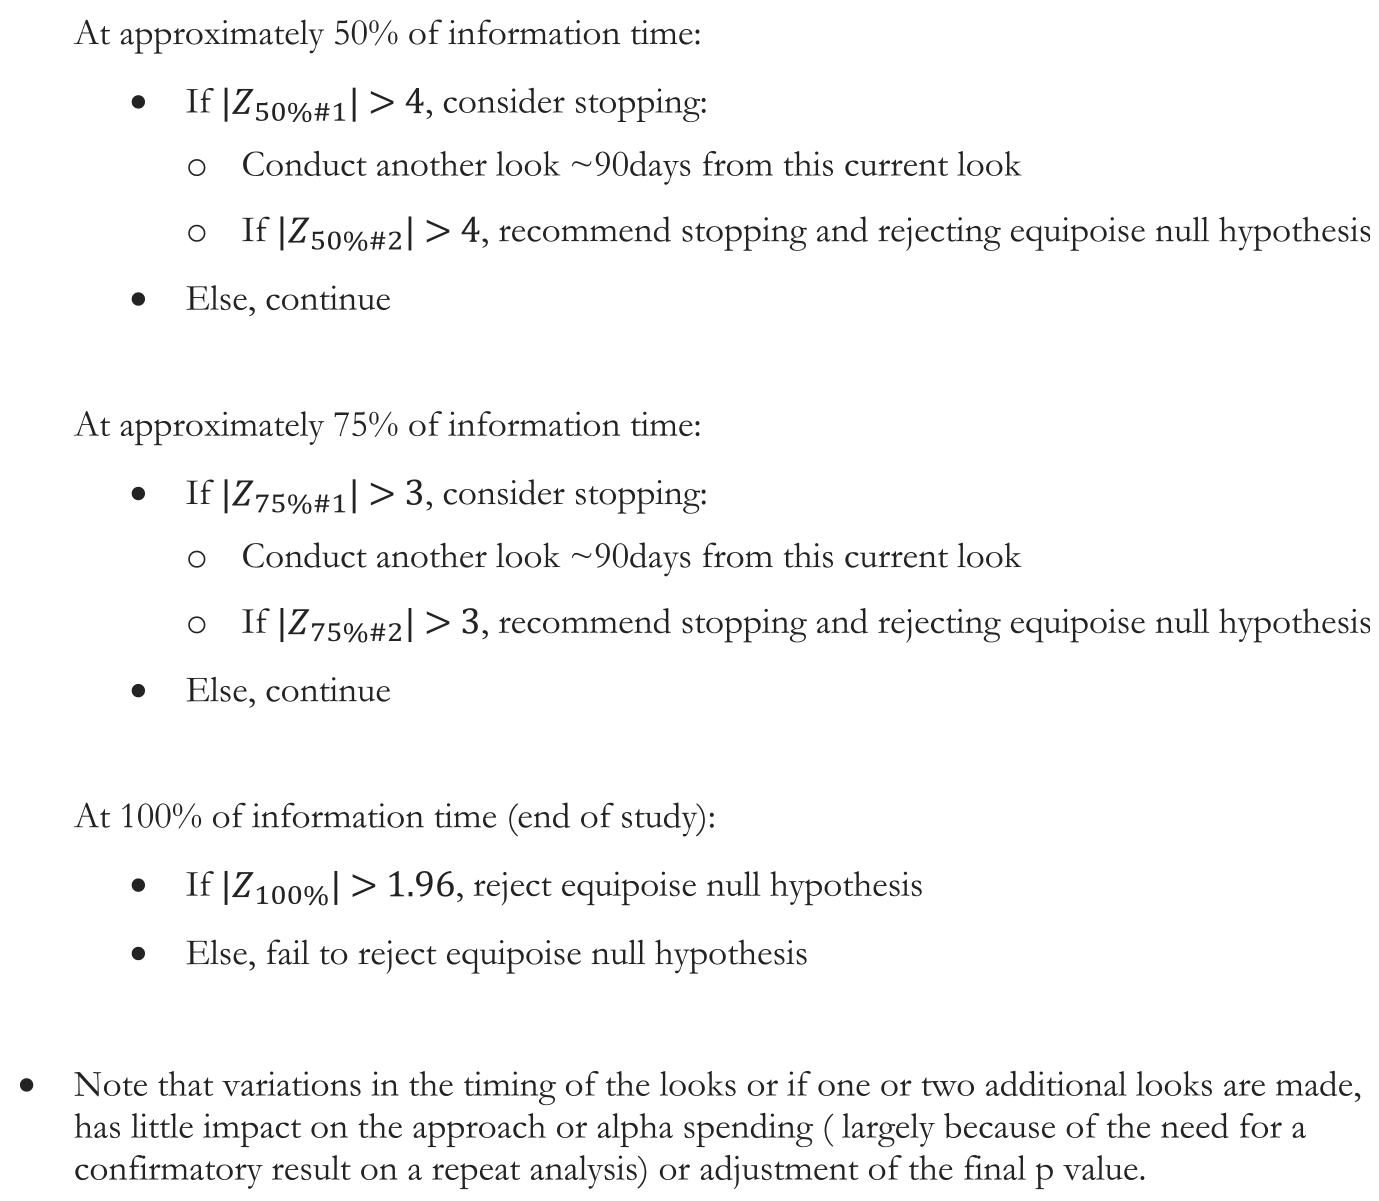
Steps for conducting the proposed monitoring approach.
Protection of overall type I error
Protection of type I error is essential with multiple testing of accumulating data. The Lan–DeMets alpha-spending function allows for calculation of the overall study alpha in the presence of interim analyses. Table 1 provides the Z-score critical values, the nominal alpha and the alpha spent, for the three most common group sequential testing methods, assuming three looks—at 50%, 75% and 100% (end of the study) of the information, plus the “PHRI boundary” and a “stringent PHRI boundary” (both of the PHRI approaches incorporate the potential second confirmatory look at 90 days if a boundary is crossed). All testing approaches control the type I error probability, with the slight exception of the original Haybittle–Peto approach. Our proposed monitoring guideline, the “PHRI boundary,” and the more stringent PHRI boundary both preserve a substantial amount of the overall alpha for the final look. The stringent PHRI boundary even controls well the naïve sum of nominal alphas.
Nominal and group sequential type I error probabilities and the Z-score critical values for five group sequential testing methods, assuming three looks—at 50%, 75% and 100% (end of the study) of the information.
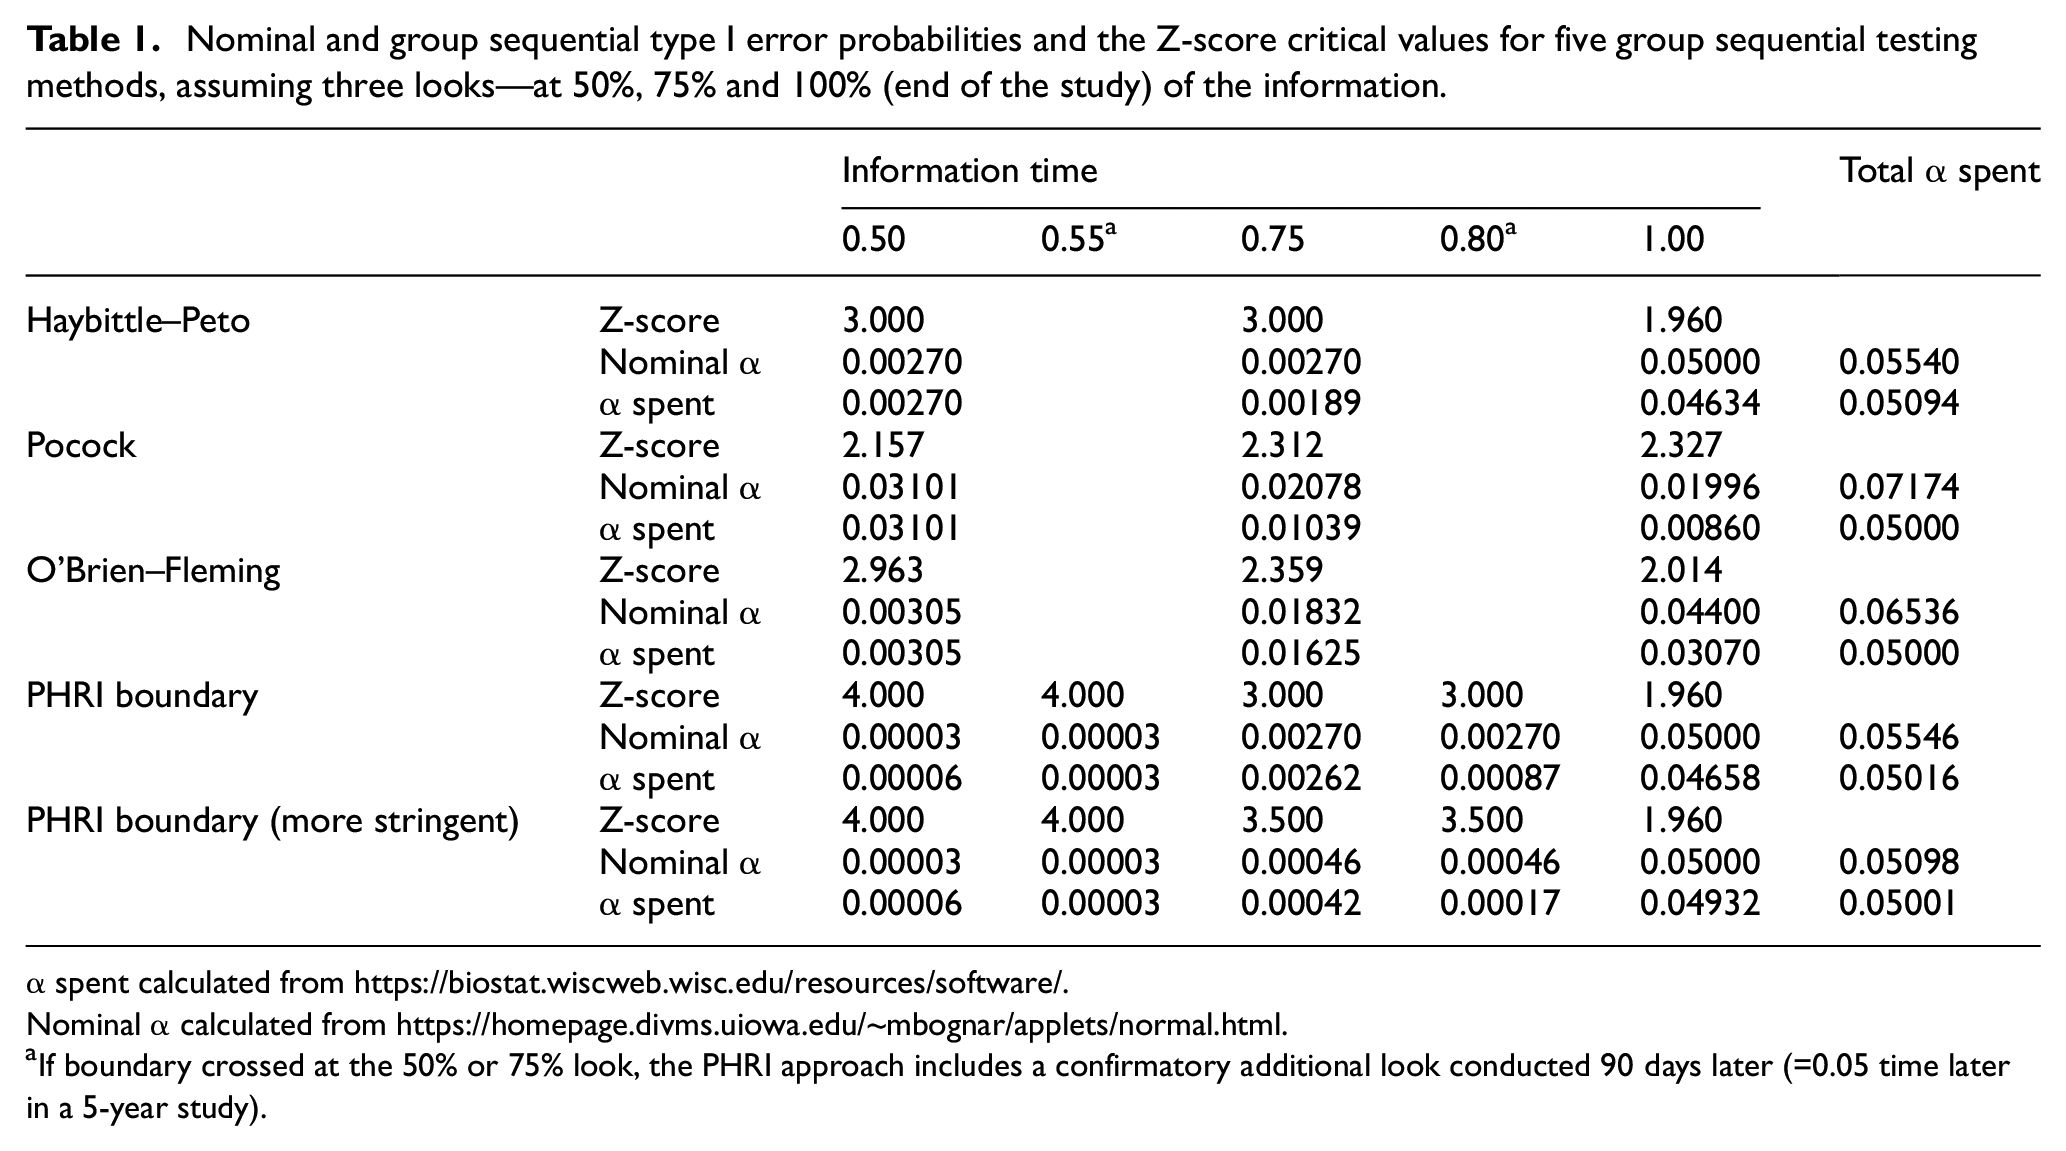
α spent calculated from https://biostat.wiscweb.wisc.edu/resources/software/.
Nominal α calculated from https://homepage.divms.uiowa.edu/~mbognar/applets/normal.html.
If boundary crossed at the 50% or 75% look, the PHRI approach includes a confirmatory additional look conducted 90 days later (=0.05 time later in a 5-year study).
Illustration of the use of the PHRI boundary
The HOPE trial used a two-by-two factorial design to study the effectiveness of ramipril versus placebo and of vitamin E versus placebo. The primary outcome was the time to the first occurrence of myocardial infarction, stroke, or cardiovascular death. The DSMB followed a slightly different PHRI boundary approach, since they had four interim looks, but used the same boundaries—a Z-score critical value of 4 for the first half of the study, and a Z-score critical value of 3 in the second half of the study. They also had respective boundaries to assess whether the treatments being evaluated (ramipril or vitamin E), had a harmful effect, a Z-score of 3 in the first half and a Z-score of 2 in the second half. At the fourth interim look, in the second half of the study, the observed Z-score crossed the efficacy “warning” boundary and triggered a detailed examination of the “totality of the evidence,” 13 looking at consistency of results within components of the composite primary outcome, in pre-specified subgroups, and in an analysis 4 months later to be re-assured that the extreme results were not due to a temporary fluctuation. At 8 months prior to the scheduled end of the trial, the DSMB recommended early termination of the study due to the overwhelming efficacy evidence favoring ramipril over placebo, with an observed Z-score of 4.5. 12 Sometimes, in a long trial, the DSMB may examine the data informally several times. Examination of the data several months earlier had also shown clear evidence (Z > 4.0), thereby confirming that the benefits were clear and not transient.
The COMPASS trials compared rivaroxaban 2.5 mg twice a day plus aspirin 100 mg daily (A) against aspirin 100 mg daily (C) in one trial and rivaroxaban 5 mg twice a day (B) against aspirin 100 mg daily (C) in a second trial, in patients with evidence of significant vascular disease. The primary outcome was the time to the first occurrence of the clinical endpoint of major cardiovascular event, that is, the composite of cardiovascular death, myocardial infarction and stroke. The DSMB followed the PHRI boundary approach. We present the example of the first trial comparing group A versus C, powered with a two-sided 0.05 alpha. At the first formal analysis of efficacy, when roughly 50% of the primary events had occurred, the Z-score for efficacy comparing group A versus group C barely crossed the boundary of 4 (actual value was 4.08). The DSMB repeated the analyses, roughly 90 days later, and the Z-score for efficacy was 4.59 for group A versus group C. 15 After carefully considering that all additional factors supported the benefit of group A over group C, the DSMB recommended termination of the entire study. Note that the second trial comparing group B versus group C, although not considered in the decision about the first trial, was impacted by the decision to stop the first trial. The second trial happened to be nominally significant but did not cross the boundary.
Discussion
This article describes a pragmatic, intuitive and simple approach to monitoring the accumulating efficacy information in two-arm randomized controlled trials—one that is in the spirit of making decisions when the results are robust, and the evidence is beyond reasonable doubt. In this regard, the PHRI boundary has some commonality with both the O’Brien–Fleming and Haybittle–Peto approaches. With the PHRI boundary, very early stopping (when there is less information) is made harder, early stopping is possible when the evidence is substantial and convincing, and the analysis at the end of the study does not pay a high price for the interim looks. It also takes into consideration the typical approach to monitoring of DSMBs, whereby interim efficacy analyses early in the study may not be robust, and so, are rarely considered until substantial information (e.g. proportion of the expected events) has been accumulated, such as midway during the conduct of the trial, and additional looks are taken “to ensure we are not on a random high blip” when a boundary is crossed. Also, a “repeated look” provides time to update the data, as inevitably some events that occurred are not yet known and included in the analyses. DSMBs may not recommend early termination of studies when very close to the scheduled end of a trial. The Systolic Hypertension in Elderly Program (SHEP) trial was not stopped despite convincingly crossing the O’Brien–Fleming boundary; the DSMB recommended that the investigators “consider an orderly and expeditious close-out of the trial” since only 2 months remained before the scheduled end of the trial. 18
The original Haybittle–Peto approach is simple to implement, and authors argued there was little need to adjust the alpha at the final test because of the high Z-value for interim looks. However, there is some inflation of the alpha, which varies by the number of tests, since it allows testing at all time points. The PHRI boundary does not require complex statistical calculations. The PHRI boundary has been mentioned as an “informal” method to deal with the inflation of type I error in the original Haybittle–Peto approach—“Some users … may demand a Z-score of 4 for the first half of the study and 3 thereafter or they may require crossing the boundary at two successive looks.” 20 The Pocock boundaries pay a substantial penalty at the final analysis. The penalty paid by the standard O’Brien–Fleming boundaries is not too large. The PHRI boundaries pay a minuscule, ignorable increase in the overall alpha, so that the reported p-value is very close to the adjusted p-value, which makes the approach practical for non-statisticians.
The PHRI boundary controls the overall alpha, is more intuitive than boundaries that do not account for decreasing uncertainty with increasing information, and adheres to the typical monitoring behavior of DSMBs. The PHRI boundary protects almost all the alpha for the end-of-study analysis, controls the overall type I error, and allows for meaningful early termination of trials with substantial sustained efficacy evidence. The more stringent PHRI boundary even protects the total naïve nominal alpha.
As stated by Canner, 21 “decision making in clinical trials is complicated,” and thus, a statistical decision rule or procedure can never take the place of the careful assessment of all relevant aspects of benefit and harm by the experts in the DSMB. If there is a very large initial effect at an early interim look for a new class of life-saving treatment, the board may not even follow a formal statistical stopping guideline, for example. Arriving at a recommendation is complex, and while statistical considerations and guidelines for interpretation of data may play an important role, they should never be perceived as having a prescriptive role. In stopping a trial, many factors other than the Z-value on one endpoint are usually considered. The statistical boundary is just one element of the evidence that assists in making decisions as regards early termination of a trial, and in our opinion, it should never be the sole basis for stopping a trial. Monitoring boundaries should be thought of as “warning boundaries” rather than “stopping boundaries,” that is, ones that alert the DSMB to do their due diligence in carefully examining the “totality of the evidence” prior to making their recommendation.
Footnotes
Declaration of conflicting interests
The author(s) declared no potential conflicts of interest with respect to the research, authorship and/or publication of this article.
Funding
The author(s) received no financial support for the research, authorship and/or publication of this article.