
Abstract
Background/Aims
Showing “similar efficacy” of a less intensive treatment typically requires a non-inferiority trial. Yet such trials may be challenging to design and conduct. In acute promyelocytic leukemia, great progress has been achieved with the introduction of targeted therapies, but toxicity remains a major clinical issue. There is a pressing need to show the favorable benefit/risk of less intensive treatment regimens.
Methods
We designed a clinical trial that uses generalized pairwise comparisons of five prioritized outcomes (alive and event-free at 2 years, grade 3/4 documented infections, differentiation syndrome, hepatotoxicity, and neuropathy) to confirm a favorable benefit/risk of a less intensive treatment regimen. We conducted simulations based on historical data and assumptions about the differences expected between the standard of care and the less intensive treatment regimen to calculate the sample size required to have high power to show a positive Net Treatment Benefit in favor of the less intensive treatment regimen.
Results
Across 10,000 simulations, average sample sizes of 260 to 300 patients are required for a trial using generalized pairwise comparisons to detect typical Net Treatment Benefits of 0.19 (interquartile range 0.14–0.23 for a sample size of 280). The Net Treatment Benefit is interpreted as a difference between the probability of doing better on the less intensive treatment regimen than on the standard of care, minus the probability of the opposite situation. A Net Treatment Benefit of 0.19 translates to a number needed to treat of about 5.3 patients (1/0.19 ≃ 5.3).
Conclusion
Generalized pairwise comparisons allow for simultaneous assessment of efficacy and safety, with priority given to the former. The sample size required would be of the order of 300 patients, as compared with more than 700 patients for a non-inferiority trial using a margin of 4% against the less intensive treatment regimen for the absolute difference in event-free survival at 2 years, as considered here.
Keywords
Introduction
In many clinical situations, especially in oncology, the standard of care has known efficacy but also untoward effects that make the treatment difficult to tolerate at full dose and schedule. A commonly used strategy is to start therapy at the recommended dose and schedule, and to reduce the dose or extend the schedule when adverse events occur. However, it may be desirable to use a less intensive treatment strategy upfront in frail populations, such as elderly patients, heavily pretreated patients, or patients with comorbidities. In addition, conventional dose-finding trial designs in oncology are based on the concept of maximum tolerated dose, which may identify a dose higher than the most effective dose, especially for targeted anticancer drugs and biologicals. In such cases, the lower dose may be as effective and have less toxicity. For these reasons, it is often necessary to compare a less intensive therapy with the standard therapy, with the hope of keeping similar efficacy while improving the treatment tolerability. Improvements in treatment tolerability can be shown in superiority trial designs, while showing “similar efficacy” of a less intensive treatment requires non-inferiority (NI) trial designs.
A large amount of literature has been devoted to NI trial designs and their inherent difficulties.1–5 In most cases, NI trials have no internal check of “assay sensitivity,” the capacity of the trial to distinguish between an effective and an ineffective therapy. An NI trial without assay sensitivity may in fact declare NI if both treatments are equally ineffective. NI trials are biased toward NI if they are poorly designed and conducted (e.g. due to lack of blinding). All aspects of trial conduct that favor equality between the two randomized treatment groups, for example, a large amount of treatment discontinuations or of patients lost to follow-up, bias the results of an NI trial toward a favorable conclusion of NI. Yet, a review by Wangge et al. 6 showed that elementary precautions against bias are not always implemented in practice; for instance, more than a third of the 232 considered NI trials registered in PubMed did not use blinding. NI trials also rely on an assumption of constancy: the conditions under which the control arm (here, the more intensive treatment) was shown to have efficacy are supposed to still hold. The study of Wangge et al. 6 reported that less than 5% of the NI trials explicitly reported the similarity between the trial and the previous comparator’s trials. Another major difficulty for NI trials resides in the pre-specification of an NI margin: no consensus exists on the choice of the NI margin, and recommendations differ between agencies, for instance between the US Food and Drug Administration and the European Medicines Agency.7,8 Undue emphasis on a statistical calculation of the NI margin leads to complicated methods that depend crucially on the availability of historical data, while an undue emphasis on clinical relevance may lead to “cherry-picking” that leads to attainable sample sizes. In fact, many NI trials do not provide any details on the NI margin. Studies in different settings have shown that only between 20% and 46% of NI trials report the justification for the choice of the NI margin.6,9,10 In addition, most trials do not report the method of determination of the NI margin in a way that allows replicability. An additional difficulty with NI trials is that they impact on evolving standards of care, thereby opening the gate to so-called “biocreep”; this refers to the cyclical phenomenon where a slightly inferior treatment becomes the active control for the next generation of NI trials, which over time may lead to degradation of the efficacy of the standards of care. Moreover, the sample sizes required for NI trials are typically larger than those required to show superiority because the NI margin is typically smaller than the effect one would wish to detect in a superiority trial, and the experimental treatment is typically expected to be slightly inferior to the current standard of care—especially if the experimental treatment is a lower dose or a less intensive schedule of the standard of care, as is our focus here. A review of NI trials of reduced intensity therapies indeed suggested that fewer of these trials demonstrated NI or superiority, as compared with other NI trials. 10 In fact the small deficits typically expected of reduced intensity therapies may not justify the very large sample sizes that would typically be required for formal statistical tests of NI, especially in oncology, where the gains in toxicity may have a substantial impact on the patients’ quality of life.
For all these reasons, NI trials may in some situations be forgone even when there is a pressing need for less intensive treatment schedules. Such is the case in acute promyelocytic leukemia (APL), a rare form of acute myeloid leukemia in which great progress has been achieved since the introduction of targeted therapies, such as all-trans retinoic acid (ATRA) and arsenic trioxide.11,12 This progress allowed for decreased reliance on the previous standard of intense chemotherapy as frontline treatment for APL, with attempts to reduce treatment intensity and enhance tolerability.12–16 Of note, and despite a generally improved tolerability from targeted therapy, toxicity remains a problem, particularly the “differentiation syndrome” associated with the use of ATRA. In APL, several phase 3 trials have used an NI design.12,15–18 Nevertheless, when NI trials are used, “similar efficacy” is usually achieved at the expense of not formally testing the superiority of the tolerability outcomes which often motivate the trial. An alternative approach would be to conduct a superiority trial for tolerability endpoints, with efficacy outcomes presented in secondary analyses. This approach is seldom used in oncology, due to concerns with loss of efficacy, but in one case, it has been used in APL with quality of life as primary endpoint. 19 In this article, we present an alternative to the problem of showing similar efficacy and better tolerability. We propose to use generalized pairwise comparisons of prioritized outcomes to formally analyze efficacy and safety outcomes using a single test statistic. 20 Specifically, the clinical situation addressed here concerns the design of a randomized trial for patients with APL, with the explicit aim of ensuring sufficient power and a single hypothesis testing framework for efficacy and safety outcomes of interest, given the interest of comparing a reduced dose of ATRA with the standard dose.
Methods
Generalized pairwise comparisons and net treatment benefit
The method of generalized pairwise comparisons of prioritized outcomes was proposed to analyze simultaneously as many outcomes of any type as desired, as long as it is possible to ascertain, given a pair of patients taken at random from each group, which of these two patients has a more desirable outcome. 20 For a single outcome, a pair is considered a “win” if the patient treated with the experimental agent has a better outcome than the control patient, a “loss” if the control patient has a better outcome, and a “tie” if the outcomes are clinically similar. For multiple outcomes, the idea consists of prioritizing the outcomes from the most important to the least important and to perform pairwise comparisons on outcomes of successively lower priority until the pair can be called a win or a loss. The order of priority is of course arbitrary, but should be based on clinical judgment, regulatory precedent, and additional scientific considerations. One measure of treatment effect when using generalized pairwise comparisons is called the Net Treatment Benefit (NTB), defined as the population equivalent of the difference between the proportion of wins and the proportion of losses. When the only outcome of interest is a time to event, for example, event-free survival (EFS), the NTB is the net chance of a better EFS. 21 For multiple outcomes, for example, EFS and Grade 3 or 4 toxicities, the NTB captures the net chance of a better EFS or less toxicity. See Appendix 1 in Supplemental Material for further details.
Prioritized outcomes
The outcomes of interest in the present situation were, in order of decreasing priority, and with the favorable outcome shown first within parenthesis:
EFS, considered a binary outcome at 2 years of follow-up (alive and event-free at 2 years versus in relapse or dead by 2 years)
Grade 3/4 documented infections (no versus yes)
Grade 3/4 differentiation syndrome (no versus yes)
Grade 3/4 hepatotoxicity (no versus yes)
Grade 3/4 neuropathy (no versus yes)
Grade 3 and Grade 4 toxicity denote severe and life-threatening events, respectively. By selecting EFS as the first priority, pairs of patients are compared on toxicity outcomes only if the comparison for EFS results in a tie (when both patients of the pair are either alive and event-free at 2 years or in relapse or dead by 2 years). If the EFS values differ for a pair of patients, toxicity comparisons are not performed. This prioritized outcome approach explicitly accounts for any potential degradation of the EFS outcome in the experimental arm. The order of priority chosen for the toxicity outcomes reflects the clinical importance of these outcomes in terms of morbidity, duration of hospitalization, risk of complications, such as infections, inconvenience to the patient, and cost.
Historical data and assumptions for trial design
The proposed trial would compare an experimental treatment (reduced dose of ATRA) with control (standard dose). Parameters used for sample size calculation using generalized pairwise comparisons required assumptions obtained from historical sources. Table 1 shows data on the grade 3/4 types of toxicity from a published cohort of patients treated with ATRA at the Christian Medical Center of Vellore (India) between January 2015 and May 2020, 22 and from four published randomized clinical trials.12,13,23,24
Historical data and assumptions used to justify sample size calculation.
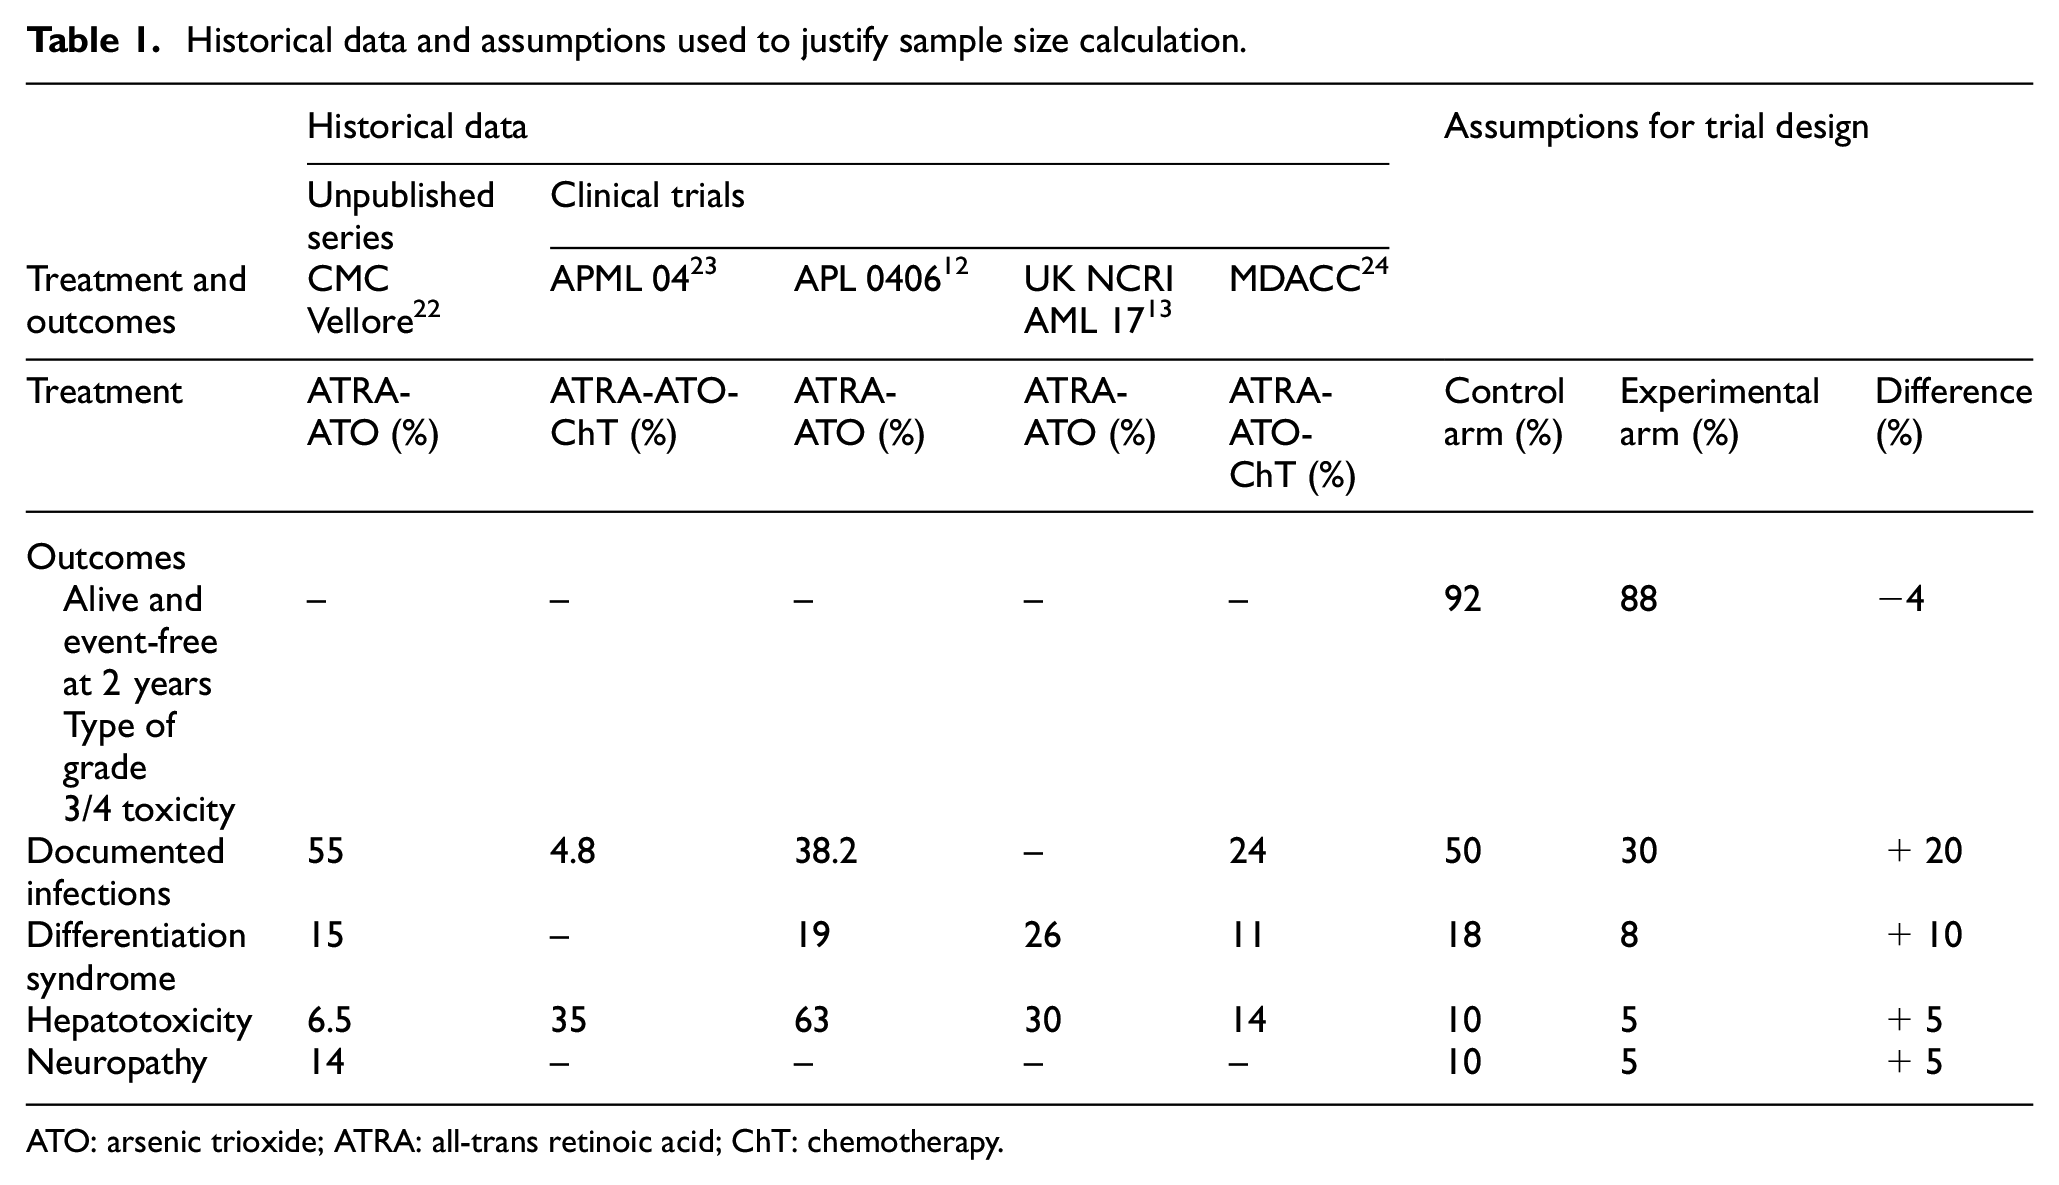
ATO: arsenic trioxide; ATRA: all-trans retinoic acid; ChT: chemotherapy.
Based on historical data shown in Table 1, assumptions for the experimental and control arms were elicited from clinicians with expertise in APL (M.S. and V.M.). The right-hand side of Table 1 summarizes these assumptions.
Testing procedure for NTB
The hypothesis of interest in this trial is:
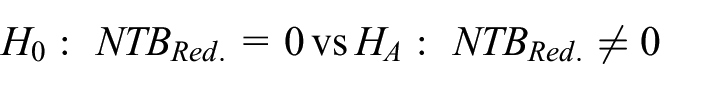
where
Simulations using multivariate distributions
Sample size calculations were performed via simulations. These consisted of generating a large number of trials (10,000) with increasing sample sizes, equally divided between the two treatment groups. For each simulated trial, a p-value was computed based on the asymptotic distribution of the test statistic. The power of the test was calculated as the empirical rejection rate among the simulated trials, with a two-sided
As the procedure accounted for multiple outcomes simultaneously, it was important to account for the dependencies between these outcomes. We used patient-level data of the CMC Vellore trial, to estimate a 5 × 5 odds ratio matrix, where each entry (
Dropouts
The trial design assumed a 10% dropout rate within 2 years. Dropouts only affected EFS because the toxicity outcomes are typically observed very early in the trial, and it was therefore assumed that dropouts would not affect these outcomes. The procedure used to account for dropouts is described in Appendix 2.
Results
Sample size calculations
When considering the dependence structure extracted from historical data, simulation results led to a total sample size of 280 patients (140 per group) for an approximate power of 80% (Figure 1).
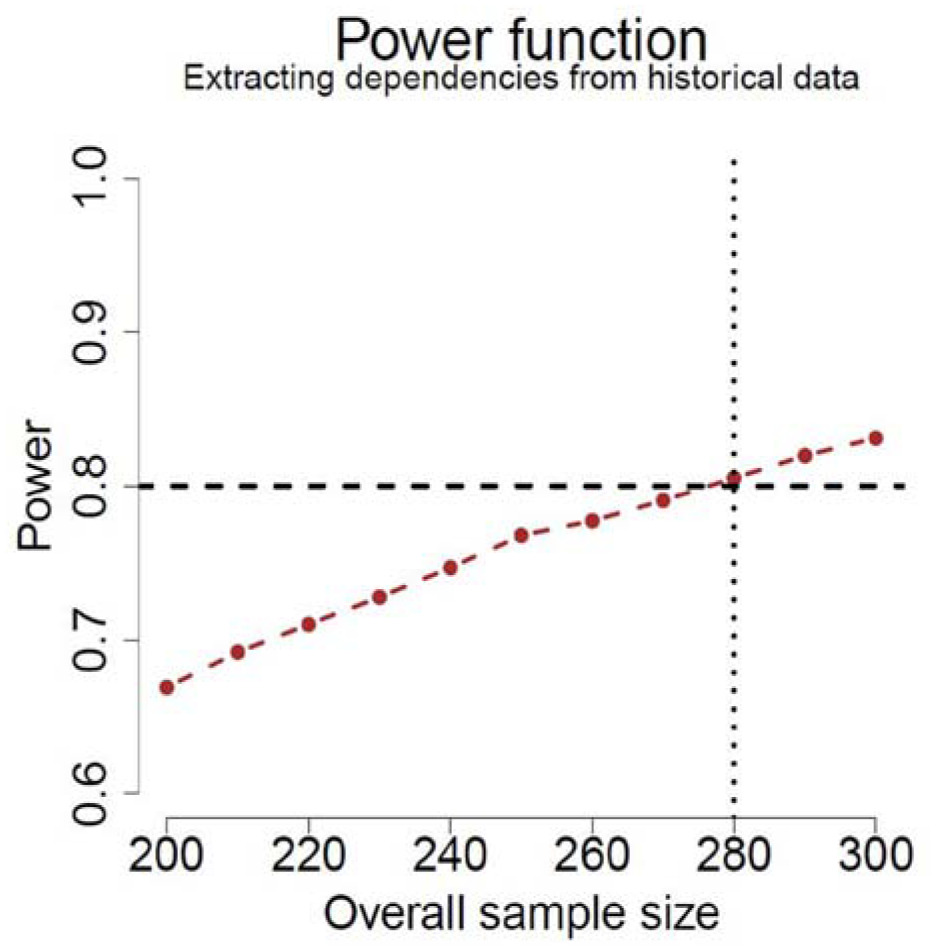
Power as a function of total sample size (equal allocation) for the test using the NTB with the assumptions shown in Table 1, based on 10,000 simulations.
When repeating the simulations assuming no dropouts and complete independence between the outcomes, slightly different sample sizes were obtained (Figure 2). As can be observed from Figure 2, the dependence structure based on historical data leads to a slightly larger sample size (N = 280, Figure 1) than when assuming complete independence (N = 260, right-hand panel of Figure 2). The no-dropout situation also leads to a smaller required sample size (N = 270, left-hand panel of Figure 2), although the decrease in sample size is attenuated by the multiple imputation procedure described in Appendix 2. In contrast, if the missingness in the data had been handled by disregarding all patients with a missing value on EFS, the sample size would have grown to ∼300 (= 270 / (1–10%)).
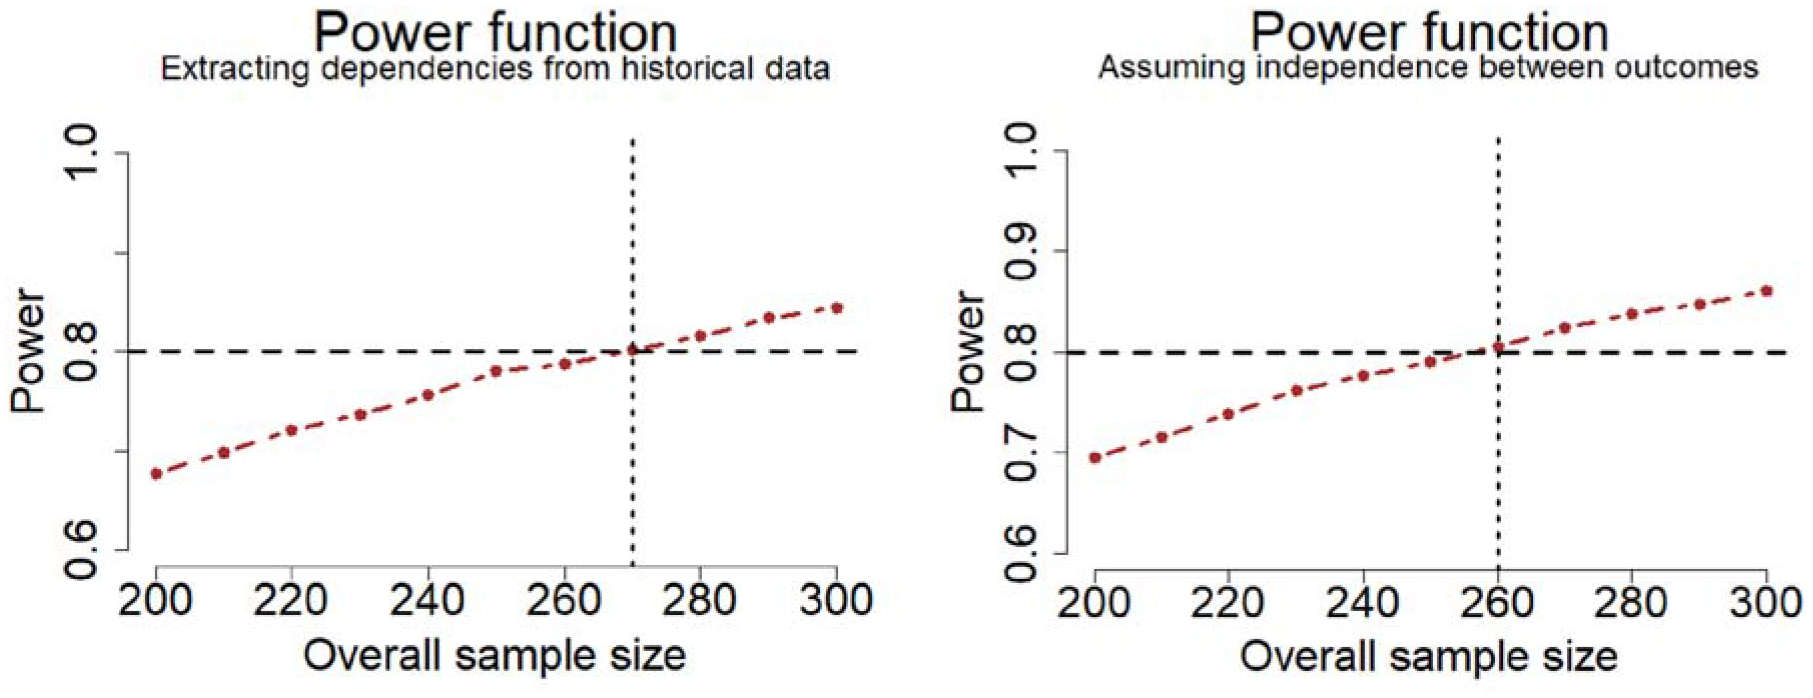
Power as a function of total sample size (equal allocation) for the test using the NTB with the assumptions described in Table 1, based on 10,000 simulations, assuming no dropouts. Left: using the historical data from the CMC Vellore cohort to model dependencies across outcomes. Right: assuming complete independence between outcomes.
NTB
Across all simulations, the NTB expected in the present trial was equal to 0.19 (range −0.06 to 0.40, and interquartile range 0.14–0.23 for sample size N = 280). The NTB is interpreted as a difference between the probability of doing better on the less intensive treatment regimen than on the standard of care, minus the probability of the opposite situation. A NTB of 0.19 translates to a number needed to treat of about 5.3 patients (1/0.19 ≃ 5.3).
Figure 3 shows the evolution of the cumulative NTB value across all prioritized outcomes in a typical simulation. The first bullet represents the NTB for EFS only. The observed value is below 0, which reflects the small deterioration expected (−4%, as shown in Table 1, which is exactly equal to the NTB). The second bullet represents the value of the NTB only accounting for the first two outcomes in calculating the NTB, namely EFS and documented infections. The graph thus shows the evolutive nature of the NTB as more and more outcomes are taken into account and illustrates that a small deterioration in terms of EFS is overcome by the multiple gains on toxicity outcomes. The other curves in Figure 3 show for their part the evolution of different NTBs when one shuffles the order of priorities across outcomes.
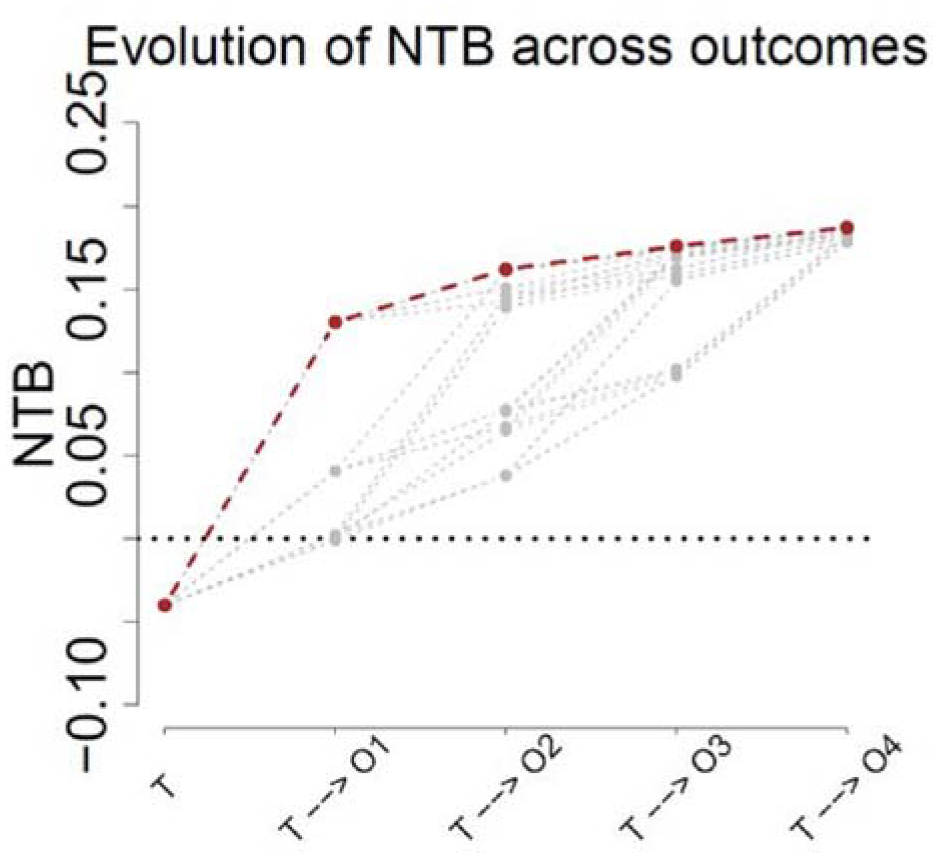
Evolution of the NTB across successive prioritized outcomes. The red curve illustrates the initial ordering in the NTB. The other gray curves illustrate the NTB when the order of the toxicity outcomes is shuffled, leaving EFS as first priority. Notations: T = binary EFS outcome, Oj stands for “Outcome j,” j = 1,...,4, which may be Grade 3/4 documented infections, differentiation syndrome, hepatotoxicity, or neuropathy, depending on the order of priorities.
In particular, while EFS is always taken as first priority, all possible permutations of the ordering for the toxicity outcomes are then considered in the graph. The second bullets starting from EFS thus show four potential scenarios, for the four choices of toxicity that could be considered as second priority in the NTB. The abscissa axis refers to the outcomes composing the NTB, with these being potentially different depending on the order of priorities. In total, shuffling the order of priorities leads to adding 23 extra curves to the graph (not all being distinct as some overlap exists), depicted in gray. The point of interest is to note that, although trajectories vary across outcomes, all potential orderings of the toxicity outcomes lead to an overall NTB that is of the same order of magnitude as the one considered for the design of the trial.
Table 2 presents the typical results expected from generalized pairwise comparisons following the assumptions of the design in the situation N = 280.
Typical table of results of a generalized pairwise comparison (GPC) analysis following the assumptions of the design in the case N = 280.
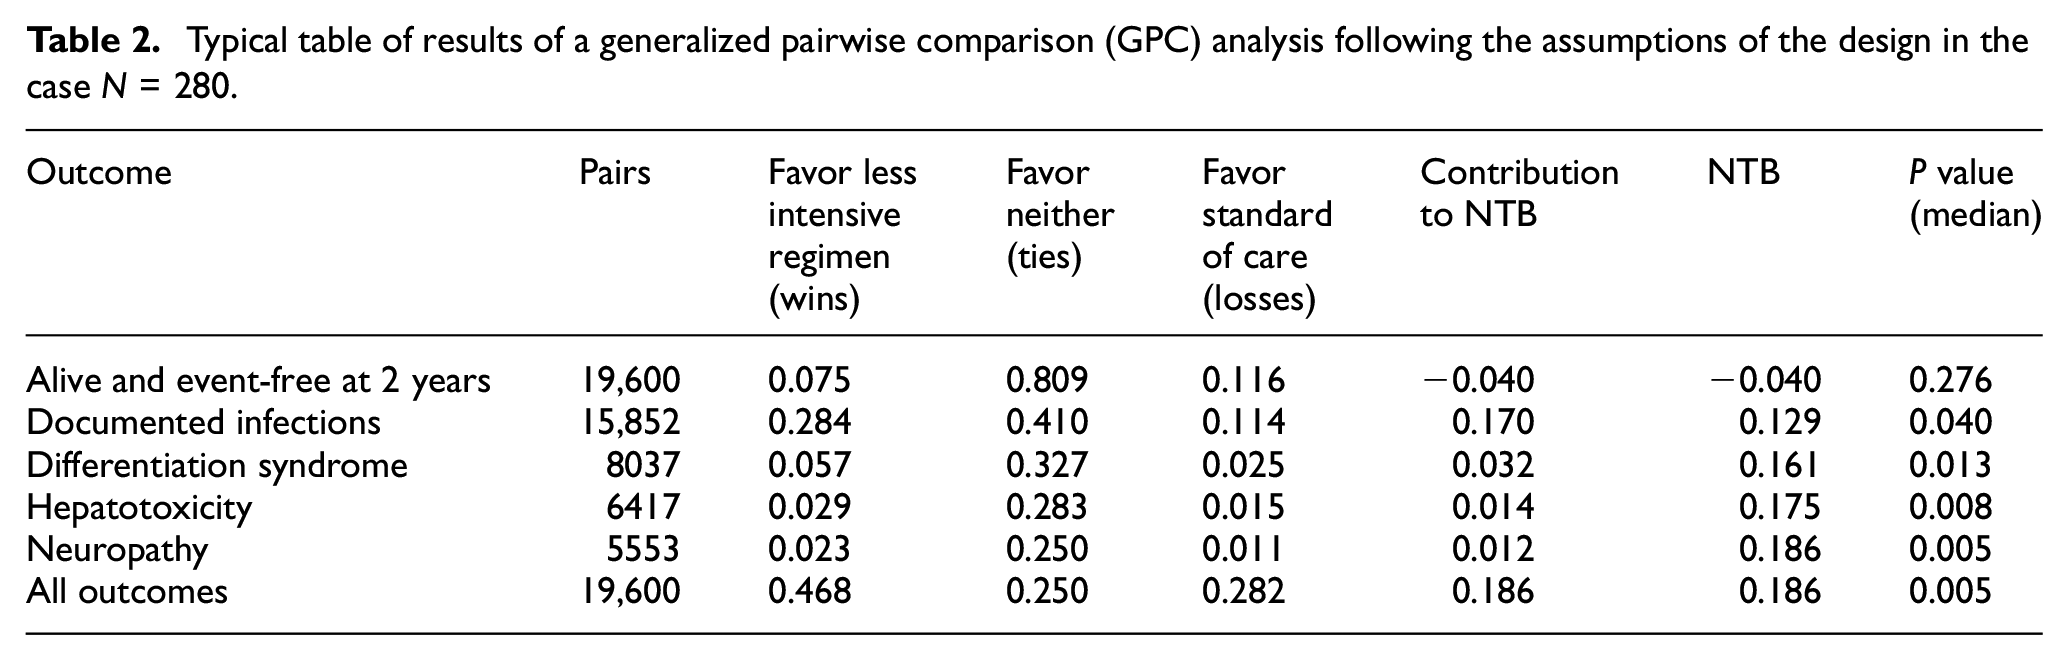
This table is obtained by averaging results over the 10,000 simulations, while p-values are reported by taking the median over all simulations. Each line of the table presents the number of pairs evaluated on the outcome of interest, the proportion of pairs favoring the less intensive regimen (Wins), the proportion of pairs favoring neither the less intensive regimen nor the standard of care (Ties), the proportion of pairs favoring the standard of care (Losses), the contribution of the outcome to the NTB, and the NTB up to the outcome reported in the line, with a corresponding p-value. Figure 4 further helps exhibiting this typical result, by illustrating the classification of pairs graphically at each level of the hierarchical procedure.
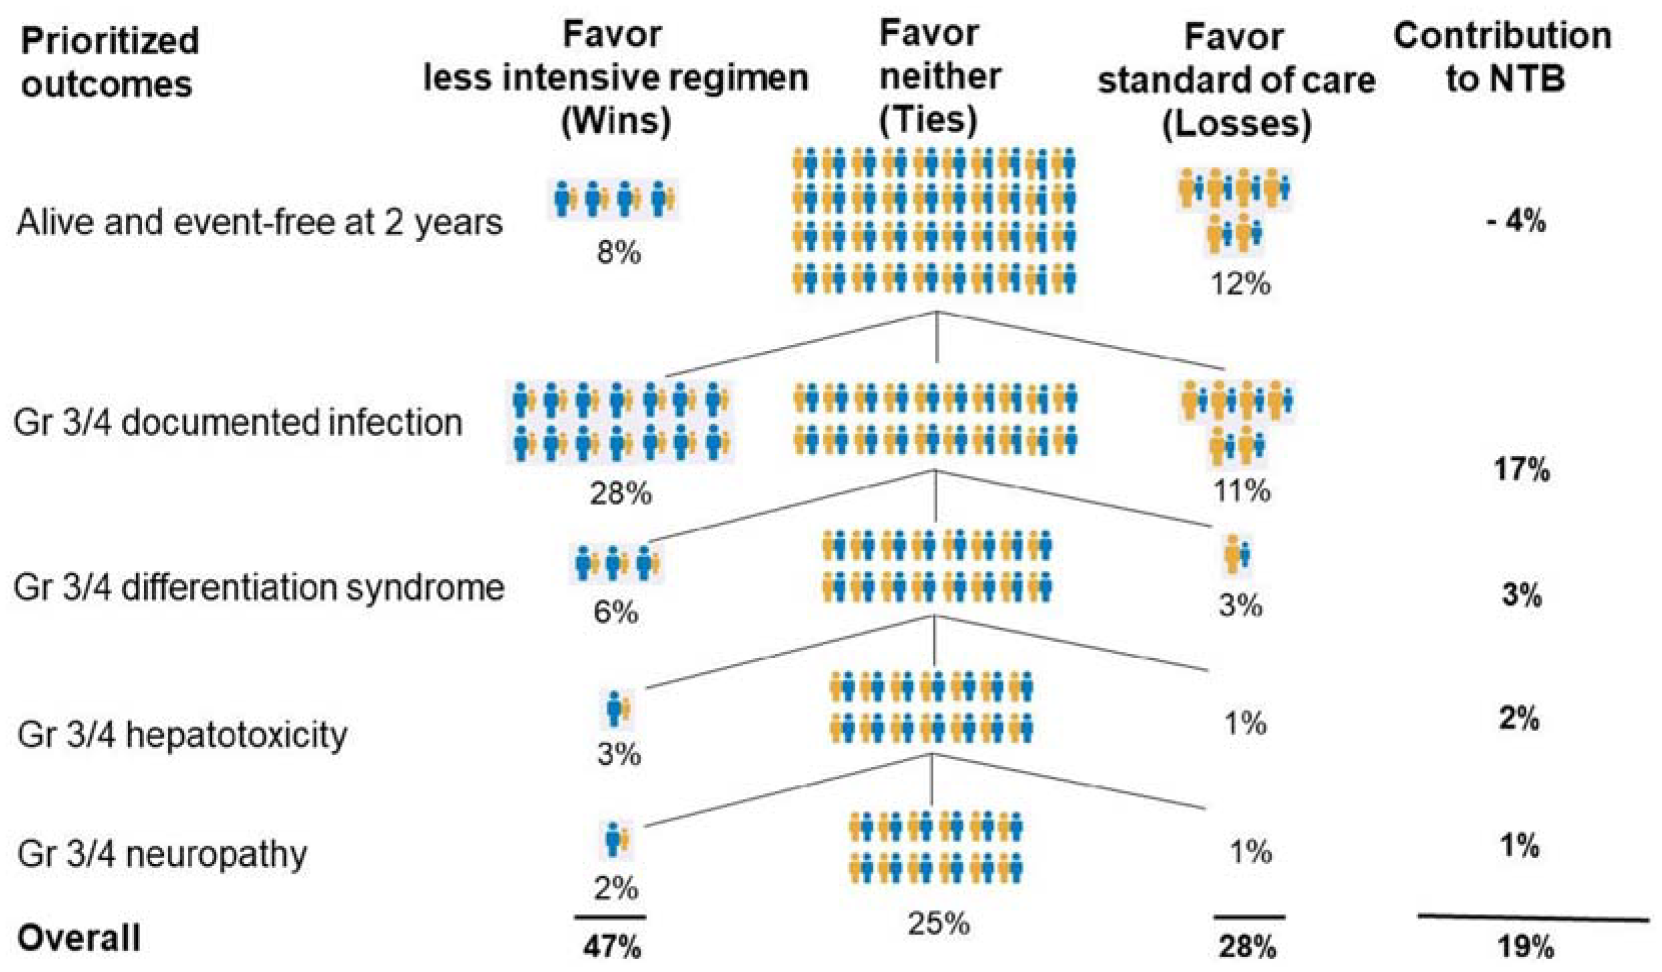
Graphical illustration of the classification of pairs along the hierarchical procedure underlying the NTB. Each level of the prioritized outcomes represents the proportion of pairs classified as either wins, losses, or ties on that particular outcome, in addition to the numerical contribution of the outcome to the overall NTB. Pairs that are classified as ties on one prioritized outcome are evaluated on the next level of the hierarchy of outcomes.
Figure 5 depicts a tipping-point analysis for the assumptions on EFS. That is, with the same order of priorities as in our design, we let the assumptions on EFS in each treatment group vary and calculate the NTBs for each set of assumptions to assess the sensitivity of the balance between efficacy and toxicities in this context.
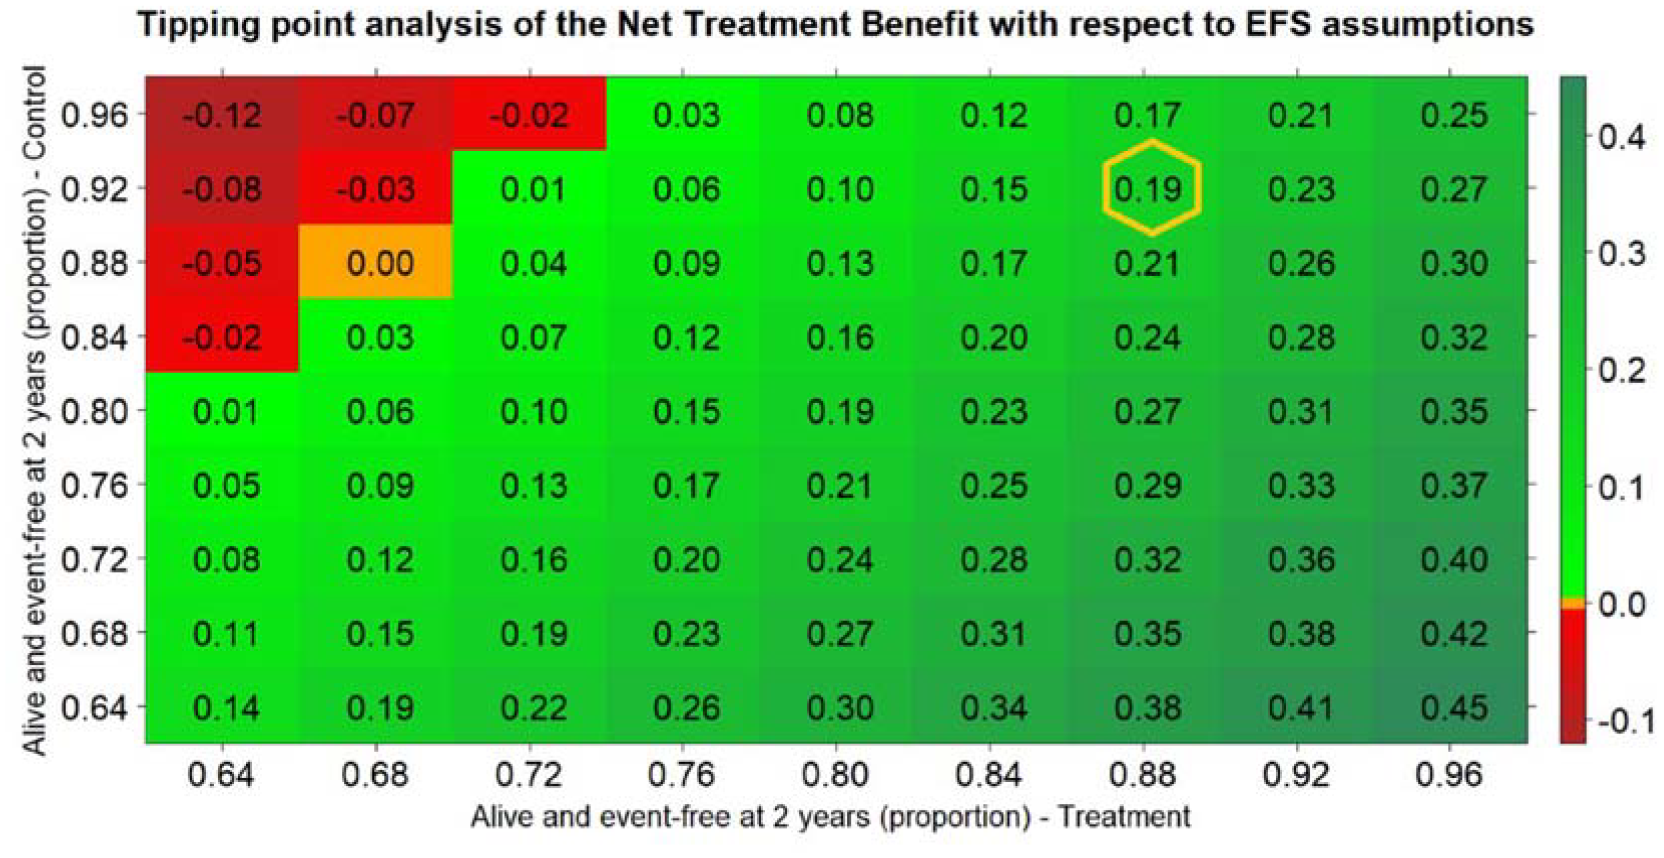
Tipping-point analysis, that is, values of the NTB as a function on assumptions on EFS in both arms, keeping every other aspect of the design fixed. The order of priorities is the one chosen for the design. The NTB is positive (favoring the reduced dose) for situations depicted in green, negative (favoring the standard dose) for situations depicted in red, and zero (favoring neither treatment) for situations depicted in orange. The value of the actual design is highlighted in a yellow hexagon.
Figure 5 shows that, keeping the toxicity and dependencies assumptions fixed, the NTBs will remain positive for a wide range of assumptions on EFS in both groups. And as expected, in scenarios where EFS assumptions are the same in both arms, the NTBs will have decreasing values with higher proportions of EFS events (e.g. on the main diagonal). This is because higher EFS proportions (up to 50%) will result in smaller proportions of pairs declared neutral on EFS, hence decreasing the (positive) contribution to the NTBs of the toxicity outcomes.
Discussion
We have proposed an innovative approach to test a reduction in dose and schedule intensity using an example in patients with APL treated with ATRA, where the need for such a reduction is clinically obvious. The approach is original because it combines multiple prioritized outcomes in a single analysis, with the efficacy outcomes (here, EFS at 2 years) having higher priority, and tolerability outcomes having lower priorities (here, four pre-specified toxicities known to occur with high frequency in this clinical situation). We have used a clinically sensible order of priorities to calculate the expected NTB through simulations, and we have used these simulations to calculate the sample size that would provide 80% power for postulated effects of a less intensive treatment regimen on EFS and the toxicities of interest. Of note, the order in which toxicities are prioritized could be changed according to individual preferences on the part of patient or other stakeholders, such as trialists and regulators. We gauged the impact of changing the order of priorities by calculating the distribution of the NTB across all orders of priority. We concluded that a sample size of about 280 patients would be sufficient to establish the superiority of a less intensive treatment regimen after penalizing this experimental treatment for its potentially lower efficacy.
It should be clear that the approach proposed here is not aimed at replacing NI trials. In situations where NI must be established beyond a reasonable doubt, there is no alternative to conducting an NI trial with a prespecified, acceptable NI margin. In such trials, for a time to event, such as EFS, the upper limit of the hazard ratio’s confidence interval would have to be below the NI margin. Although this approach is theoretically feasible in all cases, the sample size required for a well-powered NI trial may be prohibitive. In our example, if a one-sided significance level of 5% was used, and 80% power was required to establish the NI of the less intensive regimen, with a margin of 4% (absolute difference in EFS rates at 2 years), assuming the two treatments have an identical 2-year EFS rate of 92%, at least 700 patients would be required and 140 events observed after 7 years of follow-up. Note that the margin of 4% as an absolute difference in 2-year EFS translates to a hazard ratio of about 1.5, which is already a large margin as it means a 50% increase in the risk for the patients to have a disease recurrence or to die within the first 2 years. Such an NI trial is clearly much more challenging to conduct, especially for a relatively rare disease, such as APL. If the NI trial was attempted anyway, there would be a high risk of early termination due to lack of sufficient accrual, or of the question becoming obsolete before the trial is completed.
In the approach adopted here, EFS is analyzed as the first outcome, and a test of hypothesis can be conducted on this outcome alone if desired, but that is not the goal pursued. Instead, we are here in a situation in which clinical investigators will consider the point estimate of the EFS difference and its 95% confidence limits to assess whether the deficit in EFS remains acceptable, given the benefits in toxicity. It should be acknowledged, however, that the 95% confidence limits of the EFS difference will generally be too large to exclude potentially substantial deficits (or benefits) of the experimental treatment. Hence, the approach is only appropriate if such large deficits can be a priori excluded, for instance, if there is pharmacokinetic or pharmacodynamic evidence that the reduced treatment dose is very likely to have similar efficacy.
Another limitation of the approach proposed is that it depends crucially on the duration of follow-up of the study. Indeed, all toxicities occur within a few weeks after starting therapy, whereas the efficacy benefits of treatment occur over a longer period of time. If clinicians wish to focus only on efficacy, the traditional approach of conducting an NI trial using the EFS hazard ratio remains the gold standard. Under the assumption of proportional hazards, the trial can be analyzed at any time during the follow-up since the hazard ratio is assumed constant over time. In contrast, if clinicians or patients are interested in the trade-off between small deficits in efficacy as compared to benefits in tolerability, a time horizon must be specified for the NTB to be estimated. The NTB is an absolute measure of net treatment effect that can complement other commonly used measures, including the hazard ratio. 28 For binary outcomes, such as toxicities, the NTB is equal to the difference in the probability of having the toxicity in the experimental arm and in the control arm. For a time to event, such as EFS, it is the difference in the probability of being alive and event-free in the experimental arm and in the control arm within a pre-specified time horizon. For rare events (say, those that occur in less than 20% of the patients during the follow-up time considered), a test for the difference in probability is almost as powerful as a logrank test that takes the time to these events into account. 29 In the clinical situation considered here, 2 years was deemed an adequate follow-up period, given that recurrences past this point are very rare in APL. Given that less than 10% of patients with APL have a recurrence within 2 years, EFS can be considered a binary outcome without much information, but in general EFS is best analyzed as time to event variable. In some situations, the duration of follow-up may be driven by the time course of the events (for example, in the adjuvant treatment of colorectal cancer, almost all recurrences occur within 5 years, whereas in hormone receptor-positive breast cancer, they continue to occur more than a decade after randomization). In other situations, the duration of follow-up may be imposed by practical constraints, such as dropout rates or availability of resources for long-term follow-up.
The main advantage of the approach proposed is that all relevant outcomes of any type (time to event, binary, continuous) can be included in a single analysis. This feature of the analysis opens up the possibility of adding patient-reported outcomes in the analysis. It is worth noting that the correlation between the outcomes is automatically taken into account in the analysis, which is desirable to distinguish between toxicities that are correlated with efficacy versus those that are independent of efficacy, and as such less acceptable. 30 The overall NTB can be decomposed into the additive contributions of all outcomes considered, which is extremely useful clinically. In the example discussed here, the NTB for EFS alone would be shown as the first outcome of interest, followed by the additional contributions of the NTB due to toxicities, conditional on efficacy being the same. Such a decomposition of the NTB is potentially quite useful in dialogues about treatment options with patients.
Supplemental Material
sj-docx-1-ctj-10.1177_17407745231206465 – Supplemental material for Design of a clinical trial using generalized pairwise comparisons to test a less intensive treatment regimen
Supplemental material, sj-docx-1-ctj-10.1177_17407745231206465 for Design of a clinical trial using generalized pairwise comparisons to test a less intensive treatment regimen by Mickaël De Backer, Manju Sengar, Vikram Mathews, Samuel Salvaggio, Vaiva Deltuvaite-Thomas, Jean-Christophe Chiêm, Everardo D Saad and Marc Buyse in Clinical Trials
Footnotes
Declaration of conflicting interests
The author(s) declared no potential conflicts of interest with respect to the research, authorship, and/or publication of this article.
Funding
The author(s) disclosed receipt of the following financial support for the research, authorship, and/or publication of this article: This work was supported, in part, by the Government of Wallonia, Belgium (Grant No. BioWin Consortium Agreement No. 7979).
Supplemental material
Supplemental material for this article is available online.
References
Supplementary Material
Please find the following supplemental material available below.
For Open Access articles published under a Creative Commons License, all supplemental material carries the same license as the article it is associated with.
For non-Open Access articles published, all supplemental material carries a non-exclusive license, and permission requests for re-use of supplemental material or any part of supplemental material shall be sent directly to the copyright owner as specified in the copyright notice associated with the article.