
Abstract
Due to the many benefits of understanding treatment effect heterogeneity in a clinical trial, an exploratory post hoc subgroup analysis is often performed to find subpopulations of patients with conditional average treatment effect that suggests better treatment efficacy than in the overall population. A naive re-substitution approach uses all available data to identify a subgroup and then proceeds with estimation and inference using the same data set. This approach generally leads to an overly optimistic estimate of conditional average treatment effect. In this article, in a post hoc analysis, we estimate the target optimal subgroup through maximizing a utility function, from candidates systematically identified with a penalized regression. We then compare two resampling-based bias-correction methods, cross-validation and debiasing bootstrap, for obtaining approximately unbiased estimates and valid inference of conditional average treatment effect in the identified subgroup, with either an empirical or an augmented estimator. Our results show that both the cross-validation and the debiasing bootstrap methods reduce the re-substitution bias effectively. The cross-validation method appears to have less biased point estimates, smaller standard error estimates, but poorer coverages than the debiasing bootstrap method when using the empirical estimator and the sample size is moderate. Using the augmented estimator in the debiasing bootstrap method leads to less biased point estimates but poorer coverages. We conclude that bias correction should be a part of every exploratory post hoc subgroup analysis to eliminate re-substitution bias and to obtain a proper confidence interval for the estimated conditional average treatment effect in the selected subgroup.
Background
The efficacy of a treatment may vary substantially among patients by their baseline biomarkers including laboratory values and socio-demographic variables, so a favorable average treatment effect for all patients from a randomized clinical trial (RCT) often does not translate to equally favorable benefits to each individual. Due to this natural heterogeneity of treatment effect within a patient population, there has been a rising need in the clinical trial community for a data-driven evaluation of patient subgroups to identify those that would benefit the most from a treatment. At the end of a RCT, in addition to the conventional objective of establishing an overall efficacy of the treatment, a post hoc subgroup discovery analysis is now more frequently performed to investigate the conditional average treatment effect (CATE) of promising patient subpopulations so that patient subgroups—clearly defined in terms of predictive covariates—with likely more pronounced and favorable responses than the population could be identified. 1 This practice has the benefits of optimizing design, sample size allocations, and the power of future trials where confirmatory subgroup analyses can be performed rigorously with these identified subgroups being prespecified while aiming at controlling the Type I error rate.2,3 In addition, patients not belonging to the identified subgroups can be kept from exposure to potentially harmful side effects.
There are two phases in a subgroup analysis procedure: identification and confirmation. The goal of the identification phase is to select a desired subgroup from a collection of candidate subgroups. Many subgroup identification methods have been proposed.2,4,5 The selection criteria vary across the methods, depending on the predetermined targets—maximizing CATE, a utility function that takes into account the “treatment burden,” predictive power of future trials, or the value function of the optimal treatment assignment rule.1,2,4–14
In this article, we assume that a subgroup identification method has been previously selected for analysis and focus on the confirmatory phase. The goal of the subgroup confirmation phase is to obtain unbiased estimates and reliable inference of CATEs in the identified subgroups, also known as “honest” estimates. 2 These are typically obtained with additional test data not used for subgroup identification, but such luxury is uncommon in RCTs. A naive re-substitution approach often employed by investigators is to simply identify the subgroups from the whole sample and proceed to inference, not considering that the subgroup with the best treatment effect (or a function of the treatment effect) was selected. This practice often leads to over-optimism and false discoveries.15,16 Since the results from subgroup analyses are often used in designing future confirmation trials and guiding practitioners to make informed treatment decisions, biased estimation of CATEs would lead to waste of resources and potential harm to patients. This is particularly true with the naive re-substitution method, where over-optimism in estimation of CATEs may lead to underpowered future studies.
When no independent test datasets are available, within the frequentist framework, resampling-based approaches—those involving cross-validation, bootstrap, and permutation—may often be the only feasible methods. 2 They often involve replicating the entire subgroup identification strategy, including estimation of any data-driven tuning parameter, in each resampled dataset. Foster et al. 17 proposed several resampling-based approaches and compared their performances with the naive re-substitution approach. They found a bias-corrected estimate based on nonparametric bootstrap to be the most promising. It was later noted, however, that using a bootstrap-based approach would introduce bias in the direction of pessimism. 2 Fuentes et al. 18 proposed the partition of sample space induced by order statistics to obtain a closed form expression for the coverage probability which allows for the construction of asymmetric intervals considering the selection procedure. However, this method requires patient subpopulations to be independent and normality distributed with a common variance, which can be a strong assumption to make. In general, most of the proposed estimators in literature are heuristic in nature and lacking in theoretical justifications. Their validity needs to be assessed by simulation under each individual setting. 19 Empirical or fully Bayesian methods provide attractive alternatives, but we limit our discussion to the frequentist framework in this article.20–31
In this article, we focus on the subgroup confirmation phase when no independent test dataset is available. We compare two existing and easily implementable bias-correction methods which can provide an approximately unbiased estimate of CATE and valid confidence interval (CI) for statistical inference on the selected subgroup. This work was motivated by the Precision Interventions for Severe and/or Exacerbation-prone Asthma (PrecISE) study (ClinicalTrials.gov Identifier: NCT04129931). PrecISE is a clinical trial to investigate five novel therapies for patients with severe asthma. 32 The treatments in PrecISE were selected to be likely to work in certain subgroups of patients rather than in all patients with severe asthma. One of the objectives of PrecISE is, in a post hoc analysis, to estimate and evaluate subgroups of patients who benefit the most from a given treatment. The post hoc subgroup estimation in PrecISE is performed using all available data due to relatively modest sample size. In the post hoc analysis, the optimal subgroup is defined as a subgroup which maximizes a utility function that provides a trade-off between subgroup prevalence and CATE. This optimal subgroup is estimated through selecting the subgroup that maximizes the estimated utility from a pool of promising candidates systematically identified from fitting a penalized regression that incorporates covariates of interest and thresholding the estimated linear predictors.
In this article, we aim to address the following question: what method can be used to give an unbiased estimation of CATE and to perform inference in the selected subgroup? To answer this question, we compare two methods: (1) a cross-validation (CV) approach to correct the re-substitution bias, with a bootstrap procedure to estimate the standard error for inference,14,15 and (2) a model-free and asymptotically sharp debiasing bootstrap inference procedure proposed by Guo and He who provide theoretical justifications. 33 To improve the efficiency of estimation without compromising the consistency, we consider not only the standard empirical estimator but also an augmented estimator with the doubly robust property established in the field of causal inference.34–36
The rest of this article is organized as follows. In the “Methods” section, we formulate the problem, explain the definition of the optimal subgroup, describe the subgroup identification method, provide the forms of the estimators, and give a brief overview of the two bias-correction methods. In the “Results” section, we evaluate the finite-sample performance of both empirical and augmented estimators in these two bias-correction methods through a Monte Carlo simulation study. In the “Discussion” section, we summarize our work and give concluding remarks.
Methods
Problem setting
Consider a parallel group clinical trial, where
The fundamental goal of causal inference is the comparison between the observed outcome under one regime and the counterfactual outcome that would have been observed under the other regime.37,38 Within this framework, the average treatment effect is formulated as
Defining the optimal subgroup
In PrecISE, the goal is to find a subgroup with a good balance between subgroup size and CATE, as we do not want to expose patients unnecessarily to treatment unless there is a sufficient benefit. We define the optimal subgroup
Subgroup identification method
We identify the optimal subgroup using the following steps:
In the original dataset, with a slight abuse of notation, propose a set of
Estimate
In this section, we provide a description of a subgroup identification method designed to propose the set of candidates
For a continuous outcome
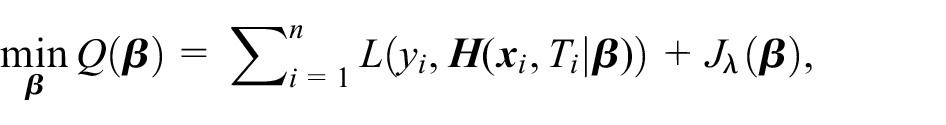
where
Since
Supposing that the total
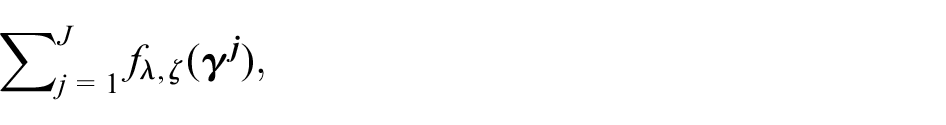
where
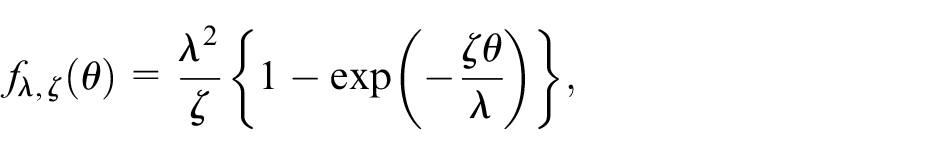
with regularization parameter
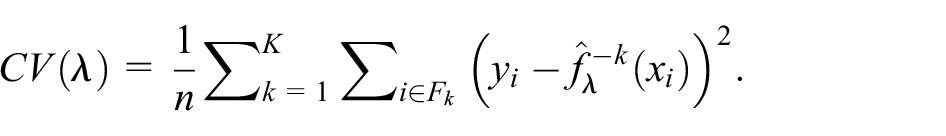
For our analysis, we obtain the optimal
After fitting the penalized regression, a set of estimated linear predictors,
Types of estimators
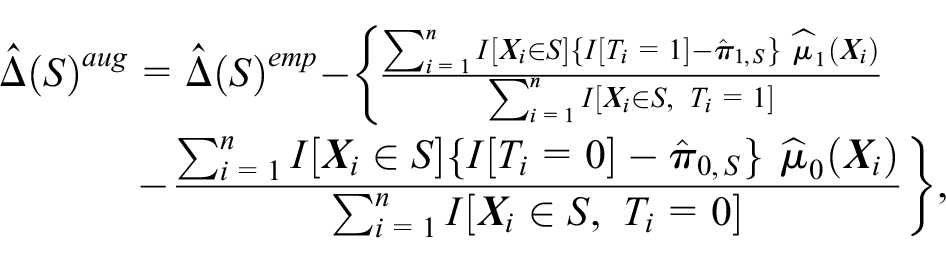
Once we have the estimated optimal subgroup
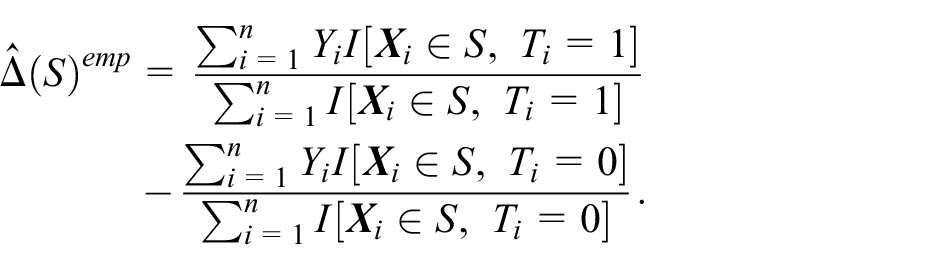
Note that for brevity, we use the generic subgroup notation
where
Bias-correction methods
In the subgroup confirmation phase, we apply the following two bias-correction methods to debias either the empirical estimator
CV method. Proposed by Freidlin and colleagues15,47,48 this method is a CV extension of their adaptive signature design and has been shown to considerably improve its performance. They propose to use
We execute the CV method in the subgroup confirmation phase with the following procedure:
Randomly partition the original dataset into roughly equal-sized
For each
Create a nonparametric bootstrap sample
Debiasing bootstrap method
Guo and He proposed a resampling-based bias-correction method that takes the selection process into account to address subgroup selection bias, but without the need of repeating the entire subgroup identification strategy in each resampled dataset.
33
The proposed method uses a bootstrap procedure to learn about the bias and to construct a one-sided level
We execute the debiasing bootstrap method in the subgroup confirmation phase with the following procedure:
Assume the observed data consist of
Create a nonparametric bootstrap sample
Obtain the debiased estimator of
Guo and He also proposed a CV procedure to adaptively select the tuning parameter
We do note that the proposed method in Guo and He
33
is developed to be theoretically valid for predefined candidate subgroups and post hoc identified candidate subgroups defined over a given space, while in our implementation the candidate subgroups are identified from the same data which might induce additional bias. To fully investigate the impact of this difference, we considered two additional settings for the empirical estimator: (1) evaluate the set of candidate subgroups
Results
We use Monte Carlo simulations to evaluate the finite-sample performance of the two bias-correction methods in terms of bias and empirical coverage of the estimated CATE. In each simulation trial, we generate patients’ covariates matrix
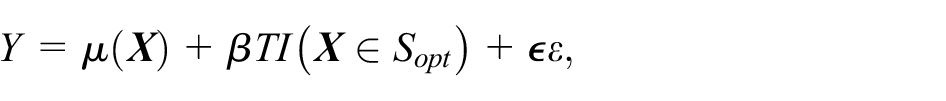
Where
We choose
Scenario 1:
Scenario 2:
Scenario 3:
where
For each scenario, we run 1000 simulation trials, each with a moderate sample size of 400. We run an additional set of 1000 trials for scenario 3, with a much larger sample size of 2000. In each trial, we analyze the data using the procedure described in the subgroup identification section: fit the working model, obtain a set of candidate subgroups, and then proceed to estimate
To obtain naive estimate of utility, we apply this procedure to the whole sample and proceed to point estimation and inference without any adjustment. To obtain CV estimate of utility, we apply the CV bias-correction method with 10-fold to the original sample for fold-average estimation and its 100 bootstrap samples for bootstrap standard error. To obtain debiasing bootstrap estimate of utility, we apply the debiasing bootstrap method to the whole sample and its 100 bootstrap samples for debiased estimation and confidence limits. For the adaptive selection of the tuning parameter
To compare these three sets of estimates and to assess the finite-sample performance of the methods, we create an external validation sample of size 20,000 from the same distribution, independent from the original sample, and on which the same process to obtain naive estimates is repeated, except for treating
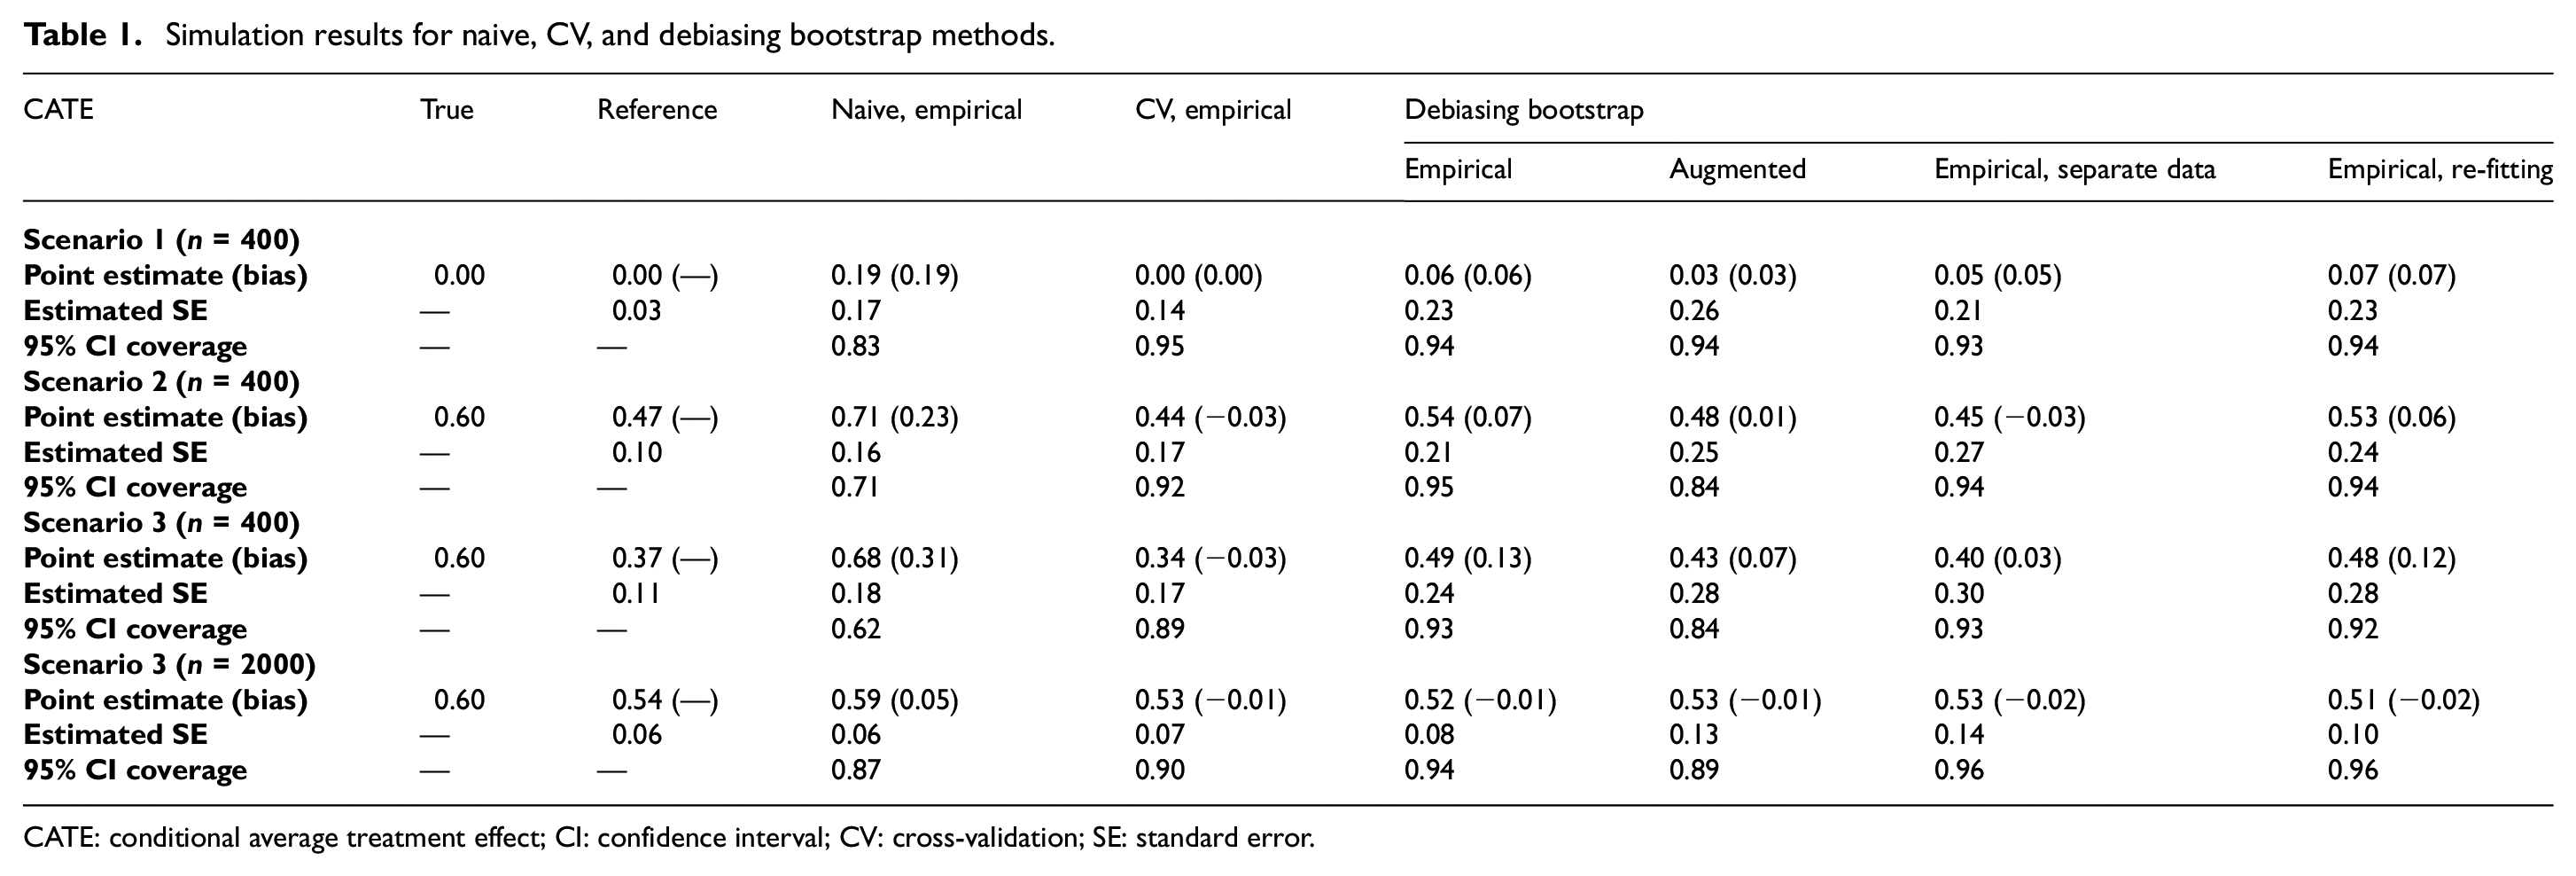
Table 1 summarizes the simulation results in terms of the empirical means of point estimation, bias, estimated standard errors, and the empirical 95% CI coverage. The true CATE is shown under “True.” The reference estimates are shown under “Reference.” We present results of the naive empirical estimates, the CV empirical estimates, the debiasing bootstrap empirical estimates, and the debiasing bootstrap augmented estimates. In addition, we present results from two debiasing bootstrap variations: empirical estimates with separate data and empirical estimates with re-fitting. We do not include augmented estimates for naive and CV methods because they do not show improvement in performance compared with their empirical counterparts. The biases in point estimates and empirical 95% CI coverages for these methods are calculated using the reference point estimate as the truth.
Simulation results for naive, CV, and debiasing bootstrap methods.
CATE: conditional average treatment effect; CI: confidence interval; CV: cross-validation; SE: standard error.
First, we note that the reference estimates are close to the true values and with very small estimated standard errors in scenario 1 when there is no treatment effect heterogeneity. As scenarios increase in complexity (scenarios 2 and 3), the reference estimates gradually deviate from the true values as
Next, we compare the bias-correction methods. In terms of point estimation, all methods do correct the re-substitution bias, as seen in scenario 3 (n = 2000) where the biases are close to 0. However, with smaller sample size (n = 400), there are noticeable differences in their finite-sample performances. The CV method appears to be less biased than the debiasing bootstrap method, and its estimates are slightly biased in the negative direction, suggesting that the CV method has the tendency to over-correct. The estimates from the debiasing bootstrap method, on the contrary, are slightly biased in the positive direction. It appears that the bias in CV method is less affected by the complexity of scenarios—as seen in the same −0.03 bias in both scenarios 2 and 3. The bias in debiasing bootstrap method greatly increases in complex scenarios as indicated by the increase in bias from 0.07 to 0.13 with the empirical estimator and from 0.01 to 0.07 with the augmented estimator. Using separate data or using the augmented estimator instead of the empirical estimator in the debiasing bootstrap method reduces the bias substantially. Re-fitting the outcome model in the bootstrap sample does not appear to reduce bias in the empirical estimator. In terms of efficiency, the CV method appears to be the most efficient (smallest estimated standard errors) across all scenarios. The debiasing bootstrap method is less efficient than the CV method, with the augmented estimator having slightly larger estimated standard errors than the empirical estimator. Re-fitting the outcome model appears to lead to slightly worse efficiency with more complex scenarios. This is likely due to the mis-specified working model. Our working model is very different from the model used to generate the data. This results in unreliable regression-based estimator, which appears to have a negative impact on the augmented estimator.
In terms of inference, the empirical coverages for the debiasing bootstrap empirical estimates are close to the nominal level in all scenarios. The empirical coverages for the CV empirical estimates drop to around 0.90 in scenario 3—increasing the sample size to 2000 does reduce estimated standard errors by half and causes a small increase in coverage from 0.89 to 0.90. The empirical coverages for the debiasing bootstrap and augmented estimates drop to around 0.85 in scenario 2 and scenario 3—increasing the sample size to 2000 does reduce estimated standard errors by half and improve the coverage from 0.84 to 0.89. Inference with CV empirical estimates and with debiasing bootstrap empirical estimates are affected by the complexity of scenarios—they both experience a slight drop in coverages comparing scenario 2 and scenario 3 (n = 400). The coverages for debiasing bootstrap augmented estimates are not affected. Increasing the sample size does improve the performance of all bias-correction methods. These methods appear to provide unbiased point estimation and correct inference asymptotically.
Discussion
Subgroup identification and subsequent subgroup confirmation are the two integral parts in any post hoc subgroup analyses of clinical trials. Consistently, identifying subgroups with a heterogeneous treatment effect and accurately estimating CATE can be very valuable to the design of future confirmatory clinical trials, and to the practice of clinicians. The naive estimation and inference of CATEs in selected subgroups result in over-optimism (large bias) and under-coverage. In this article, we compare the performance of two bias-correction methods to inform us on addressing a key objective in our motivating study PrecISE: to estimate and evaluate subgroups of patients who benefit the most from a given treatment in a post hoc analysis. In the identification phase, we fit a penalized regression as the working model to the data to generate candidates from which to estimate the optimal subgroup through maximizing a specified utility function that is equivalent to maximizing the power for demonstrating treatment efficacy. In the confirmation phase, we apply the bias-correction methods to the estimated utility in the estimated optimal subgroup to obtain a debiased estimate of CATE and to construct the corresponding 95% CI. We consider not only the empirical estimator but also the augmented estimator. Simulation results show that both the CV method and the debiasing bootstrap method reduce re-substitution bias effectively, especially when the sample size is large. When using the empirical estimator, the CV method with bootstrap standard error appears to have less biased point estimates, smaller standard errors, but poorer coverages than the debiasing bootstrap method under moderate sample size. In addition, the CV method requires more computational time and resources because the calculation of bootstrap standard error requires applying the entire subgroup identification strategy to each bootstrap sample, effectively multiplying the time needed by the number of bootstrap samples. The debiasing bootstrap method, on the contrary, is quick and easy to implement when using the empirical estimator because it is model-free, that is, no modeling in each resampled dataset. Using separate data to infer the utility function reduces the biases in point estimates and has good coverages, corresponding to the results shown in the theoretical framework laid out by Guo and He. 33 Re-fitting the outcome model, however, does not appear to lead to any improvement. When using the augmented estimator, the debiasing bootstrap method has less biased point estimates but poorer coverages comparing to using the empirical estimator, with a moderate sample size. In addition, it is no longer model-free because the outcome model needs to be re-estimated based for each bootstrap sample to obtain the regression estimates, leading to a similar computational cost as the CV method.
In summary, our simulation study shows that both the CV method and the debiasing bootstrap method can be successfully used to obtain bias-corrected estimates of CATE in post hoc subgroup estimation. The debiasing bootstrap method appears to be more efficient but more biased than the CV method with the empirical estimator and a moderate sample size. However, it has the advantage of being model-free, thus not computationally intensive. Using the augmented estimator reduces the finite-sample bias but leads to efficiency loss, possibly caused by poor regression estimates. These results are helpful in informing our analysis for the PrecISE trial in the future, as bias correction will be an important component of a post hoc subgroup analysis which aims to identify the optimal subgroup and make inference on the selected subgroup.
Footnotes
Acknowledgements
The authors thank anonymous reviewers and the associate editor for their helpful comments.
Declaration of conflicting interests
The author(s) declared no potential conflicts of interest with respect to the research, authorship, and/or publication of this article.
Funding
The author(s) disclosed receipt of the following financial support for the research, authorship, and/or publication of this article: Work of Anastasia Ivanova is supported in part by the National Heart, Lung, and Blood Institute, National Institutes of Health (grant no. U24 HL138998).