
Abstract
Background/Aims:
There is growing interest in the use of adaptive designs to improve the efficiency of clinical trials. We apply a Bayesian decision-theoretic model of a sequential experiment using cost and outcome data from the ProFHER pragmatic trial. We assess the model’s potential for delivering value-based research.
Methods:
Using parameter values estimated from the ProFHER pragmatic trial, including the costs of carrying out the trial, we establish when the trial could have stopped, had the model’s value-based stopping rule been used. We use a bootstrap analysis and simulation study to assess a range of operating characteristics, which we compare with a fixed sample size design which does not allow for early stopping.
Results:
We estimate that application of the model could have stopped the ProFHER trial early, reducing the sample size by about 14%, saving about 5% of the research budget and resulting in a technology recommendation which was the same as that of the trial. The bootstrap analysis suggests that the expected sample size would have been 38% lower, saving around 13% of the research budget, with a probability of 0.92 of making the same technology recommendation decision. It also shows a large degree of variability in the trial’s sample size.
Conclusions:
Benefits to trial cost stewardship may be achieved by monitoring trial data as they accumulate and using a stopping rule which balances the benefit of obtaining more information through continued recruitment with the cost of obtaining that information. We present recommendations for further research investigating the application of value-based sequential designs.
Introduction and background
There is growing interest in the use of adaptive designs to improve the efficiency of clinical trials. Adaptive designs involve monitoring outcome data as they accumulate, permitting changes to be made to the trial – such as varying the allocation ratio, or stopping early – in response to the evolving evidence. A large literature surveys their development and application and the potential they offer for improving efficiency.1–8
Despite this interest, little attention has been paid to how statistical decision rules in an adaptive clinical trial might formally account for the costs and benefits of the trial itself. This hampers assessment of the value that such designs might create for health care systems. A growing number of theoretical papers, some with illustrative applications, have proposed the use of value-based criteria for fixed sample size designs,9–11 as well as adaptive ones.12,13 However, lack of guidance on how research costs should be measured and how accumulating evidence about treatment costs and health outcomes may inform decision rules as a trial progresses, means that incorporation of costs and benefits in adaptive clinical trials remains an under-researched area. The United Kingdom’s National Institute for Health Research has recognised this and has recently provided ‘Annual Efficient Studies’ funding to clinical trials units to investigate further. The ‘Costing Adaptive Trials’ (CAT) project 14 will provide costing guidance; the ‘EcoNomics of Adaptive Clinical Trials’ (ENACT) project 15 will assess how cost-benefit criteria may be incorporated.
In this article, we apply a recent contribution proposing a Bayesian decision-theoretic model of a sequential clinical trial13,16– (a sequential trial is a special kind of adaptive trial in which data are monitored as they accumulate over a sequence of interim analyses – using retrospective data from the) PROximal Fracture of the Humerus: Evaluation by Randomisation (ProFHER) pragmatic trial. The ProFHER trial was a multicentre randomised clinical trial conducted in the United Kingdom National Health Service which compared surgery with sling immobilisation for the treatment of displaced proximal humeral fracture.17–19 We believe that the application is the first of its kind to use research cost data to inform this model. It is presented as a ‘proof of concept’ study which contributes to the gap in the literature discussed above.
The ProFHER trial was designed according to standard criteria for a fixed sample size clinical trial. However, by considering how the effectiveness and research cost data accumulated over the course of the trial, we can estimate when the trial could have stopped, had a decision rule based on evaluating the cost-effectiveness of the research process been used. Our interest is not in whether such a rule could replace a fixed sample size, or group sequential, clinical trial designed according to traditional criteria. Rather, we are interested in whether such a rule could complement such designs, by providing additional information to trials teams about whether interim evidence suggests that the benefit of randomising further patients into the trial is worth the cost. This matter is of particular interest for trials such as the ProFHER trial, where the extra costs associated with surgery and subsequent revision and secondary surgery, compared with the cheaper alternative of sling immobilisation, meant that while accumulating clinical evidence may not have suggested that one treatment was superior to the other, accumulating cost-effectiveness evidence might have done. Further, patient and surgeon preferences for the two sharply contrasting treatment options were expected to be a major threat to completing successfully recruitment into the trial. Hence a value-based stopping rule might have been useful.
Methods
The Bayesian model
Chick et al.
13
model a two-armed sequential clinical trial in which patients are randomised, in a pairwise and sequential manner, to a new health technology, N, and a control (or standard) health technology, S. Follow-up of health outcomes and treatment costs for each patient occurs after
The objective of the model is to obtain a rule to halt recruitment to the trial. This rule maximises the expected net benefit of carrying out the trial and then recommending one of the two technologies on cost-effectiveness grounds for the treatment of P patients who are expected to benefit from the adoption decision. The costs of carrying out the trial and the costs incurred in switching technologies are included in the measure of expected net benefit. The Supplemental Material discusses the model’s objective function in more detail.
The trial can make a maximum number of

We assume that X has a normal distribution and that its expected value, W, is unknown and its variance,
Assuming a fixed rate of recruitment to the trial, we may express the delay in terms of time, Δ, or pairwise allocations,
Stage I: patients are recruited and randomised, but no patient-level health outcome or treatment cost data are observed owing to the delay in following up;
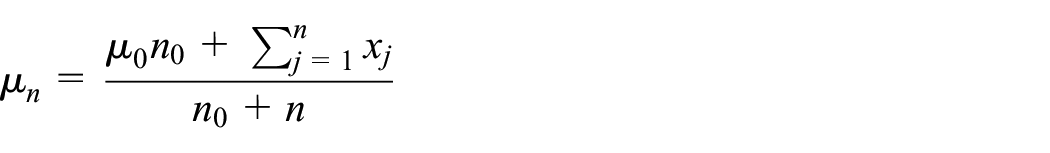
Stage II: patient-level health outcome and treatment cost data are observed and are used to update the prior distribution using Bayes’ rule. There is the option to randomise another pair of patients, or to stop recruitment to the trial. Define x as an observation of incremental net monetary benefit. Then the posterior mean for expected incremental net monetary benefit after outcomes for n pairwise allocations is 21
If, during Stage II, the expected benefit of randomising a further pair of patients is less than the cost, Stage II finishes, having made T pairwise allocations, and the trial moves to Stage III.
Stage III: health outcome and treatment cost data for patients in the ‘pipeline’– those who have been treated but whose outcomes are yet to be observed – are observed and Bayesian updating continues.
T is chosen so that the overall expected value of the trial – the total incremental expected benefit which accrues to the P patients, minus the fixed
There are two scenarios in which it is not optimal to enter Stage II: (1) the expected benefit from entering Stage II is less than that of running a trial with a fixed number of pairwise allocations in the range
Figure 1 presents a representation of the stopping policy for the problem in (pairwise allocations × prior/posterior mean) space. If it is optimal to run a sequential trial, recruitment of patients takes place during Stage I but no outcomes are observed. At the start of Stage II, health outcomes and treatment costs for the first pairwise allocation are observed and used to update the prior mean. Outcomes then arrive sequentially, the posterior mean is updated sequentially and interim analyses of the data are permitted. As long as the posterior mean lies within the area defined by the stopping boundary (we refer to this as the ‘continuation region’), it is optimal to continue recruitment. Once the posterior mean crosses the boundary, it is optimal to halt recruitment and move to Stage III. There is no longer a continuation region in Stage III because recruitment is no longer taking place. In the analysis that follows, for consistency with the ProFHER application, we assume that the cost of switching technologies, I, is equal to zero. This means that, once outcomes for all patients in the trial have been observed, the cost-effectiveness of the new technology is judged according to whether or not the posterior mean is greater than zero. If it is greater than zero, the new technology is deemed to be cost-effective; if not, the standard technology is deemed to be cost-effective.
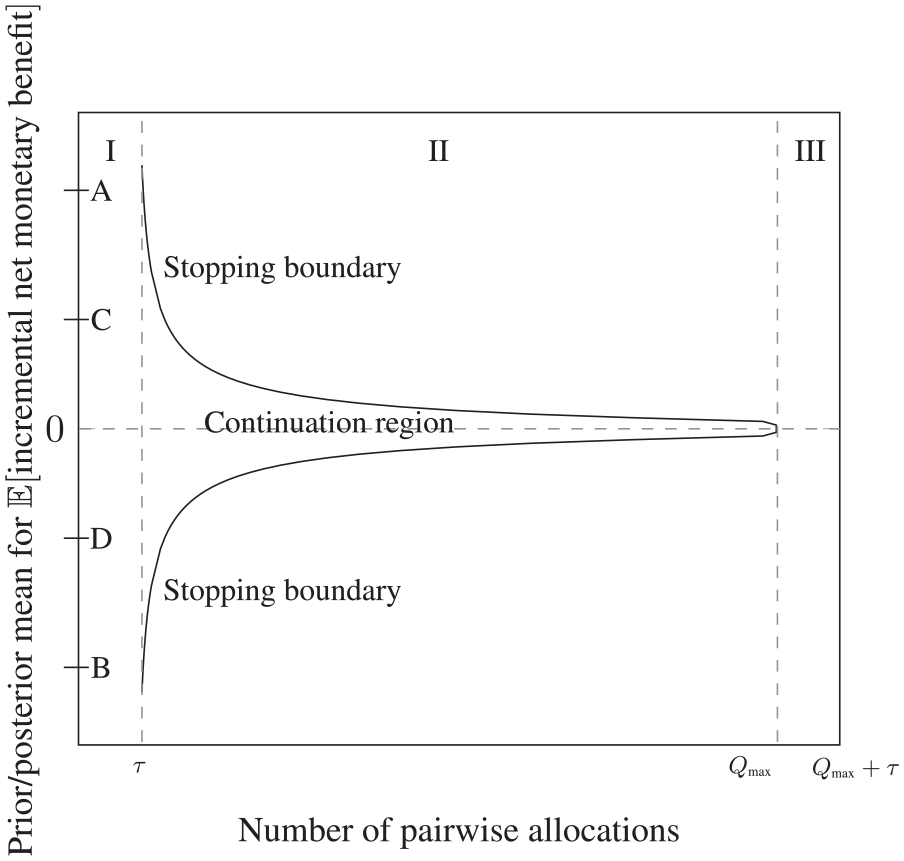
Stopping boundary for the Optimal Bayes Sequential model, showing the three stages of the trial (marked ‘I’, ‘II’ and ‘III’) and the continuation region. Stages II and III are shown assuming that the sequential trial stops at the maximum sample size of
The letters ‘A’ to ‘D’ in Figure 1 denote ranges for the prior mean
The shape of the stopping boundary and the ranges for
The application
The ProFHER trial
Between September 2008 and April 2011, 250 patients aged 16 years and older who presented to orthopaedic departments in United Kingdom National Health Service hospitals with a displaced proximal humeral fracture were randomised to either (1) surgical treatment, which consisted of fracture fixation with plate and screws to preserve the humeral head, or humeral head replacement, followed by active rehabilitation, or (2) non-surgical treatment, which consisted of sling immobilisation for the injured arm for as long as was thought necessary, followed by active rehabilitation. Following discussions with the funder, it was agreed that a single follow-up time point would not be specified for the primary health outcome measure, the Oxford Shoulder Score. Rather, follow-up points were fixed at 6, 12 and 24 months. Analysis of clinical and cost-effectiveness used the intention to treat principle (during the trial, 16 patients randomised to surgery switched to sling and 2 randomised to sling switched to surgery).17–19 The economic evaluation consisted of a cost-utility analysis which took the National Health Service perspective. The European Quality of Life-5 Dimensions-3L instrument was used to obtain the QALYs at 3, 6, 12 and 24 months using the area under the curve method.
The trial’s results suggested that there was no difference between surgical intervention and sling, as measured by the average value of the Oxford Shoulder Score at the three follow-up points. Surgical intervention for one patient cost an estimated £1758 more than sling (95% confidence interval = (£1126, £2389)) and yielded an estimated 0.0101 fewer QALYs (95% confidence interval = (−0.13, 0.11)). A 5-year follow-up found the main results unchanged. 22
The ProFHER trial was funded by the National Institute for Health Research, with a total budget of £1,485,585. Figure 2 shows how the research budget spend accumulated over the lifetime of the project (left axis, continuous black line), together with the path for the cumulative estimate of incremental net monetary benefit at 1 year (right axis, dashed blue line), measured in blocks of 10 patient pairs at a time. * Positive values suggest that surgery is cost-effective. Key milestones in the project are denoted by the letters ‘A’ to ‘E’. The research costs plotted in Figure 2 are those relating to the research budget itself. Treatment costs were not charged to this budget, rather they were funded as part of normal commissioning arrangements within the National Health Service. For the purposes of this work, we assume that treatment costs would have been the same with or without the trial, on average, across the hospitals participating in the trial.
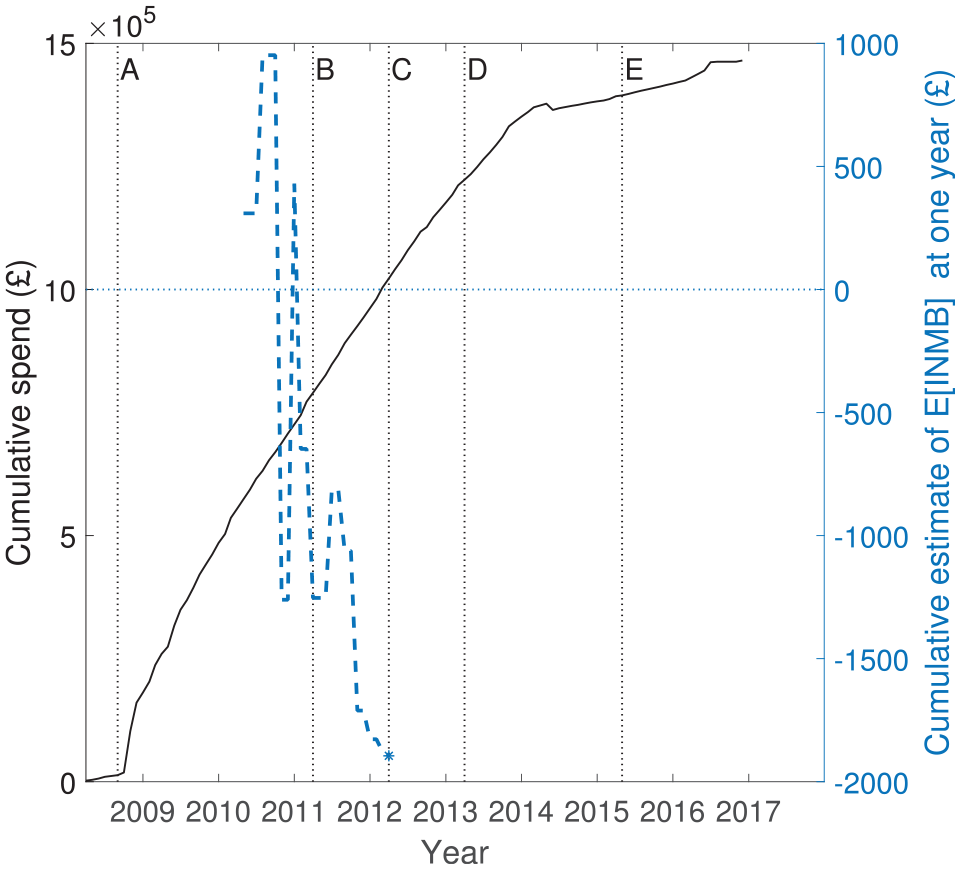
Cumulative budget spend for the ProFHER trial (left axis, continuous line) and average of incremental net monetary benefit at 1 year (right axis, dashed blue line, plotted in blocks of 10 patient pairs, 10 receiving surgery and 10 receiving sling). Key milestones: ‘A’– recruitment starts; ‘B’– recruitment finishes; ‘C’– 1 year follow-up finishes; ‘D’– 2 year follow-up finishes; ‘E’– publication of principal articles.17,18
The path of the cumulative estimate of expected incremental net monetary benefit shown in Figure 2 was not available to the investigators as the trial progressed. The path shows that, although surgery appeared cost-effective initially, the estimate favoured sling by late 2010 and remained that way for the rest of the follow-up. Viewed in terms of incremental effectiveness versus incremental cost at 1 year, the overall story of the trial is that there was no evidence that surgery was more effective than sling (using both the primary health outcome measure and QALYs), but there was strong evidence that surgery was more costly than sling. The Supplemental Material provides further details about how the differences between the estimates of incremental QALYs, Oxford Shoulder Score and treatment costs evolved.
Estimation of parameter values
Using the research cost data from the trial, we estimated that costs of approximately £161,000 were incurred prior to the recruitment of the first patients in September 2008 (labelled as ‘A’ in Figure 2). During the recruitment phase (which finished in April 2011, labelled ‘B’) and the 2-year follow-up phase (which finished in April 2013, labelled ‘D’), further costs of approximately £1,020,000 were incurred. The main results17,18 were reported 2 years later (‘E’), and the project concluded at the end of December 2016. Approximately £289,000 of costs were incurred post follow-up. These covered the tasks of data preparation, cleaning, analysis and report writing. The total spend was approximately £1,470,000. We assume that the costs incurred during the recruitment and follow-up phases were split 50:50 between fixed and variable costs, which implies an estimate of an average cost per pairwise allocation of
For the purposes of exposition, we assume that the delay Δ is equal to 1 year. We estimate that the rate of recruitment is approximately 47 pairwise allocations per year, so that
Implementation of the model
We take the perspective of the ProFHER researchers prior to commencing the trial, but post trial commissioning. That is, we assume that a decision to commission the research and commit fixed costs
We run two versions of the model. The first assumes that the maximum number of pairwise allocations that can be made,
Results
When would the Bayesian sequential version of the ProFHER trial have stopped?
Figure 3 plots the Stage II stopping boundaries for the two versions of the model. Also drawn is the path of the posterior mean for expected incremental net monetary benefit, derived using the data as it accumulated in the ProFHER trial (continuous black line, markers: ‘°’). This is drawn using the summary data for effectiveness and treatment costs from the trial, arranged in blocks of 10 pairwise allocations, and reported in Supplemental Table 1 of the Supplemental Material. The other paths in Figure 3 are described in the next section. Figure 3 shows that doubling the maximum sample size from 125 to 250 pairwise allocations has little impact on the shape and location of the stopping boundary between the start of Stage II and
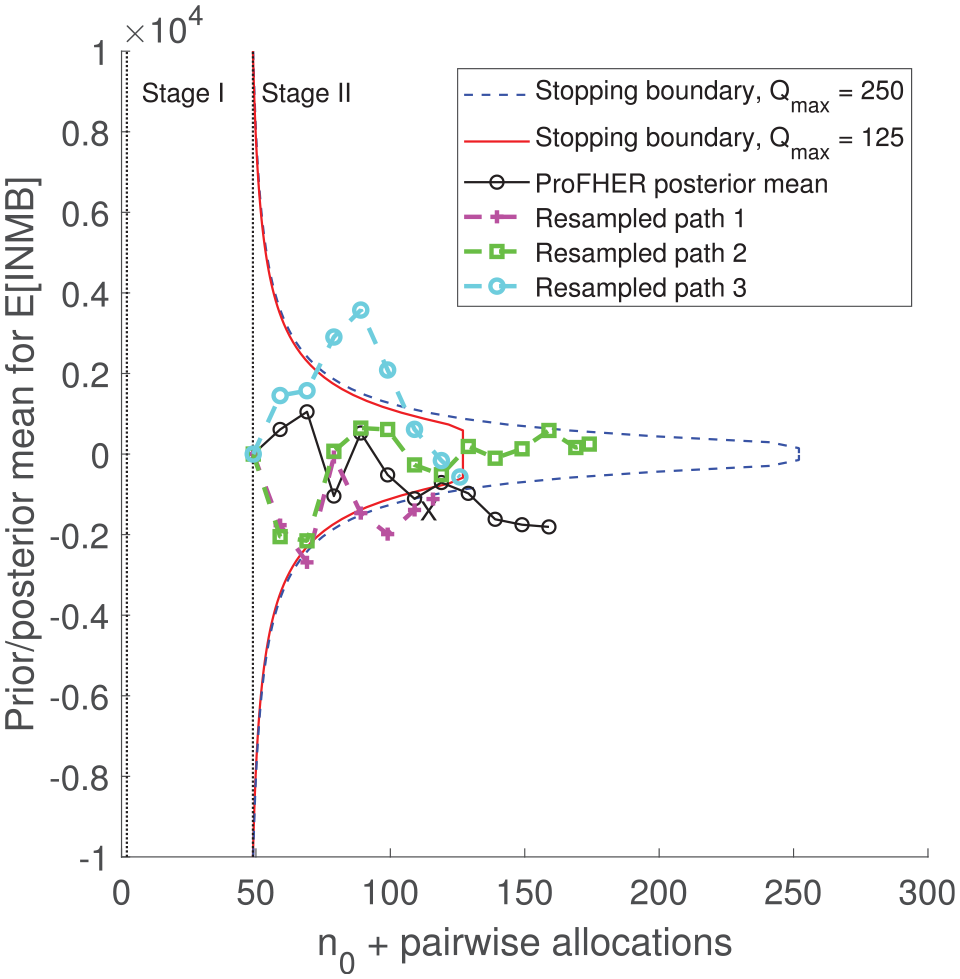
Stopping boundaries for the two versions of the model, together with the path for the posterior mean generated using the trial’s data (black line, marker: ‘°’) and three resampled paths from the bootstrap analysis (dashed lines, markers: ‘+’, ‘□’ and ‘°’). X marks the first interim analysis at which the posterior mean lies outside the stopping boundary (for both versions of the model).
The first point on the path for the posterior mean, at the start of Stage II and at an effective sample size of 49 pairwise allocations (equal to
Bootstrap analysis
To investigate the degree of variability in the sample size and other operating characteristics, we used a non-parametric bootstrap analysis. We sampled at random, and with replacement, from the data in Supplemental Table 1 of the Supplemental Material and obtained 5000 bootstrapped paths for the posterior mean. For each path, we compared the posterior mean with the stopping boundary, assuming it would be practical to run interim analyses in blocks of 10 pairwise allocations. For each interim analysis, we established when Stage II would have stopped, as well as the adoption decision, cost of the trial and the posterior mean for expected incremental net monetary benefit at the end of Stage III. Three bootstrapped paths are shown in Figure 3 for a trial with
Some operating characteristics are summarised in Table 1, labelled ‘bootstrap’. They show that, when
Results for the 5000 resampled paths from the bootstrap and Monte Carlo analysis.
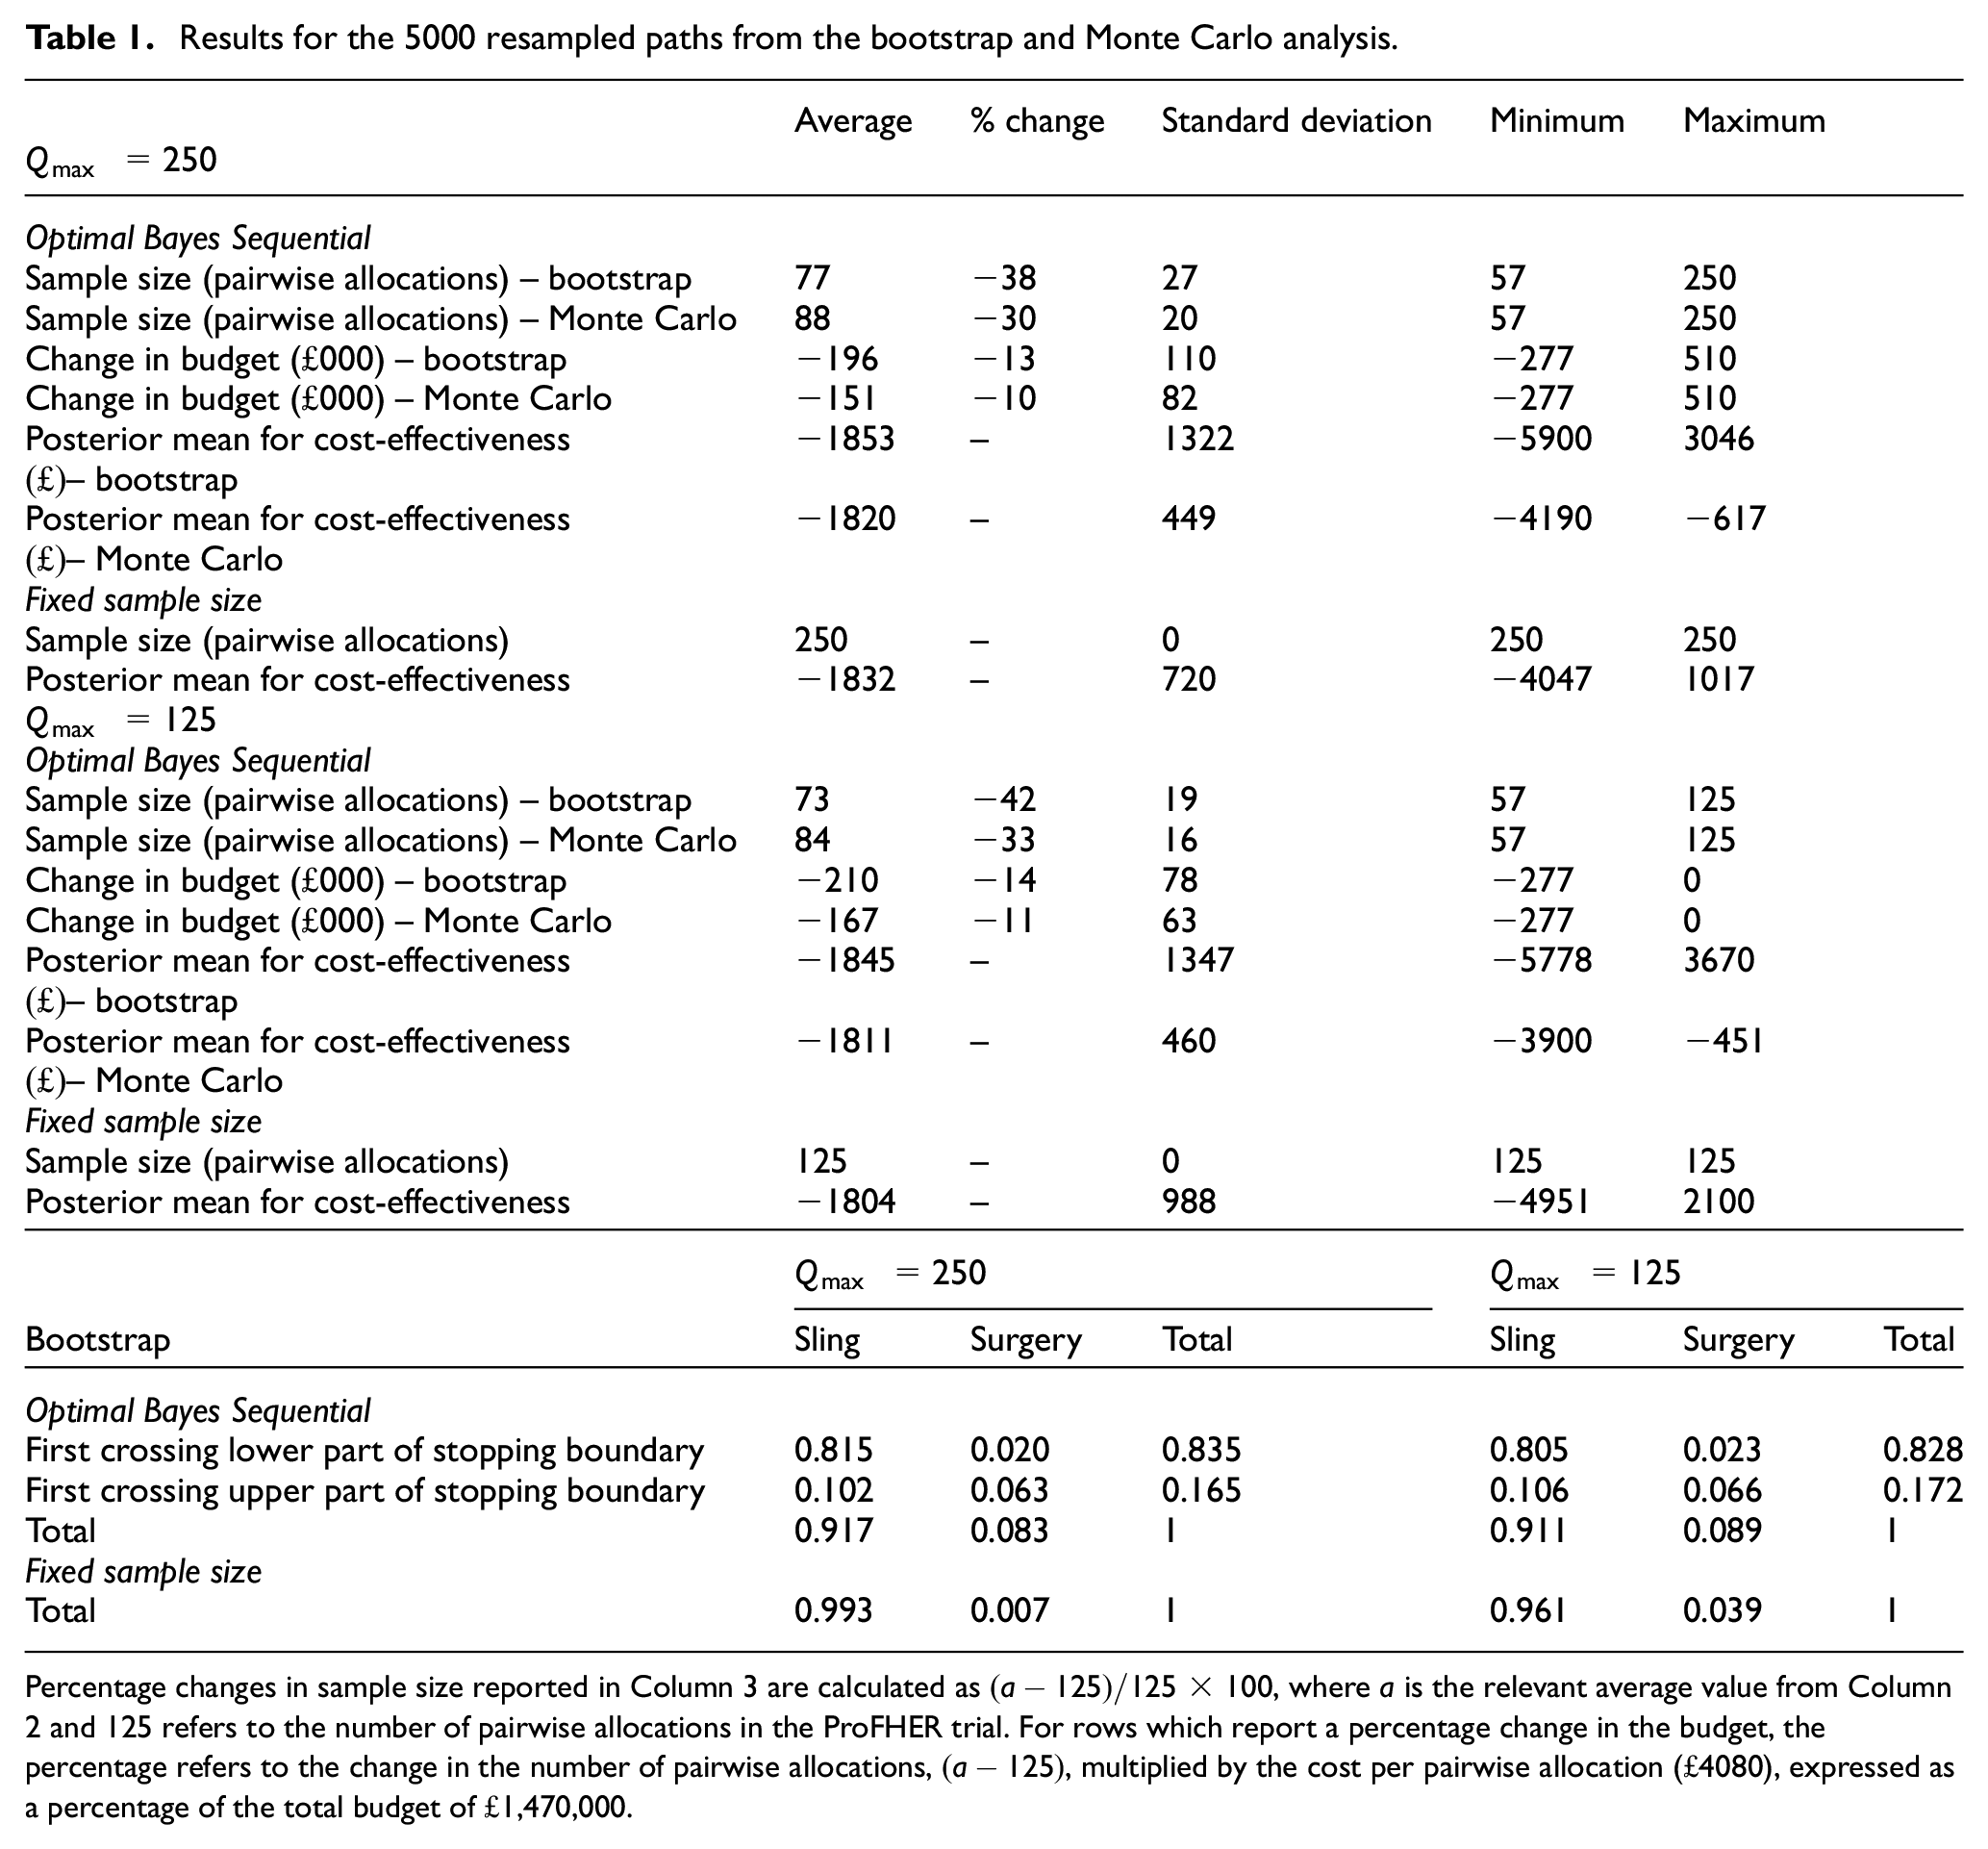
Percentage changes in sample size reported in Column 3 are calculated as
Figure 3 showed that there is very little difference between the stopping boundary when the maximum sample size is reduced to that used in the ProFHER trial itself (
Figure 4 presents some graphical summaries of the bootstrap analysis. Figure 4(a) shows that, when
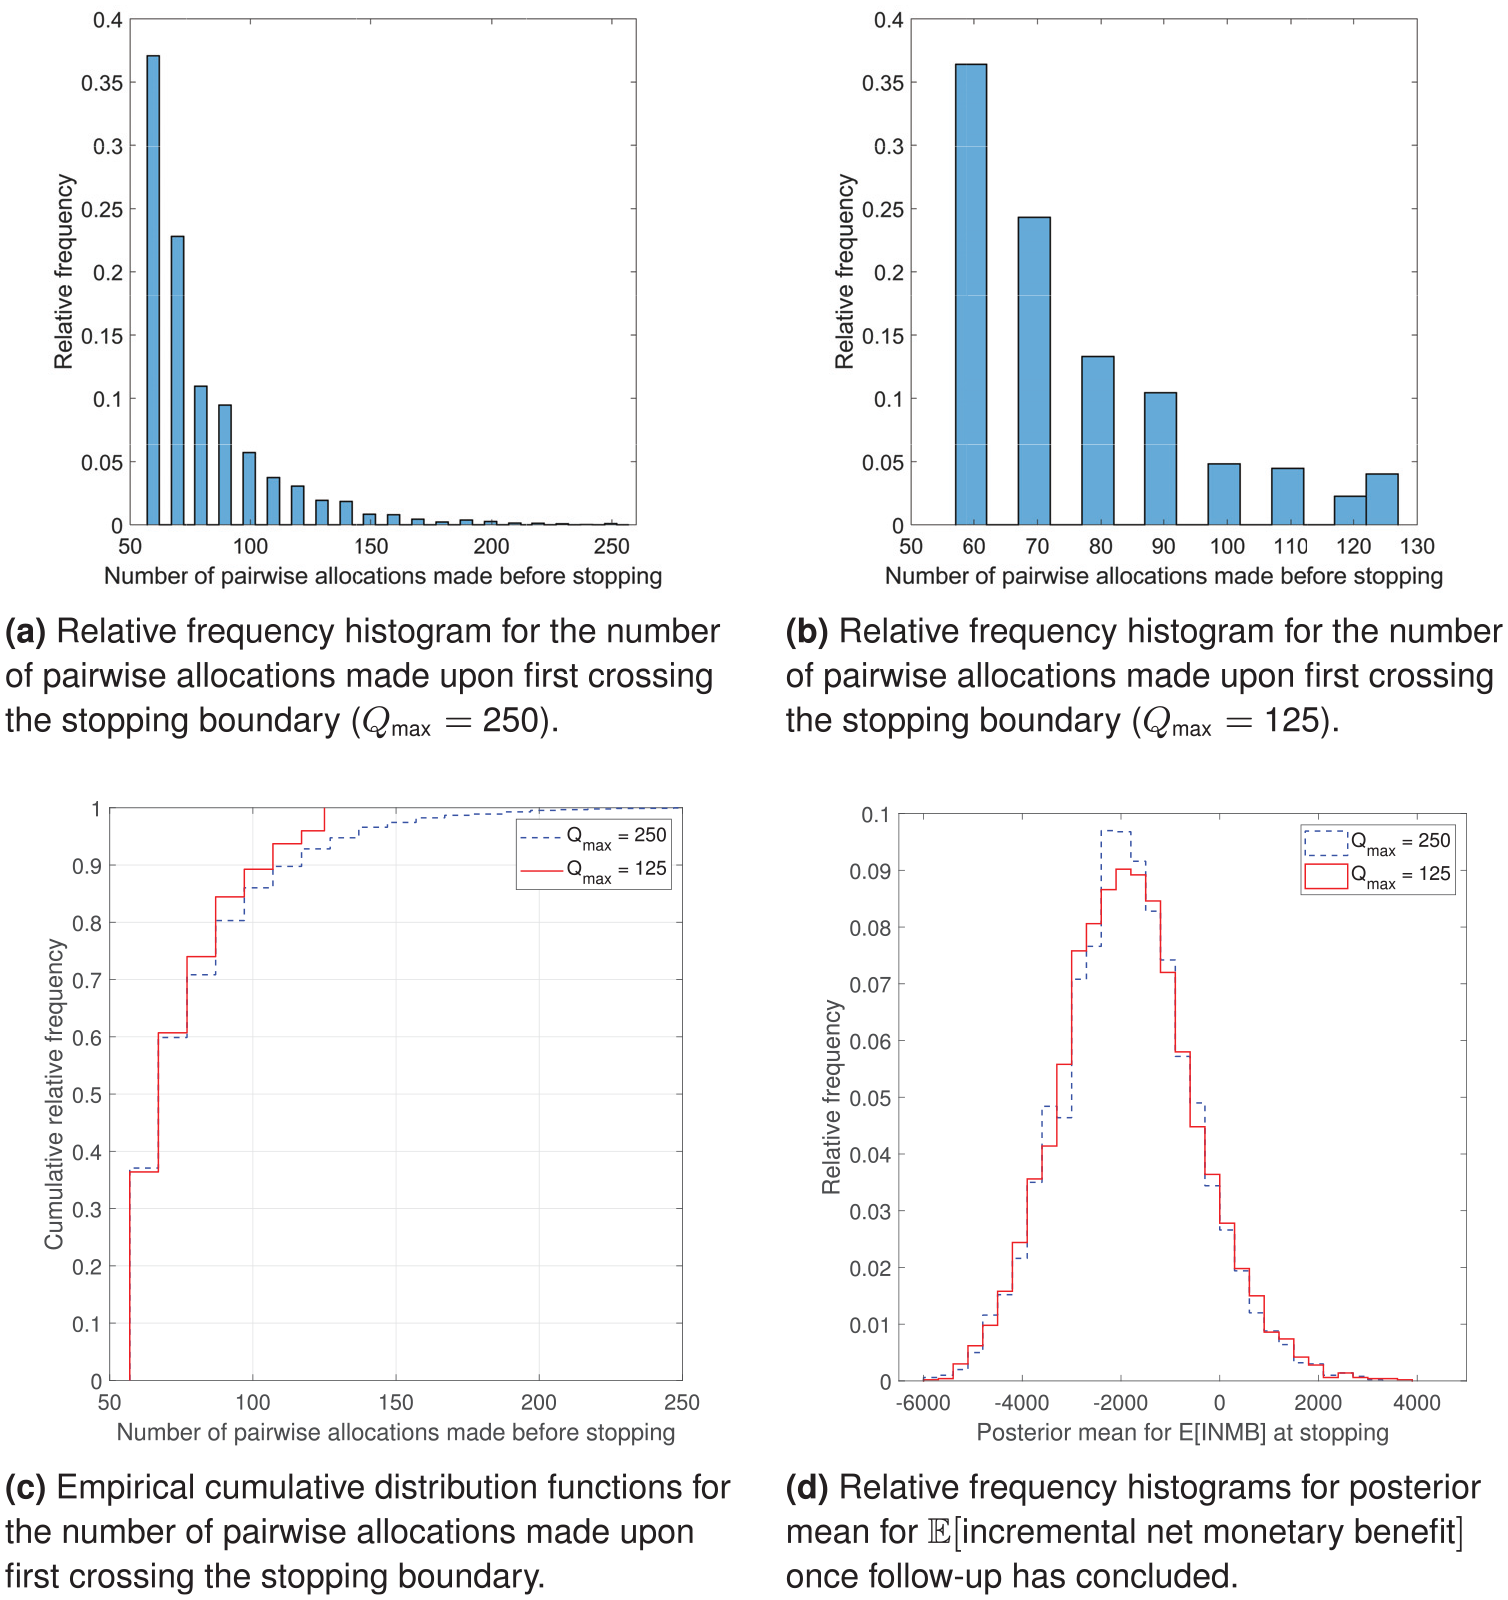
Graphical analysis of the bootstrap results: (a) relative frequency histogram for the number of pairwise allocations made upon first crossing the stopping boundary
Sensitivity analysis
To investigate the sensitivity of our main results to different assumptions about how the data accumulated over the course of the trial, we also carried out a Monte Carlo simulation which took repeated draws of incremental net monetary benefit from a normal distribution with expected value equal to the value that was used for the bootstrap (approximately −£1808) and
A discussion of further sensitivity analysis is presented in the Supplemental Material.
Discussion and conclusion
With growing interest in the use of adaptive clinical trials, there is a need to explore how new approaches perform, from both economic and statistical perspectives. Our application of a Bayesian decision-theoretic model of a sequential clinical trial to the ProFHER pragmatic trial suggests that it could have stopped the trial early, saving about 5% of the research budget. The bootstrap analysis suggests that the sample size would have been reduced by approximately 38%, saving around 13% of the budget, with a probability of 0.92 of making a technology recommendation consistent with that of the trial itself. It also shows a large degree of variability in the trial’s sample size.
It is important to note that, although the model may be applicable in a range of trial settings with a pragmatic element, it will not be applicable to all trials. For example, it is unlikely to be suitable for Type C trials, which are more concerned with safety than with effectiveness or cost-effectiveness, as well as trials where the length of follow-up of the outcome of interest is close to the length of the recruitment period (these present little or no scope for using interim analyses) and trials where the health outcome measure of interest is the time to an event rather than a period of fixed duration (this breaks the model’s assumption about a fixed period of follow-up).
We conclude with some directions for future research:
Approximately 37% of resampled paths from the bootstrap analysis stop at the first interim analysis, with a sample size equal to just under half of that of the ProFHER trial. Given that about half of the surgeons who responded to a recent survey 23 stated that they had changed practice because of ProFHER, it is unlikely that such a sample size will be deemed credible for changing practice. One extension would be to investigate the sensitivity of results to choice of follow-up period.
Some of the parameters used to populate the model are difficult to estimate, suggesting that additional sensitivity analysis is warranted. For example, the size of the population to benefit is a function of both the incidence rate and the time horizon over which an adoption decision applies. Defining fixed and variable costs may also be challenging, and the CAT project 14 may provide helpful guidance. The costs of monitoring a sequential design may be higher than those for a fixed design.
The model assumes that patients are randomised in a pairwise manner to treatments, but there exists a large statistical literature on the use of allocation-adaptive randomisation in frequentist designs. 24
The handling of missing data could be explored in further sensitivity analysis. This matter is being investigated as part of the ENACT project. 15
The sampling variance is assumed to be known. This requires that either it be estimated at the start of the trial or that the methods of Chick et al., 13 Section 4, are used for the case of unknown sampling variance.
We assume a prior mean that is equal to zero and a prior variance which assigns a low weight to prior information. Choice of the prior mean is important because it determines whether no trial, a fixed sample size trial or a sequential trial are the preferred designs. It also affects the point at which the Stage II path for the posterior mean starts. Choice of the prior variance affects the weights placed on the prior information and the data. Although we believe that a non-informative prior is reasonable for the ProFHER trial, it may not be for other trials. This is another topic that is being investigated further in the ENACT project. 15
The stopping boundary could be compared with a Bayesian design which uses a stopping rule based on the probability that a technology is cost-effective, together with frequentist group sequential stopping rules, as in Pertile et al. 12
Supplemental Material
sj-pdf-1-ctj-10.1177_17407745211032909 – Supplemental material for Cost-effective clinical trial design: Application of a Bayesian sequential model to the ProFHER pragmatic trial
Supplemental material, sj-pdf-1-ctj-10.1177_17407745211032909 for Cost-effective clinical trial design: Application of a Bayesian sequential model to the ProFHER pragmatic trial by Martin Forster, Stephen Brealey, Stephen Chick, Ada Keding, Belen Corbacho, Andres Alban, Paolo Pertile and Amar Rangan in Clinical Trials
Footnotes
Acknowledgements
We thank two anonymous reviewers, the Deputy Editor and Associate Editor, together with Helen Handoll, for comments on earlier drafts of the paper. We thank Alan Brennan for suggestions concerning the tracking of health outcome and treatment cost data over the course of the trial. We thank participants in the International Clinical Trials Methodology Conference 2019, Brighton; the Health Economics and Decision Sciences seminar and EcoNomics of Adaptive Clinical Trials (ENACT) Workshops 1 and 2 held at the School of Health and Related Research, University of Sheffield; and the seminar held by the Institute of Advanced Studies at the University of Bologna. We thank Matthew Dore and Andrea Palfreeman for preparation of the research cost data used in the ProFHER trial.
Authors’ note
This is a proof of concept paper which is intended to illustrate how the model presented may be populated retrospectively with data from a randomised clinical trial. It is not intended that the paper represents a comment on the health technologies themselves. The ProFHER trial was funded by the National Institute for Health Research Health Technology Assessment programme (project number ref 06/404/502). The views expressed are those of the authors and not necessarily those of the National Health Service, the National Institute for Health Research or the Department of Health and Social Care. An early version of this article was made available as part of the working paper series of the Department of Economics and Related Studies, University of York (DP 19/01, ![]() ).
).
Declaration of conflicting interests
The author(s) declared the following potential conflicts of interest with respect to the research, authorship and/or publication of this article: A.R. has obtained research and educational grants and expenses for lectures from DePuy J&J Ltd. He holds research grants from the National Institute for Health Research (NIHR), Orthopaedic Research UK and H2020. All these are outside the submitted work. M.F., S.B., S.C., A.K., B.C. and P.P. are collaborators on the NIHR-funded EcoNomics of Adaptive Clinical Trials (ENACT) project that is referred to in this article.
Funding
The author(s) disclosed receipt of the following financial support for the research, authorship and/or publication of this article: A.R. was supported by the National Institute for Health Research (NIHR) Oxford Biomedical Research Centre. S.C. and A.A. acknowledge the support of the European Union through the MSCA-ESA-ITN project [676129]. M.F. acknowledges funding from the Research Infrastructure Support Fund of the Department of Economics and Related Studies, University of York. No funding source played a role in the design of the research; collection, analysis and interpretation of data; the writing of the report; and the decision to submit the article for publication.
Ethical approval and informed consent
Notes
Supplemental material
Supplemental material for this article is available online.
References
Supplementary Material
Please find the following supplemental material available below.
For Open Access articles published under a Creative Commons License, all supplemental material carries the same license as the article it is associated with.
For non-Open Access articles published, all supplemental material carries a non-exclusive license, and permission requests for re-use of supplemental material or any part of supplemental material shall be sent directly to the copyright owner as specified in the copyright notice associated with the article.