
Abstract
Background/Aims:
This article studies the effect of attrition in the cluster randomized crossover trial. The focus is on the two-treatment two-period AB/BA design where attrition occurs during the washout period. Attrition may occur at either the subject level or the cluster level. In the latter case, clusters drop out entirely and provide no measurements in the second period. Subject attrition can only occur in the cohort design, where each subject receives both treatments. Cluster attrition can also occur in the cross-sectional design, where different subjects are measured in the two time periods. Furthermore, this article explores two different strategies to account for potential levels of attrition: increasing sample size and replacing those subjects who drop out by others.
Methods:
The statistical model that takes into account the nesting of subjects within clusters, and the nesting of repeated measurements within subjects is presented. The effect of attrition is evaluated on the basis of the efficiency of the treatment effect estimator. Matrix algebra is used to derive the relation between efficiency, the degree of attrition, cluster size and the intraclass correlations: the within-cluster within-period correlation, the within-cluster between-period correlation and (in the case of a cohort design) the within-subject correlation. The methodology is implemented in two Shiny Apps.
Results:
Attrition in a cluster randomized crossover trial implies a loss of efficiency. Efficiency decreases with an increase of the attrition rate. The loss of efficiency due to attrition of subjects in a cohort design is largest for small number of subjects per cluster-period, but it may be repaired to a large degree by increasing the number of subjects per cluster-period or by replacing those subjects who drop out by others. Attrition of clusters results in a larger loss of efficiency, but this loss does not depend on the number of subjects per cluster-period. Repairing for this loss requires a large increase in the number of subjects per cluster-period. The methodology of this article is illustrated by an example on the effect of lavender scent on dental patients’ anxiety.
Conclusion:
This article provides the methodology of exploring the effect of attrition in cluster randomized crossover trials, and to repair for attrition. As such, it helps researchers plan their trial in an appropriate way and avoid underpowered trials. To use the methodology, prior estimates of the degree of attrition and intraclass correlation coefficients are needed. It is advocated that researchers clearly report the estimates of these quantities to help facilitate planning future trials.
Introduction
A common research design in biomedicine is the cluster randomized trial.1–5 Clusters are randomized to treatment conditions, so all subjects within the same cluster receive the same treatment. Outcomes of subjects in the same cluster tend to be correlated; hence, the cluster randomized trial is less efficient than the individual randomized trial. It is obvious that efficiency can be improved by increasing sample size. However, this is not always feasible and alternative strategies have been proposed, such as reducing residual variance by including covariates,6–9 balancing, matching and stratification,5,10 taking repeat measurements5,11–13 and introducing a crossover design.14–17
With the crossover design, clusters are randomized to a sequence of treatment conditions rather than just one treatment condition. As such, each cluster serves as its own control, which has an advantageous effect on efficiency. The simplest crossover design is the so-called AB/BA design in which one group of clusters receives treatment A in the first time period and treatment B in the second, and the other group of clusters receives both treatments in reverse order.
Two different variants may be distinguished depending on whether different or the same subjects are enrolled in the two time periods or, stated differently, on whether a cross-sectional or cohort design is used. In the case of a cross-sectional design, the cross-over is at the level of the cluster. This design is suitable when it is not possible to use the same subjects in both time periods. Consider a trial in which two programs to help adolescents to better support their peers with a mental health problem were compared in the school setting. 18 Both programs were designed for year 10 students, and hence different cohorts were used in the 2 years. Another reason for using different cohorts is that interventions that promote to change participants’ behavior can often not be undone at the subject level.
In the case of a cohort design, the crossover is at the level of the subject. An example is a study in which the New Nordic Diet was compared with standard luncheons.19,20 Nine Danish municipal schools were randomized to treatment sequences; participants were children 8–11 years old. Apparently, the researchers were willing to believe the effect of the intervention of the first time period did not carry over into the second.
The cohort and cross-sectional design have been evaluated on the basis of their efficiency. 17 As is obvious, the cohort design is more efficient since each subject receives both conditions and therefore serves as its own control. This is true when indeed two measurements are made on each subject. In longitudinal studies, which crossover studies essentially are, attrition is the rule rather than the exception. Attrition rates of 5%–10% are not uncommon in crossover studies and they can be as high as 25%. 21 The rate of attrition and reasons for attrition depend on the type of treatments, subjects and clusters, the treatment sequence and the duration between the two treatment periods. In the dietary study, 3.4% of children who entered the second period did not complete the trial because they did not like the school meals, changed school or class, disliked the measurements or found them time consuming, were lost to follow-up, or for other reasons. An attrition rate of 7% was found in a study on the effects of an exercise program on musculoskeletal symptoms and physical capacity among nursing staff in four geriatric wards. 22 Attrition only occurred in the group where the exercise program was followed by the control and one of the reasons for attrition was not being interested in the control. Other reasons were pregnancy, sick leave, starting to study or a new job.
Attrition may also occur at the cluster level. In a cross-sectional design, a cluster may drop out when it is not able or willing to recruit subjects for the second time period. Other reasons for attrition are the trial is too time-consuming or too difficult to implement, the professional who delivers treatment is unavailable in the second time period, or the cluster is not interested to implement the treatment of the second time period.
This article extends previous work on cluster randomized crossover trials 17 by taking attrition into account. The efficiency of the crossover design is related to the degree of attrition. The cross-sectional design without attrition is compared with the cohort design with subject attrition and it is studied at what degrees of attrition the first outperforms the latter. In addition, two strategies to repair for the loss of efficiency are explored: increasing sample size and replacing those subjects who drop out by others. It is assumed that missing data are missing (completely) at random. Statistical models for attrition that is informative are more complicated and outside the scope of this article. 23 Furthermore, a restriction to linear models for a quantitative outcome is made.
Methods
Review of the crossover design
The focus of this contribution is on the AB/BA design.24–26 Each cluster receives each of the two treatments A and B, but in separate time periods, leading to the formation of two cluster-periods. It is assumed that carryover is absent, for instance, by using a washout period of sufficient length. The model that relates the outcome variable to treatment condition should take into account different levels of nesting: clusters, subjects and, in the case of a cohort design, measurements within subjects. An appropriate model is the multilevel model.27–30
Cross-sectional design
The multilevel model for the cross-sectional design is given by

where
The total variance is
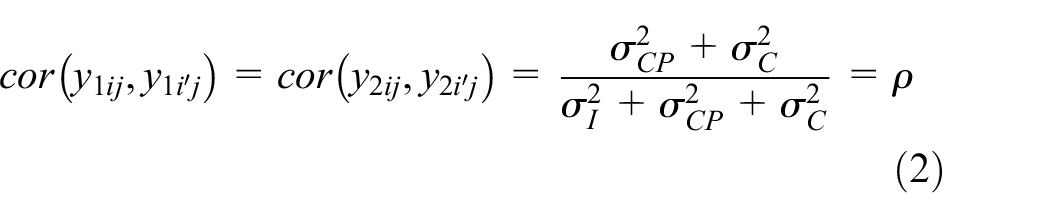
The within-cluster between-period correlation is the correlation between outcomes of two subjects in the same cluster and different periods
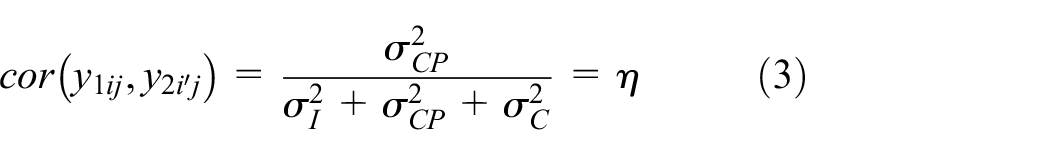
The weights
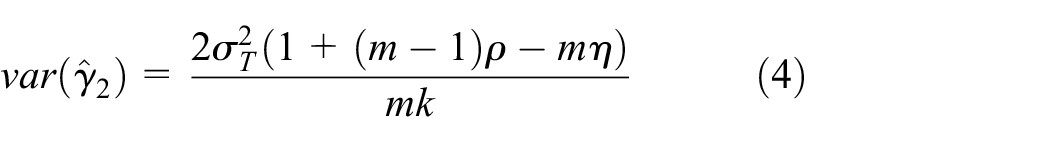
The derivation of this equation is given elsewhere.
15
Equation (4) shows that the treatment effect estimate is less efficient when
Cohort design
With the cohort design, each subject is measured in both time periods. This implies an extra level, the repeated measures level, is needed

The term
The total variance is
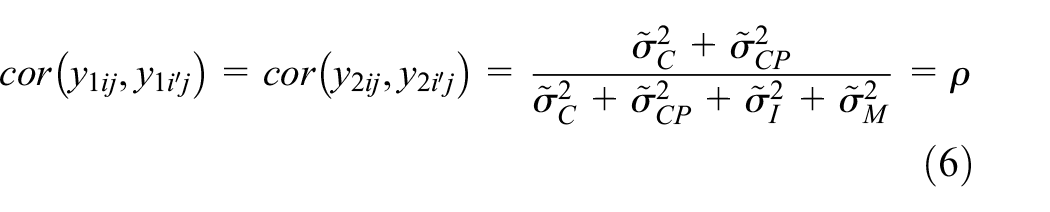
The within-cluster between-period correlation is
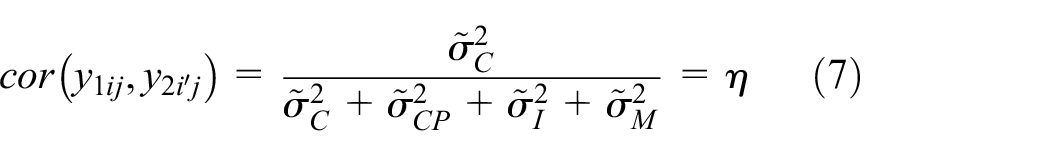
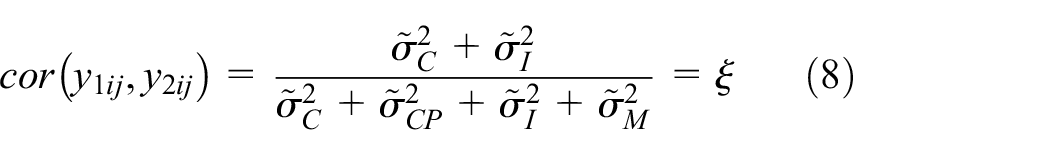
The within-cluster within-subject correlation is the correlation between the two measurements within a subject
As for the cross-sectional design, the treatment effect is estimated by taking the difference in means over the clusters. This estimator has variance
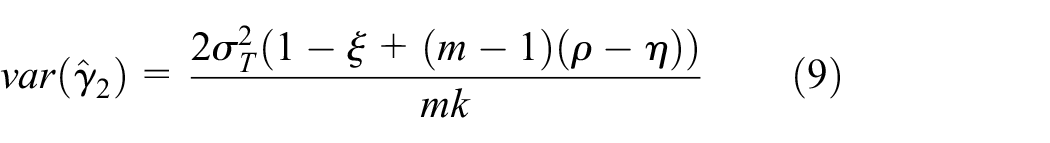
See the Online Supplement for the derivation. Equation (9) shows that the treatment effect is estimated with higher variance when
The effects of attrition
Attrition is defined as the situation where clusters or subjects drop out during the washout period. This implies an outcome is measured on them in the first time period but not in the second. Simple closed-form expressions for the variance of the treatment effect estimator cannot be derived; hence, matrix algebra is used to explore the detrimental effects of attrition.
First, the multilevel model for the case without attrition is given and then it is shown how attrition is taken into account. The data are organized such that the first m observations are for time period 1 and the second m observations are for time period 2. The multilevel model for cluster j for the cohort design in matrix notation is

where
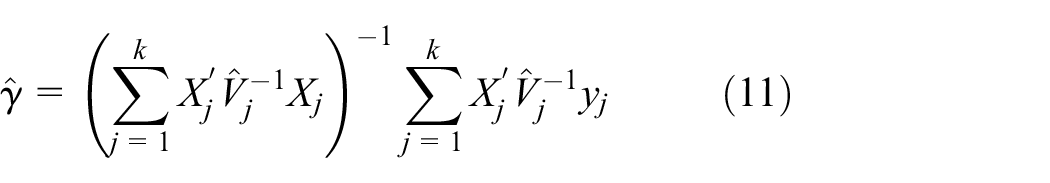
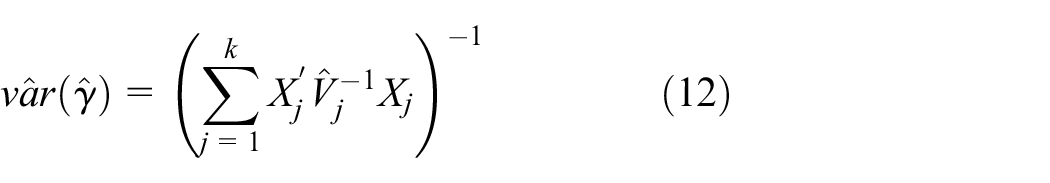
and its corresponding covariance matrix is estimated as
The model for the cross-sectional design follows from equation (10) by removing the vector
Results
Attrition of subjects in a cohort design
Suppose that a proportion pj of the m subjects in cluster j drops out. This implies removing the last
Figure 1 shows the effects of various realistic degrees of subject attrition in a cohort design (constant across clusters), as a function of the number of subjects per cluster-period and for four combinations of the correlation coefficients
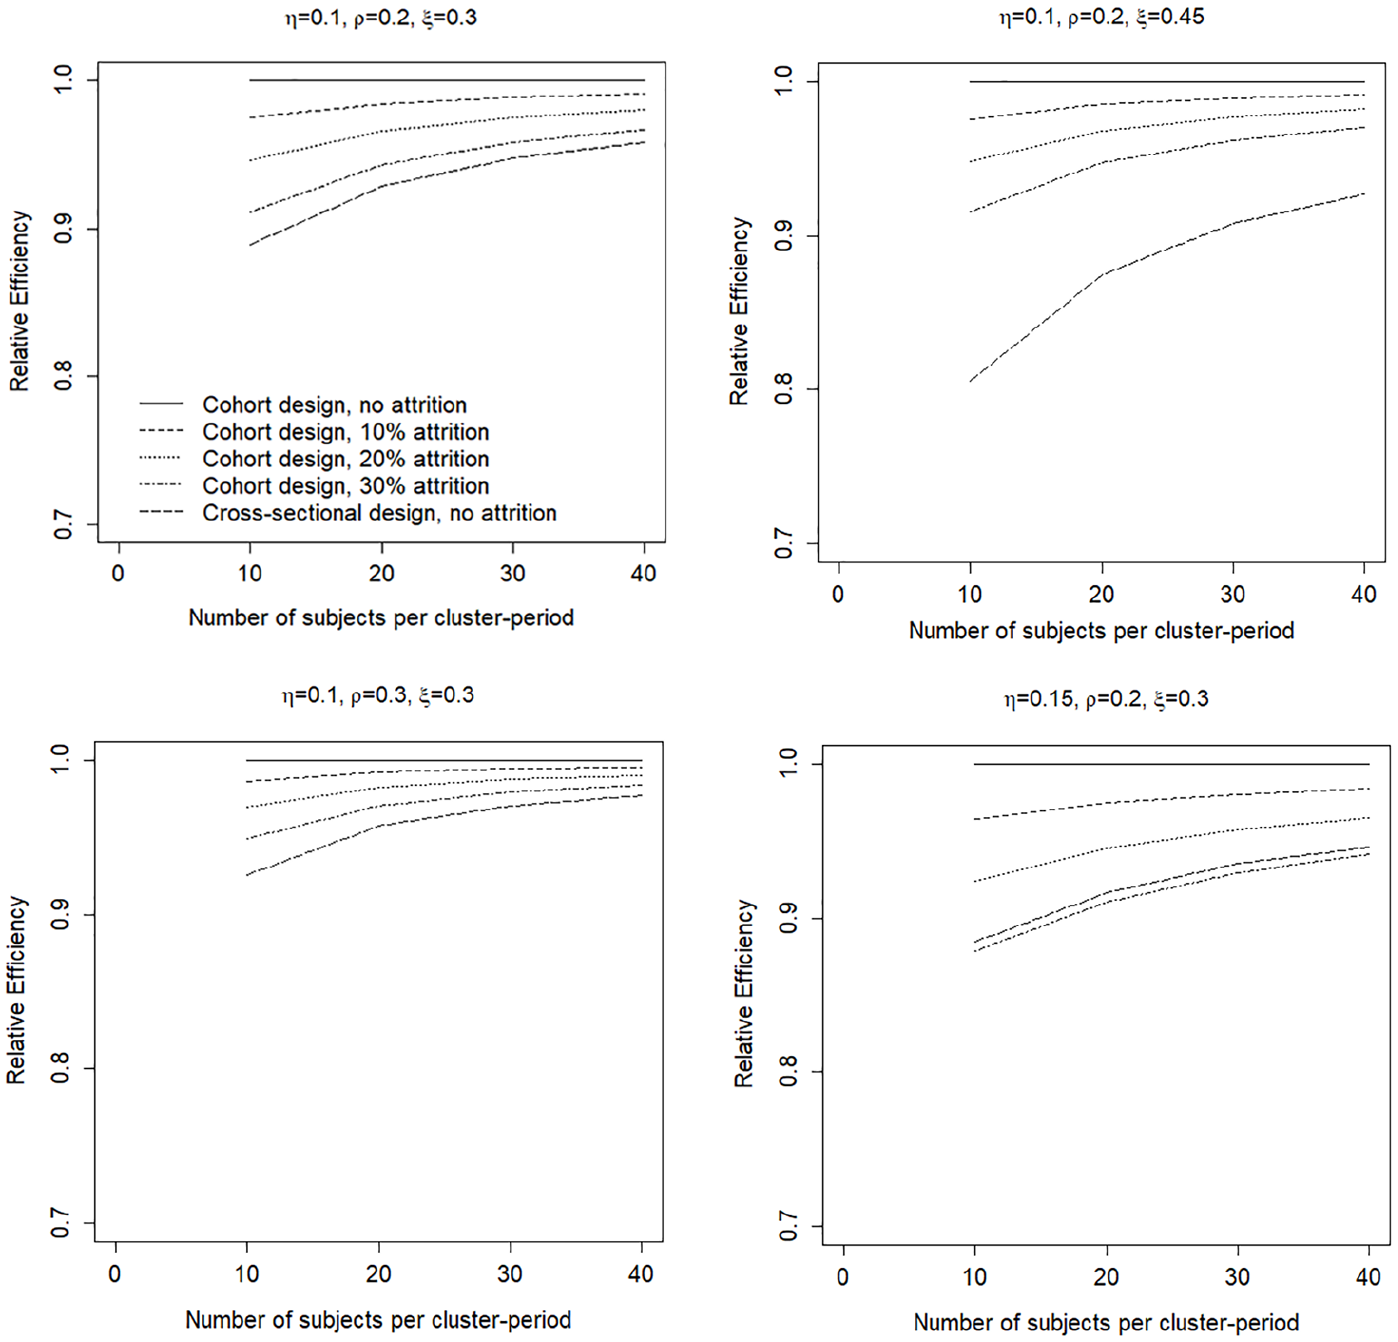
The effects of subject attrition in a cohort design as a function of the number of subjects per cluster-period and for four combinations of values of the correlation coefficients.
Attrition of clusters in a cohort or cross-sectional design
The focus is on the scenario where some of the k clusters drop out. The attrition rates may vary across treatment sequences. For those clusters that drop out the last
Figure 2 shows the effects of various realistic degrees of cluster attrition in a cohort design (constant across treatment sequences), as a function of the number of subjects per cluster-period and for four combinations of correlation coefficients
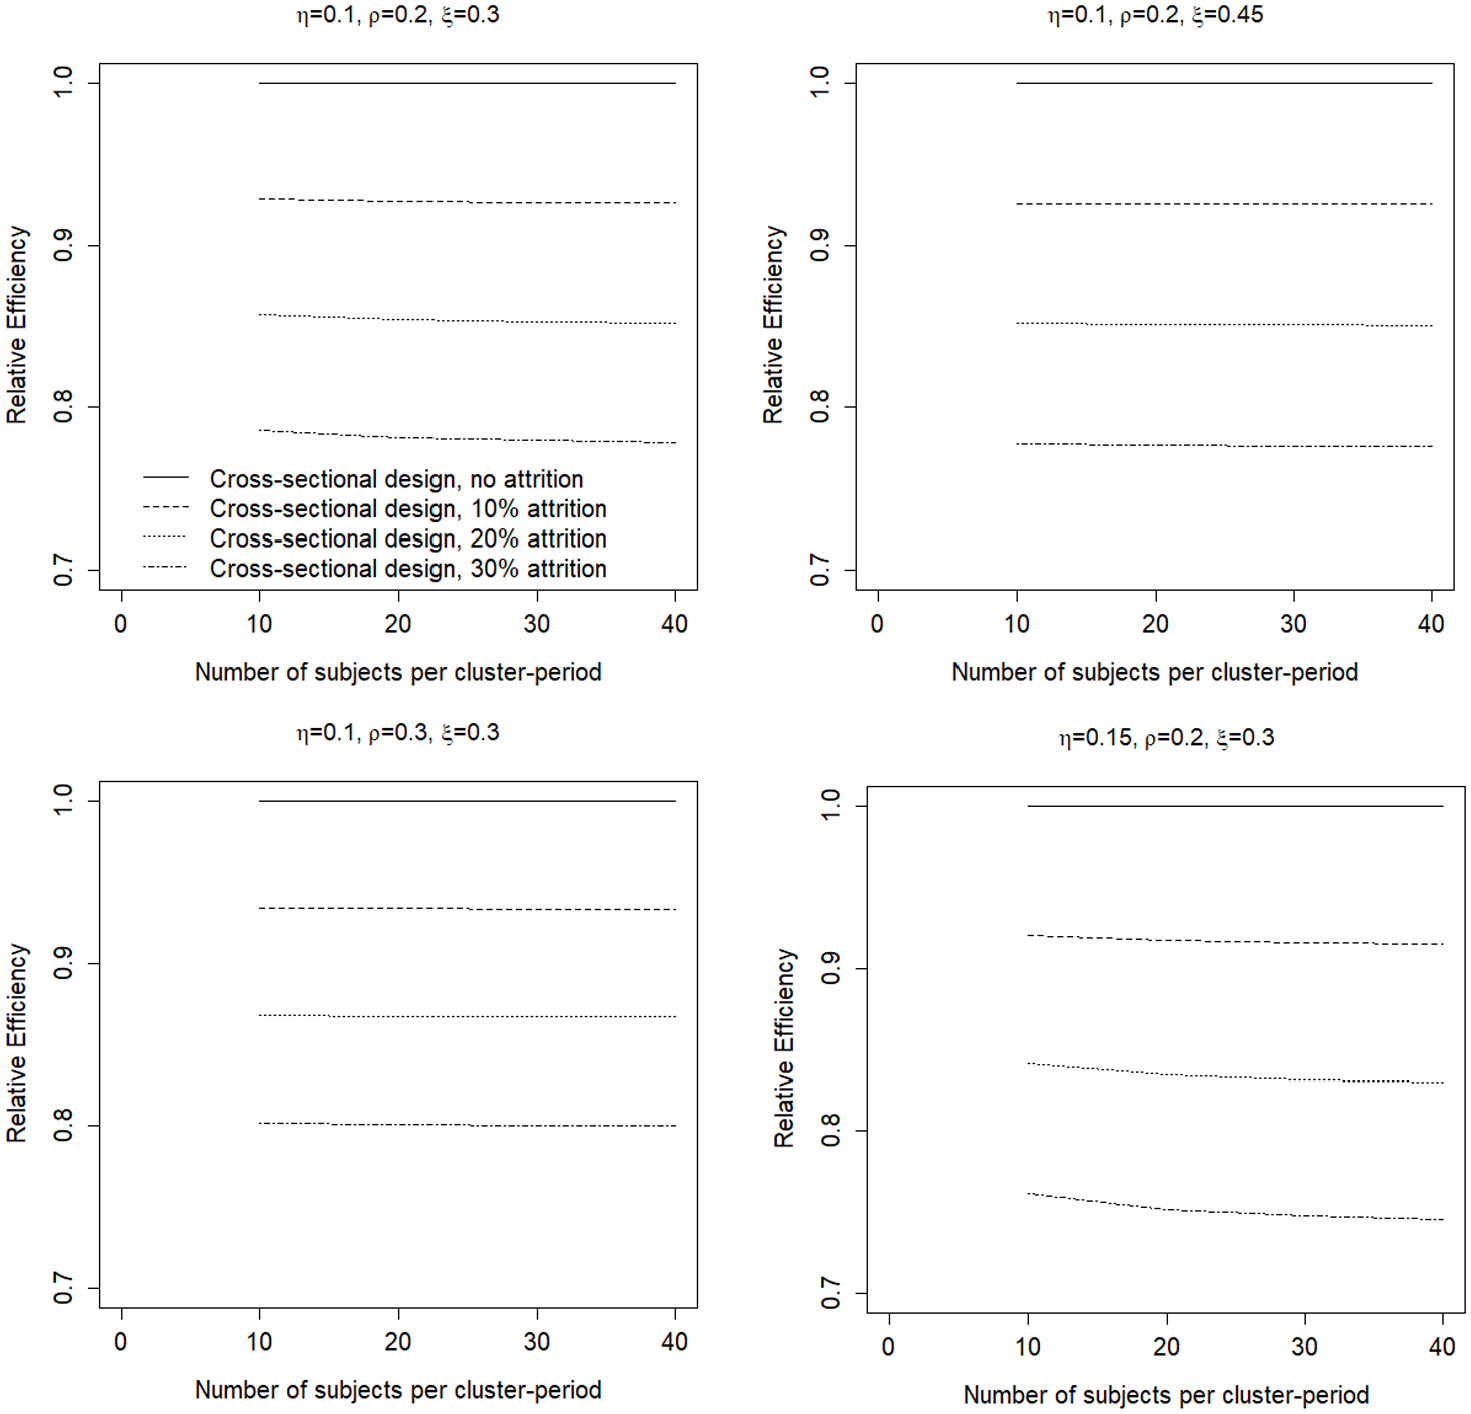
The effects of cluster attrition in a cohort design as a function of the number of subjects per cluster-period and for four combinations of values of the correlation coefficients.
The results of cluster attrition in a cross-sectional design are very similar and a figure is not included. In general, the effects of attrition of clusters are slightly less severe for a cross-sectional design than for a cohort design.
How to account for attrition in sample size calculations
The aim of a cluster randomized crossover trial is to detect the treatment effect
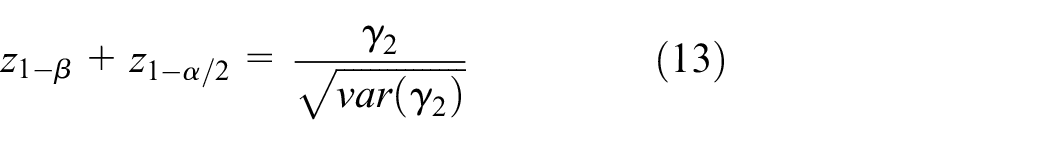
where
Power is related to sample sizes k and m through
Anticipated attrition
Anticipated attrition is defined as attrition that a researcher anticipates before the start of the trial. The most obvious strategy to repair for such attrition is increasing the number of subjects and/or number of clusters from the start of the study onwards. This implies that in both time periods, higher sample sizes m and/or k are used than those that are based on an a priori power analysis for a study without attrition.
Figure 3 explores the effects of including extra subjects or clusters. The values of the correlation coefficients are
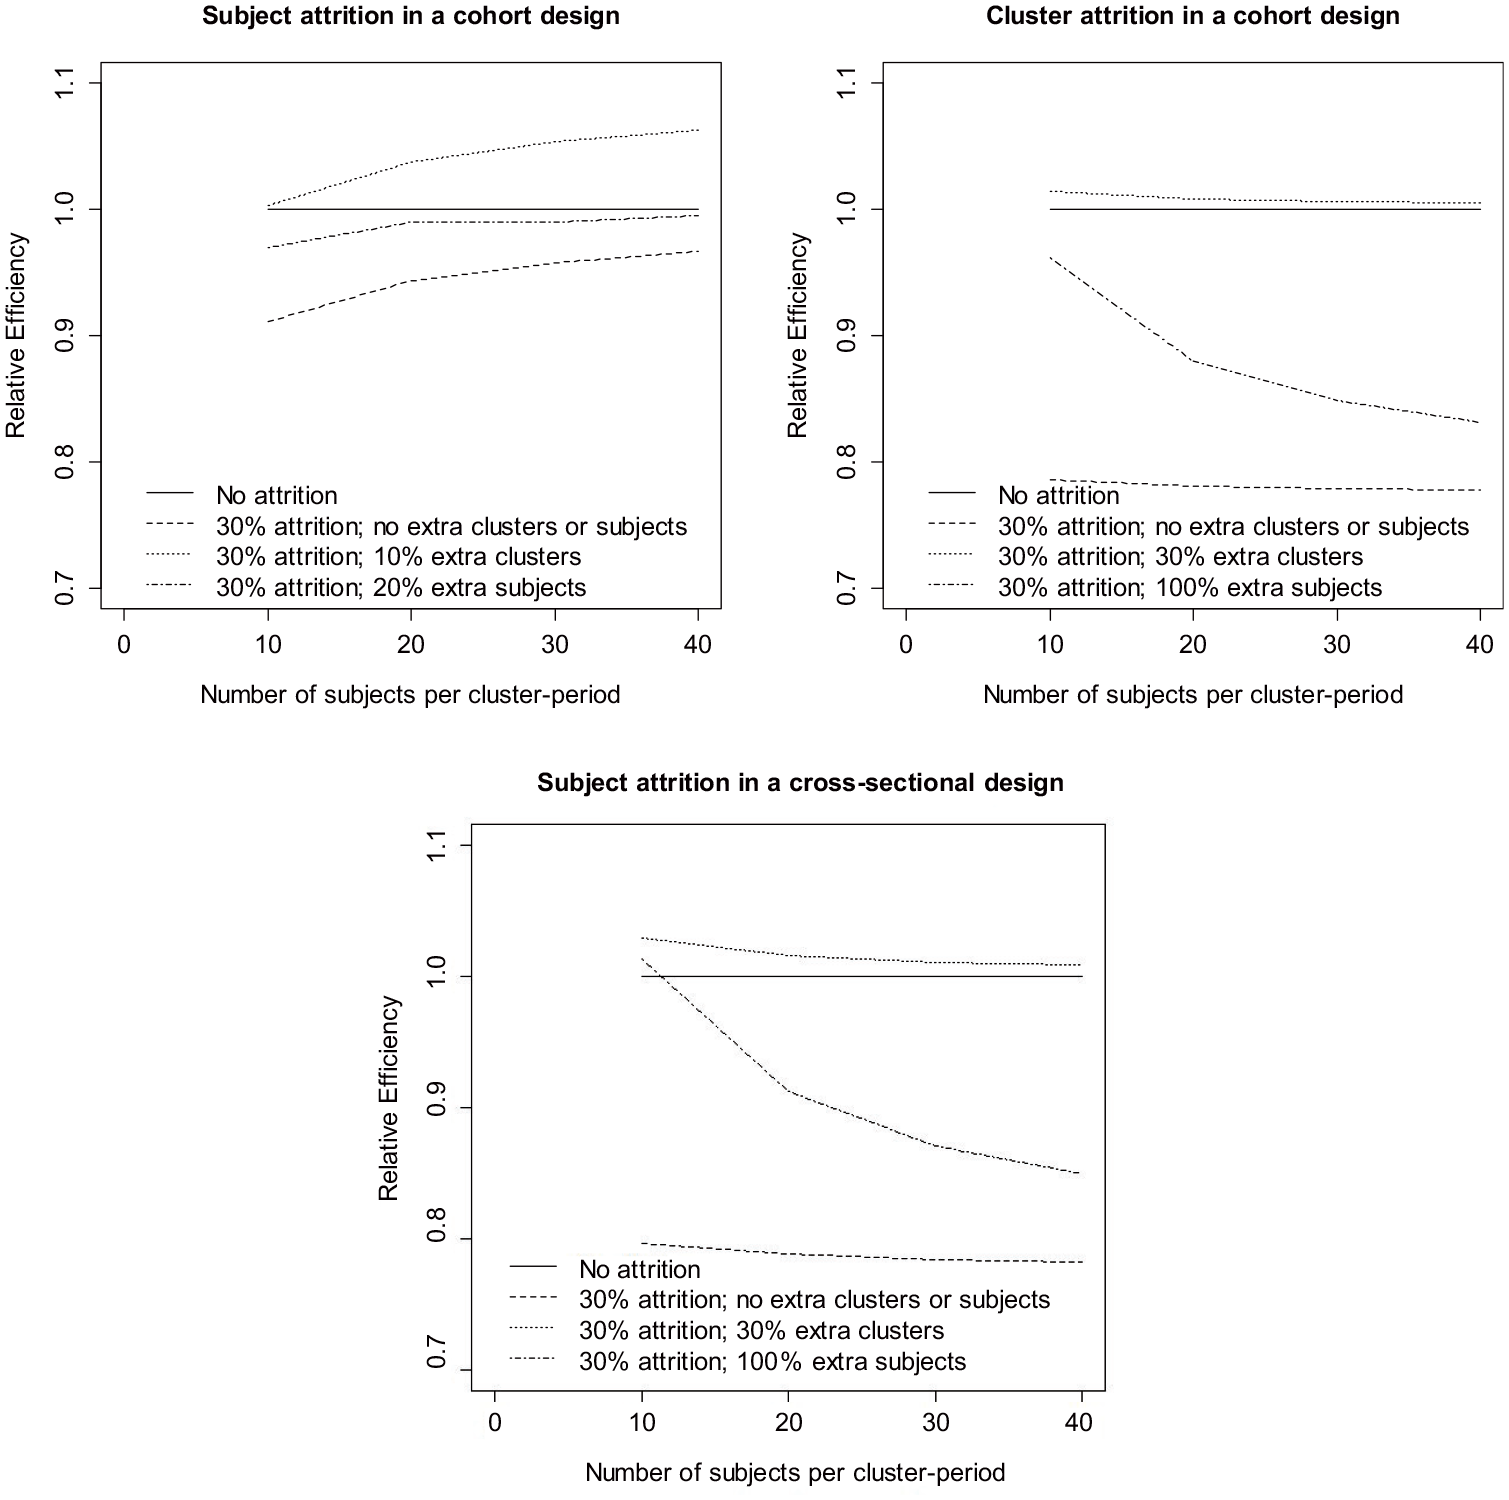
Repairing for anticipated attrition. For all graphs, the within-cluster between-period correlation
Repairing for attrition is a bigger challenge when clusters drop out, as is shown in the other panels of Figure 3. Increasing the number of clusters with 30% results in a relative efficiency slightly above 1. The effects of increasing the number of subjects are most evident for a small number of subjects per cluster-period
Unanticipated attrition
Unanticipated attrition is defined as attrition that a researcher does not anticipate before the start of the trial. In other words, only during the washout period does it become clear that some subjects or clusters will not continue to the second time period. The only means to repair for the loss of efficiency is increasing the number of subjects in the second time period within those clusters that do not drop out.
Sampling more subjects in the second time period than originally planned may raise issues with respect to informed consent and also administrative and practical issues. For instance, the number of subjects that may be enrolled in the second time period may be limited because a limited amount of material and equipment to deliver the treatments was ordered before the start of the study, or because a limited number of professionals who are eligible to deliver the treatments were contracted. In the worst case, the number of subjects that can be enrolled in the second time period cannot be larger than the number that was originally planned.
Figure 4 shows the effects of enrolling extra subjects in the second time period. As in Figure 3, the design without attrition is used as a reference. In all graphs, the values of the correlation coefficients are
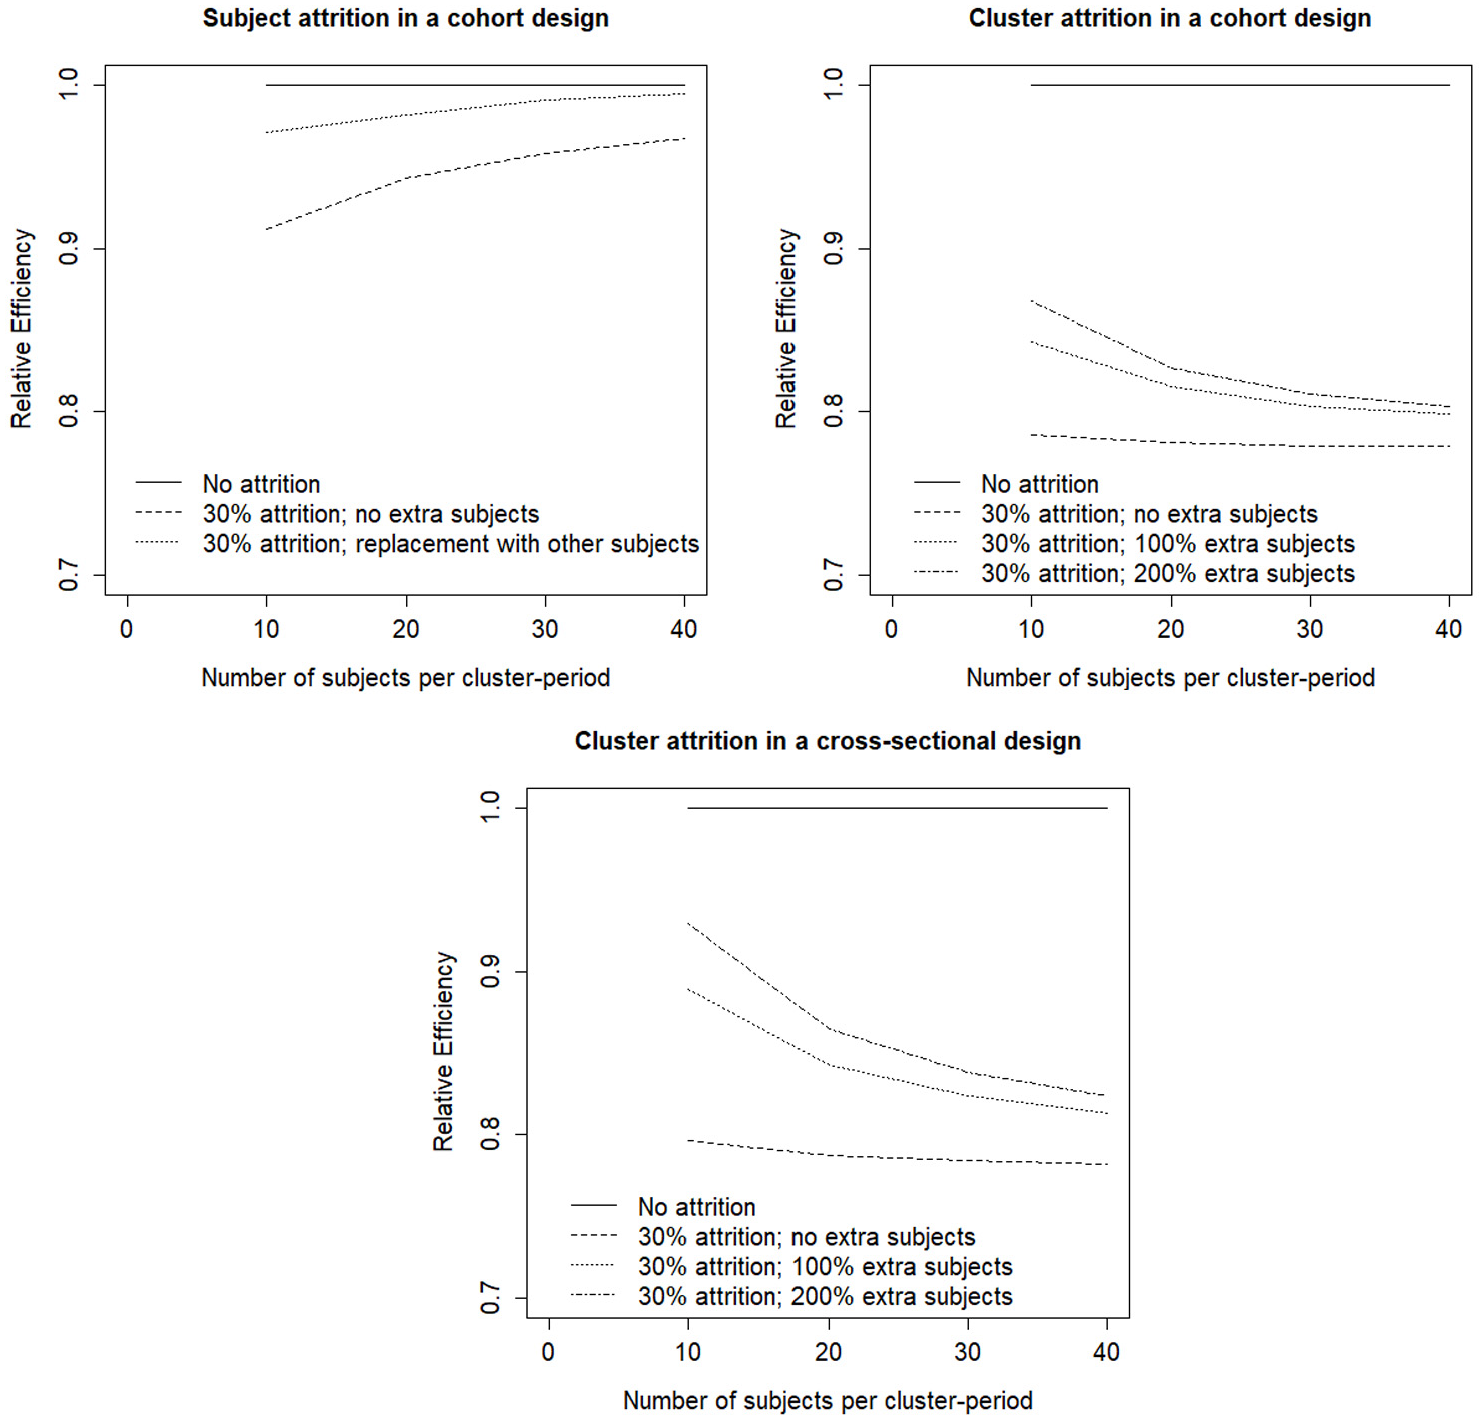
Repairing for unanticipated attrition. For all graphs the within-cluster between-period correlation
The panel at the top left shows the effect of replacing those subjects who drop out in a cohort design by others. The design thus becomes a mixture of a cohort and cross-sectional design: those subjects who do not drop out are measured in both time periods (i.e. they are the cohort part of the study) and all others in just one time period (i.e. they are the cross-sectional part). In other words, the study has an open cohort sampling structure. As is obvious, the efficiency of this strategy is between that of a study without attrition and that of a study with 30% attrition that does not replace subjects who drop out. This strategy is an effective means to increase efficiency, especially so for larger number of subjects per cluster-period.
Adjusting sample size for unanticipated attrition of clusters is more difficult than repairing for anticipated attrition. The top right and bottom panels show that even increasing the number of subjects in time period 2 by 200% does not result in a relative efficiency near 1. The effect of increasing the number of subjects in time period 2 becomes smaller when the number of subjects per cluster period increase. In addition, this strategy is somewhat less effective for the cohort design than for the cross-sectional design. For a Shiny App, the reader is referred to https://utrecht-university.shinyapps.io/CRXO2/.
Example: effects of lavender scent on dental patients’ anxiety
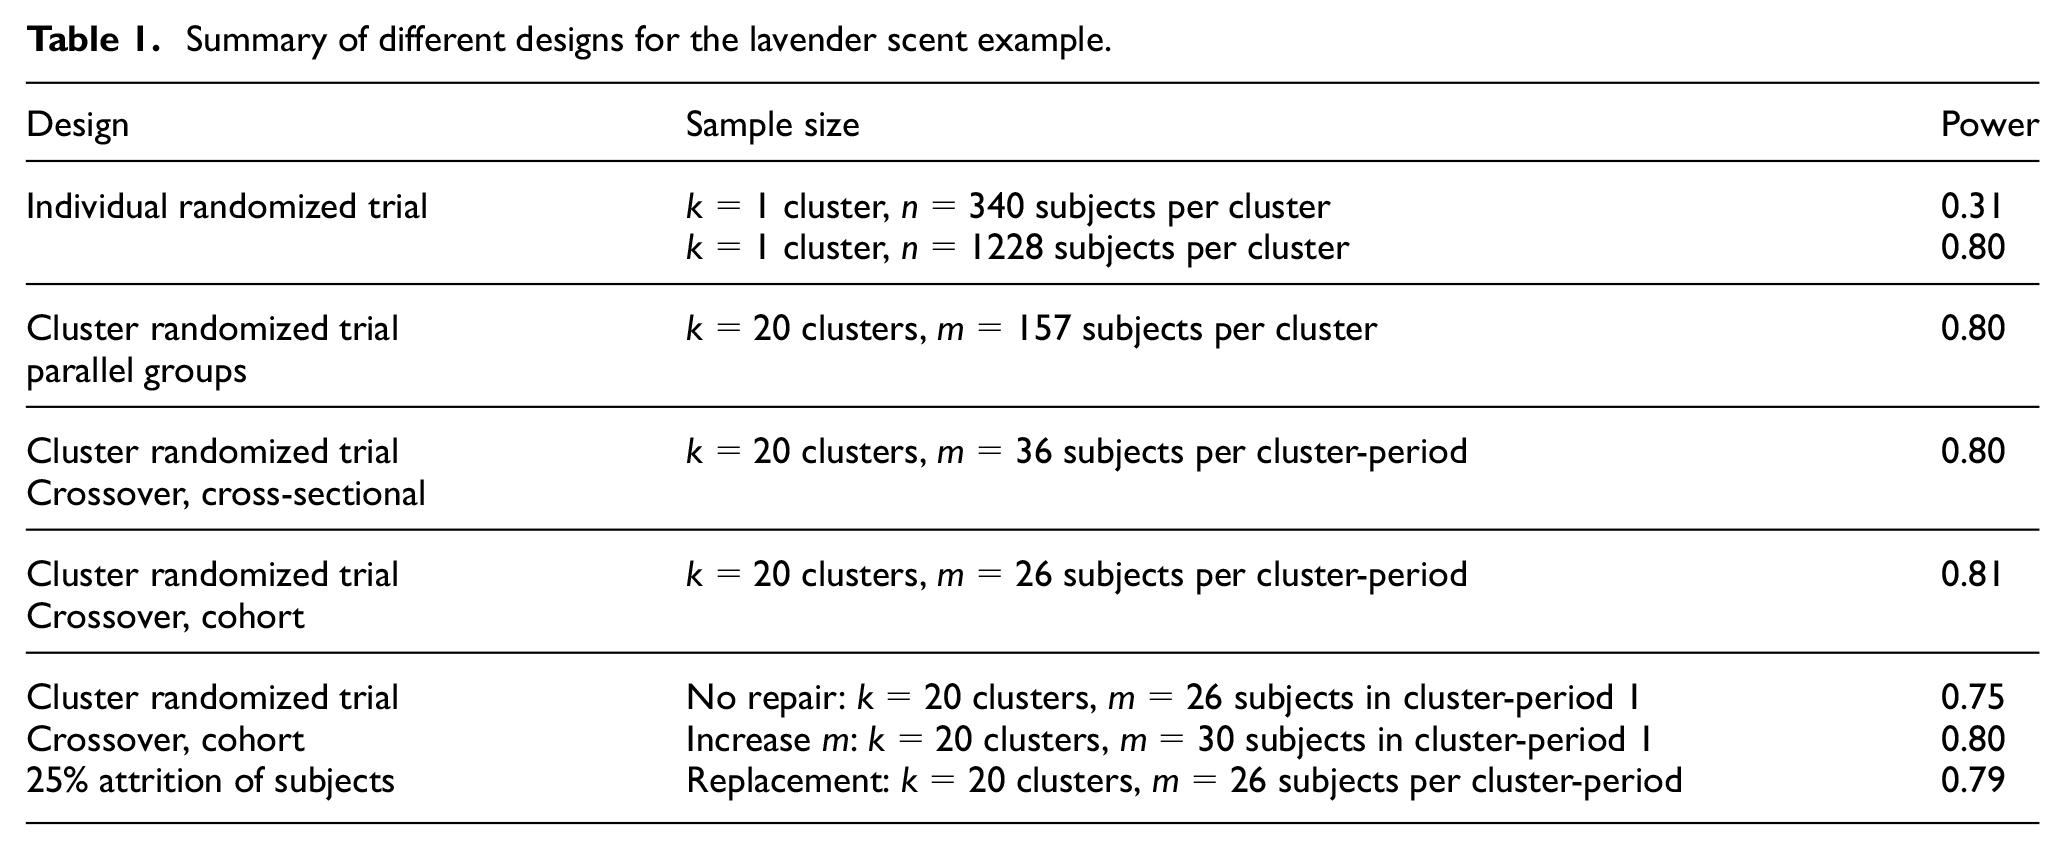
This example is based on a study on the effect of lavender scent versus no odor on dental patients’ anxiety. 32 A total of 340 patients agreed to participate; these were from one practice and randomization was done at the patient level. One of the outcomes was the Modified Dental Anxiety Scale. The difference between the two conditions was insignificant (F(1338) = 2.17, p > 0.05). The estimates were as follows: mean = 9.84, standard deviation (SD) = 4.74 (lavender) and mean = 10.65, SD = 5.40 (control), and hence the effect size was small (Cohen’s d = 0.16) and a total sample size of 1228 would have been needed to detect such an effect with 80% power in a two-sided test with α = 0.05. The power for a study with 340 subjects is only 0.31.
A sample of 1228 can hardly be recruited within a reasonable amount of time within just one dental practice. It is therefore needed to involve multiple dental practices in a cluster randomized trial. Suppose
A smaller sample size is needed in a crossover design. Suppose an a priori estimate of the within-cluster between-period correlation is
A cohort design further decreases the required number of subjects per cluster. Here, an a priori estimate
The risk of the cohort design is attrition of subjects. Let us assume an attrition rate of 25% per cluster, irrespective of treatment sequence. The power for a design with 26 subjects per cluster slightly drops to 0.75. The loss of power may be repaired by including 30 subjects per cluster; all of them are measured in period 1 but only 75% of them are measured in period 2. Another strategy is replacing those subjects who drop out by other subjects. In that case, the power is 0.79. All designs are summarized in Table 1.
Summary of different designs for the lavender scent example.
Conclusions and discussion
Attrition results in a loss of efficiency. In the case of subject attrition in a cohort design, the effect of attrition becomes smaller when the number of subjects per cluster-period increases. However, this sample size hardly influences the effect of attrition in the case clusters drop out. Cluster attrition results in a larger loss of efficiency than subject attrition. It should, therefore, be avoided at all costs because it is difficult to repair, especially so when the number of subjects per cluster-period is large. It may be more cost-efficient to spend money on incentives to motivate those clusters who tend to drop out to remain in the trial than to spend money on recruiting extra subjects.
The effect of attrition of clusters is somewhat larger in a cohort design than in a cross-sectional design, but the cohort design may still be more efficient in the case attrition occurs. For each study at hand, these two designs should be compared for realistic a priori estimates of the degree of attrition and intraclass correlation coefficients. The final choice should not only be based on statistical but also on practical considerations. A cohort design is only recommended when the intervention can be undone at the level of the subject. Furthermore, the study should be planned such that subjects can indeed participate in both time periods.
The results of this study may help researchers plan a cluster randomized crossover study in the case attrition is anticipated. The efficiency of a design depends on the intraclass correlations and degree of attrition, and a plausible a priori estimate for each of them should be available. An overview of papers that lists estimates of intraclass correlation coefficients for cluster randomized trials without crossover is given in Table 11.1 of Moerbeek and Teerenstra. 33 A similar table should also become available for cluster randomized trials with crossover. Researchers conducting such a trial are therefore encouraged to clearly report the estimates of the intraclass correlation coefficients. In addition, they are encouraged to report attrition rates and reasons for attrition at the subject and cluster level so that this information can be used in planning future trials, see also item 16 in proposed reporting items for cluster randomized crossover trials. 34
An obvious extension of this work is to more complicated cluster randomized crossover trials that include more than two treatments and/or more than two time periods, where the attrition rate may change over time. It may also be interesting to study the optimal number of time periods in a trial of fixed duration, as a function of attrition and for different correlation structures. It has been shown that for the continuous-decay within-cluster correlation structure, greater numbers of crossovers result in greater study power, 35 and it should be verified if this is still the case of attrition is present.
Furthermore, it is also necessary to study the effect of attrition for the cluster randomized stepped wedge design where the number of time periods, and hence the number of measurements, is typically larger than two.36,37 This implies there are multiple points in time where attrition may occur; hence the results of this article do not easily translate to the stepped wedge design.
Other directions for future research are exploring the effects of attrition in the case where clusters and subjects may drop out simultaneously, and for non-continuous outcome variables. Another avenue of future research would be the impact of non-random attrition, that is, when missing data are missing not at random.
Supplemental Material
Supplementary_File_1 – Supplemental material for The cluster randomized crossover trial: The effects of attrition in the AB/BA design and how to account for it in sample size calculations
Supplemental material, Supplementary_File_1 for The cluster randomized crossover trial: The effects of attrition in the AB/BA design and how to account for it in sample size calculations by Mirjam Moerbeek in Clinical Trials
Supplemental Material
Supplementary_File_2 – Supplemental material for The cluster randomized crossover trial: The effects of attrition in the AB/BA design and how to account for it in sample size calculations
Supplemental material, Supplementary_File_2 for The cluster randomized crossover trial: The effects of attrition in the AB/BA design and how to account for it in sample size calculations by Mirjam Moerbeek in Clinical Trials
Footnotes
Declaration of conflicting interests
The author(s) declared no potential conflicts of interest with respect to the research, authorship and/or publication of this article.
Funding
The author(s) received no financial support for the research, authorship and/or publication of this article.
Supplemental material
Supplemental material for this article is available online.
References
Supplementary Material
Please find the following supplemental material available below.
For Open Access articles published under a Creative Commons License, all supplemental material carries the same license as the article it is associated with.
For non-Open Access articles published, all supplemental material carries a non-exclusive license, and permission requests for re-use of supplemental material or any part of supplemental material shall be sent directly to the copyright owner as specified in the copyright notice associated with the article.