
Abstract
Background
The National Institutes of Health is one of the largest biomedical research agencies in the world. Clinical trials are an important component of National Institutes of Health research efforts. Given the recent updates in National Institutes of Health trial reporting requirements, more information regarding the current state of National Institutes of Health–funded clinical trials is warranted. The objective of this analysis was to describe characteristics and trends of clinical trials funded by the National Institutes of Health over time and by Institutes and Centers of the National Institutes of Health.
Methods
Interventional studies funded by the National Institutes of Health and registered in ClinicalTrials.gov between 2005 and 2015 were included in the analysis. Trials were identified from the 27 March 2016 Clinical Trials Transformation Initiative Aggregate Analysis of ClinicalTrials.gov database. A descriptive analysis of trials by year and National Institutes of Health Institute/Center was performed.
Results
There were 12,987 National Institutes of Health–funded clinical trials registered between 2005 and 2015. There were 1,580, 1,116, and 930 trials registered in 2005, 2010, and 2015, respectively. The majority were early-development trials (phases 0, 1, or 2; 53%), randomized (61%), and single-center (63%). Trial demographics have remained unchanged over time. Median trial sample size was 64 (interquartile range 29–192) with 10% of trials enrolling ≥500 participants. Most trials were completed within 5 years of enrollment start (69%). Trial characteristics varied considerably across National Institutes of Health Institutes and Centers. Results were reported under the assumptions that most National Institutes of Health–funded trials are registered in ClinicalTrials.gov and that trials are being registered completely and accurately.
Conclusion
In conclusion, there has been a decline in the number of trials being funded over time, explained in part by a relatively constant budget, increases in trial costs, or other factors that cannot be quantified. National Institutes of Health–funded trials are relatively small and tend to be single-centered. There are substantial differences in the number and types of trials done by Institutes and Centers within the National Institutes of Health.
Keywords
Introduction
The National Institutes of Health (NIH) is one of the largest biomedical research agencies in the world. Clinical trials are an important component of NIH research efforts. To date, little is known with regard to the trends and characteristics of NIH-funded trials. Prior to registration, the task of describing such characteristics was not possible because information had to be based on data from published trials, a biased subset. With clinical trial registration, we now have access to information on clinical trials, whether or not published. 1
The notion of registering trials emerged in the 1980s primarily because of concerns regarding publication bias: the tendency for authors and editors to publish results supporting conclusions favoring a particular hypothesis or position.2–5 Calls for registration eventually led the US Food and Drug Administration (FDA), in the Modernization Act of 1997, to require the establishment of a system of registration pertaining to trials of agents regulated by the FDA. The Act gave rise to ClinicalTrials.gov, operated by the National Library of Medicine of the NIH. Since its launch in 2000, over 230,000 studies have been registered in ClinicalTrials.gov, and it is anticipated that more trials will be registered in coming years, due to changes in registration requirements. First, in 2005, the International Committee of Medical Journal Editors announced that publication would be conditional upon trial registration prior to initiation of enrollment. 6 Subsequently, the Food and Drug Administration Amendment Act (FDAAA 801) of 2007 expanded reporting requirements and the types of trials to be registered, as well as increasing the number of data elements to be reported. Most recently, the release of the Final Rule for FDAAA 801 in September 2016 has further clarified and expanded statutory requirements for trial reporting. 7 The NIH issued an additional policy that requires all NIH-funded trials to be registered, regardless of whether they are covered under FDAAA 801 requirements. 7
Given the recent updates in NIH trial reporting requirements, more information regarding the current state of NIH-funded clinical trials is warranted. While there have been other reports that have summarized characteristics of clinical trials from ClinicalTrials.gov, there have not been any reviews that focus solely on NIH-funded trials and evaluate differences over time and across Institutes and Centers. Thus, the objective was to describe the characteristics and trends of clinical trials funded by the NIH, summarized by year and by Institutes and Centers.
Methods
Clinical trials data source
Data from NIH-funded clinical trials registered in ClinicalTrials.gov between 2005 and 2015 were analyzed. Counts and summary statistics were generated using data downloaded from the Clinical Trials Transformation Initiative Aggregate Analysis of ClinicalTrials.gov (AACT) database.
The AACT database is a restructured database of the ClinicalTrials.gov data that provides exports of the relational database as either Oracle data management platform, pipe delimited text output, or SAS CPort transport files. 8 The AACT database is updated every 6 months and includes all clinical trials registered in ClinicalTrials.gov to that date. Analyses were done using the 27 March 2016 database, publicly available at: http://www.ctti-clinicaltrials.org/. 8 The National Clinical Trials identification number was used to link tables and merge the AACT dataset with an export of the ClinicalTrials.gov dataset. Identification numbers are assigned through ClinicalTrials.gov upon registration and are included in both databases as the key identifier. Navigation through the AACT database was accomplished using the AACT comprehensive data dictionary (http://www.ctti-clinicaltrials.org/what-we-do/analysis-dissemination/state-clinical-trials/aact-database).
Data analysis
We performed a descriptive analysis of clinical trials registered between 2005 and 2015 in the ClinicalTrials.gov database. In most tables, we present data by year (Panel A) and by NIH Institutes and Centers (Panel B). The analysis is limited to interventional studies (clinical trials), as defined in ClinicalTrials.gov. 9 The analysis was also limited to NIH-funded trials identified from the “agency_class” variable in the “sponsors” table of the AACT database. There were 31 different Institutes and Centers included in the analysis listed under the “agency” variable and indicated as either “lead sponsors” or “collaborators.” Any trial in which an NIH Institute or Center was listed as “sponsor” (“The organization or person who oversees the clinical study and is responsible for analyzing the study data”) or “collaborator” (“An organization other than the sponsor that provides support for a clinical study. The support may include funding, design, implementation, data analysis, or reporting”) was included in the analysis. 9
Some trials were listed as being funded by two or more NIH Institutes or Centers. Trial identification numbers are counted only once in tabulations represented in the A panels of tables and counted for each funding Institute or Center in the B panels of tables. For example, a trial registered in 2007, and funded by three different institutes, would be counted only once for the year 2007 in Panel A and counted once for each funding Institute or Center associated with this particular trial in Panel B. In Panel B, NIH Institutes and Centers were categorized by number of trials registered for those with ≥100 trials. Those with <100 trials are listed in Supplementary Table 1. Some trials were listed as “NIH” without any Institute or Center designation and referred to as “NIH-Not Otherwise Specified.” There were seven individual sponsor names listed under “agencies” in the AACT database that were excluded from the analysis as they did not belong to any specific NIH institution or center.
Characteristics of interest included age and sex distributions, study design, trial phases, and enrollment sizes. Sex and age groups were summarized using variables in the AACT “clinicalstudy_noclob” table. Sex groups were summarized as “male only”; “female only”; and “both male and female.” Age groups were categorized as “child only”; “adult only”; “adult and senior,” or other. Details of the study designs were extracted from the allocation variable in the “designs” table and from the “study_design” variable in the ClinicalTrials.gov database. A trial was counted as randomized if the variable was recorded as “random” and counted as not randomized if the variable was recorded as “nonrandom” or left blank. To determine the proportion of multicenter trials, trials with more than one site were considered “multicenter,” and trials with one site or left blank were counted as single-center. Clinical trial phases were defined and described using the ClinicalTrials.gov definitions. 9
Sample size was determined from the “enrollment” variable labeled as either “anticipated” or “actual.” For trials still enrolling, registrants were to set the “Enrollment_Type” variable to “anticipated” to indicate “expected enrollment.” When enrollment was completed, the “Enrollment_Type” variable was set to “actual” and the finished sample size recorded.
Tabulations were replicated independently by two authors (G.K.G. and J.L.M.). Discrepancies were discussed and resolved.
Results
A total of 211,437 studies were included in the 27 March 2016 AACT database of which 170,347 were registered as interventional studies (clinical trials). After limiting the year first received to 2005–2015, 156,608 trials were included. After limiting to trials funded by “NIH” and controlling for multiple counts of trials funded by more than one Institute or Center (n = 1,015), a total of 12,987 unique trials were included and sorted by year in Panel A. There has been a decline from 1,580 trials registered in 2005 to 930 trials registered in 2015 (Figure 1). The majority of NIH-funded trials are phase 1 (17%) and phase 2 (35%). Phase 3 and phase 4 trials make up about 11% and 5% of the trial portfolio over the last 10 years. A third of NIH-funded trials were classified as “Other” phase or “Phase not specified.” “Other” trials refer to trials that do not fit the definition of phases. Over time, there has been a decline in the percentage of phase 3 or 4 trials and an increase in “other” trials (Table 1, Panel A).
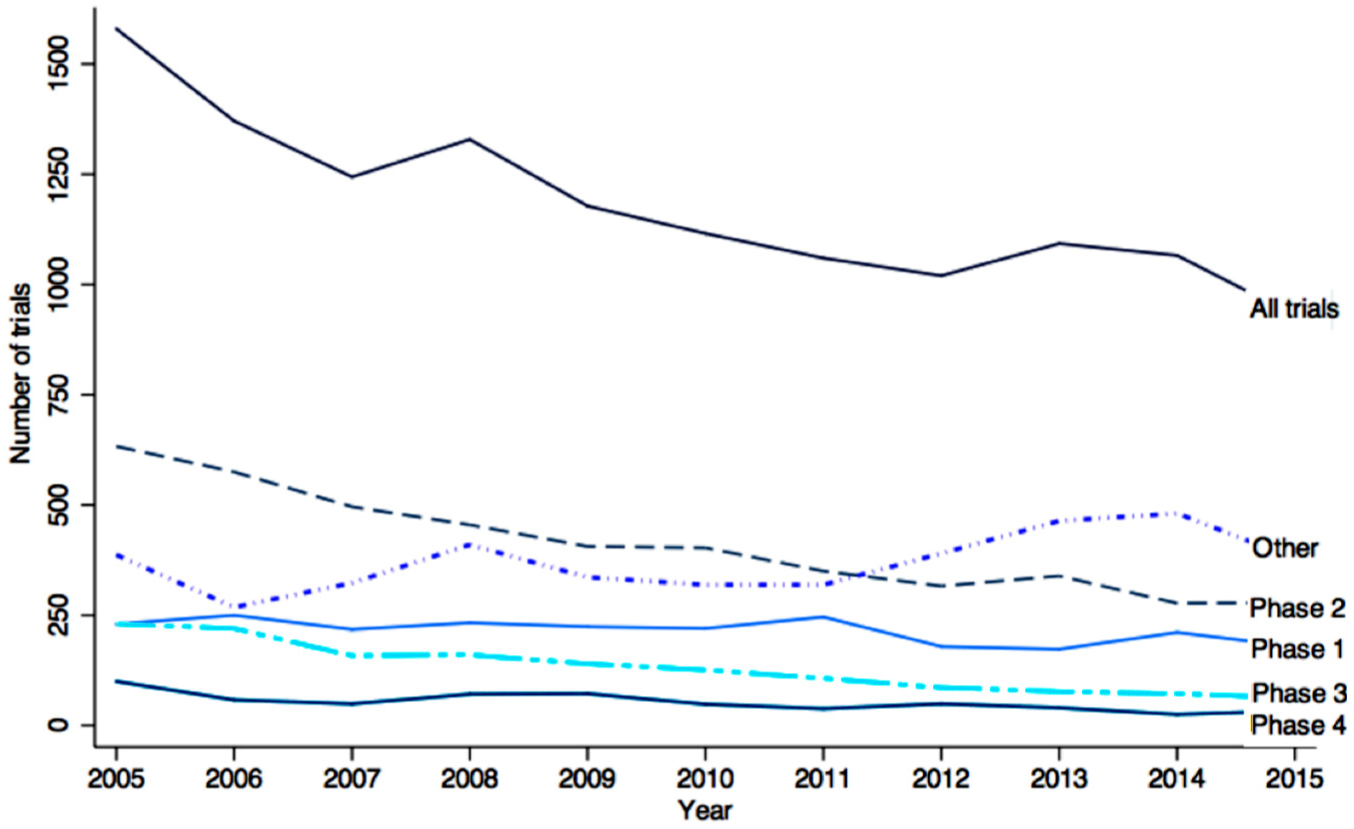
Number of NIH-funded, registered trials by phase and year of registration.
Trial phases a by year (Panel A) and NIH Institutes and Centers (Panel B).
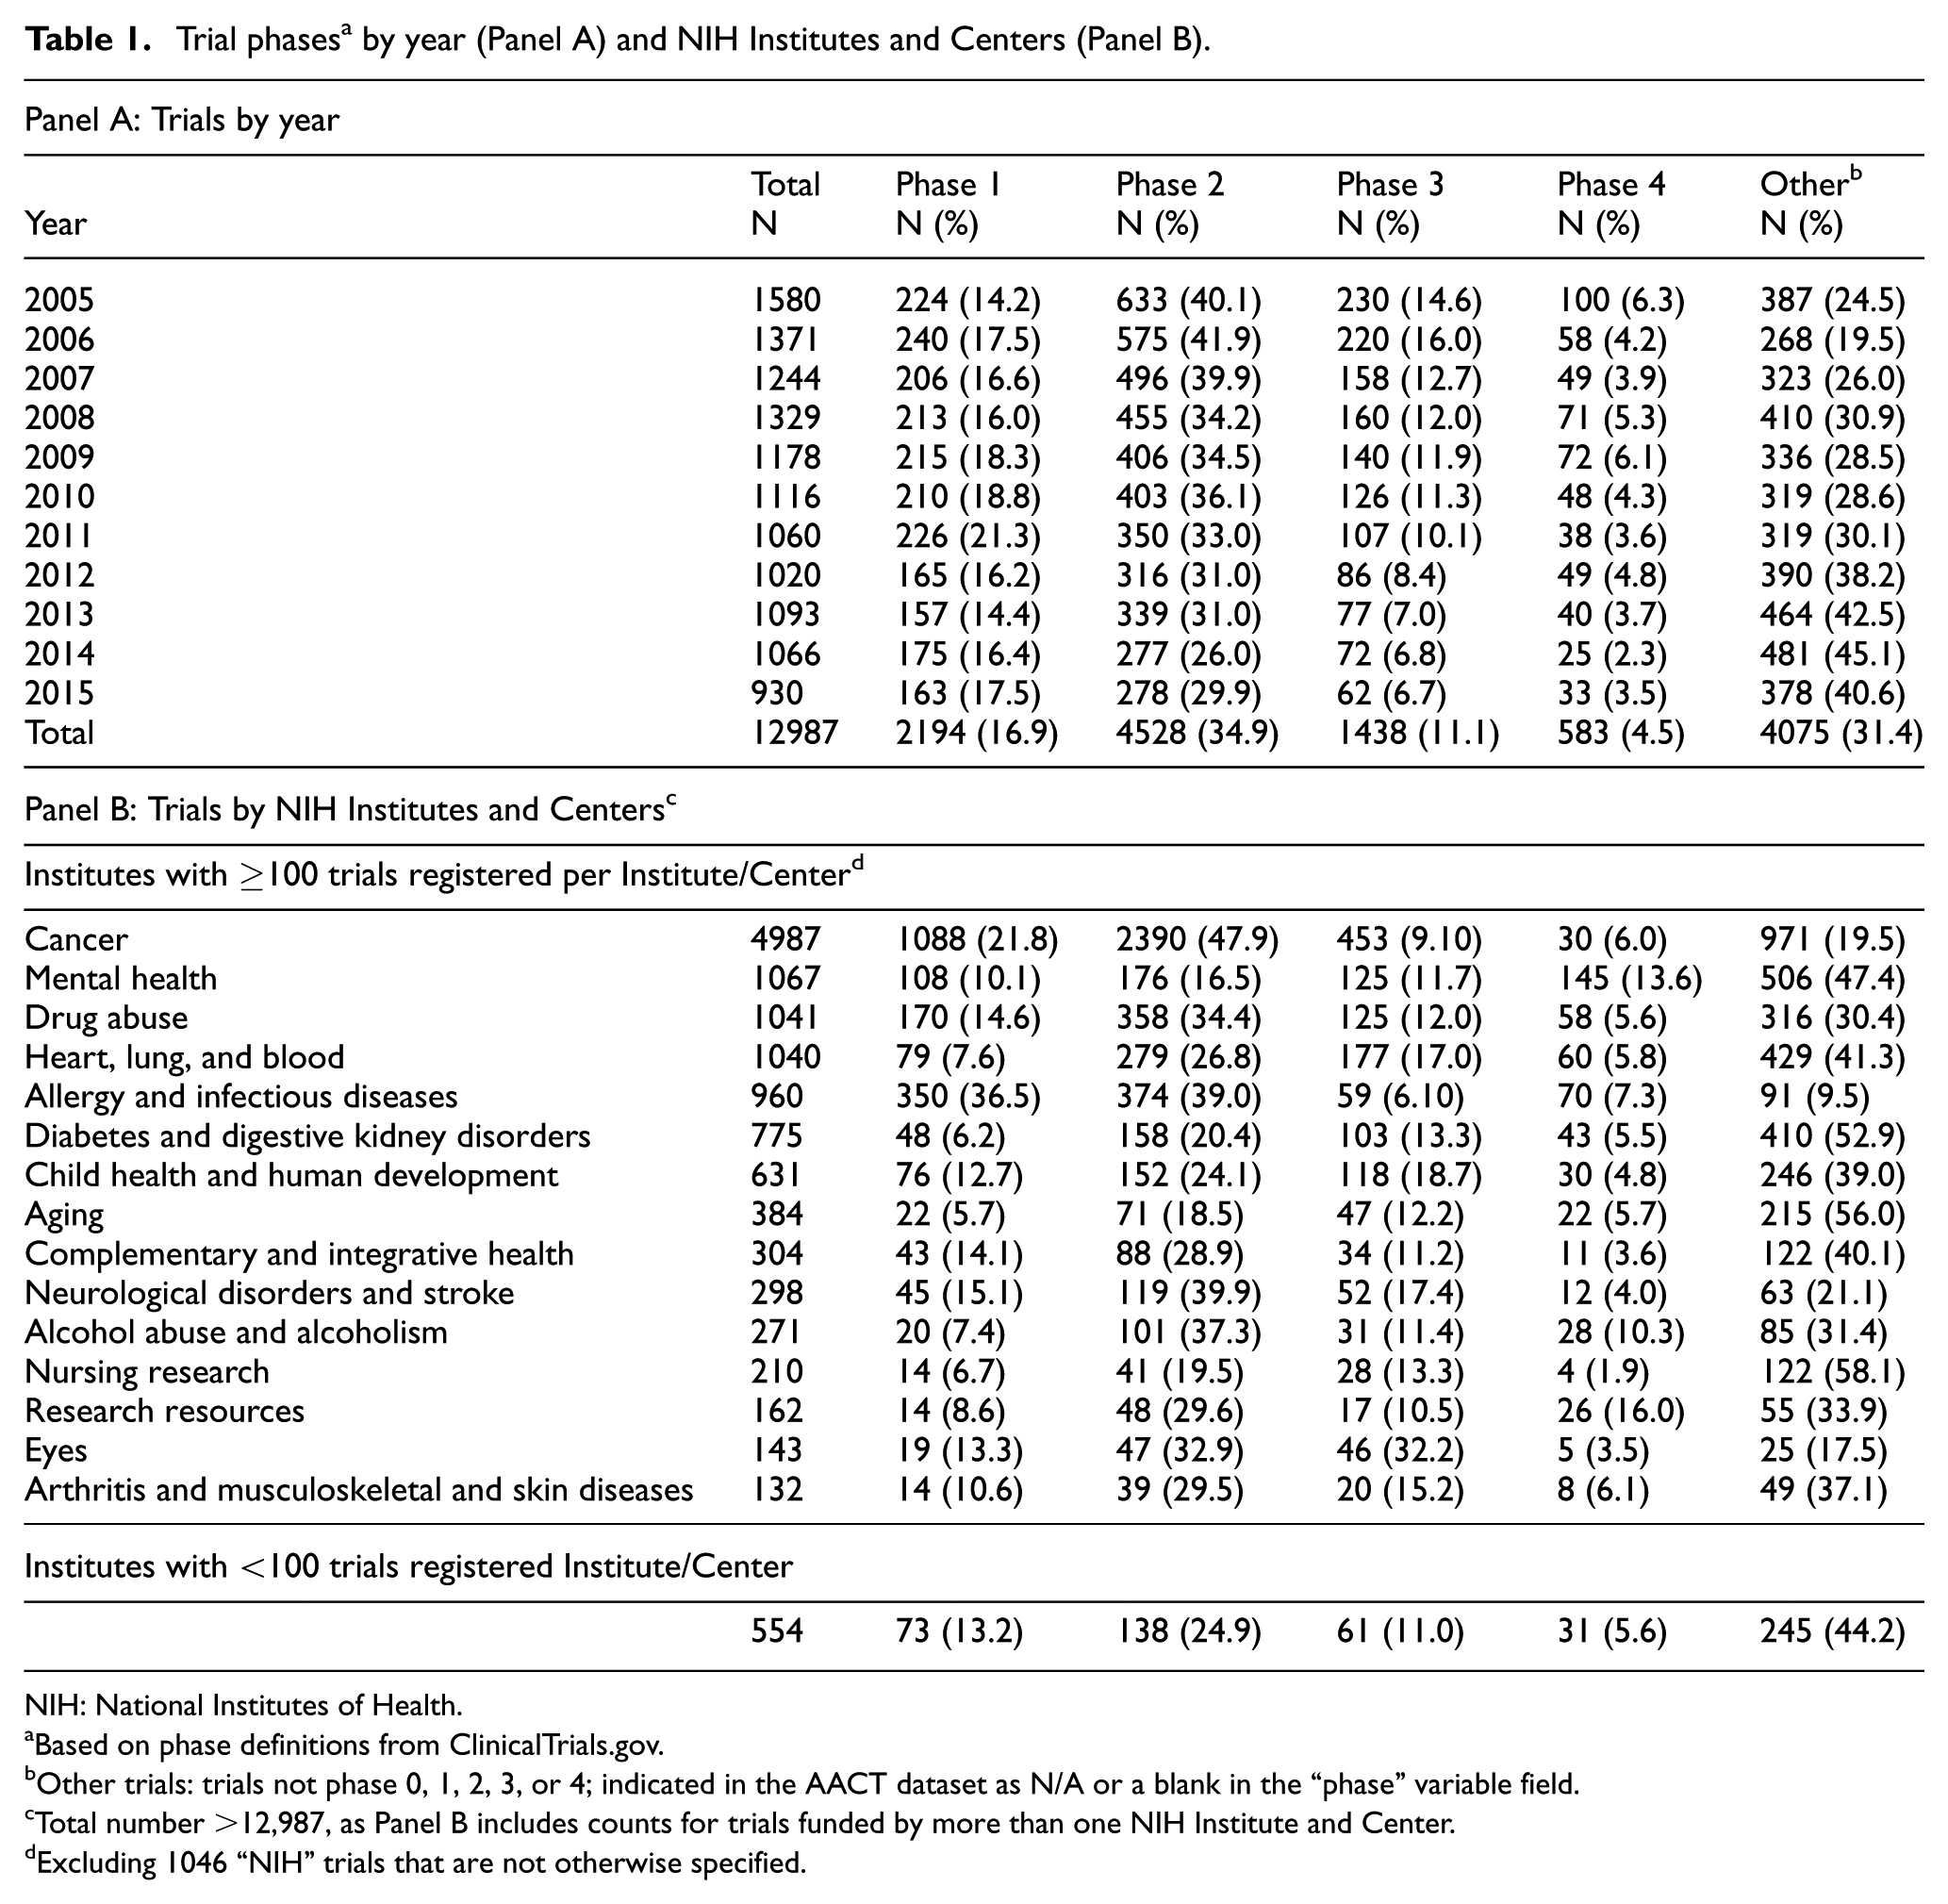
NIH: National Institutes of Health.
Based on phase definitions from ClinicalTrials.gov.
Other trials: trials not phase 0, 1, 2, 3, or 4; indicated in the AACT dataset as N/A or a blank in the “phase” variable field.
Total number >12,987, as Panel B includes counts for trials funded by more than one NIH Institute and Center.
Excluding 1046 “NIH” trials that are not otherwise specified.
Of the 27 Institutes and Centers listed, 15 had 100 or more clinical trials registered (>95% of all trials registered). The number of trials declined over time for Institutes and Centers with 100 or more trials registered, although stayed constant for Institutes and Centers with less than 100 trials registered (Supplementary Figure 1). The National Cancer Institute has the most trials (n = 4,986), while the Office of Rare Diseases has the least (n = 10). National Center for Medical Rehabilitation Research, part of the Eunice Kennedy Shriver National Institute of Child Health and Human Development, and Therapeutics for Rare and Neglected Diseases, part of the National Center for Advancing Translational Science, each registered three trials. There were 1,047 trials funded by “NIH-Not Otherwise Specified” that were excluded from counts in Panel B.
The NIH Institutes and Centers vary widely in distribution of trials by phase (Table 1, Panel B). For example, about 70% of the National Cancer Institute trials are registered as phase 1 or 2 trials compared to 24% of National Institute on Aging trials. The National Eye Institute conducts the largest percentage of phase 3 trials (32%) and the National Center for Research Resources funds the most phase 4 trials (16%). Overall, there were 4,075 trials classified as “other.” The majority of “other” trials were “behavioral” or “dietary” trials (55%). Some were classified as “device” trials (6%).
The composition of trials by age and sex over time and by NIH Institute or Center is shown in Table 2. The distribution of age and sex has been constant over time (Table 2, Panel A). The majority of trials include both females and males (85%). Female-only trials (11%) outnumber male-only (4%) trials about three to one. The majority of trials (93%) included combinations of adults only, seniors only, or other age combinations, while the remainder of trials (7%) included children only.
Sex and age distribution by year (Panel A) and NIH Institutes and Centers (Panel B).
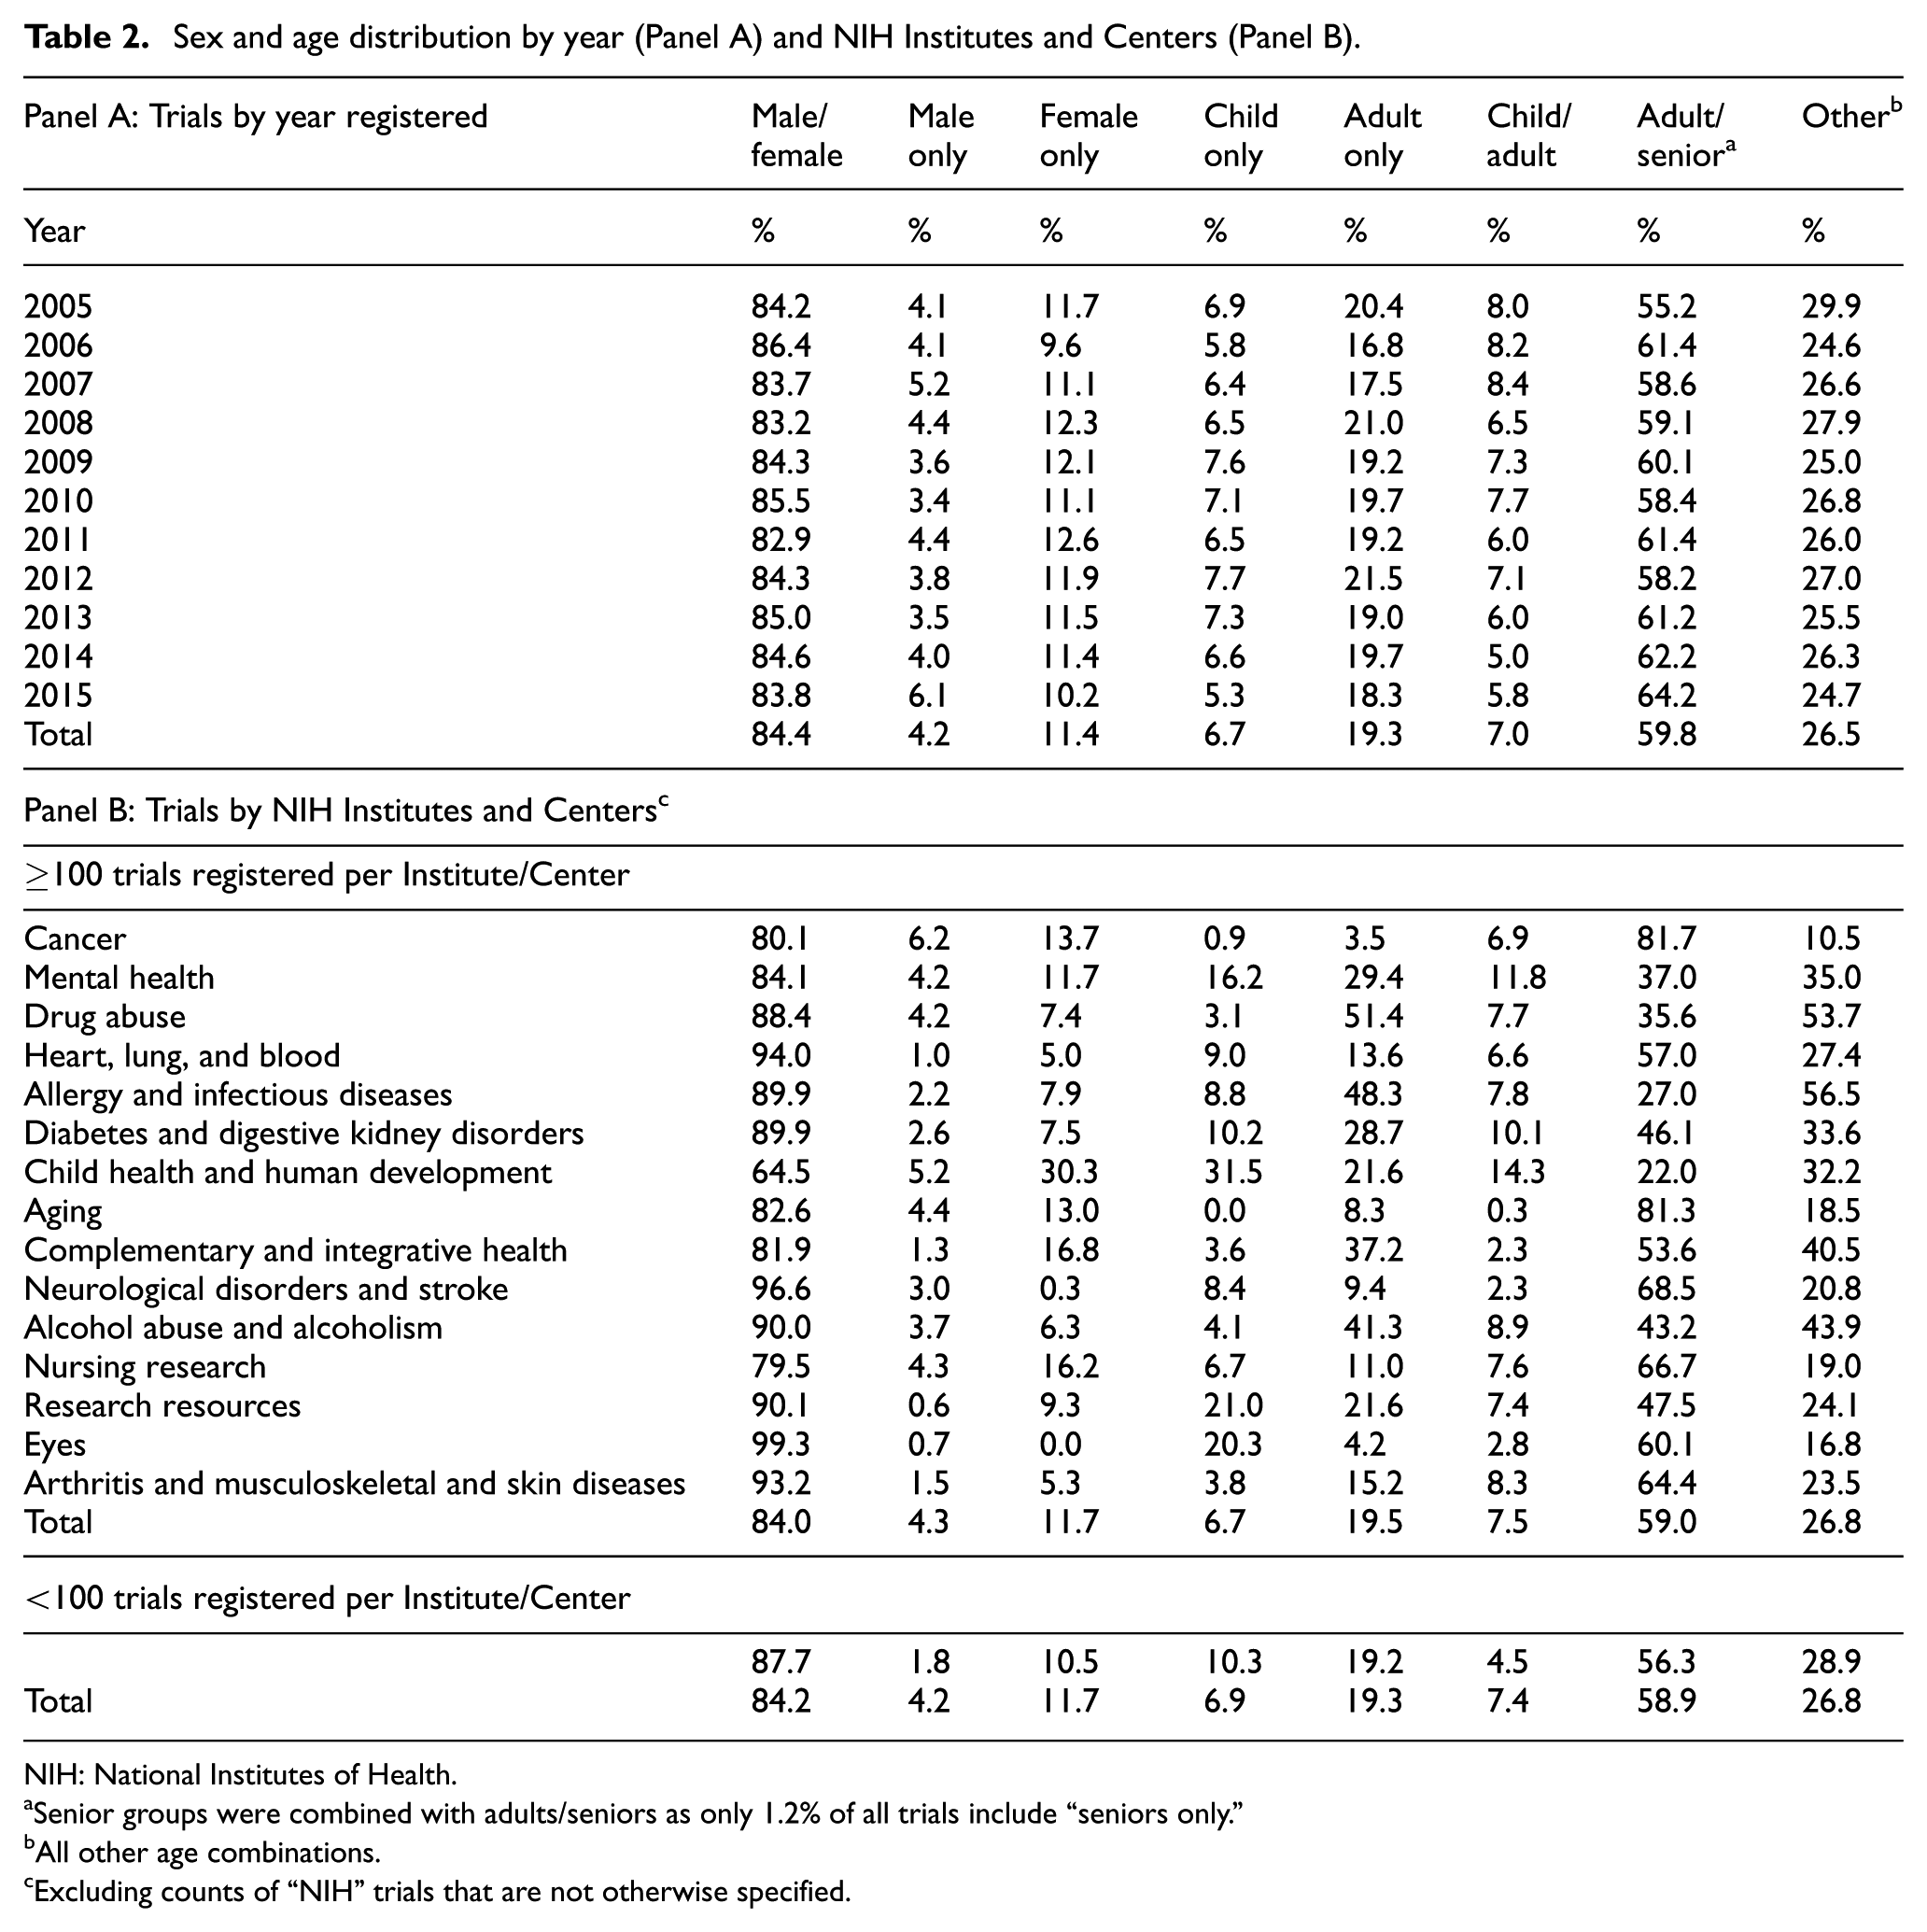
NIH: National Institutes of Health.
Senior groups were combined with adults/seniors as only 1.2% of all trials include “seniors only.”
All other age combinations.
Excluding counts of “NIH” trials that are not otherwise specified.
The percentages of trials that are multicenter and randomized have remained unchanged over time: 33% multicenter and 61% randomized (Supplementary Table 2). The National Institute of Allergy and Infectious Diseases has the most multicenter trials (50%) and the National Center for Complementary and Integrative Health the least (16%). The National Institute of Nursing Research has the highest percentage of randomized trials (94%) and the National Cancer Institute the lowest (32%). When categorizing by trial phase, 45.9% of Phase 1–2 trials, 88.9% of Phase 3–4, and 72.3% of “Other” trials were randomized.
Median sample sizes and interquartile ranges by year and Institutes and Centers are displayed in Figure 2(a) and (b). Overall, the median sample size of all NIH-funded trials was 64 (29–192). Median sample sizes by phase were 31 (15–90) for phase 0; 30 (18–57) for phase 1, 55 (28–120) for phase 2, 306 (145–692) for phase 3, and 108 (48–250) for phase 4 trials. Median sample size was 113 (45–300) for “Other” trials (Supplementary Table 3).
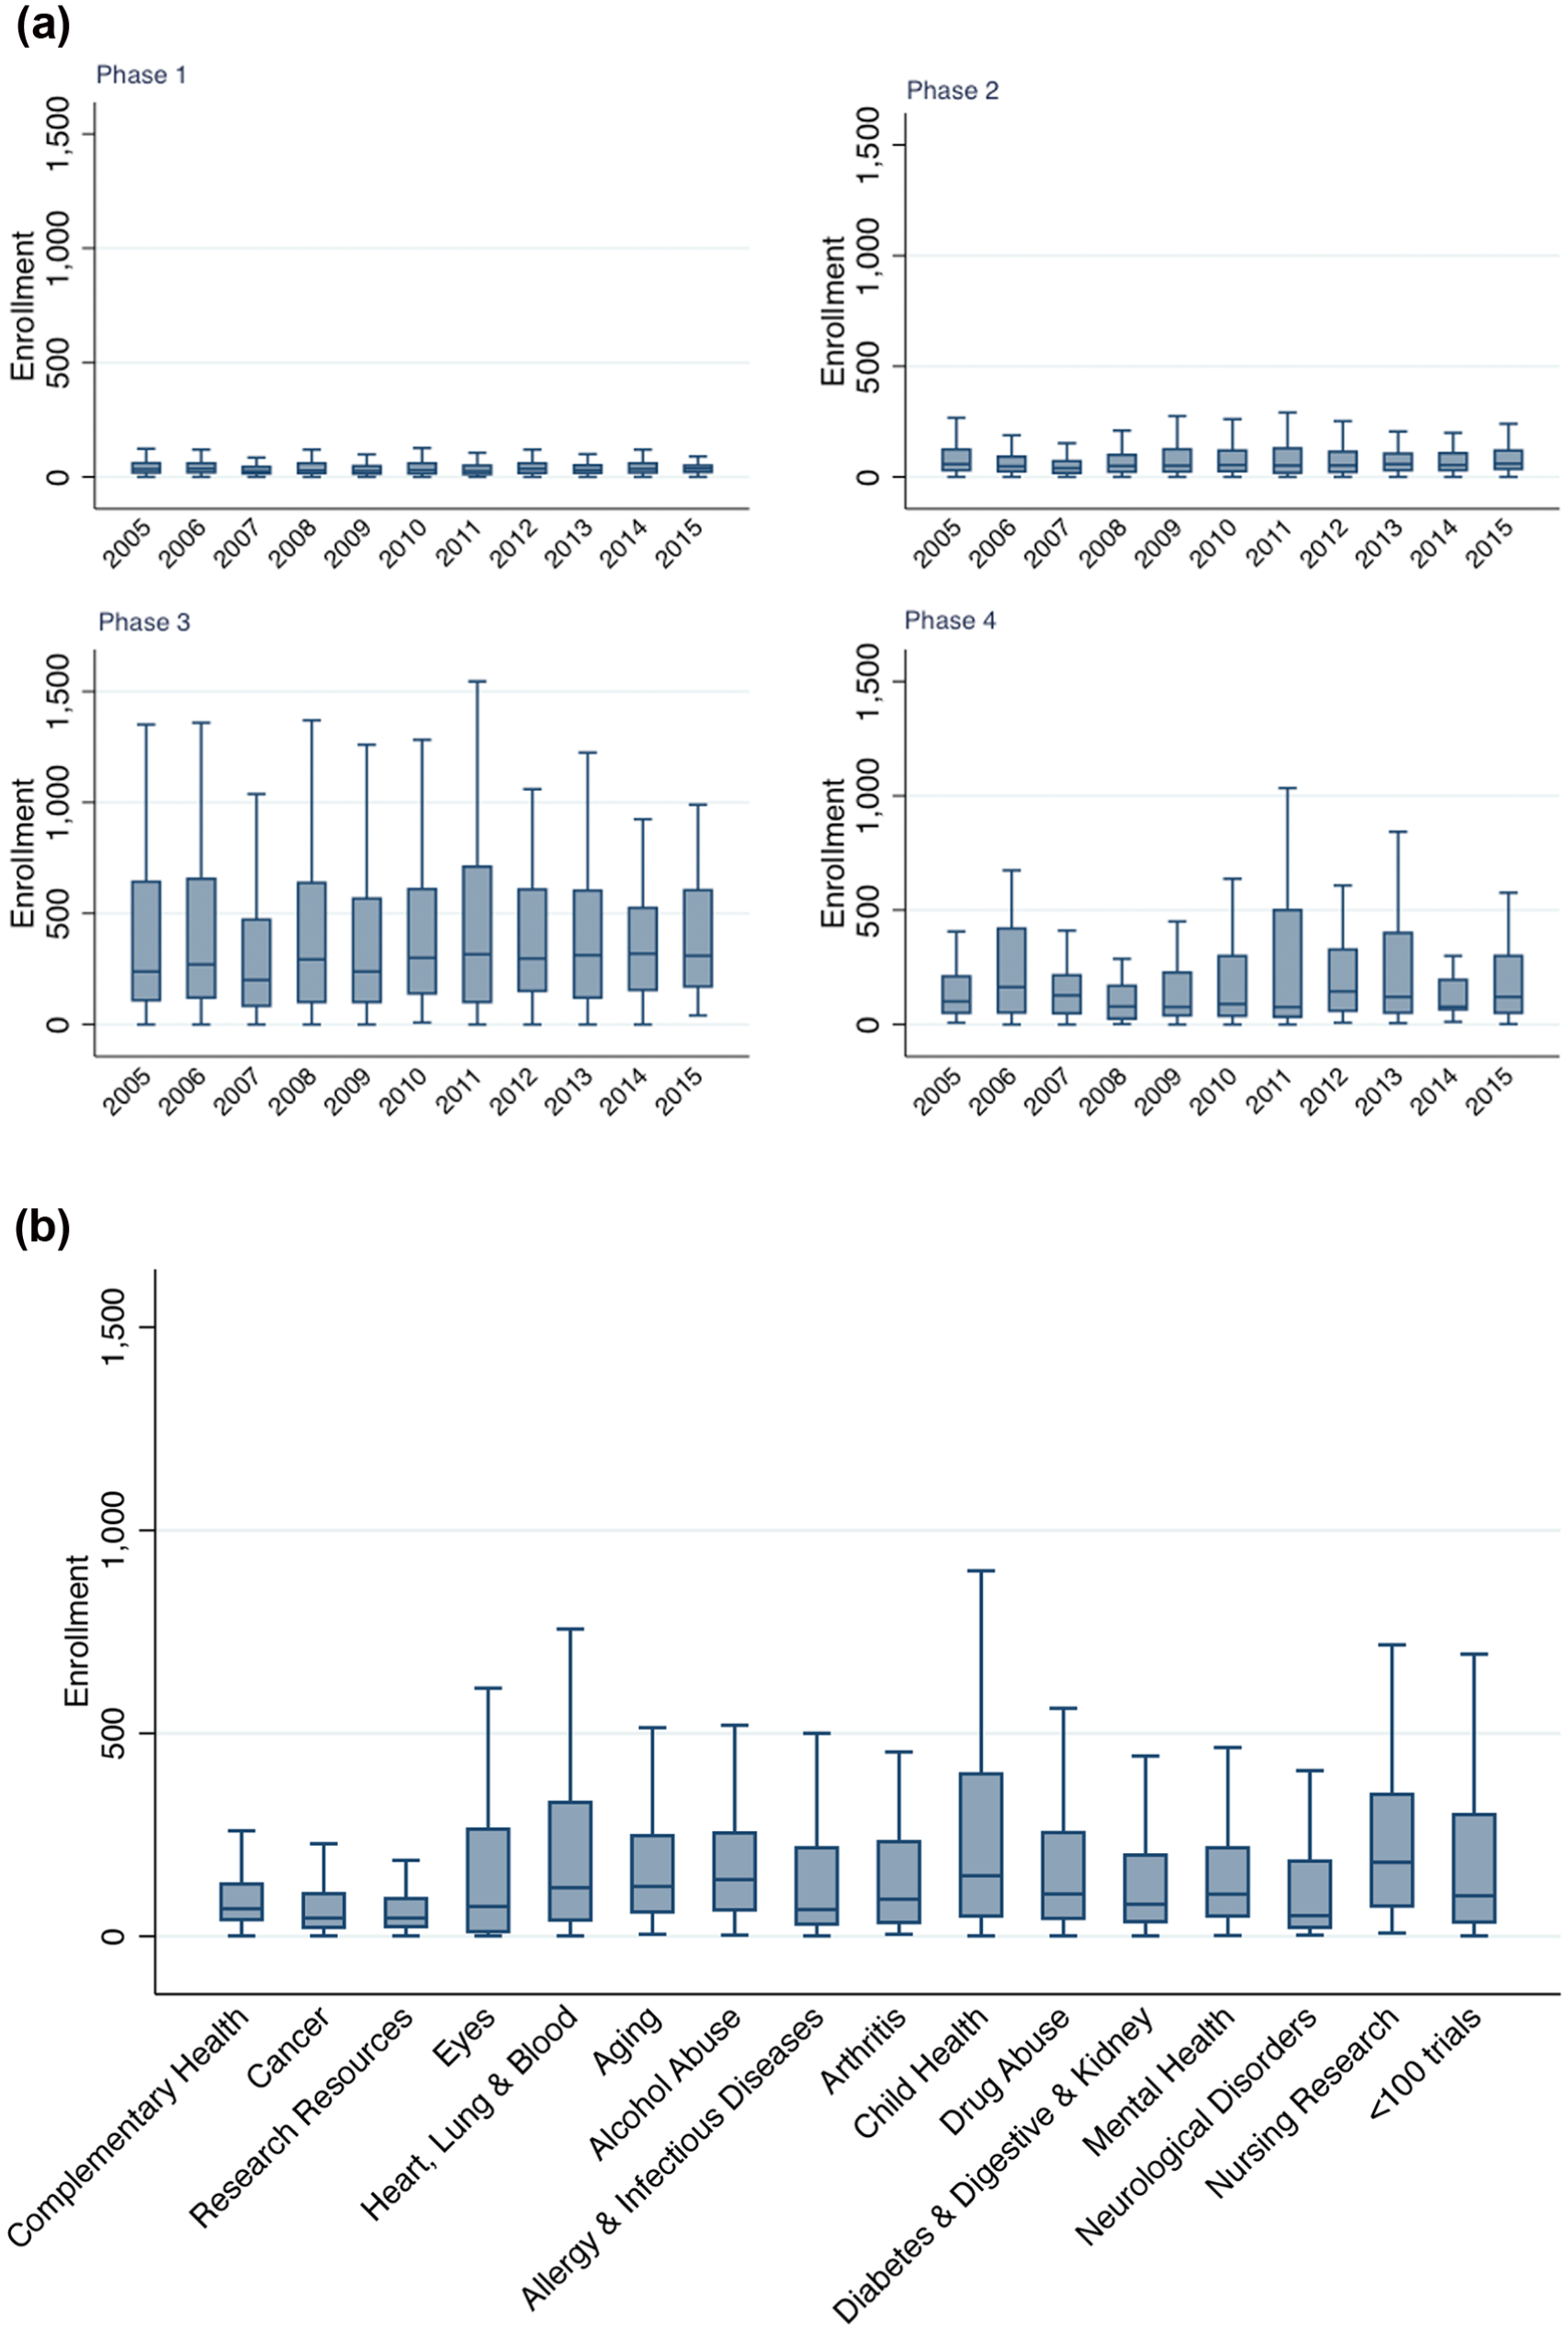
(a) Median enrollment into NIH-funded, registered trials by year and phase and (b) median enrollment into NIH-funded, registered trials by Institute and Center.
There were 7303 trials where enrollment was “actual” of which 9.5% had ≥500 participants enrolled and 4.3% had ≥1,000 participants enrolled (Table 3). The percentage of trials with ≥500 and ≥1,000 participants stayed relatively constant over time, ranging between 7.4 to 10.5% and 2.5 to 6.6%, respectively. The Eunice Kennedy Shriver National Institute of Child Health and Human Development had the largest percentage of trials with over 19% enrolling ≥500 participants and 10% enrolling ≥1,000. Among trials that are completed (N = 5,377), 10.5% and 4.5% enrolled ≥500 and ≥1,000 participants, respectively.
The proportion of total and completed trials with ≥500 and ≥1,000 participants enrolled a by year (Panel A) and NIH agency (Panel B).
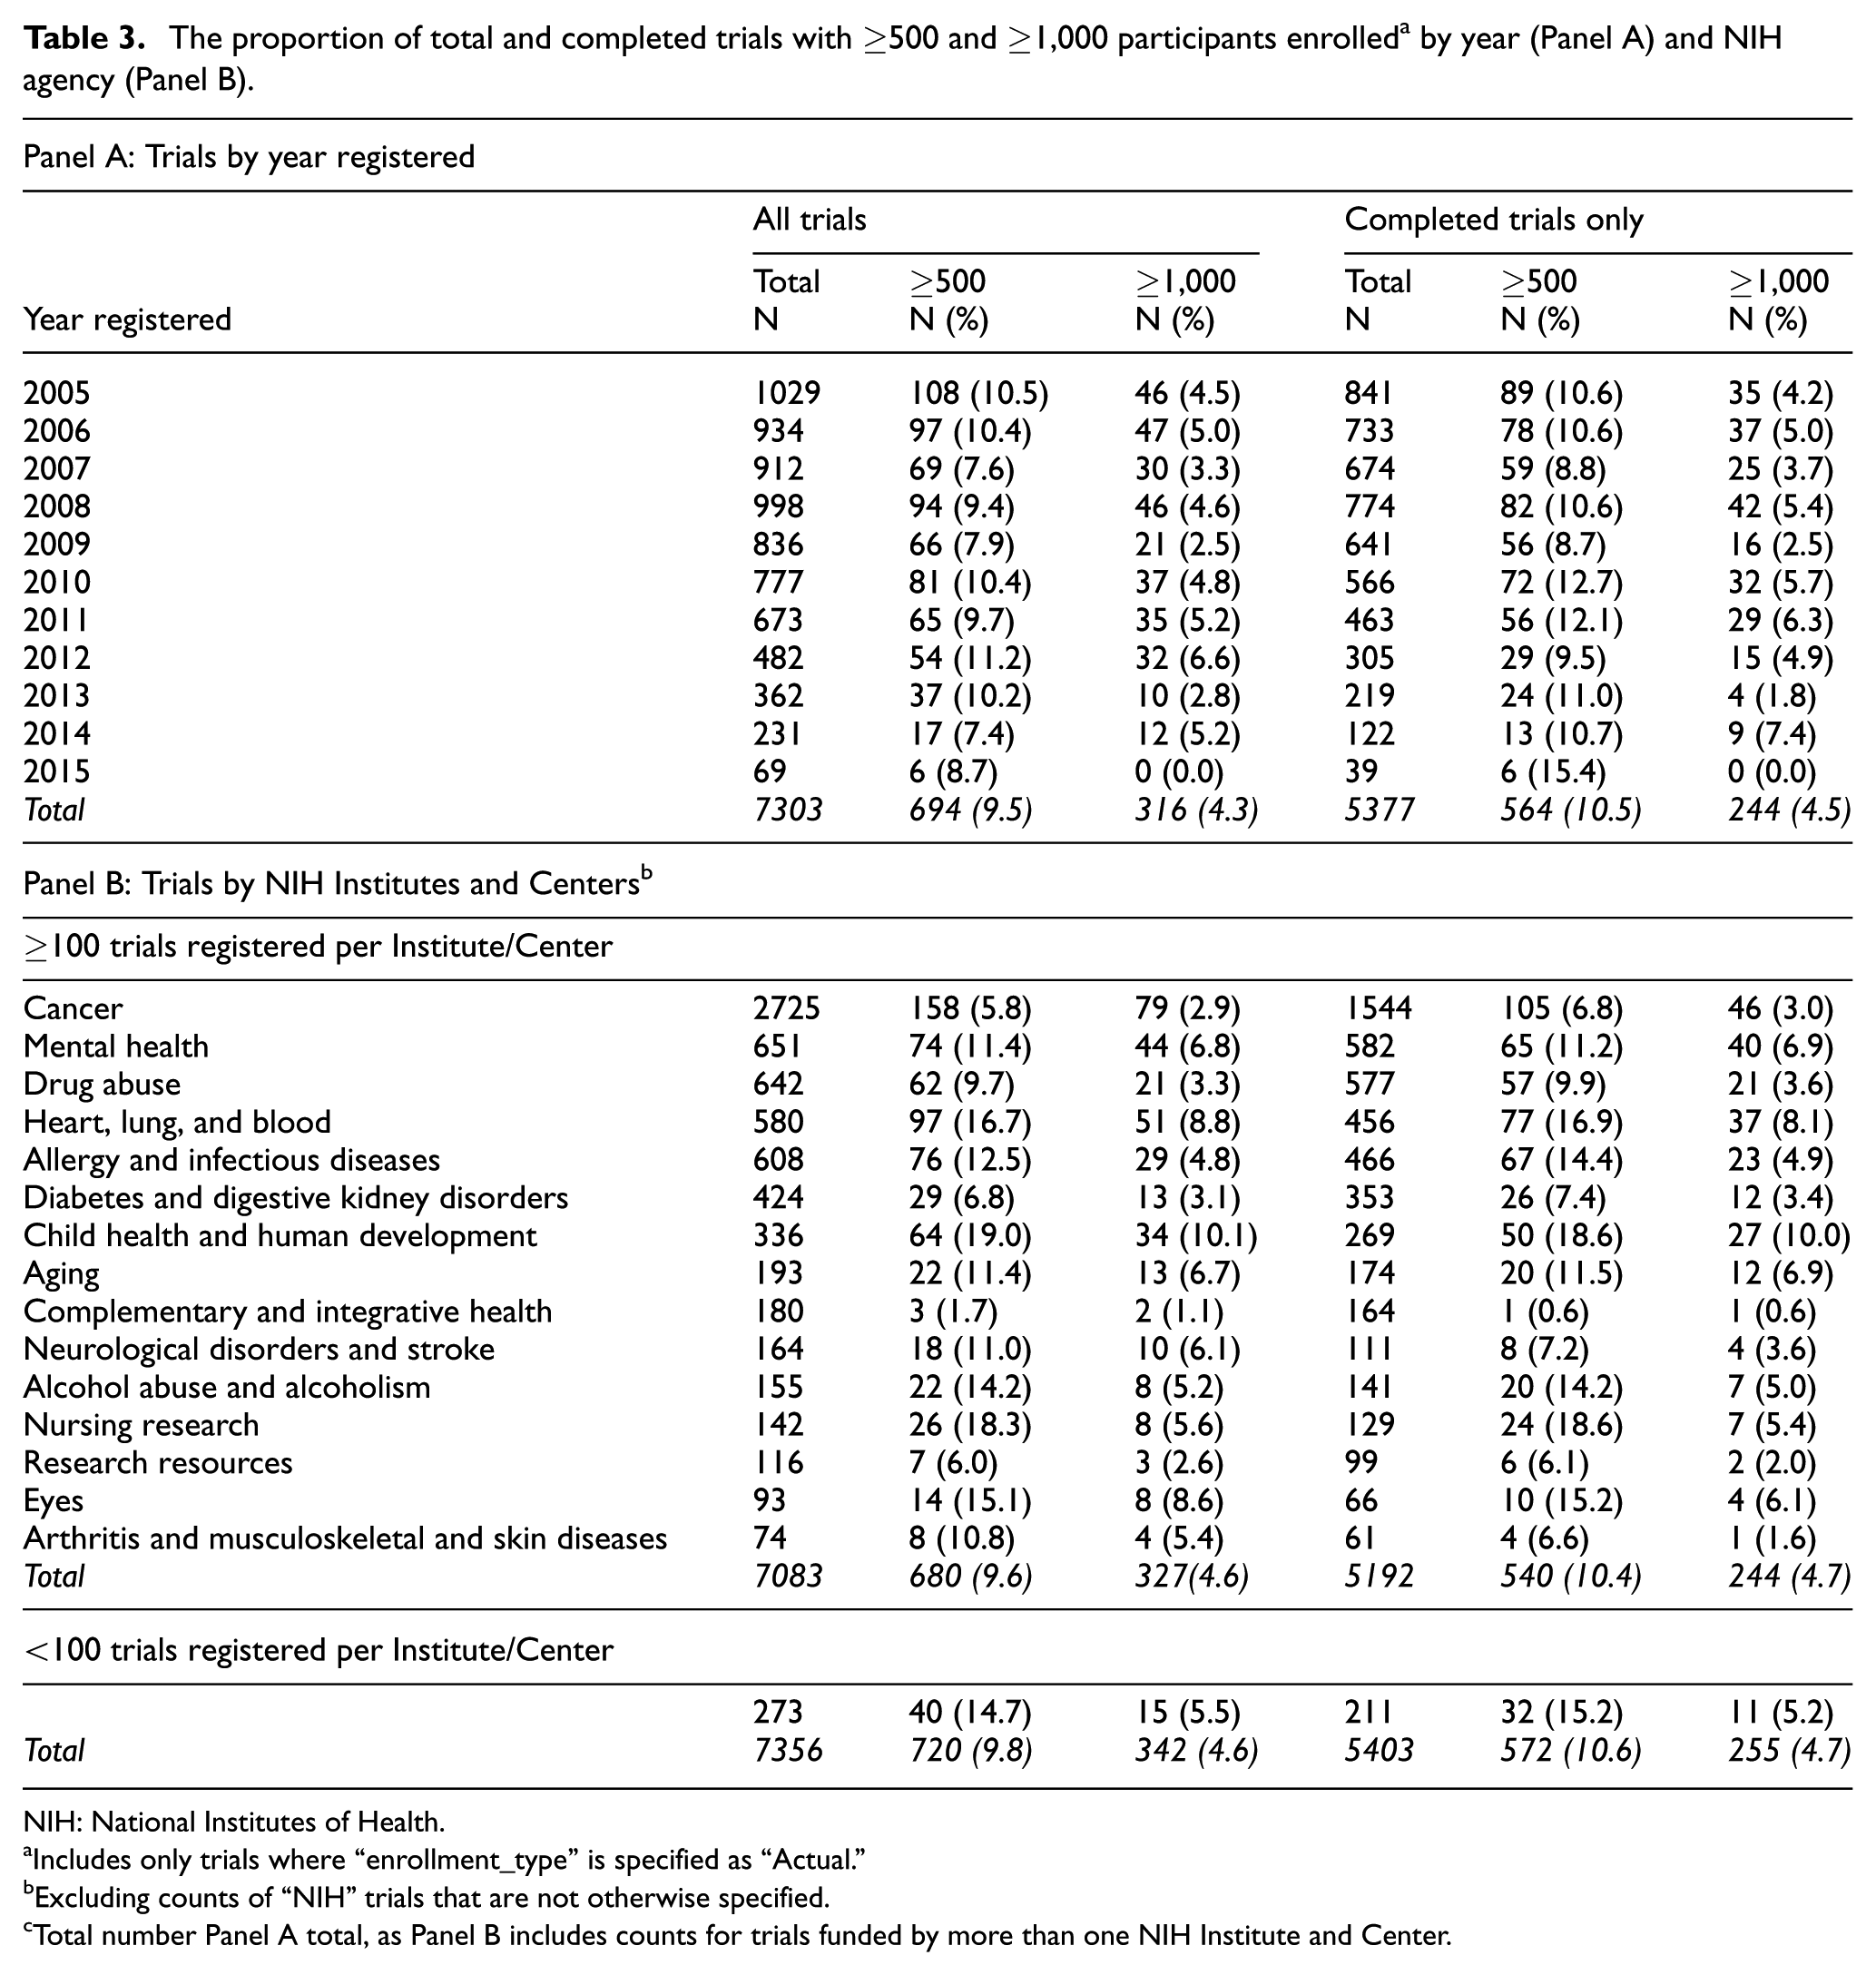
NIH: National Institutes of Health.
Includes only trials where “enrollment_type” is specified as “Actual.”
Excluding counts of “NIH” trials that are not otherwise specified.
Total number Panel A total, as Panel B includes counts for trials funded by more than one NIH Institute and Center.
The percentage of trials completed within 3, 4, and 5 years from enrollment start is provided in Table 4. Approximately 69% of trials are completed within 5 years, 51% within 4 years, and 34% within 3 years from start of enrollment. The percentage of trials completed within 3–5 years from start has increased from 2005 to 2009 (Table 4). Institutes and Centers with more than 100 trials registered and over 50% of trials completed within 3 years included the National Institute of Allergy and Infectious Diseases (60%), the National Eye Institute (55%), and the National Center for Research Resources (57%). The National Eye Institute completed the greatest percentage of trials within 5 years from start (90%; Table 4, Panel B). Institutes and Centers with <100 trials registered completed 40%, 64%, and 79% within 3, 4, and 5 years of enrollment start, respectively.
Times to completion a by year (Panel A) and NIH Institute and Center (Panel B).
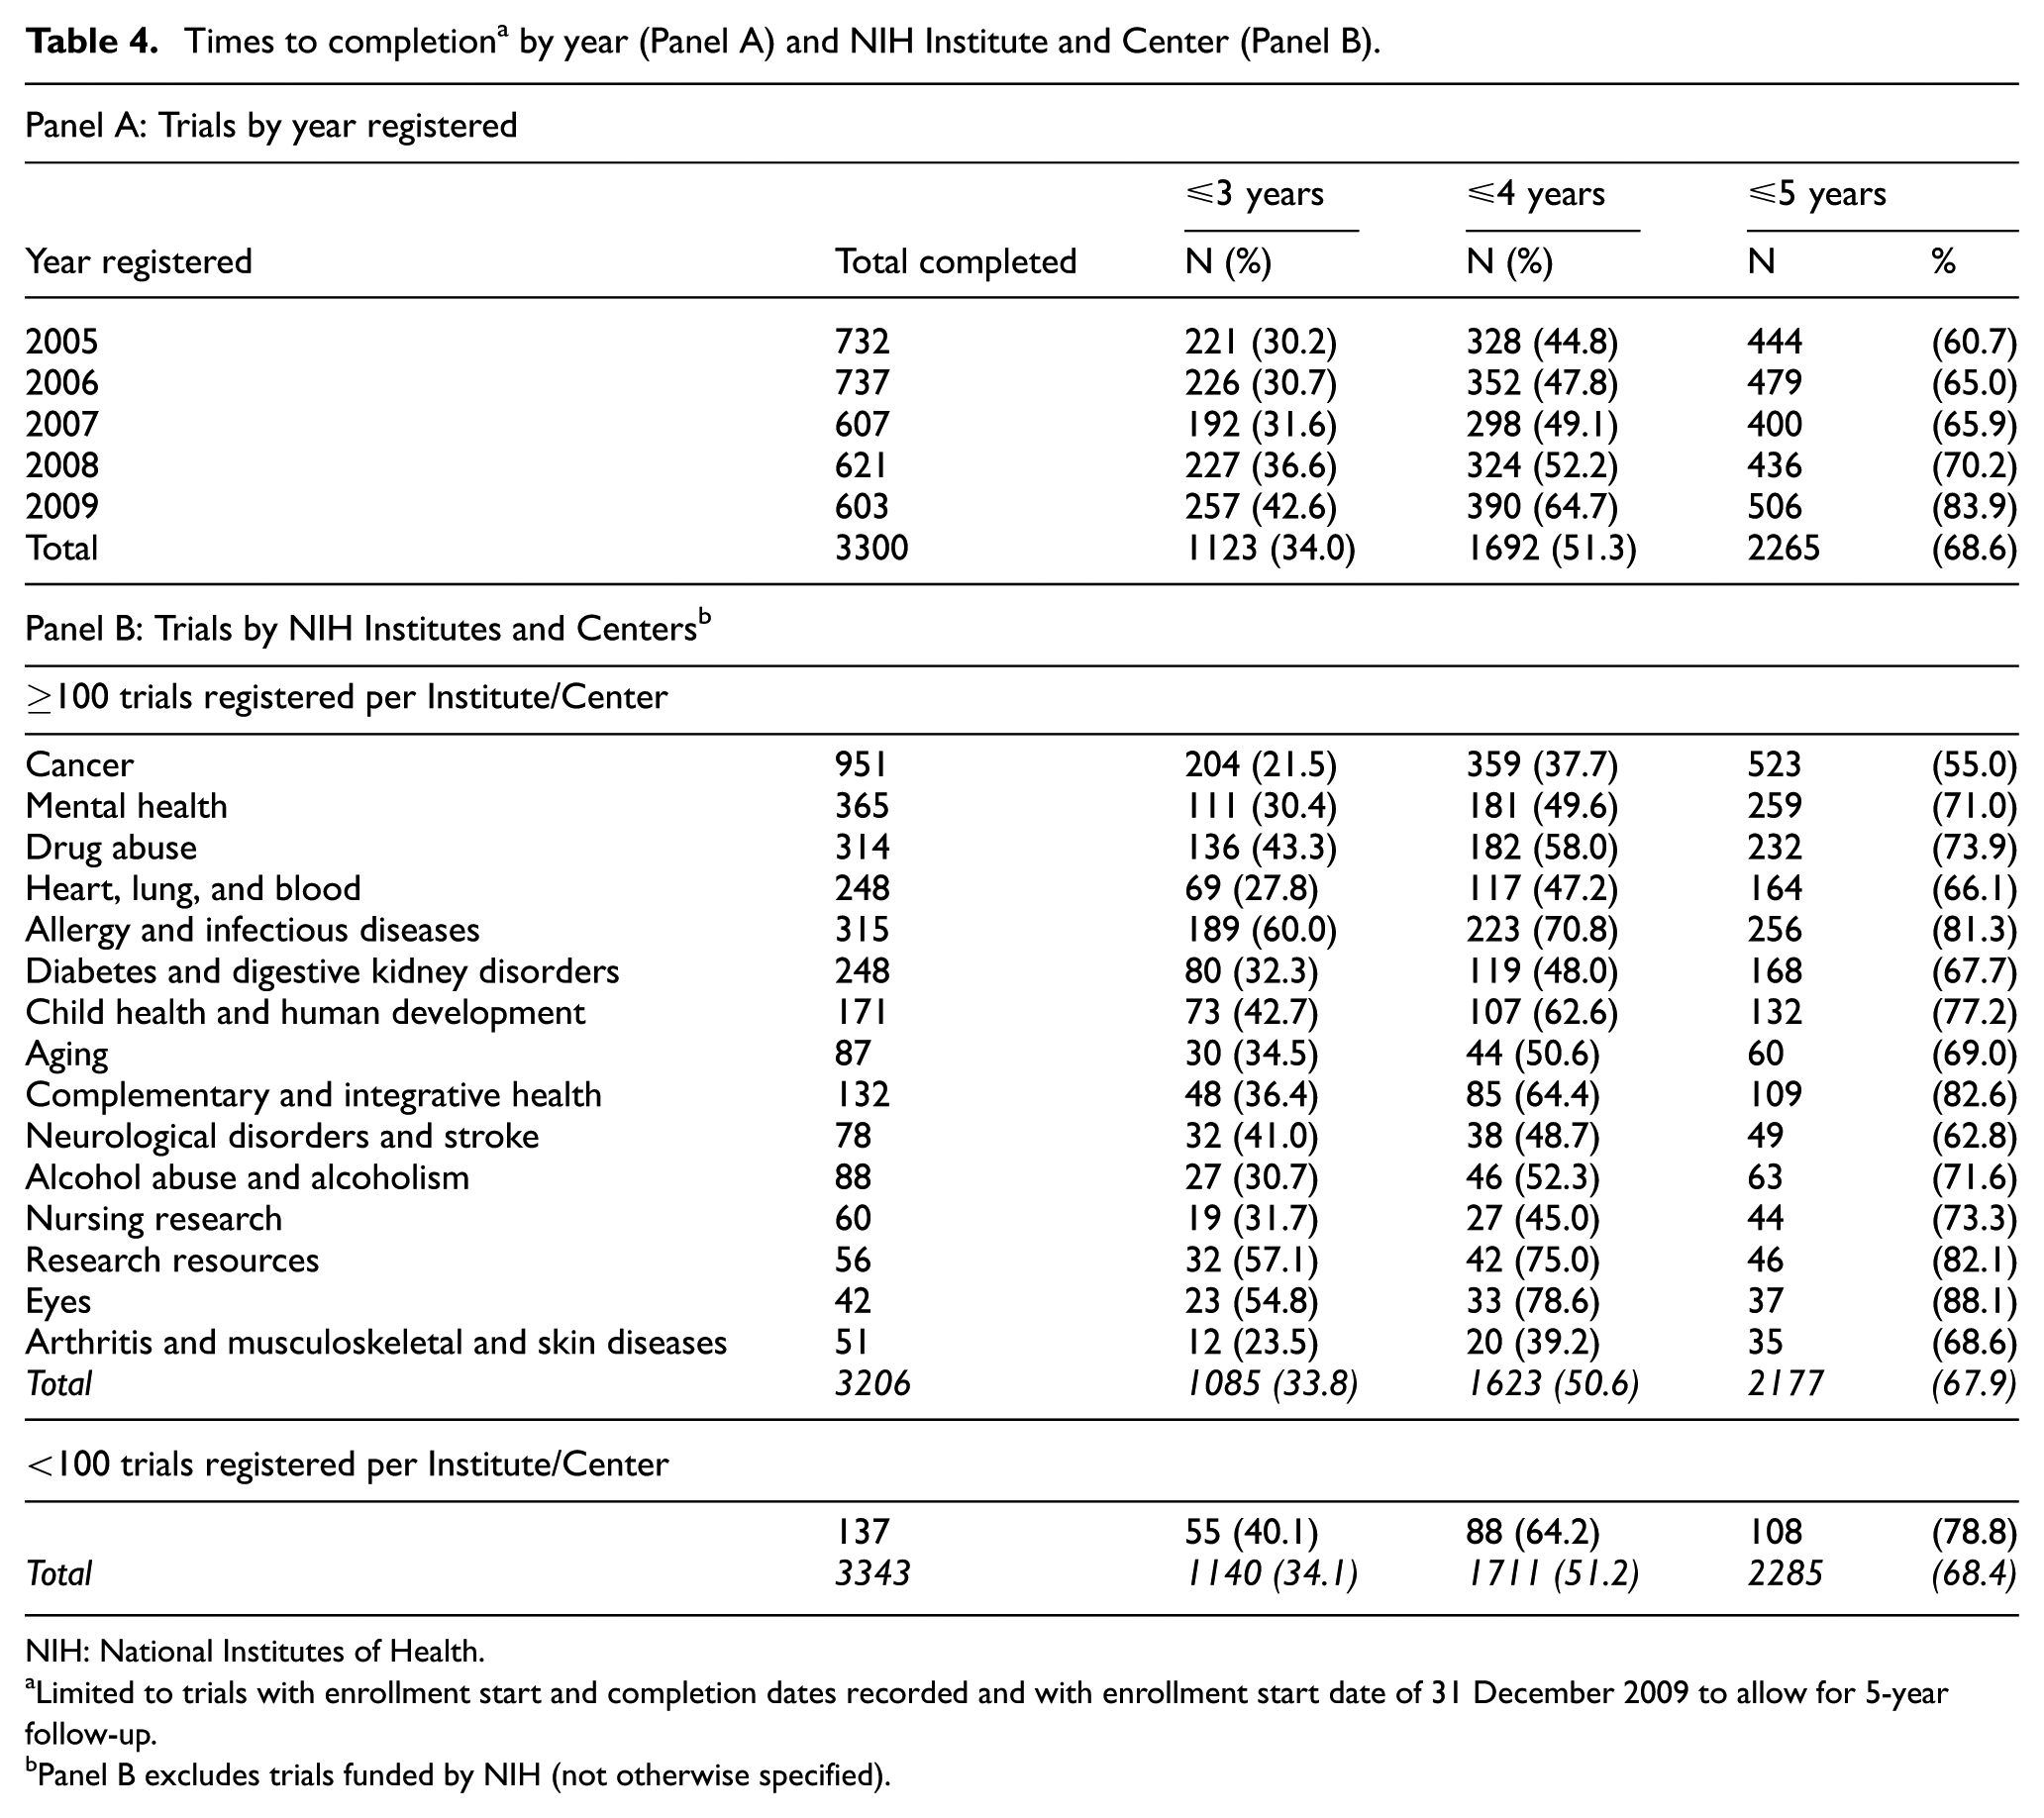
NIH: National Institutes of Health.
Limited to trials with enrollment start and completion dates recorded and with enrollment start date of 31 December 2009 to allow for 5-year follow-up.
Panel B excludes trials funded by NIH (not otherwise specified).
Discussion
Clinical trials are critical for generating high-quality evidence to guide clinical practice and improve public health. Over the last decade, the NIH has funded almost 13,000 clinical trials registered on ClinicalTrials.gov. Registration allowed us to identify and characterize these trials.
Findings from our analysis suggest that there has been a decline in NIH-funded trials since 2005, as registered in ClinicalTrials.gov. This finding is consistent with results from other studies.10–12 The decline could be explained by a flat NIH budget, remaining constant at US$3.2 billion a year over the last decade.13,14 When adjusted using the consumer price index, this is approximately 20% less in real dollars in 2015 than in 2005. 13 It could also be explained by increases in per-patient or per-trial costs, changes in trial registration behavior, or other factors that cannot be quantified. Increasing trial costs have been observed in industry-funded trials over time and have also been identified as barriers to government-funded trials. 15 In this report, the estimated average cost of a phase 1 trial has been reported to range from US$1.4 to US$6.6 million, a phase 2 study from US$7 to US$19.6 million, and a phase 3 study from US$11.1 to US$52.9 million dollars. 15 However, the authors point out that it is difficult to obtain accurate cost estimates, and the estimates they provided are not adjusted for inflation.
There is considerable variation in the number of trials funded by the different NIH Institutes and Centers. This may be explained in part by the different missions of each Institute or Center in addition to the duration of time since they were established. However, while some Institutes and Centers, for example, National Library of Medicine, are not necessarily expected to fund trials, others, for example, National Institute of Dental and Craniofacial Research, have a clinical content area and mission but fund few trials.
One might hope that the decline in NIH-funded trials would have been offset by trials with larger sample sizes, but there is no evidence this is so. The majority of NIH-funded clinical trials are small with median sample sizes ranging from 51 to 80 (21–213). A surprising finding was that the median sample sizes of phase 4 trials were smaller than those of phase 3 trials. These numbers did not change when including the sample sizes for only completed trials or evaluating them separately by year of registration. This might be due to the small number of phase 4 trials that are funded by the NIH. These are conducted after a drug has been approved by the FDA for marketing.
For randomized trials with two groups, those sample sizes correspond to 25–40 people per group. These numbers may be even smaller than shown, as we included “anticipated” enrollment in the calculations and “anticipated” often falls short of “actual.” The proportion of large trials (>500 participants) is small and has not changed over time. Approximately 10% (n = 694) of trials enrolled more than 500 participants, and 4% (n = 316), more than 1,000. Other reports describe similar findings.10–12,16 For instance, Califf et al. reported a median sample size of 58 (27–161) in all trials registered between 2007 and 2010, regardless of the source of funding. 11 Overall, these findings raise the question about whether NIH-funded trials are powered to produce meaningful differences, especially for trials with clinical outcomes.17–20
Our findings suggest that most trials funded by the NIH are early- and middle-stage trials. Only 16% of NIH-funded trials are phase 3–4 studies, and the numbers have decreased over time.
There is variation in the distribution of trials by phase across the different Institutes and Centers. For instance, the National Eye Institute funded the highest proportion of phase 3–4 studies, while the National Cancer Institute funded the lowest. Trials funded by the National Cancer Institute were mostly early-phase trials, of which only a third were randomized. The gender and age composition has remained stable. Our results suggest that female-only trials have consistently outnumbered male-only trials over time, possibly as a result of the 1993 NIH Revitalization act. 21
There has been a notable increase in the number of “other” trials being funded by the NIH, possibly explained by a shift in the clinical trial landscape and focus on a larger number of non-therapeutic trials. An expansion of the ClinicalTrials.gov registration fields for the “Other trials” would be a useful change in order to better capture and classify “other” trials. Currently, it is difficult to understand the types of trials classified as “other.”
The number of multicenter and randomized trials is small and has remained constant over time. The need for large clinical trials to answer important clinical and health policy questions has been previously noted, as has the lack of support and resources from major funders of clinical research. 22 The NIH mission is to “seek fundamental knowledge about the nature and behavior of living systems and the application of that knowledge to enhance health, lengthen life, and reduce illness and disability.” 23 While the majority of NIH-funded trials are early-development trials, as shown in our analysis, supporting the first part of the stated mission, there is a need for more large, randomized trials to support the latter part of this mission.
There are limitations associated with using and analyzing data from ClinicalTrials.gov. Tracking the state of NIH-funded trials via information contained in ClinicalTrials.gov is predicated on the assumption that trials are registered. 24 NIH project officers work to ensure registration and, increasingly, NIH Institutes and Centers do not release funds until trials are registered. Hence, it is reasonable to assume that the number of NIH-funded trials not registered is small. The release of the Final rule in September 2016 will likely improve the reporting of NIH-funded trials in ClinicalTrials.gov further.7,25
Another limitation is the potential for incomplete data or misclassification of funding source. Funding source is derived from how registrants complete the “sponsor” and “collaborator” fields when registering. If NIH is mentioned in either field, the trial is identified as NIH-funded. Otherwise, the trial is not identified as being NIH-funded, even if in fact it is. To remove confusion surrounding funding type in ClinicalTrials.gov, registrants should be explicitly asked to indicate funding source, independent of the collaborator, sponsor, or grant number.
It is difficult to estimate the extent of under reporting of NIH as a funding source. To explore this issue, two independent reviewers compared NIH-funded trials in ClinicalTrials.gov to trials listed in the NIH RePORTER. 14 There was a small proportion of trials (∼10%), which varied by NIH Institutes and Trials, that were listed in RePORTER and not indicated as NIH-funded in ClinicalTrials.gov. To investigate further, we used the secondary identifiers from ClinicalTrials.gov, added in 2009, to identify NIH-funded trials by grant numbers. Numbers from this search were slightly higher than those derived from the “funder_type” variable. However, cleaning and sorting grant numbers to correctly categorize them is a cumbersome task. Furthermore, it is not guaranteed that grant numbers are entered accurately or completely. While study counts varied slightly across the different sources, the reported trends and conclusions remained unchanged.
In conclusion, there has been a decline in the number of registered NIH-funded trials since 2005. Most NIH-funded trials are small and single-centered, with a large fraction that are non-randomized. Substantial differences exist in the number and types of trials done by Institutes and Centers within the NIH. Limitations associated with the accuracy and completeness of registration data among other registration variables were uncovered in this analysis, as these have to be inferred. However, while the registration system is imperfect, it is an important step forward toward accountability of funders, sponsors, and trialists.
Footnotes
Acknowledgements
The authors wish to acknowledge Arthur Gresham for his assistance working with the CTTI AACT database in Oracle.
Declaration of conflicting interests
The author(s) declared no potential conflicts of interest with respect to the research, authorship, and/or publication of this article.
Funding
Dr Appel received grants from the National Institutes of Health to conduct clinical trials. Dr Meinert received grants from the National Institutes of Health and industry funding to conduct clinical trials.
References
Supplementary Material
Please find the following supplemental material available below.
For Open Access articles published under a Creative Commons License, all supplemental material carries the same license as the article it is associated with.
For non-Open Access articles published, all supplemental material carries a non-exclusive license, and permission requests for re-use of supplemental material or any part of supplemental material shall be sent directly to the copyright owner as specified in the copyright notice associated with the article.