
Abstract
Background:
Clinical research and drug development in orphan diseases are challenging, since large-scale randomized studies are difficult to conduct. Formally synthesizing the evidence is therefore of great value, yet this is rarely done in the drug-approval process. Phase III designs that make better use of phase II data can facilitate drug development in orphan diseases.
Methods:
A Bayesian meta-analytic approach is used to inform the phase III study with phase II data. It is particularly attractive, since uncertainty of between-trial heterogeneity can be dealt with probabilistically, which is critical if the number of studies is small. Furthermore, it allows quantifying and discounting the phase II data through the predictive distribution relevant for phase III. A phase III design is proposed which uses the phase II data and considers approval based on a phase III interim analysis. The design is illustrated with a non-inferiority case study from a Food and Drug Administration approval in herpetic keratitis (an orphan disease). Design operating characteristics are compared to those of a traditional design, which ignores the phase II data.
Results:
An analysis of the phase II data reveals good but insufficient evidence for non-inferiority, highlighting the need for a phase III study. For the phase III study supported by phase II data, the interim analysis is based on half of the patients. For this design, the meta-analytic interim results are conclusive and would justify approval. In contrast, based on the phase III data only, interim results are inconclusive and require further evidence.
Conclusion:
To accelerate drug development for orphan diseases, innovative study designs and appropriate methodology are needed. Taking advantage of randomized phase II data when analyzing phase III studies looks promising because the evidence from phase II supports informed decision-making. The implementation of the Bayesian design is straightforward with public software such as R.
Introduction
Clinical research in orphan diseases is challenging. It is often impossible or unethical to conduct large-scale randomized controlled trials, which implies that only limited evidence is available for decision-making. Also, shortcomings in the methodological approaches to evaluate medical products in rare diseases have been identified. 1 While these problems have been recognized for some time, 2 only in the past few years strong efforts have been made to address them. Examples include the draft guidance by the Food and Drug Administration (FDA) for drug development in rare diseases 3 and the latest funding scheme for rare diseases by the European Union’s Horizon 2020 research program. 4 These activities have led to intensified rare diseases research and drug development by pharmaceutical companies. 5
With regard to the drug-approval process, some flexibility on study designs and endpoints has been observed for drugs with an orphan indication.6,7 Surprisingly, however, a formal combination of the evidence (e.g. a meta-analysis) is rarely presented in approval dossiers. Typically, efficacy is assessed based on confirmatory trials only, meaning that other evidence (such as phase II studies) is viewed as supportive only. This poses a problem to both, regulators in charge of approving drugs and companies developing them, since it limits the evidence base for a quantitative assessment of the treatment effect. Furthermore, the combination of data reveals its power particularly in rare diseases: on one hand, because data are limited, and on the other hand, because the non-confirmatory trials typically compose a large fraction of all patients in the development program. The latter may be different for non-rare diseases, where the majority of patients is usually enrolled in the large-scale phase III trials.
These challenges call for approaches to study design and analysis that allow a more efficient use of the available data, as stipulated, for example, in the 21st Century Cures Act. 8 The nature of the problem lends itself to the Bayesian approach. Its usefulness when meta-analyzing few (small) studies has been discussed elsewhere.9,10 Here, we extend the idea to incorporate existing evidence for the parameter of interest, the treatment effect corresponding to the phase III study, via a meta-analysis. This is based on concepts discussed by Spiegelhalter et al., 11 Neuenschwander et al,12,13 Schmidli et al., 14 and some ideas in Ger and Köpcke. 15
The article is organized as follows. We first describe the statistical methodology, then illustrate the design using data from an FDA approved drug, and conclude with a discussion.
Methods
Hierarchical models
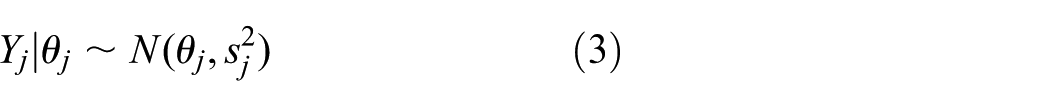
Hierarchical models (HM) are widely used when data are available from more than one trial. The models have two components: a data model and a parameter model. Data

and trial parameters

Inference for trial parameters can be done in a classical or Bayesian way. The simplest HM assumes (approximately) normal data. Often, the
and

For fixed standard errors
the posterior distribution of

The posterior distributions of the trial parameters

where
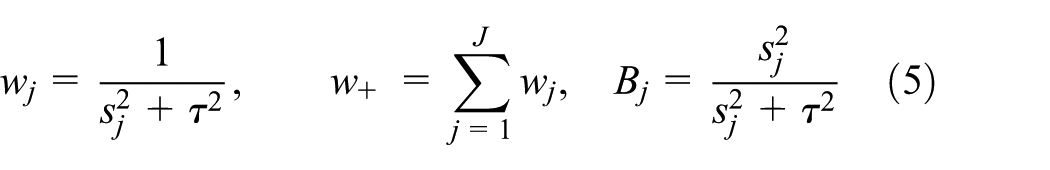
Intermediate values of
The HM shrinks the trial estimates toward the estimate of
The HM improves precision. Since

the variance in equation (7) is always smaller than the variance
Between-trial heterogeneity
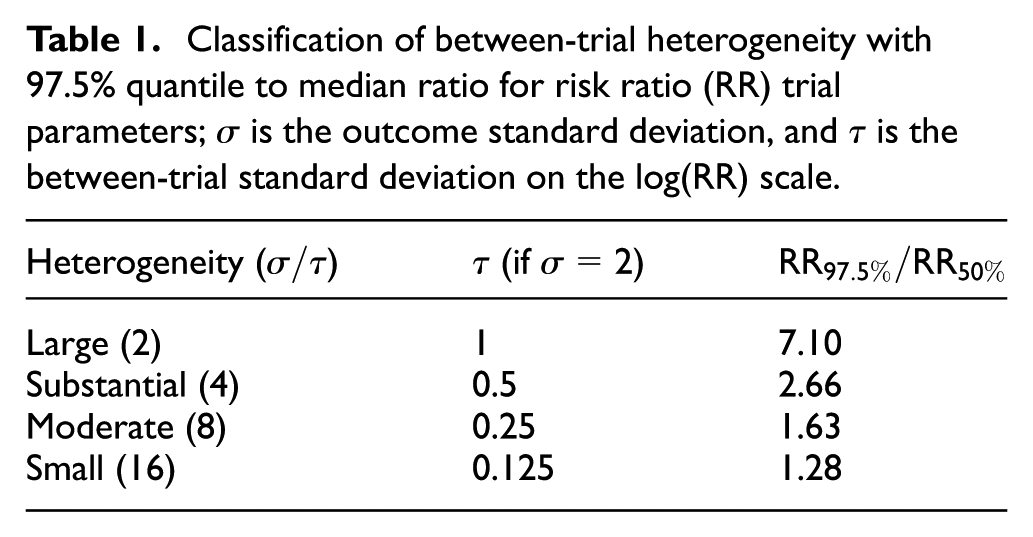
The degree of between-trial heterogeneity (standard deviation
Classification of between-trial heterogeneity with 97.5% quantile to median ratio for risk ratio (RR) trial parameters;
For the common case of few trials, the size of between-trial heterogeneity is usually highly uncertain because
Meta-analytic-predictive prior
When designing a new trial with parameter

For the NNHM with known

which follows from equation (7) by adding the new trial (with no data) to the model, that is,
Analysis for new trial
Eventually, after the new data
MAP The MAP approach formally combines the prior (equation (9)) with
MAC The meta-analytic-combined (MAC) approach does not require a prior distribution for

Importantly, MAP and MAC give identical results.
14
The MAP approach is technically more involved because MAP priors (equation (9)) do not follow standard distributions and are typically heavy-tailed. This complicates the Bayesian analysis with
Effective sample sizes
In many applications, the use of appropriately discounted prior information, which accounts for between-trial heterogeneity, will lead to smaller trials, unless heterogeneity is large. The prior information can be expressed as an equivalent approximate prior effective sample size (ESS). In our setting, we are interested in
Here, we will use an approximate two-variances approach which requires the following: the variance

In our case,
Case study
We now illustrate how to use phase II data for the design and analysis of a phase III study. The design relies on the methodology of the previous section and additional considerations such as practical feasibility and regulatory requirements. Data from three phase II and one phase III trial on Zirgan (0.15% gel) for the treatment of acute herpetic keratitis will be used in the case study. All analyses were conducted in R 22 with the package bayesmeta 23 (see Appendix 1 for code).
Background
Herpetic keratitis is an inflammatory condition of the eye caused by an outbreak of the herpes simplex virus (HSV).24,25 It can have serious consequences and remains the leading cause of corneal blindness in the industrialized world.26,27 With as few as 1.5 million people affected world wide, 28 it has been classified as an orphan indication by the FDA 29 and the European Medicines Agency. 30
In 2009, the FDA approved Zirgan for the treatment of herpetic keratitis (dendritic ulcers). 31 To discuss all details of the approval is beyond the scope of this application (see the publicly available documents 32 ). However, a few points are noteworthy. Most importantly, from the files,29,32 it appears that approval was based on a retrospective analysis of the four relevant studies, three phase II and one phase III study. Retrospective means that the sponsor submitted the results of the studies after they were conducted, rather than seeking the agency’s advice beforehand. Subsequently, this led to discrepancies between the sponsor’s and FDA’s primary analyses, including changes of the population, of the endpoint, and from superiority to non-inferiority.
The reasons behind this rather unusual approach to approval are not entirely clear. One explanation may be that the original manufacturer (Théa of France) did not intend to bring Zirgan to the US market on its own; rather, it sold the license for the US market to Sirion Therapeutics in 2007 which then initiated the submission. This and the fact that the clinical studies were already conducted in the 1990s may explain why no early discussions with the FDA took place.
Our goal here is not to reconstruct the approval history in detail. Rather, we will use the example to discuss an alternative, more efficient statistical approach toward approval, based on the following design specifications in the non-inferiority setting: cure rate at day 14 as endpoint, dendritic and geographic ulcers as population, and an absolute non-inferiority margin of 12% points. Furthermore, we will use the RR to quantify the treatment effect.
In the following, we present the evidence available at the hypothetical end-of-phase II meeting, a potential phase III trial and approval strategy, and the results of the actual phase III trial.
Hypothetical end-of-phase II meeting
Three randomized phase II studies 33 were conducted between April 1990 and October 1992 (Table 2). The studies were similar, with the only minor difference being the treatment regimen in study 6. For simplicity, we assume that this difference is not relevant for the clinical outcome.
Data of phase II and phase III studies.
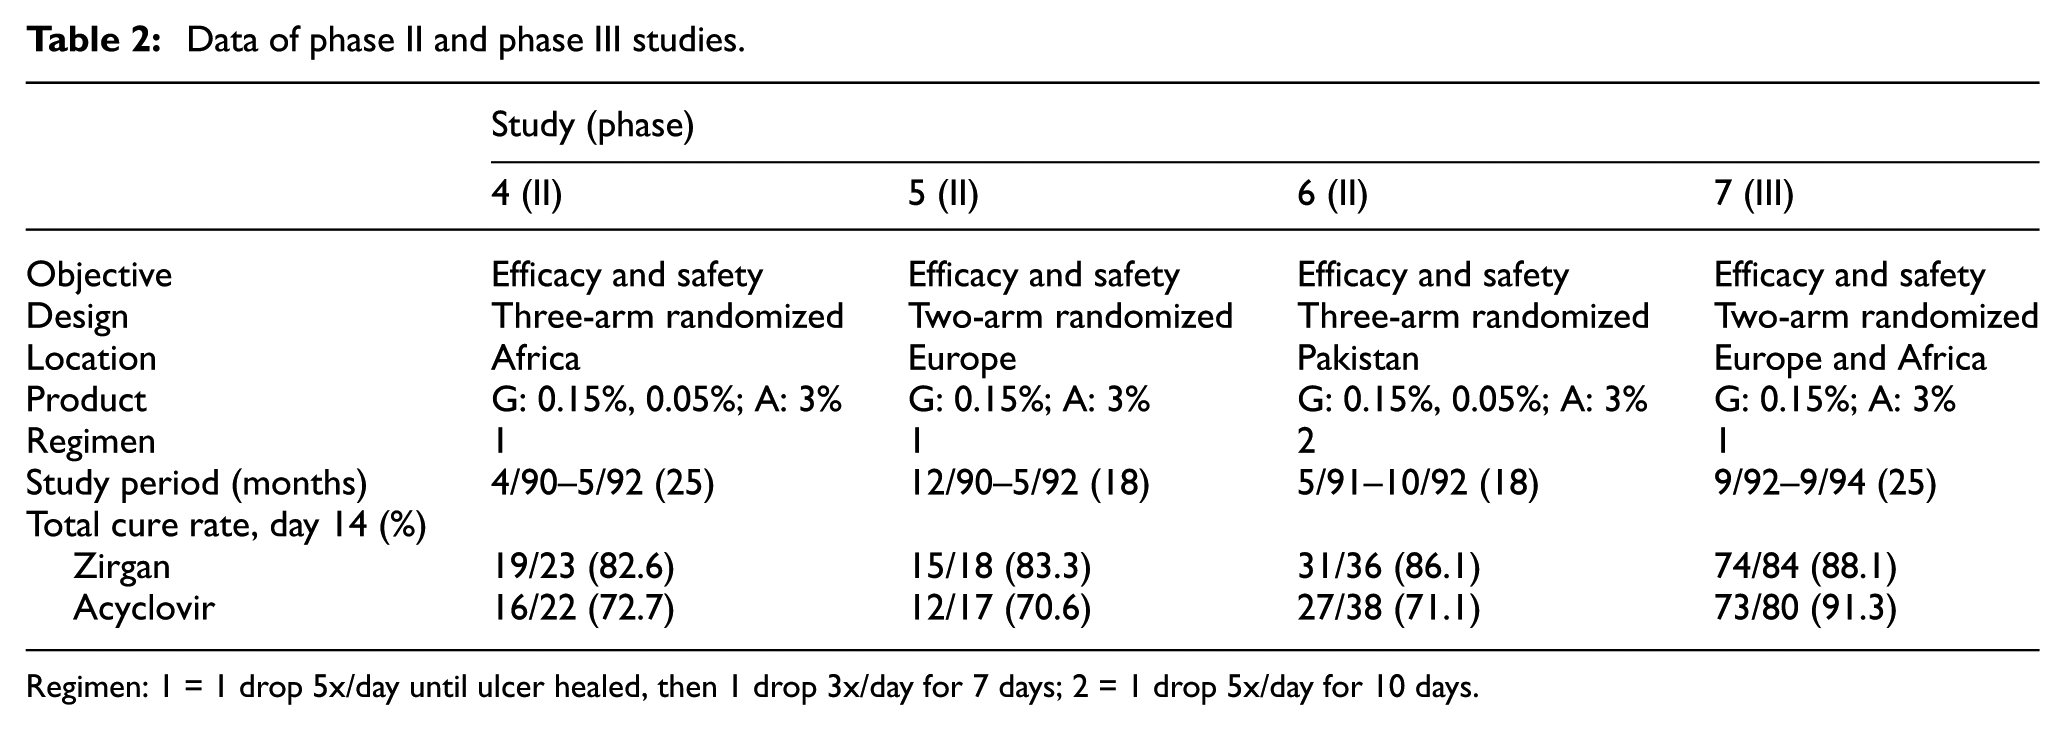
Regimen: 1 = 1 drop 5x/day until ulcer healed, then 1 drop 3x/day for 7 days; 2 = 1 drop 5x/day for 10 days.
We now turn the clock back and assume we are in the situation of an end-of-phase II meeting. We assume that the sponsor would agree to a non-inferiority analysis of Zirgan versus Acyclovir (the standard of care) with the primary endpoint being cure rate at day 14. Actually, setting the non-inferiority margin proved to be difficult. For cure rate at day 14, the FDA determined two effect sizes34,32 M1: 14% and 18%. The latter implies an absolute non-inferiority margin of 12% points when retaining one-third of the effect. We assume here that this margin had been agreed to.
At this stage, it is interesting to perform a non-inferiority analysis (Zirgan versus Acyclovir) of the phase II data. If the evidence were overwhelming, it would be fair to ask whether a phase III study were required, or if approval could be granted based on the phase II data only.
Our interest is the phase III treatment effect. However, since no phase III data are available yet, the phase III treatment effect corresponds to the predicted treatment effect

where
The first point is straightforward. For a response rate
For the
The meta-analysis of the phase II data is shown in Figure 1, where the data, study-specific (stratified)
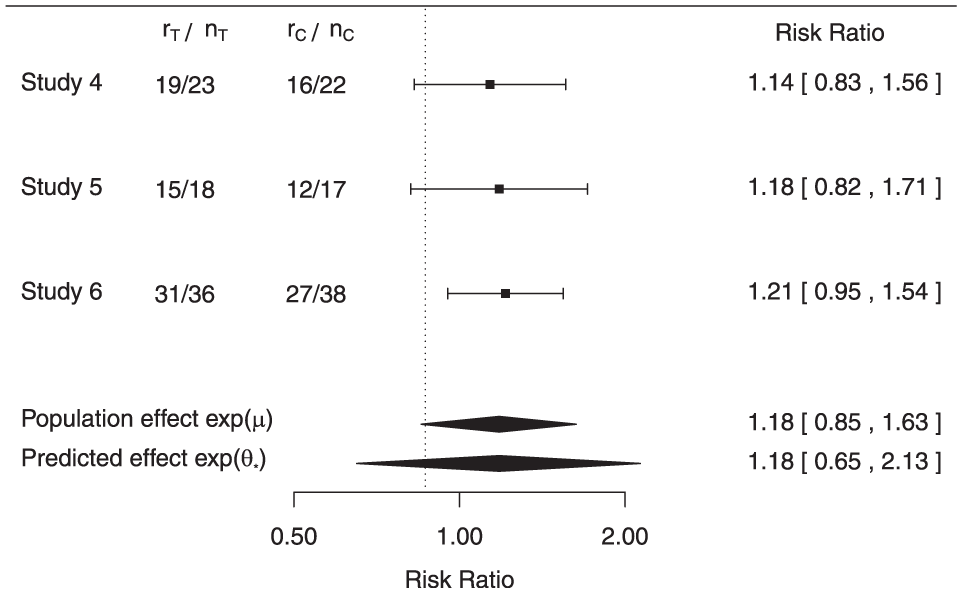
Data and results at end-of-phase II meeting.
The meta-analysis provides evidence for non-inferiority. If
Phase III study and proposed strategy for approval
Designing a phase III study that allows to assess non-inferiority in combination with the available evidence is desirable. This will not only allow to run a smaller study but also provide a treatment effect estimate based on all relevant evidence. However, regulators may have good reasons to argue that a smaller study may provide insufficient information for approval, especially to assess the safety and risk/benefit ratio.
We now discuss the design of a phase III study (study 7) which uses phase II data and allows for seeking approval based on an interim analysis. Depending on negotiations with regulators, a post-approval commitment to run the study to its end (even if approval is granted at interim) may be required. However, such negotiations will always be case-specific, highlighting the importance of early discussions with regulators. Nevertheless, the option to seek approval based on a positive interim analysis seems attractive for this case study. Since the endpoint is evaluated at day 14, there will be a small time window between the last patient enrolled for the interim analysis and the actual data read-out and analysis. With an anticipated recruitment period of 2 years, such a strategy could result in a markedly earlier approval.
When seeking approval based on interim results, the information fraction for the interim analysis becomes a key design aspect. We will assume that the interim analysis is conducted after 50% of the patients have been evaluated. For the sample size, in order to align with the actual study as originally conducted, we will assume
It is also important to understand how much phase II information is borrowed (which depends on the between-trial heterogeneity) when inferring the phase III effect. Using the variance ratio approach, the ESS is 14.
Operating characteristics
We evaluate the operating characteristics (type-I error rate and power) of the design and compare them to a phase III design ignoring the phase II data. For different fixed response rates
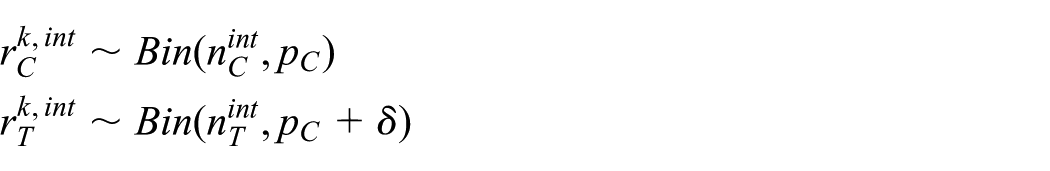
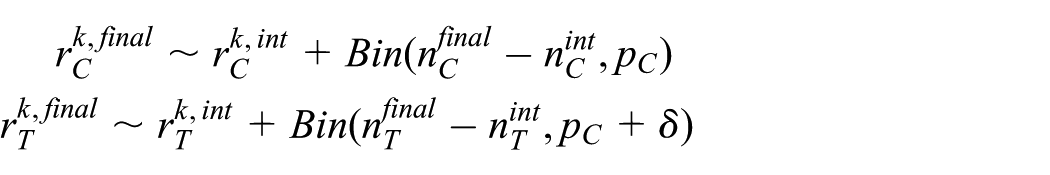
for
Operating characteristics for phase II/III (meta-analysis) and phase III alone.
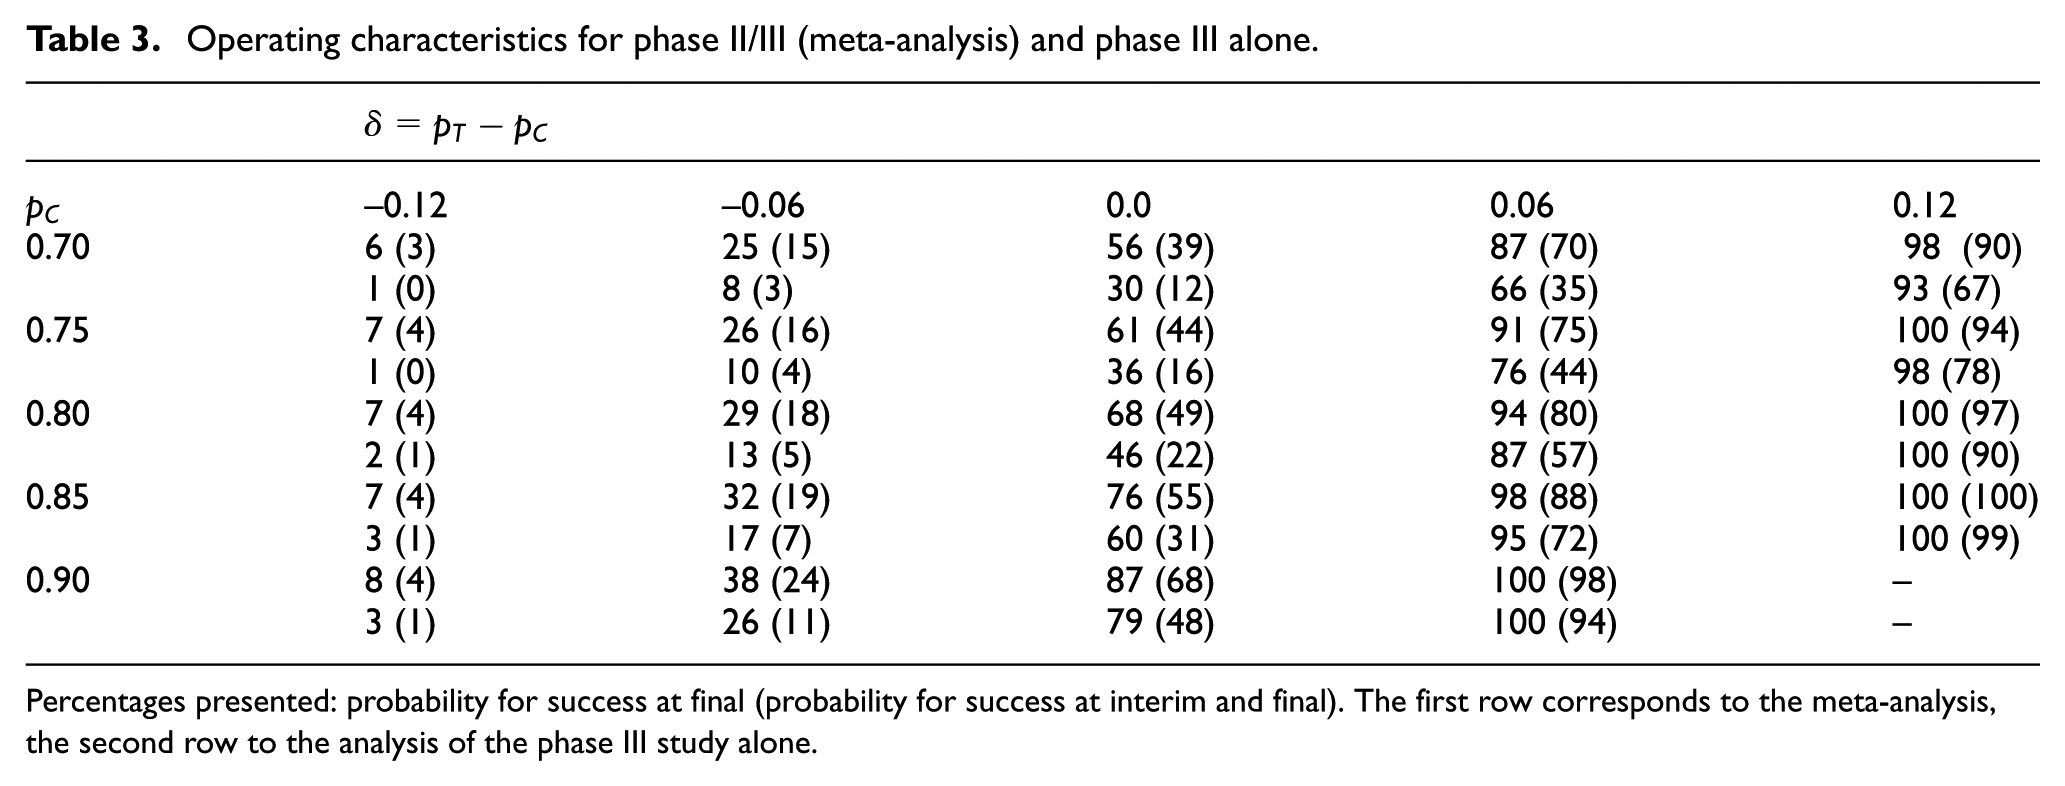
Percentages presented: probability for success at final (probability for success at interim and final). The first row corresponds to the meta-analysis, the second row to the analysis of the phase III study alone.
The gain in power for the proposed design can be substantial. For example, for
The gain in power, however, comes at the price of an increased type-I error rate. Strict type-I error rate control cannot be guaranteed.
36
For example, for
Actual phase III data and analysis
The actual data observed in the phase III study are only available for the final analysis. In order to reconstruct an interim analysis using half of the patients, we use an interim sample size of 40 per arm. Furthermore, we choose the number of responders such that observed response rate at interim is close to the observed response rate at the final analysis (see Figure 2).
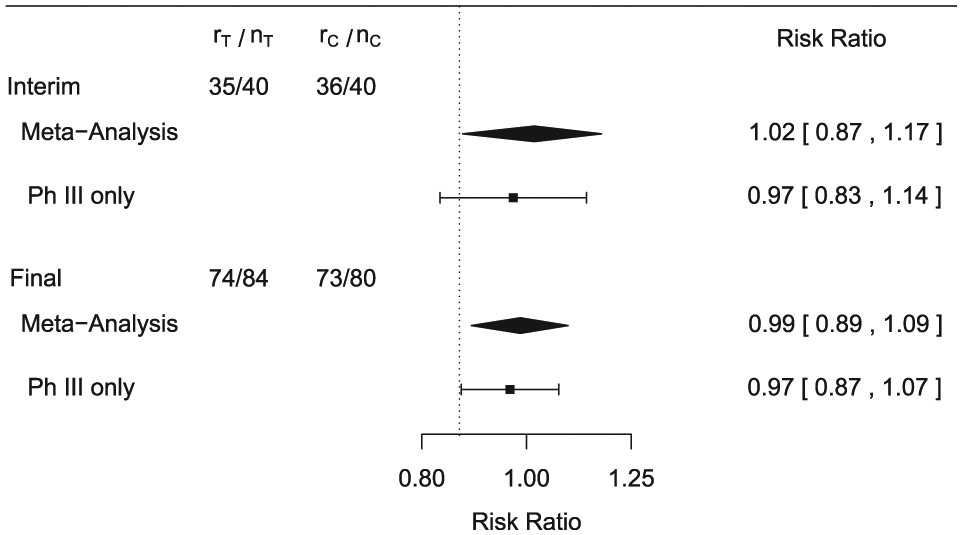
Data and results for interim and final analysis in Phase III.
The results are presented in Figure 2. The interim analysis based on all data (meta-analysis) allows to declare non-inferiority. Note that non-inferiority is claimed based on the parameter corresponding to study 7 (
As mentioned before, the idea would be to gain approval with the interim phase III data supported by phase II via the meta-analysis, assuming that other data (such as safety) are also favorable. Yet, depending on negotiations with regulators, the study may still run to its end, allowing a more robust evaluation of the effect at the final analysis. The results for the final analysis are also shown in Figure 2. For the meta-analysis, the interval for the RR becomes narrower and still excludes the non-inferiority margin, thus confirming the interim result. The analysis using the phase III study leads to a lower bound of the interval (0.870) which is just above the non-inferiority threshold 0.867, also allowing to conclude non-inferiority.
Finally, results for
Discussion
Here, we presented a simple, yet attractive design in rare diseases using phase II data in phase III studies. We illustrated it for binary endpoints using the normal approximation for the log-risk ratio. However, the extension to other models, for example, with binomial likelihoods for both groups, or to other endpoints is straightforward.
The proposed approach uses the phase II data prospectively, which has obvious advantages. First, fewer patients are required in the phase III study, and second, all available evidence is combined. And third, due to the nature of the approach, extreme results will be pulled toward the population mean. The Zirgan case study used to illustrate the design is built on real data as submitted to the FDA. However, the FDA approved Zirgan for a different indication (dendritic ulcers only) and endpoint (cure rate at day 7) than those used in our case study.
Of course, as with any design, all stakeholders need to be convinced. It may be argued that the case study is quite atypical since phase II studies are often not randomized in orphan diseases. This, however, becomes a self-fulfilling prophecy: if evidence from randomized phase II studies is only considered supportive, there is little motivation to perform them. However, if data from randomized phase II studies could be used, this would make them more attractive. It is therefore important that patient groups, regulators and sponsors consider such designs.
Other designs have been proposed before, and an excellent overview is given in Korn et al. 37 Some have been implemented in practice, for example, the historical control monotherapy design proposed by French et al. 38 This design was used successfully, resulting in the approval of Aptiom (eslicarbazepine acetate) for the treatment of partial-onset seizures.39,40 Other examples include N-of-1 trials, 41 global studies, 42 or basket trials, for example, the B2225 study for Imatinib. 43
Importantly, the approach that we presented is useful in situations where it is feasible to conduct randomized phase II and phase III studies of reasonable size. For many rare diseases, this may actually be possible. For example, in their review of rare disease terminology and definition, Richter et al. 44 found that the majority of the investigated countries define a rare disease starting at a prevalence of 50/100,000. Similarly, about half of the orphan indications for which drugs were authorized by the European Medicines Agency from 2000 to 2015 had a prevalence between 1/10,000 and 5/10,000. 45 However, for other situations, such as in ultra-rare diseases, alternative approaches may be more appropriate. These include prior elicitation from experts following the SHeffield ELicitation Framework (SHELF), 46 informative priors for the control group based on observational (e.g. registry) data, combining randomized and non-randomized evidence, 47 or N-of-1 trials. 41
It is also worth mentioning that recent initiatives to improve the drug development process send encouraging signals that a better use of the evidence is welcomed. Important directions are given in the 21st Century Cures Act, 8 which encourages the FDA to further evaluate the use of Bayesian methodology and non-randomized evidence. Furthermore, calls have been made to make the drug approval process more continuous and flexible to account for evidence as it accumulates. 48 The European Medicines Agency has also initiated various working groups.
It is clear that we only considered a small portion of the drug approval process. Efficacy plays a unique role when seeking approval, but other measures are also important. Safety is critical, and additional evidence may be required to assess long-term risks. However, this can often be achieved as a post-approval requirement in the form of non-randomized open-label studies. This approach has the advantage that patients have early access to the treatment while additional data are collected.
The proposed approach has limitations. The potential increase in type-I error needs to be considered and may require design modifications, including robust meta-analytic models. 14 Likewise, for a non-inferiority design, one may consider to directly model the risk difference and use a meta-analytic approach on this scale. 49 However, most applications will be superiority trials, for which relative measures such as RRs or odds ratios are common.
The motivation of this article was not to challenge FDA’s decision. On the contrary, only due to the many publicly available FDA documents, we were able to use this insightful example. We hope that it will facilitate the implementation of the proposed design in practice.
Footnotes
Declaration of conflicting interests
The author(s) declared the following potential conflicts of interest with respect to the research, authorship, and/or publication of this article: Dr Wandel and Dr Neuenschwander are employed by Novartis Pharma AG, Basel, Switzerland.
Funding
The author(s) disclosed receipt of the following financial support for the research, authorship, and/or publication of this article: This research has received funding from the EU’s 7th Framework Programme for research, technological development and demonstration under grant agreement number FP HEALTH 2013-602144 with project title (acronym) “Innovative Methodology for Small Populations Research” (InSPiRe).
References
Supplementary Material
Please find the following supplemental material available below.
For Open Access articles published under a Creative Commons License, all supplemental material carries the same license as the article it is associated with.
For non-Open Access articles published, all supplemental material carries a non-exclusive license, and permission requests for re-use of supplemental material or any part of supplemental material shall be sent directly to the copyright owner as specified in the copyright notice associated with the article.