
Abstract
This article presents a hybrid wavelet-based algorithm to suppress the ocular artifacts from electroencephalography (EEG) signals. The hybrid wavelet transform (HWT) method is designed by the combination of discrete wavelet decomposition and wavelet packet transform. The artifact suppression is performed by the selection of sub-bands obtained by HWT. Fractional Gaussian noise (fGn) is used as the reference signal to select the sub-bands containing the artifacts. The multichannel EEG signal is decomposed HWT into a finite set of sub-bands. The energies of the sub-bands are compared to that of the fGn to the desired sub-band signals. The EEG signal is reconstructed by the selected sub-bands consisting of EEG. The experiments are conducted for both simulated and real EEG signals to study the performance of the proposed algorithm. The results are compared with recently developed algorithms of artifact suppression. It is found that the proposed method performs better than the methods compared in terms of performance metrics and computational cost.
Keywords
Introduction
The electroencephalography (EEG) signals recorded from the scalp surface are usually contaminated by different physiological signals which are termed as artifacts. Among the artifacts, electrooculography (EOG) makes a serious obstacle to many neuroscience experiments including the application for brain–computer interfaces (BCIs). 1 It has noticeable higher energy at a lower frequency compared to target EEG signals.
The most popular blind source separation (BSS) technique of independent component analysis (ICA) is commonly employed to remove EOG artifacts. A number of research 2 –4 have turned to ICA aiming to project the recorded raw EEG data into statistically independent components. It is not always guaranteed that the extracted components will accurately correspond to the artifacts. 5 Another problem of using ICA is that the extracted components do not confirm to the original scale and sequences. Moreover, it contains background EEG data.
To address the limitations of ICA-based artifact reduction techniques, another effective BSS method is named stationary subspace analysis (SSA). 6,7 The EOG signals are considered as low frequency and high energy trends in the recorded EEG signals. The SSA performs better to suppress them from mixer. It partitions the multichannel raw EEG into stationary and nonstationary subspaces. 8 The nonstationary channels are suppressed as EOG and the stationary channels are considered as EEG. It is not effective to completely remove the artifact.
Recently, empirical mode decomposition (EMD) methods have been proposed as data-adaptive tools for artifact suppression from EEG signals. It has been reported that EMD-based approach can cope with the difficulty of EOG artifact removal from noisy EEG signals. 9 Although the methods are totally data-driven and perform well offline, it is difficult to implement them in real time due to higher computational cost.
To mitigate such limitations of EMD-based methods, a wavelet transform (WT) 9,10 based approach is introduced in this article to separate EOG artifacts from raw EEG using an adaptive threshold. The WT is one of the vigorous and reassuring ocular artifact (OA) removal techniques for single-channel EEG data. 11 Although discrete wavelet transform (DWT) leads to nonredundant signal decomposition, 12 the wavelet spectra give a smeared average frequency range over which the main signal energy resides. 13
With the improvement of wavelet theory, the concept of wavelet packets extended from orthonormal WT proposed by Coifman et al. 14 has attracted a significant amount of research attention in recent years and brought new developments for signal denoising. Wavelet packet transform (WPT) splits the signal not only in scale space but also in wavelet space, which may imply details of unwanted noise compared to classic wavelet technique. 15 Considering the above observations, WPT is taken as more advantageous than its predecessor, WT. Many efforts have been devoted to exploring the influences of transformation parameters to the denoising effect, such as the influence of mother wavelet, 16 wavelet packet, 17 decomposition level, 18 and threshold selection. 19 As a useful tool in signal analysis, WPT has recently appeared in applications of various fields.
The WPT is an extension of WT. The mentioned WPT is a kind of more detailed analysis and reconstruction method considered as promising OA removal techniques for single-channel EEG data. In this article, both DWT- and WPT-based approach termed as hybrid wavelet transform (HWT) are introduced to separate EOG artifact from raw EEG, using sub-band energy-based filtering. There are existing works 20,21 in which it is considered that EEG and EOG are linearly independent. In the previous paragraph, we have claimed that EEG and EOG are nonlinear and nonstationary signals 22 rather than linearly independent. The wavelet transformation-based decomposition by combining DWT and WPT is applied in this work to separate EOG artifacts from raw EEG. The decomposition techniques (DWT and WPT) are effective for analyzing brain signals considering their nonstationary and nonlinear characteristics. 23 Thus, the proposed method works effectively for EOG suppression. The results of the proposed method are also compared to other filtering approaches such as SSA, EMD, and DWT. The comparative study illustrates that the HWT approach is more effective to extract the EEG signals after suppressing the artifacts.
The use of EMD is not considered due to its higher computational complexity. Sometimes its computational cost is 10 times higher than that of DWT. 10 Hence, the combination of EMD and CWT would not be effective in this case. 21,24 Spectrogram is only suitable for the signal which is stationary within a small time span. It introduces some spectral distortion of the expected EEG signal of what is harmful for further applications. 9 Considering the signal characteristics and the computational complexity, the DWT and WPT are combined to adapt with the EEG signal to explore its underlying characteristics.
Generally speaking, artifacts have overlapping frequencies with respect to the neural activity of interest. So, it is essential that EEG data are cleaned before their use in BCI system. Using this result of the proposed HWT artifact removing method, it is possible to develop a link among neuroscience and robotics that helps us understand the brain along with the design of neurorobotic devices and algorithms for interfacing humans and robots. Actually, neurorobotics combines BCIs with robotics directing to develop simulated limbs, which act as actual parts of the human body, and the body is controlled by a brain–machine interface. 25 Disabled or paralyzed person cannot move from one place to another, but his brain is active to take any decision. So, if he wants to grasp any object, then he gets help from a robot by BCI/BMI. The robotics grasping system is discussed by Bezak et al. 26 Božek et al. 27 have set thresholds in their experiments so that all the wrong couples of body works can be revealed. For a rehabilitation robotics, identification of persons by their fingerprints is the most famous and one of the most commonly used biometrics to identify or verify a person’s identity. For this reason, modern biometric systems are used, where it is necessary to ensure high reliability, transparency, security, and also simplicity and comfort. 28
In the current era, the design and development of human assisting robots have taken the attention. The brain–machine interface is one of the popular applications of controlling robots. 29 There are a number of applications of robots for assisting paralyzed people. In such applications, the human intention represented by neural activities is used to produce commands to control the assisting robot. It can also be a robot arm instead of complete robot, which can be driven by neural activity/signal, especially for paralyzed people. To implement the robot-assisting system, it is required to recognize the brain activities effectively. It is a cost-effective and efficient method of recognizing human brain activities using EEG signals. 30 The EEG recorded from the scalp is commonly contaminated by different physiological signals like EOG, which is a potential obstacle to EEG classification. Hence, it is required to purify the recorded EEG by suppressing the artifacts like EOG. The effective suppression of EOG artifacts enhances the recognition accuracy of brain activities to generate correct commands for assisting the robot. Hence, the proposed method is able to implement a reliable robot-assisting system for paralyzed people through signal processing.
In the following sections, we have described different methods including the proposed one, the experimental results and discussion, and finally presented the concluding remarks of this work.
Methods
The recorded raw EEG is modeled as a linear combination of pure EEG and EOG artifacts defined as follows

where
Stationary subspace analysis
SSA is one of the blind source segregation techniques. It projects a multivariate signal into stationary and nonstationary subspaces. In EEG study, the electrodes on the scalp record the activity of different physiological sources. These sources can be stationary or nonstationary, but they are not apparent in the electrode signals, which are a superposition of these sources. SSA allows the separation of the stationary from the nonstationary sources in an observed time series. On the basis of the SSA model,
8
the measured multivariate time sequence

where M is unknown but time-constant mixing matrix;
Using the predictable mixing matrix,
Finally, this ocular activity is removed from the EEG recording to yield the clean EEG data

where

Example of the separation of clean EEG from the contaminated data using SSA: (a) The artificially generated EEG signal, (b) the segregated EOG signal, and (c) pure EEG signal. EEG: electroencephalography; EOG: electrooculography; SSA: stationary subspace analysis.
Empirical mode decomposition
Based on the principle of EMD technique,
1
the signal

where
The analyzing EEG signal

where D is the higher IMF index prior contamination by the trend. Each of the IMF
The energy of the IMFs with different local scales is distributed in different frequency bands. The fractional Gaussian noise (fGn) is used here as the reference signal. The energies of the IMFs of fGn are computed and then its upper and lower limits of 95% confidence interval (CI) are derived. The upper limit of CI of sub-band energy of fGn is considered as the threshold. The logarithmic energy (with base 2) of individual IMF of EEG is compared with the threshold level. The energy of the
It is observed in Figure 2 that the eighth IMF exceeds the upper limit of CI, and hence, the seventh one is selected as the threshold index of IMFs. The EOG is separated by summing the IMFs 8 to 10 as well as the residue. By subtracting EOG from raw EEG, we get the purified EEG that reflects the clean EEG in Figure 3.

Selection of IMF of the artificially contaminated EEG signal using EMD. The selection of starting IMF (lowest order) to extract the low-frequency component of the mixed signal. Here, the seventh IMF is selected. Its energy exceeds the upper limit of 95% confidence interval of the IMF energies of fGn. EEG: electroencephalography; EMD: empirical mode decomposition; IMF: intrinsic mode function; fGn: fractional Gaussian noise.

The empirical mode decomposition based data-adaptive filtering technique is used to separate EOG from the contaminated EEG. (a) The artificially contaminated EEG signal, (b) EOG, and (c) purified EEG signal are shown. EEG: electroencephalography; EOG: electrooculography.
Discrete wavelet transform
In DWT, only the lower frequency band is decomposed, giving a right recursive binary tree structure whose right lobe represents the lower frequency band and its left lobe represents the higher frequency band. The frequency band

where j and k are the scaling and shifting factors, respectively. The mother wavelet

The WT is the decomposition consisting of observing the signal at different resolution levels and different translations in time by bandpass filtering.
31
The strength of WT-based signal decomposition lies in using short high-frequency basis functions and long low-frequency ones to isolate different characteristics of the signal. In such decomposition, the signal is represented as finite-set band-passed signals of different frequency bands. Sub-band signals are reconstructed from the detail and approximate coefficients are denoted as
The analyzed signal of the channel is represented as 10
where qj
is the j’th sub-band corresponding to the detail coefficient Cj
at the j’th level and
A noise-assisted DWT-based approach is implemented here to suppress the low-frequency noise from single-channel EEG. At the end of the decomposition, the signal

where

where
The low-frequency noise suppression from EEG is achieved using sub-band energy-based data-adaptive thresholding. 10 The fGn is also used as the reference signal for adaptive threshold detection. The sub-band energy of fGn decreases with increasing its center frequency when the sub-band decomposition is performed with a dyadic filter bank. The WT is itself a dyadic decomposition, and hence, it produced a similar nature of sub-band energy distribution of fGn as obtained using EMD. The determination of threshold sub-band based on the sub-band energy is shown in Figure 4. The pure EEG results for a single channel of contaminated EEG are shown in Figure 5.

The selection of threshold from sub-band energy using DWT. The selection of threshold sub-band index of contaminated EEG channel based on the sub-band energy of fGn. The fifth sub-band exceeds the upper boundary of CI, and hence, the fifth one of EEG is selected as the highest order sub-band index to represent the pure EEG signal. EEG: electroencephalography; fGn: fractional Gaussian noise; CI: confidence interval; DWT: discrete wavelet transform.

The separation of clean EEG from the contaminated data using DWT. Separation of EOG artifact from real (recorded) EEG signal using wavelet denoising method. (a) The recorded (contaminated with EOG) EEG signal, (b) the separated EOG artifact, and (c) the pure EEG signal are shown. EEG: electroencephalography; EOG: electrooculography; DWT: discrete wavelet transform.
Wavelet packet transform
The WPT is a generalization of the wavelet decomposition process that offers a better performance compared to the ordinary wavelet methods. In the wavelet analysis, a signal is split into an approximation and a detail. The approximation is then itself split into a second-level approximation and detail, and the process is repeated. On the other hand, WPT is applied in both the detail and the approximation coefficients are divided to get all nodes for the decomposed levels and generate the full decomposition tree. A low (l) and high (h) pass filter is frequently applied to generate a complete sub-band tree to some desired depth. The low-pass and high-pass filters are generated using orthogonal basis functions.
32
The wavelet packet coefficients

where i is the modulation factor, j is the dilation factor, k is the translation factor,
The discrete filters

Implementing wavelet packet decomposition up to j’th level, the original signal can be characterized as a summation of all wavelet packet components at j’th level represented as

where
At the end of the WPT, the reconstructed sub-band is represented as

where
By applying WPT on each channel, it produces

where the frequency factor, b = 1, 2, 3, 4, 5,…
The WPT decomposition up to level 3 preserves the frequency granularity at the leaf nodes and also helps preserve most of the useful information of the EEG signal. The sub-bands are reconstructed from wavelet packet coefficients. Each sub-band with its spectrum is shown in Figure 6. From Figure 6, it is noticed that the sub-band spectra of EEG signal represent the dyadic nature. It is observed that the natural orders of wavelet packet tree node are with discrepancies with the frequency order. It is shown that any wavelet packet frequency sequences would produce dislocation, and the orders of frequency are different with the natural order. 34 In each layer of wavelet packet decomposition, the low-frequency decomposition parts are sorted in ascending order and high-frequency part in descending order according to the frequency. The reason for this phenomenon is due to the wavelet packet decomposition, and high-pass filter conducts a “flip” operation. 35 The wavelet packet decomposition produces the natural order and there is a discrepancy of frequency order. It is required to arrange the sub-bands in the increasing order of frequency to remove the artifact from the EEG signal.

Spectrum of sub-bands using WPT. The log spectrum illustrates that sub-bands are not in order of frequency. They are in the form of natural orders and there is a frequency disorder. WPT: wavelet packet transform.
Frequency sequences
Whenever high-pass filtered signals (in WPT) are downsampled, the origin of the frequency axis is translated. So, the frequency order is corrected in sequence using the following rule, and then, wrong frequency order difficulty is solved

where fb is the dominant frequency of b’th sub-bands, Nb is the maximum energy bin of b’th sub-bands, and nb is the length of b’th sub-bands.
Using equation (14), wavelet packet decomposition b’th sub-bands are arranged in the frequency order according to the magnitude of the frequency. The orderly sequenced sub-bands are shown in Figure 7. From Figure 7, it is clearly visualized that the sub-bands of WPT act as band-pass filter. It is spectacled that the eight spectra also showed how they complement each other to cover the signal bandwidth.

Fourier log spectrum of sequence sub-bands in WPT using equation (14). The log spectrum illustrates that sub-bands are in an increasing order of frequency. The sub-bands are represented in different six colors in solid lines and dashed lines. WPT: wavelet packet transform.
Hybrid wavelet transform
The HWT method is based on the combination of DWT and WPT. The DWT only decomposes the approximation part at each level. The target EOG artifact is contained in the lowest frequency (approximate) part of the raw EEG signal. It is not required to decompose the whole frequency band using WPT rather using the lower frequency coefficients. Hence, after third level decomposition of EEG signal using DWT, WPT is applied to the approximate coefficient signal to detect OA zone to decompose it up to three levels using db4 mother wavelet as a basis function. The WPT evenly divides a frequency band into
Proposed algorithm for artifact suppression
The block diagram of the proposed method is shown in Figure 8. Here, the energy-based sub-band thresholding with HWT decomposition technique is proposed. The original signal, reconstructed signal using the proposed HWT method, and the reconstruction error are shown in Figure 9. The reconstruction error of HWT is compared with DWT and EMD methods, as shown in Figure 9. It is noted that the signal reconstruction error of EMD is smaller than DWT and WPT. But EMD is not suitable for real-time implementation because of computational complexity and the proposed HWT is more suitable to clean EEG for implementation of online BCI. In this implementation, fGn is used to determine the threshold level derived from the analysis data. The reference signal (fGn) magnitude used here the following statistical threshold formula before hybrid wavelet decomposes

where

Block diagram of artifact removal method using HWT. It is a novel combination of discrete wavelet decomposition, wavelet packet tree, and thresholding for EOG separation. HWT: hybrid wavelet transform; EOG: electrooculography.

(a, b) The results of reconstructed contaminated EEG signal by simply adding sub-bands and (c) reconstruction error using HWT. (d) It also illustrates reconstruction error using EMD and (e) reconstruction error using DWT for comparison with the proposed method. HWT: hybrid wavelet transform; DWT: HWT: discrete wavelet transform; EMD: empirical mode decomposition; EEG: electroencephalography.
According to the proposed (HWT) method, the algorithm for separating EOG artifacts from EEG signal is given below: Performing DWT on the contaminated EEG signal together with the fGn up to three levels yielding a finite set of sub-bands. Decomposing the resultant approximate coefficient of DWT using WPT to up to L(=3) levels to select the artifactual coefficient. The corresponding sub-bands are reconstructed. The sub-bands of each channel are arranged using equation (14). Computing the Finding the lowest order sub-band with energy exceeding the energy of fGn. Thus, selected b’th (Figure 10, b = 2) sub-band is the starting index of constructing EOG signal. The rest of the sub-bands are used to reconstruct the pure EEG signals.

The selection of threshold from sub-band energy of contaminated EEG channels (by applying the proposed HWT) based on the sub-band energy of fGn. In this observation, selection of the index of sub-bands of EEG signal from which the low-frequency components can be extracted. The sub-band energy of fGn is considered as the threshold. The logarithmic energy (with base 2) of individual sub-band of EEG is compared with the threshold level. The energy of the second sub-band index of EEG signal exceeds the threshold, and hence, it is selected to remove the artifacts. HWT: hybrid wavelet transform; EEG: electroencephalography; fGn: fractional Gaussian noise.
The EOG suppression results for a single channel of recorded EEG are shown in Figure 11 in which the separated EOG and purified EEG signals are shown in the second and third rows, respectively.

Mixture of EOG like contaminated EEG signal and pure EEG. (a) Contaminated EEG signal, (b) EOG signal, and (c) the pure EEG signal using HWT. According to the experimental figure on the contaminated EEG, the proposed HWT has removed the most EOG artifacts from the mixed data and at the same time preserved the most EEG signal, as shown in the figure. As a result, the purified EEG signal is found as completely artifact free in HWT method. HWT: hybrid wavelet transform; EEG: electroencephalography; EOG: electrooculography.
After this phenomenon, the EEG signal artifact is removed according to the proposed method and is shown in Figure 8. In this figure, sub-band thresholding-based HWT decomposition technique is proposed. Besides this, artifact-free EEG sub-band and the detail coefficients of DWT are reconstructed by upsampling factor of 2 and convolution. The original signal, reconstructed signal using the proposed HWT method, and the reconstruction error are shown in Figure 9. It is noted that the signal reconstruction error of EMD is smaller than DWT and WPT. But EMD is not suitable for real-time implementation because of computational complexity and the proposed HWT is more suitable to clean EEG for implementation of online BCI.
Results and discussion
Data description
The real EEG data collected from well-known publicly available BCI competition IV-2b dataset are used to evaluate the proposed method. The data set consists of EEG data from nine subjects, where all subjects are right-handed, having normal or corrected-to-normal vision. Each subject consists of five sessions that are recorded on different days. Each session comprising 10 trials, two classes of the motor imagery of left-hand movement (class 1) and right-hand movement (class 2), six runs, 20 trials per run and 120 trials per session. The signal variable contains six channels (the first three are EEG and the last three are EOG signals). The sampling rate is 250 Hz and the subjects are recommended to imagine the corresponding hand movement over a period of 4 s resulting in 1000 samples per channel for every trial. The cue-based screening sessions consist of 20 trials per run and 120 trials per session for two classes of imagery. The trials containing artifacts as noted by authorities are marked with 0 corresponding to a clean trial and 1 corresponding to a trial holding an artifact. According to the instruction, 100 trials are obtained as clean trials and 20 trials are tenured as artifacts. Among the clean trials, 51 trials for left hand and 49 trials for right-hand movement MI. Along with contaminated 20 trials, the 9 trials are for left hand and 11 trials for right-hand movement.
Experimental results
In this research, BCI experiment is conducted to test the cleaning performance followed by the BMI classification with EEG signal. For the motor imagery EEG classification, linear discriminant analysis is used. The supervised learning method 36,37 is used in most classification systems for artifact removal. However, artifact suppression is essential for neurorobotics classification. As robotics deal with design, structure, operation, and use of robots, Shao et al. 36 introduced Fourier and Fourier–Mellin transformation as a tool for fingerprint image verification in their article. The method does not require broad preprocessing; it eliminates partly inaccurate finger place on a sensor (shift, rotation) for modern biometric system. On the other hand, the literature 27 described a correct classification of the car body using the Fourier transformation and phase correlation. In this article, the images were compared with other car bodies using preset threshold value. Based on max-pooling convolutional neural networks deep learning models, the literature 26 represented a multifingered robotic hand model for grasping tasks. In this article, the three-fingered hand is selected for investigating object grasping by robot hand. Visual object detection is the most important step in robotic grasping. For motor imagery EEG signal classification, artifact removal is essential for neurorobotics.
In this study, the performance of the proposed OA removing HWT-based method is first tested with simulated data, and then, the experiments are conducted with real EEG data. The amplitude of all the channels is normalized before processing. The scaling factors of normalization are stored to get back the original amplitude of EEG channel after separating artifact and EEG. If k is the scaling factor of normalization for any EEG channel, the separated EEG with original scale is obtained as

where
The experimental result for the first channel is shown in Figure 1. It is observed that the purified EEG signal holds some artifacts and the EOG is not separated properly but includes some signal components of EEG signal.
The EMD is a popular decomposition algorithm, which is used here to compare the result of HWT. The EMD method decomposes a signal based on its intrinsic time scales. The experimental result for artifact suppression is shown in Figures 2 and 3. In Figure 3, the method not only reduced EOG artifacts but also eliminated the original information. But it performs better than SSA and it can work in a single channel.
Another potential multiresolution decomposition approaches DWT, which analyzes a nonstationary signal like EEG. In this study, “db4” is used with seven level decomposition. It is another approach to EOG artifact reduction. The separation of clean EEG from the contaminated data using DWT is shown in Figures 4 and 5. The pure EEG does not show any large EOG artifacts but EOG signal contains some original signal information. But it is faster than EMD.
Finally, the HWT is applied to a contaminated EEG. In such hybrid wavelet decomposition, the signal is represented as finite set band-passed signals of different frequency bands. The log scale energy of the orderly sequence sub-band coefficients is computed. Using equation (15), the magnitude of reference signal (fGn) is calculated before decomposition. WPT technique is applied on statistically thresholded fGn for calculating its log2 energy. After calculating energy of every sub-band of measured EEG and fGn, the energy-based sub-band is selected as artifact exceeding the energy of fGn, as shown in Figure 10. The artifact-free EEG signals are reformed by summing up the reconstructed sub-bands. The separation results of purified EEG are shown in Figure 11 and the purified EEG signal is found as completely artifact free. Also, it is faster than EMD and DWT.
After analyzing the artificially contaminated EEG signal in different filtering approaches with fGn as the reference signal, now is the time to apply all methods to real EEG signals. The separation of EEG contaminated by a known EOG signal is already illustrated at the beginning of this section. All the implemented methods are repeated for the raw EEG data. The separation of EOG artifact using different existing method and proposed HWT methods is illustrated in the following.
Figure 12 shows the SSA method for EOG artifact reduction using raw EEG. The separated purified EEG and EOG signals are visually represented in time domain here. The first raw, second raw, and the third raw are represented as raw EEG, EOG, and clean EEG signal, respectively. The SSA has removed the few EOG artifacts from the raw data, and at the same time, most eye blink artifacts are retained in pure EEG signal.

The cleaning approach of EEG from the raw data using the SSA method. (a) The raw EEG signal, (b) the separated EOG signal, and (c) pure EEG signal. From the illustration, it is obvious that the extracted EOG carries the original information of EEG signal and pure EEG signal cut its valuable information. EEG: electroencephalography; EOG: electrooculography; SSA: stationary subspace analysis.
The EMD-based data-adaptive filtering approach with fGn as the reference signal is applied to separate the artifacts from real EEG signals presented in Figure 13. Here, the resulting separated EOG and EEG signals are visually represented in time domain.

The empirical mode decomposition based data-adaptive filtering technique is used to separate EOG from the raw EEG. (a) The real EEG signal, (b) EOG, and (c) purified EEG signal are shown. EEG: electroencephalography; EOG: electrooculogram.
The discrete wavelet decomposition is also a so-called data-adaptive technique. A thresholding-based denoising method using WT is implemented to separate the EOG signal from real EEG, as shown in Figure 14. In this figure, raw EEG, EOG, and purified EEG are illustrated in time domain. It is noted that the purified EEG signal is not well separated from EOG.

Separation of EOG artifact from real (recorded) EEG signal using wavelet denoising method. (a) The recorded (contaminated with EOG) EEG signal, (b) the separated EOG artifact, and (c) the pure EEG signal are shown. EEG: electroencephalography; EOG: electrooculogram.
Lastly, the proposed method is evaluated using EOG contaminated EEG signals (real EEG). The HWT is introduced to separate low-frequency artifacts from raw EEG using sub-band energy-based criterion. A data-adaptive sub-band filtering is employed here to separate the lower frequency noise. The threshold of filtering is determined by comparing the energy of individual sub-band of raw EEG with that of the reference signals fGn. According to the experimental results on the raw EEG, HWT removed the most EOG artifacts from the raw data, and at the same time, preserved the most EEG signal, as shown in Figure 15. As a result, the purified EEG signal is found as completely artifact free in this method.

Separation of EOG artifact using the proposed HWT method. (a) The normal recording of EEG contaminated by EOG which appears as higher energy and lower frequency trend (top panel); (b) the separation of EOG artifact is performed by the proposed HWT algorithm; and (c) purified EEG is extracted from the recorded raw EEG by subtracting the separated EOG (here, s: second). EEG: electroencephalography; EOG: electrooculogram; HWT: hybrid wavelet transform.
In Figure 16, the green, black, blue, cyan, magenta, and red solid line spectra represent EEG, contaminated EEG, clean EEG spectrum using HWT, EEG spectrum using DWT, EEG spectrum using EMD, and EEG spectrum using SSA, respectively. The artifact reduction EMD and DWT methods have omitted the δ (<4 Hz) band and part of θ (4–8 Hz) band but retained the other EEG frequency bands. The proposed HWT technique has well preserved the EEG frequency bands except part of the delta rhythm. Delta wave is found in deep sleep, so it may be avoided.

The graphical representation of the EEG spectra, which are contaminated by the EOG and compared it with other EEG separated by different four methods. EEG: electroencephalography; EOG: electrooculogram.
The spectrum of EEG signals separated using SSA, EMD, DWT, and proposed HWT approach is shown in Figures 16 and 20 for measured EEG and raw EEG, respectively. Besides the visual results, the spectrum of the separated EOG signals is also used as the factor of performance measurement of the separation algorithms. It is well known that the low-frequency EOG signal is mixed up with the pure EEG during recording. The frequency range of EOG is usually from 0 Hz to 2.8 Hz and the high-frequency part in the spectra comes from the EEG signal. The spectrum of the measured EOG is also included along with the spectrum of extracted EOG for better comparison in Figure 17. The spectrum of EOG signals separated using SSA, EMD, DWT, and HWT-based filtering approach is shown in Figure 17 for contaminated EEG and Figure 21 for real EEG reveals that most of the noise energy is concentrated in the lower-frequency part of the spectra. The main strength of the EOG from 0 Hz to 2.8 Hz range is understandable; overlapping of all spectra is very common for four methods and after that range in HWT approach, no neural activities in the brain are correlated with EOG artifacts. However, it must be noted that the relatively lower-energy high-frequency part of the signals plays an important part in conveying information; existing three methods—SSA, 8 EMD, 1 DWT 10 —are spread beyond the frequency range of actual EOG signals. Also, the high-frequency components are also with reasonable energies. It illustrates that the spectrum of wavelet approach (DWT) and other methods (EMD and SSA) captures some energies coming from the high-frequency EEG signal, that is, the target EOG is not separated properly but includes some signal components of EEG signals. It is noticed from the spectrum of the EOG that the measured EOG signal includes much amount of EEG signals.
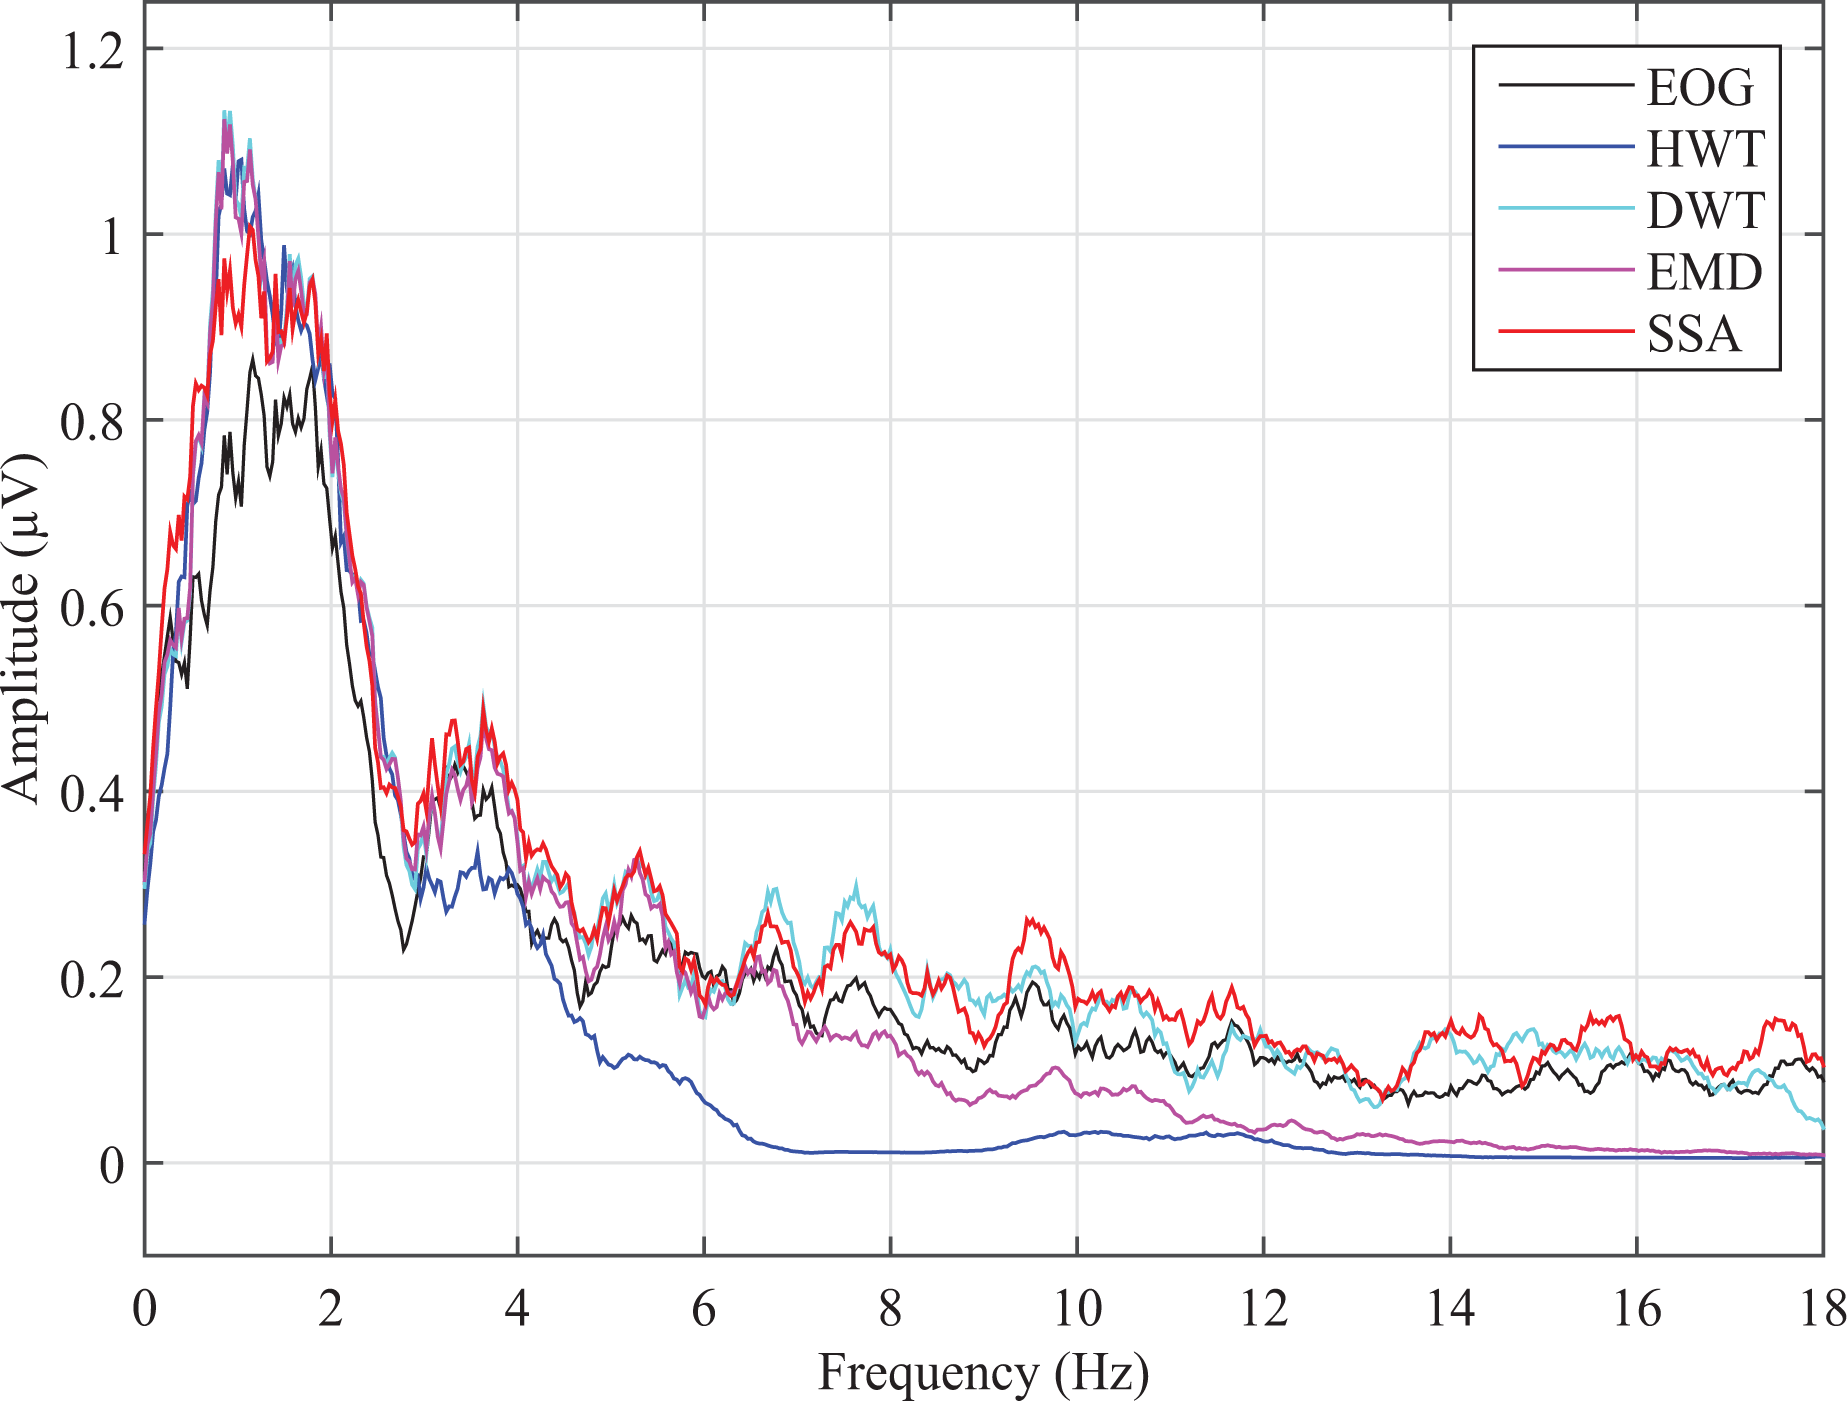
Illustration of the original EOG spectra which contaminated the EEG and compared it with other EOG separated by existing three artifact suppression methods and proposed hybrid method. EEG: electroencephalography; EOG: electrooculogram.

Illustration of EOG, which contaminated EEG and compared it with other EOG separated by different three methods and proposed method in time domain. EEG: electroencephalography; EOG: electrooculogram.
Visual comparison of the simulation results corresponding to the contaminated EEG signals (i.e. mixed-up of EEG and EOG signal), the EEG source signal, and the corrected EEG signals after applying proposed HWT and different ocular artifact removal methods. EEG: electroencephalography; EOG: electrooculogram; HWT: hybrid wavelet transform.

The graphical representation of raw EEG and separated EEG spectra of raw EEG contained different four methods. EEG: electroencephalography; EOG: electrooculogram.

Comparison of separated EOG spectra of raw EEG for the proposed HWT and other three existing methods. EEG: electroencephalography; EOG: electrooculogram; HWT: hybrid wavelet transform.
The time-domain representation of the EOG signal of all methods is shown in Figures 18 and 22 for contaminated EEG and raw EEG, respectively. In Figure 18, the top panel is indicated for EOG signal and the remaining panels are extracted EOG from SSA, EMD, and DWT methods, respectively. The bottom panel shows the extracted EOG by the proposed HWT technique. All the three methods extracted EOG accurately except SSA method. Besides, the time-domain representation of the EEG signal of all methods is shown in Figures 19 and 23 for contaminated EEG and raw EEG, respectively.

Time-domain representation of EOG separated by three different methods like SSA, EMD, DWT, and the proposed HWT technique. EOG: electrooculogram; HWT: hybrid wavelet transform; DWT: discrete wavelet transform; SSA: stationary subspace analysis; EMD: empirical mode decomposition.

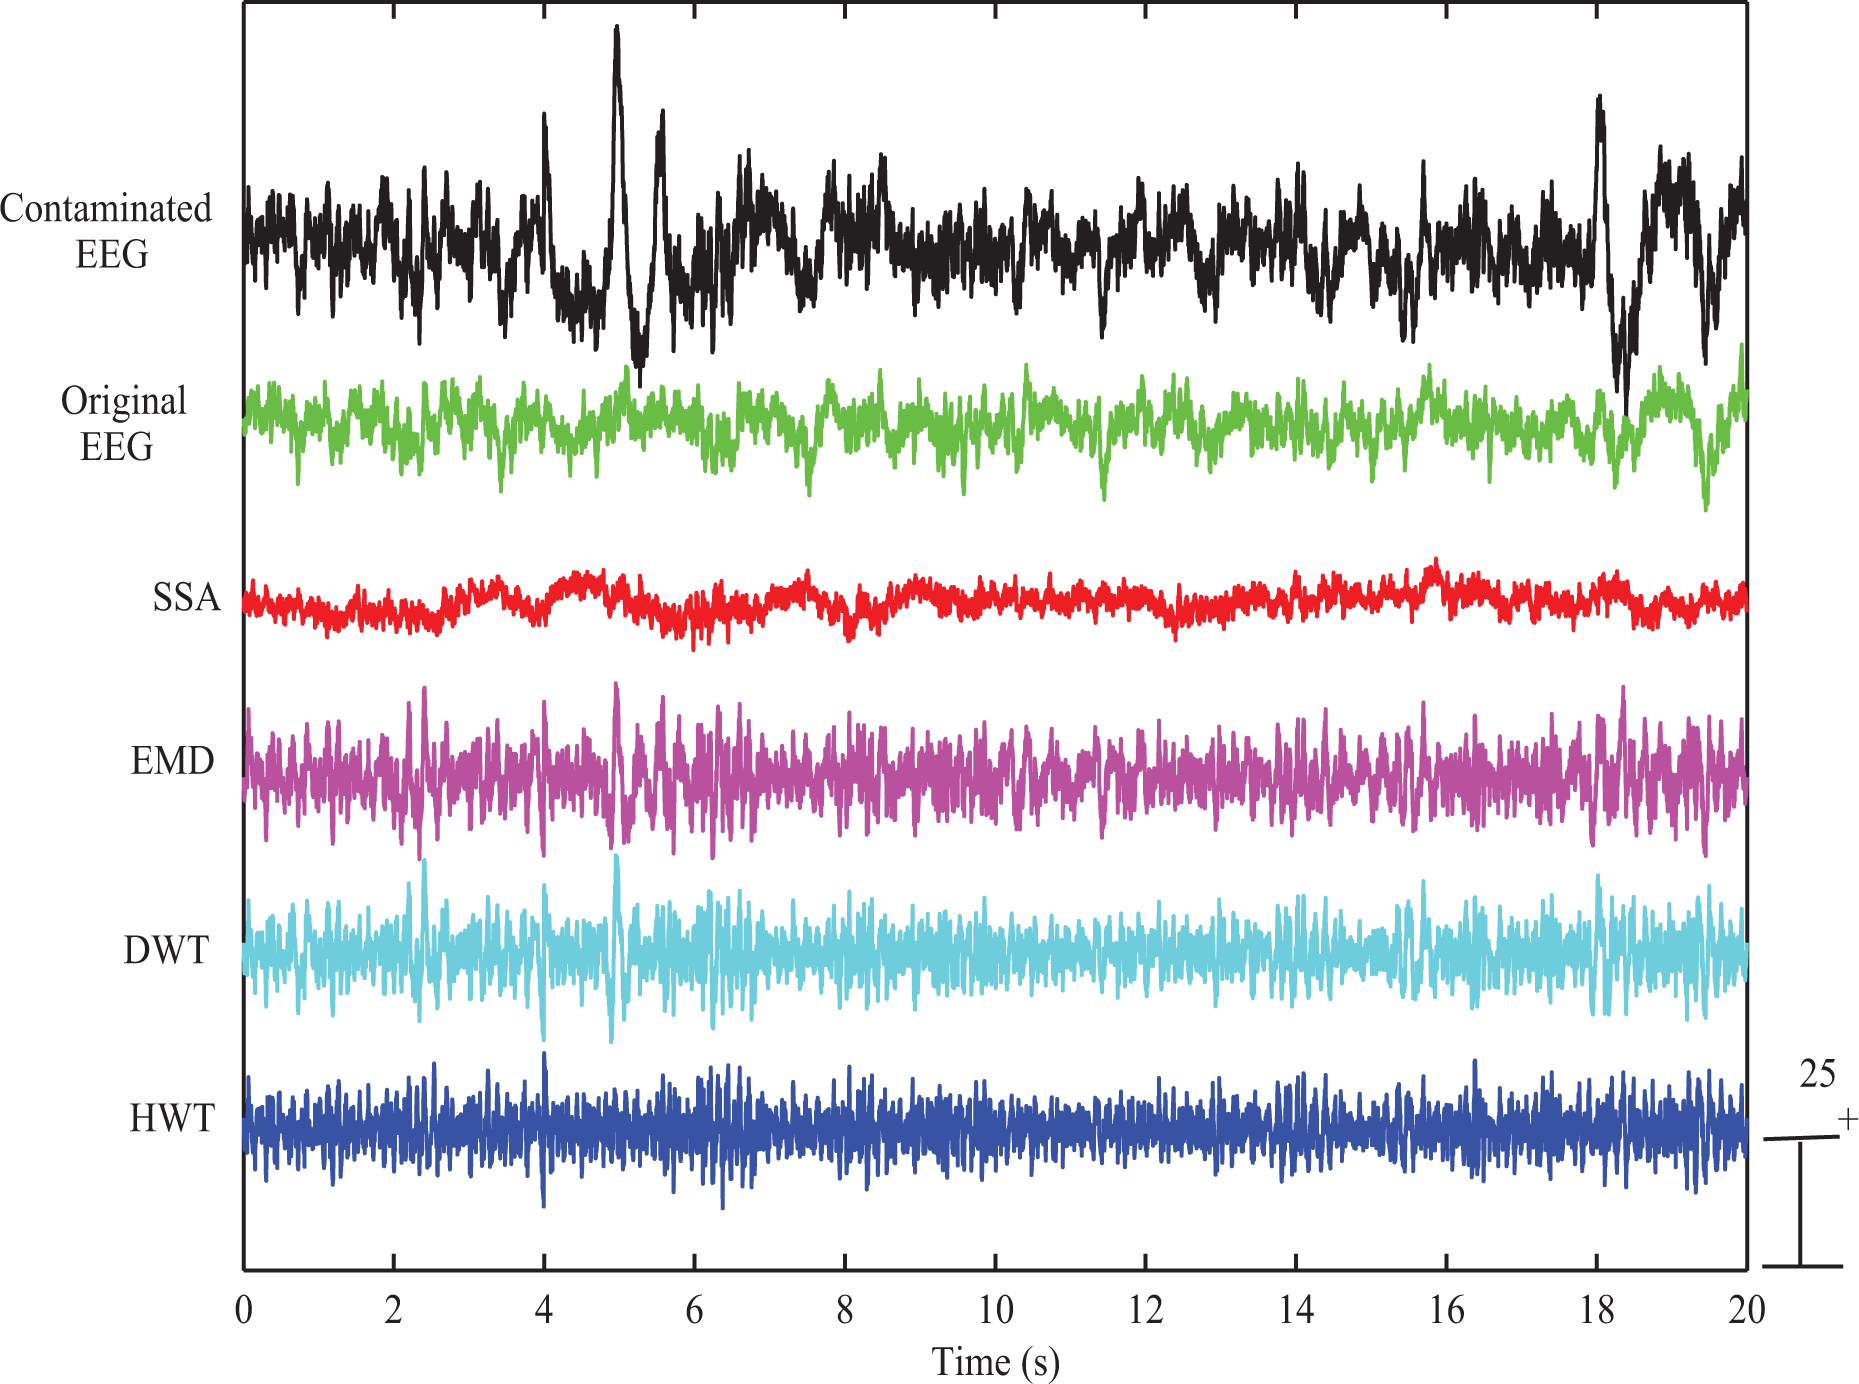
Time-domain representation of raw and pure EEG signal separated by SSA, EMD, DWT, and the proposed HWT technique. EEG: electroencephalography; HWT: hybrid wavelet transform; SSA: stationary subspace analysis EMD: empirical mode decomposition; DWT: discrete wavelet transform.
In Figure 19, the black, green, red, magenta, cyan, and blue solid line signal represents contaminated EEG, EEG, clean EEG using SSA, clean EEG using EMD, EEG using DWT, and pure EEG using HWT, respectively. The EMD method reduced the EOG but it contained some artifacts with EEG signal. The wavelet-based transform DWT produced artifact-free signal but the computational complexity of DWT is higher than HWT (Figure 24). On the other hand, the proposed hybrid wavelet-based transform HWT is found as completely artifact-free pure EEG without losing information and it takes low computational time.
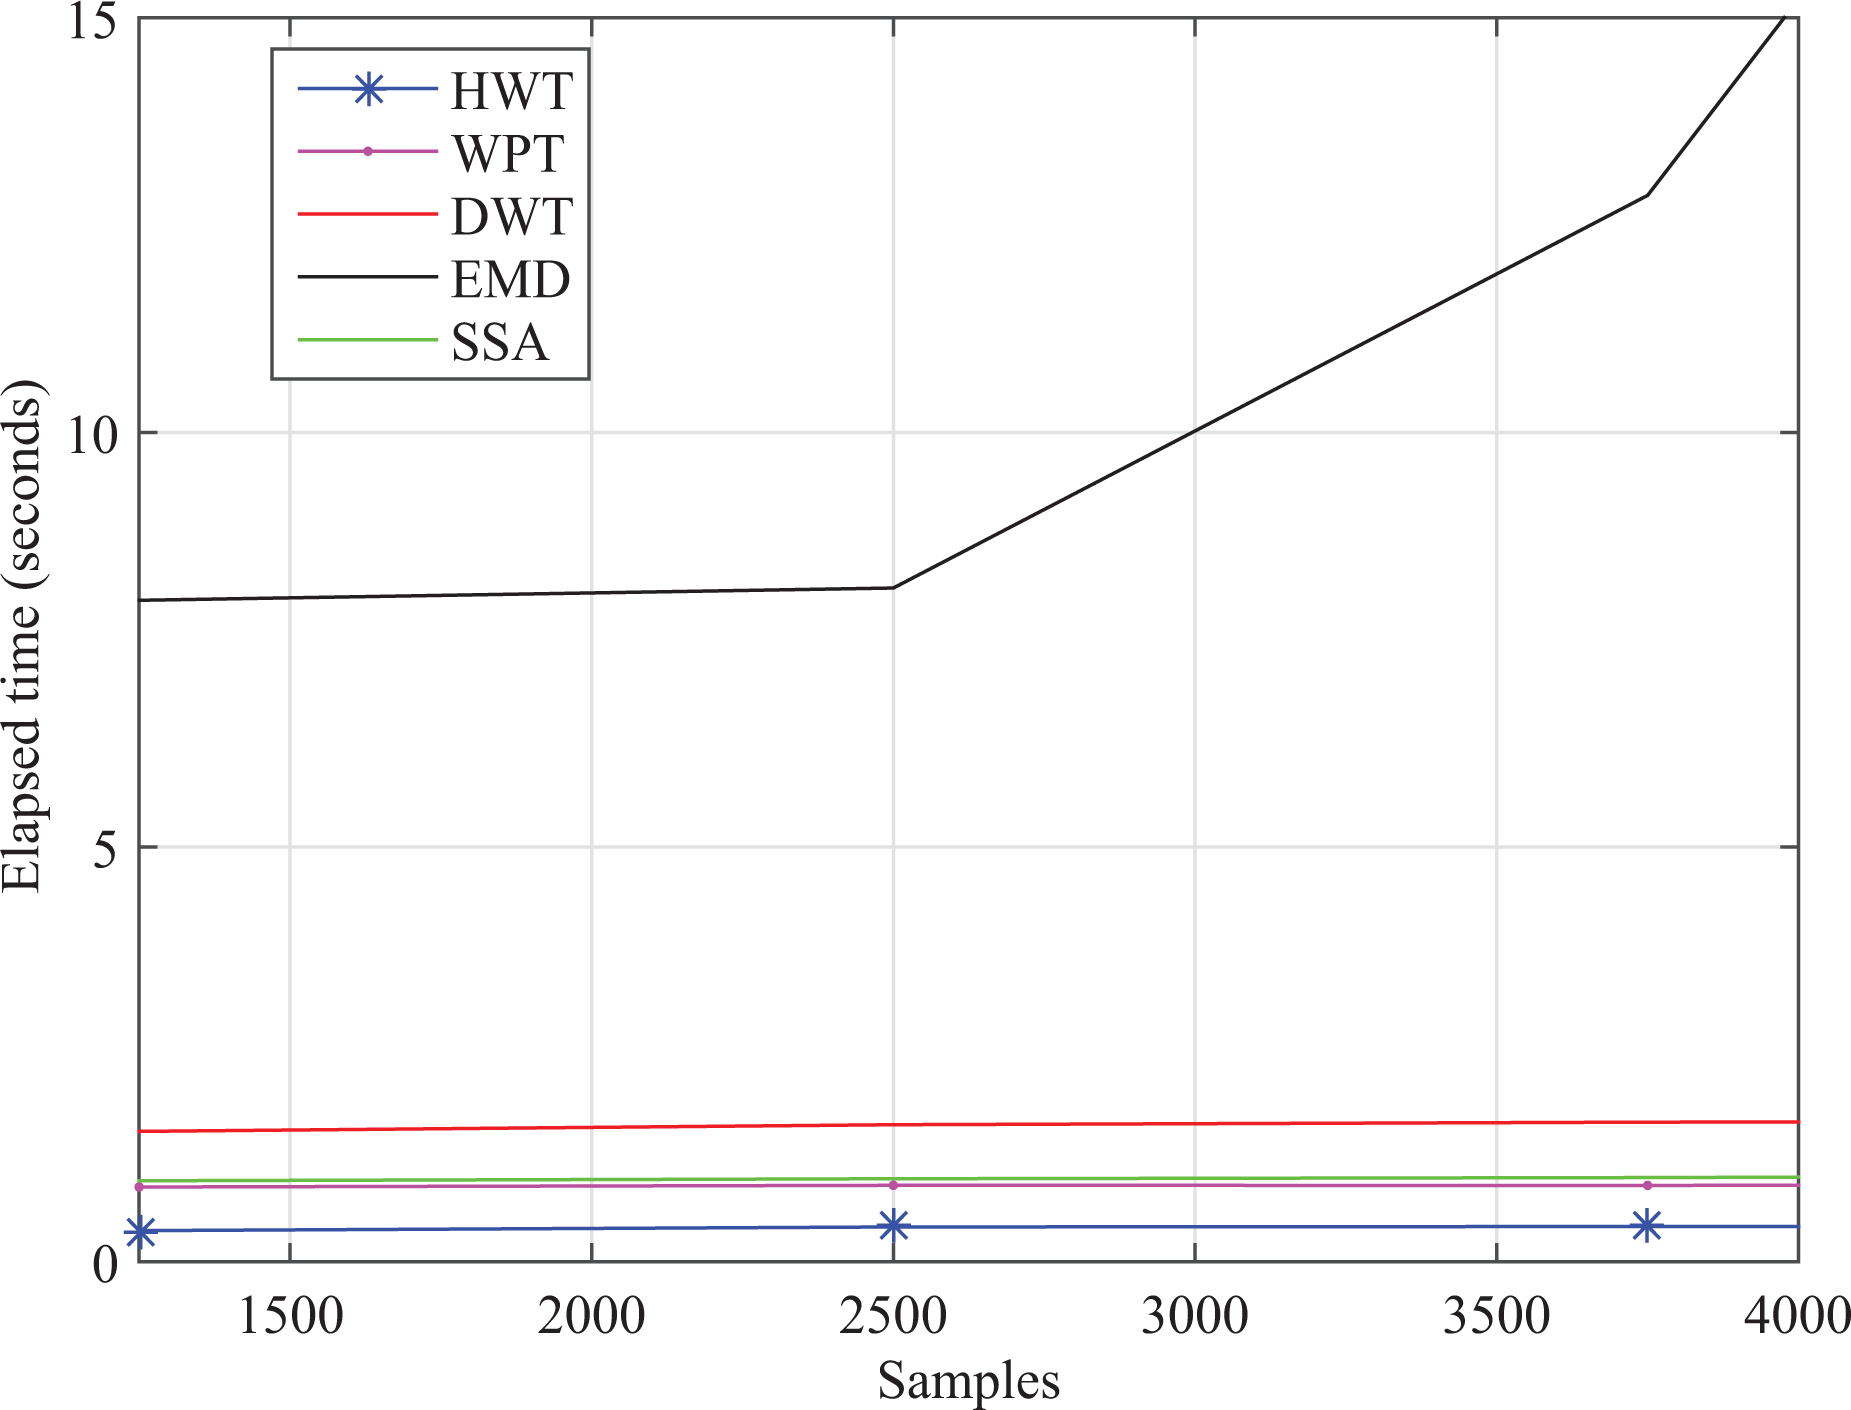
Comparison of computational time for the five methods. Time required by the proposed HWT, WPT, DWT, EMD, and SSA to remove the artifact. The required time is increased with increasing the number of samples for EMD. HWT: hybrid wavelet transform; SSA: stationary subspace analysis EMD: empirical mode decomposition; DWT: discrete wavelet transform; WPT: wavelet packet transform.
The HWT-based filtering is obtained by combining the sub-bands as frequency varying filtering. It is suitable to process the nonstationary signals. In the proposed method, the EOG is considered as the trend on the recorded EEG signals. If the EOG artifact is viewed as the trend (relatively low frequency with higher amplitude compared to EEG signal), the present approach will be able to remove it.
To evaluate the performance of the proposed approaches in a real environment, the raw EEG and clean EEG for the mentioned four methods are analyzed in Figure 20 (in frequency domain) and Figure 23 (in time domain). In Figure 23, the first raw, second raw, third raw, fourth raw, and the fifth raw represent raw EEG, clean EEG using SSA, clean EEG using EMD, clean EEG using DWT, and clean EEG using the proposed method, HWT, respectively. It is observed that the purified EEG signal contains more original information although the artifact has canceled out. It is apparent that using SSA, EMD, and DWT filter for artifact correction, underlying EEG or low-frequency cerebral data may be lost. To reduce the data loss, HWT method is used. From the above figure, it is observed that the HWT-based method is best for reducing the EOG from raw EEG without cutting the information and assisting to get clean EEG. It is important to stress that the proposed method separates broad frequency content of neurophysiological signals from very strong EOG interference. In this aspect, the research results are presented here on the behavior of the HWT. It is observed graphically that HWT provides better results in comparison with SSA, EMD, and DWT. So, it is an efficient technique for improving the quality of EEG signal in biomedical applications.
Performance metrics
To determine whether the method is successful or not in removing OA from EEG, the performance is assessed using two performance criteria, that is, signal-to-artifact ratio (SAR) and mutual information (MI).
Signal-to-artifact ratio
The metrics commonly employed to represent the energy of the signal compared to the energy of the artifact is the SAR 38,39


Here,
Raw EEG signals suffer from low SAR. To get better artifact-free EEG signal, the SAR value must be higher. The SAR is used to compare the ratio after denoising to the original ratio of the artifactual EEG signal. The proposed HWT algorithm is compared with other eye blink artifact removal algorithms.
The better the denoising is the greater the SAR and MI. Artifact getting rid of the effect of different methods are given in Tables 1 and 2. As known from Table 1, the SAR after hybrid wavelet decomposition is maximum for artificially corrupted EEG and becomes better artifact removing method. A comparison of SSA, EMD, DWT, and HWT analysis for artificially corrupted EEG is summarized using
Comparison of various artifact removing methods and proposed HWT method for artificially contaminated EEG data.

EEG: electroencephalography; HWT: hybrid wavelet transform; SSA: stationary subspace analysis EMD: empirical mode decomposition; DWT: discrete wavelet transform; MI: mutual information; SAR: signal-to-artifact ratio.
A comparative summary of stationary subspace analysis, discrete wavelet, empirical mode and proposed hybrid wavelet transform for real EEG data.

EEG: electroencephalography; HWT: hybrid wavelet transform; SSA: stationary subspace analysis EMD: empirical mode decomposition; DWT: discrete wavelet transform; MI: mutual information; SAR: signal-to-artifact ratio.
Table 2 also presents the comparison results of the average SAR values (using
Mutual information
It is used statistically to measure how much information one random variable contains about the other random variable. Here, MI 8 is calculated (a nonparametric measure of relevance between the two random variables) to find how much information is artifact-free EEG signal. In this article, MI index is adopted for the quantification of the mutual dependence of the pure EEG signals and the artifact-rejected EEG data sets using the next formula
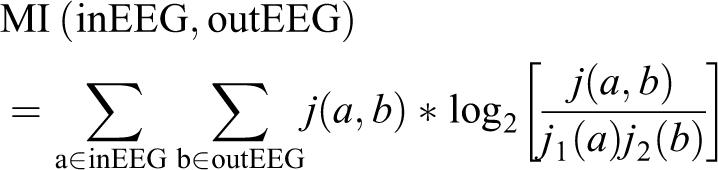
where
If the MI between artifact-free EEG and output EEG from the proposed method is large, then they are closely related and the method is better for artifact removal. Moreover, the mean and standard deviation of MI (contaminated EEG) for four methods are reported in Table 1. To evaluate the similarity between the raw EEG signal and corrected signal quantitatively within all the artifact-free intervals of the recording, the SAR and MI are calculated between them. Here, the criterion to select an artifact-free segment is that no samples of the EOG exceed 12 µV. The mean and standard deviation of SAR and MI (raw EEG) for four methods are listed in Table 2.
Using the above equation, the experimental results point out that the SAR of both measured and real EEG signals could be obviously improved in different conditions and the MI on average of synthetic and real world. By comparing with the other existing artifact removal method, it is demonstrated that the proposed HWT method improved the SAR and MI both significantly better than the SSA-, EMD-, and DWT-based method. The better the denoising, the greater the SAR and MI. Artifacts getting rid of the effect of different methods are presented in Tables 1 and 2. As known from Table 1, the SAR of HWT is maximum for artificially corrupted EEG and becomes a better artifact-removing method.
For real EEG, the average respective values of SAR and MI for all the methods are enumerated in Table 2 and demonstrate the improved performance of the proposed method over conventional methods (SSA, EMD, and DWT). The table shows that the HWT-based technique yields the best SAR result and MI value compared to the other methods. Based on the performance metrics values, it is observed that the HWT filter with db4 mother wavelet is able to filter out more artifacts compared to SSA, EMD, and DWT.
Time complexity
The computational time is a very important issue in an online BCI system. It is also a metric to measure the computational effectiveness of the method. 10 To quantify the computational complexity of the methods discussed in this study, the processing time under different methods is shown in Figure 24. The relative artifact removing time required by HWT and other methods as a function of the number of samples is illustrated. The required time remains unchanged with increasing the number of samples for four methods such as SSA, DWT, WPT, and HWT. Moreover, it clearly shows that the computational complexity of EMD is much higher than that of the other methods. Hence, EMD is not comparable with HWT for EOG artifact cleaning and online implementation. The HWT requires less computational time than DWT and WPT. Also DWT and WPT can be used to EEG cleaning and online implementation. But it is expected that the proposed approach is quite faster compared to the other wavelet approaches. Furthermore, the HWT method reduced computational cost than other methods discussed in this study. But it is expected that the proposed approach is quite faster compared to the other wavelet approaches and reduced computational cost discussed in this study. All algorithms are implemented in MATLAB (release R2013a) and executed on the same computer with Windows 7 Ultimate (Intel(R) Core(TM) i5-4590 CPU, 3.30 GHz processor, 8 GB RAM). Here, a comparison is used between different filtering approaches to find out the RAM usage on same EEG signal. In this research, the RAM 1240 MB, 1247 MB, 1233 MB, 1210 MB, and 1199 MB are used by the methods SSA, EMD, DWT, WPT, and HWT, respectively.
Conclusions and future work
The WT and wavelet packet-based proposed novel method is introduced as a data adaptive time-domain filtering approach to separating the EOG artifact from the recorded EEG signals. The performance of the algorithm is tested using both contaminated and real signals. Pure EEG signal is being used recently on a large scale for developing BCI, whereas the contaminated EOG signal would create some problems in such applications. The proposed data-adaptive method efficiently separates the EOG artifact without changing the amplitude and other necessary properties of the EEG signals. The HWT is introduced to reduce the sub-band space compared to WPT. In BSS algorithm, SSA is shown to be effective to remove OA, but it relies on multiple channel data and can also work in the elimination of neural activities. A thresholding-based denoising method using WT is implemented to separate the EOG signal. The EMD is also a so-called data-adaptive technique. But it takes high computational time. The computational time of the DWT and HWT algorithm is also very low in comparison to the EMD algorithm. Hence, EMD is not comparable with DWT and HWT for online implementation of EEG cleaning. Based on SAR and MI performance metrics, it is practical that the SSA, EMD, and DWT method cut the original information with EOG which is absent in HWT. The proposed HWT method separates EOG while keeping the scale of EEG amplitude undistorted. The HWT method reduced EOG artifacts but did not eliminate the original information. So, HWT is better in removing the EOG artifact compared to the other three methods. Using this artifact suppression method, we extract a clean neural response from the human brain signal. After that, we used the filtered neural signal to robots. That process is called neurorobotics for EEG signal classifications. For this reason, artifact suppression is essential for neurorobotics. In neurorobotics, we will implement paralyzed people’s decision, which will be implemented by robots. The robot acts as per human instructions. Using human motion brain signal, it is possible to achieve efficient and smooth movement for bionic robots, and so on. Neurorobotics could be used in many situations for its lightweight and flexible structures, such as medical robotics, booster robotics, aerospace robotics, and unmanned system. Therefore, the future scope of this research is to establish human–robot interaction with paralyzed patients.
Footnotes
Declaration of conflicting interests
The author(s) declared no potential conflicts of interest with respect to the research, authorship, and/or publication of this article.
Funding
The author(s) received no financial support for the research, authorship, and/or publication of this article.