
Abstract
The problem of global optimal evaluation for multi-robot allocation has gained attention constantly, especially in a multi-objective environment, but most algorithms based on swarm intelligence are difficult to give a convergent result. For solving the problem, we established a Global Optimal Evaluation of Revenue method of multi-robot for multi-tasks based on the real textile combing production workshop, consumption, and different task characteristics of mobile robots. The Global Optimal Evaluation of Revenue method could traversal calculates the profit of each robot corresponding to different tasks with global traversal over a finite set, then an optimization result can be converged to the global optimal value avoiding the problem that individual optimization easy to fall into local optimal results. In the numerical simulation, for fixed set of multi-object and multi-task, we used different numbers of robots allocation operation. We then compared with other methods: Hungarian, the auction method, and the method based on game theory. The results showed that Global Optimal Evaluation of Revenue reduced the number of robots used by at least 17%, and the delay time could be reduced by at least 16.23%.
Introduction
With the emergence of a large number of robots in various production work scenarios, the research of multi-robot systems (MRS) has become an essential field in the study of robot control. Especially for a multi-object and multi-robot system, real-time and reasonable task allocation is necessary for a high-efficiency production. It is a great challenge to find the optimal value of multi-task allocation for an MRS. Many scholars simply summarize the task allocation problem as assigning different robots to corresponding tasks with consistent strategies or assigning reasonable objects to a given group of tasks and robots. However, such assignment sometimes may fail to finish multi-task on time or not the maximum of tasks.
The MRS has been applied in workshop transportation, 1 intelligent warehousing, 2 emergency rescue, 3 and exploration of dangerous and unknown battlefield environment. 4 The reasonable assignment of tasks, the reduction of response time, and the combination of optimal paths will still be studied. According to the existing MRS, the solution of the multi-robot-multi-object-multi-task problem as assigning r robots to k desired object positions to perform n tasks at time t. There is r×k×n three-dimensional task solving set. The data in the task solving set increase exponentially, when the number of objects, tasks, and the number of robots increases.
As the reasons stated above, merely thinking about task allocation, we found the following critical issues. The first question is how to describe the influence of mutual perturbations of robots on the optimization process. The behavior of multiple robots is determined by interaction, which could also be essential a single robot in a group of mobile robots. The second question is how to respond to sensitive time constraints. The third question is how to avoid the problem that for the optimization model in swarm intelligence, optimization value is challenging to converge in the process of multi-robot optimization infinite space. The final question is for an MRS, how the optimal result of multi-task allocation could effectively utilize data after balancing the benefits, such as path planning, energy consumption, and carrying capacity.
To solve these issues and obtain the optimal profit model, we introduce a new global optimal evaluation method. In this article, the determined optimal solution is obtained by global traversal of the set of finite space and finite tasks. At the same time, the profit value of each robot corresponding to the human is calculated, and the final optimization result converges to the global optimal. We first mathematically abstract the profit and consumption of tasks performed by a robot. Then we applied the optimal profit model to the multi-robot multi-task assignment. The multi-mobile robot system was applied to the multi-object and multi-task environment by analyzing the basic and necessary parameters: the power loss of robot’s operation, the revenue from the execution of virtual tasks, and the addition of path replanning in the allocation. Then the optimal allocation was set. A sub-model was established for improving the gain value acquisition method of game theory in the global optimization process. In the process of numerical simulation, the global revenue optimization matrix was constructed by deterministic results. The global revenue optimization matrix is used to solve the problems of a limited set of multi-objective-multi-task assignments in the indoor environment. Finally, we applied the Global Optimal Evaluation of Revenue (GOER) model to the simulation environment of the distribution process of yarn reel handling tasks in the combing workshop of the actual textile enterprise. The execution response of all tasks in one iteration is completed within a limited time range, which verifies the maximum global revenue value that the model could obtain and converges.
For the given object set, task set, and robot set, this article makes the following contributions:
We proposed a multi-task-multi-robot allocation model based on the GOER for a limited set. Under the constraints of limited space and a small task set, the model obtains a deterministic optimal solution through a global traversal method;
For the limited task state, the model can be used to obtain the optimal number of robot matching under the constraints of tasks and robot characteristics;
Carry out multiple iterations of the optimal path planning of the individual robot to obtain a path planning method oriented to the global optimal solution, and the optimal value converges.
The division of labor in the remaining chapters of this article is as follows:
Related work part briefly introduces some assignment methods involved in this article.
Model of GOER mainly introduces the process of goer optimal model from the description Of multi-object and multi-task to the establishment of revenue model and also describes the realization of GOER algorithm.
Experiments and data analysis part were carried out to describe and analyze the task assignment results from experimental Settings. Meanwhile, comparative experiments were added to illustrate the superiority of GOER algorithm.
Conclusion gives a general description of the content of this article, analyzes the content of this article and its practical application, and points out the work that needs to be completed in the next research stage.
Related work
The task allocation of robots is a research hotspot in the field of multi-robots. The existing application research that mainly solves the problem of MRS is as follows: In a limited time, the object task allocation set could be responded to and executed by the provided multi-robot groupset. It is hoped that the optimal allocation of the multi-task set allocation result could be obtained in a short time. In this regard, the existing related research work is mainly divided into centralized task allocation 5,6 methods and decentralized task allocation methods.
In the early research stage of multi-robot task assignment method, most scholars adopt the centralized task assignment mechanism. Because the mechanism has a central control robot that collects and senses the environment around it, makes calculations on the collected data, and relays decisions to the lower robots. When the communication strength and computer power are limited, the robustness and scalability of the system are poor. The centralized method mainly includes heuristic algorithm, constrained programming method, and integer programming method.
In a centralized system, a robot is required to have the global information of the system. The central control system calculates the optimal or near-optimal decision-making to maximize the efficiency of the MRS. Centralized decision-making processes are usually modeled as integer programming. Although these methods are able to find the optimal solution, it is still necessary to use a decentralized task allocation method to achieve the requirements of sufficient information.
The distributed group structure can give full play to the role of individual robot. Each individual can independently collect information and make decisions. Moreover, individuals can exchange information and make swarm intelligence behavior. Because of the good robustness of distributed system, most MRSs adopt distributed architecture. The main methods of distributed task assignment include market method, contract network method, and immune system–based method.
In a decentralized system, each robot needs to make its own decisions, which makes the system more flexible and robust. Robots could collaborate to maximize the efficiency of the system. Negotiation is an effective way for decentralized robots to cooperate. But robots can only negotiate in pairs once. If a robot wants to participate in another talk, the robot needs to go offline and reprogram to adjust the new negotiation protocol. The problem is that the control method of the robot cannot be independent of the protocol, but the protocol cannot be determined in negotiation once. However, in different environments, robots often need to complete other tasks with varying members of the team.
In general, when the number of robots is large, the centralized system has poor robustness due to limited communication and computing capabilities, while distributed system can well avoid this problem and realize swarm intelligence behavior, which is also the inevitable choice for the development of multi-robots in the future.
At present, there are mainly three types of existing decentralized task allocation methods: optimization-based, market-based, and game theory. Based on optimized methods, the existence of a matrix waiting for the optimal allocation solution at each iteration step provides a better solution. Scholars have proposed a variety of optimization models and algorithms using distributed computing and cluster intelligence. Wu et al. 7 suggested a dynamic ant colony division of labor model, which is real-time and flexible. Still, the simple division of labor out of the physical space makes it challenging to apply existing MRSs directly. The improvement of Wu’s method is proposed by Chen et al. 8 The organization algorithm is a popular multi-task assignment algorithm in recent years. The organization algorithm enables multi-robots to reach the designated object position without collision in an environment with obstacles and allocates tasks reasonably in combination with path prediction. Less consideration is given to issues such as cost and power energy consumption. Zhang et al. 9 introduce time constraints and robot capacity constraints to construct multi-task and multi-object allocation model in dynamic environment. Su et al. 10 propose a multi-objective quantum particle swarm algorithm, which combines timing constraints, collaborative constraints. Based on the method, robot’s ability is constrained to perform different tasks. However, the above two methods do not consider time cost and priority issues. Simultaneously, it is found in the process of numerical simulation that it is easier to fall into the local maximum. Han et al. 11 solve the problem of falling into local optimality and propose a task allocation method of transfer learning, which considers the relationship between tasks and the impact of historical experience on functions. Chopra et al. 12 combined several standard heuristic algorithms to design a genetic algorithm for dynamic task allocation. Although optimization-based methods have good exploratory properties and a wide range of applications, it is challenging to develop appropriate local decision rules. 13 Therefore, most optimization-based methods are used for centralized task allocation.
The auction algorithm is a typical market-based method, which is an iterative process in which the bids of multiple robots are compared to determine the best offer, and the final transaction is obtained by the highest bid. 14 Attiya and Hamam 15 proposed an auction algorithm based on consensus and a bundled auction algorithm to solve the task assignment method of autonomous robot formation. Andrew et al. 16 designed an improved auction algorithm in a dynamic environment considering the communication range of a limited agents. Although the market-based method has good robustness and scalability, it also has some shortcomings: lack of effective individual control strategies and practical techniques; poor performance when introducing necessary negotiation and punishment programs.
In recent years, research on distributed game decision-making has emerged endlessly. Whether there is an external authority to enforce the rules, games could be divided into cooperative and noncooperative games. In the cooperative game, the feature alliance is first formed into a game. The relationship between profit and loss is used to solve the task distribution problem among multiple autonomous robots. Zhang et al. 17 used the method of evolutionary game theory to study the evolution process of the division of labor under three strategies and concluded that the more massive synergy benefit is helpful to the significant division of the system and provides higher services for the MRS. In recent years, learning from game theory in economics and applying heuristic improvements to task allocation have solved the problems in the resource allocation of the robots above. However, this method needs to consider the interests of both players. A balance is reached between the two, and it is difficult to achieve the global optimal or approximate global optimal. Choi HL et al. 18 proposed a new framework based on a one-step environment of hedonic games. The framework has good scalability and at least 50% sub-optimality, but this method could not guarantee global convergence. For noncooperative games, we previously proposed a distributed autonomous decision-making framework based on multi-robot game theory. The task model is established according to the textile production task environment, the task distance and time priority are considered, and the object utility function of the robot is used as the basis for strategy selection. The equilibrium theory of the game is introduced to solve the problem. However, this framework could not ensure the efficiency of the Nash equilibrium and the convergence of the algorithm. 19
Therefore, according to the current research, this article fuses the decision data of the robot in the distributed system into the iterative process of traversal calculation of the finite set global optimal allocation. This combination of centralized and distributed methods avoids the one-to-one determinism of robot and task execution. 20 In this article, the intelligent decision data part in the distributed system and the optimal allocation part in the centralized system are fused together, aiming to find a more flexible and efficient algorithm, and the overall framework is still centralized task allocation. At the same time, the profit value function model draws on the idea of task cost increasing with time in the study of Lu et al. 21
Model of GOER
Description of multi-object and multi-task
Please refer to Table 1 for the symbols involved in this article and their descriptions. For the model to be universality applicable, we do not limit specific and features of objects. The features of objects are digitized. There are limited types of tasks to be executed for the same object, and then the set of k objects at time t can be expressed as

The type of tasks that might need to be performed for the o-th object is described as

The global task set at time t is shown in equation (3). There are k×n task requirements

Task location feature
Task value weight
Waiting for priority feature

In formula (4),
List of symbols.

Multi-task and single robot global revenue model
Consumption

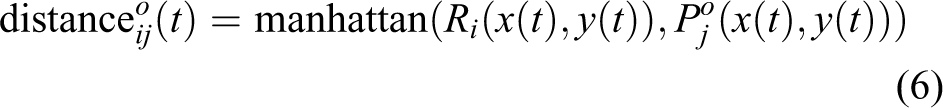
For the task, the longer the waiting time is, the higher the priority is. The shorter the distance between the robot and the task is, the higher the value is. Here, distance and wait time are not both weighted into the allocation method. Distance and waiting time are part of the value of a task. When a task is executed, it first needs to be classified, that is, it is divided into tasks of different classes with different waiting time and tasks of different classes with different distance. In the same class of tasks, the longer the waiting time is, the higher the priority is. The waiting time is more important for task priority, because the longer the waiting time, the more the task needs to be processed. At the same time, for the same type of tasks, the shorter distance corresponds to less energy consumption of the robot, so the distance is also used as one of the priority evaluation criteria in this article.

There is a profit matrix
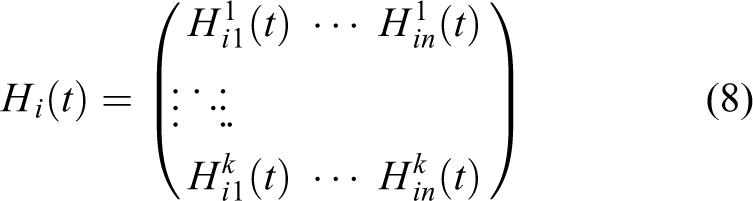
For the guidance execution position of a single robot i at the next moment, we selected the maximum profit value as shown in equation (9)

The task set was traversed to calculate its profitability matrix Hi , and the object corresponding to optimal value was obtained as the induction position of robot i, as shown in Figure 1.
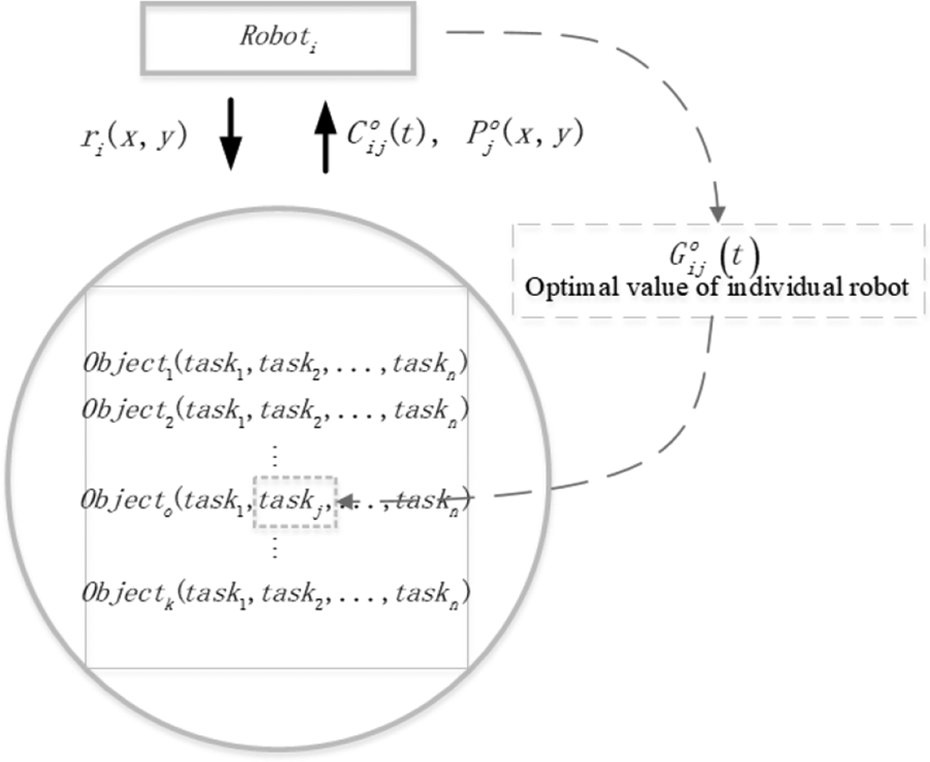
Schematic diagram of single robot multi-task optimization.
In Figure 1, the robot conducts traversal calculation on the task set at the next moment to obtain the induced execution bit at the next moment and returns the position
Multi-task and multi-robot global revenue model
Section “Multi-task and single robot global revenue model” could provide a straightforward and multi-task profit optimal evaluation for the optimization of a single robot with multiple tasks. Still, the following problems will exist in an MRS:
It is challenging to solve the situation where the profit value of various robots for the same task is equal, and the profit of the same robot is the same for multiple tasks;
There is a risk of “optimization without replacement.” That is, when a robot takes a task away, the task is no longer used for the optimal profit evaluation of other robots in the task concentration. It results in the inconsistency of the optimal local value of the task and the global optimal value.
The optimal summation of multiple individual robots could not prove that it is globally optimal in the multi-robot multi-task assignment process of “optimization without replacement.”
Therefore, it is necessary to evaluate the distribution income of all tasks to obtain the global optimal value of all tasks to obtain the global optimal value.
First, at time t, we put the possible profit values of the robot set and the multi-objective-multi-task set into the same global profit value matrix, as shown in equation (10)
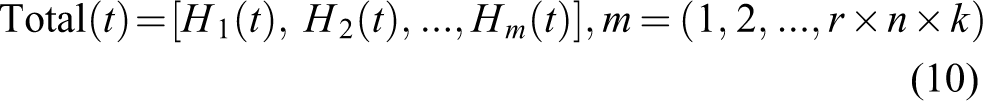
The number of sub-matrices of global profit matrix is r, which is same as the number of robots that could work at time t.
Each time a return value is taken for each income sub-matrix, we calculate the sum value. We formed a global income value traversal matrix A (All), as shown in equation (11)

The gain value in formula (11) is to ensure the uniqueness of the object task being executed. We determined the combination of each row in the recipe (12) by the formula (11) to be unique

Then we obtained the Global Optimal (GO) value

Through equation (13), the value of the individual robot under the global optimal evaluation condition,

Multi-robot multi-task of task allocation diagram.
In Figure 2, multiple robots traverse the task set at the same time. After this process is completed, each robot will get a profit value
Algorithm implementation
The implementation process of the algorithm is shown in Figure 3.

GOER algorithm flow chart.
1). Data initialization
To prove the universality of the model in this article, we use random data when obtaining the initial object working point position and robot distribution coordinates. The function receives the coordinate value.
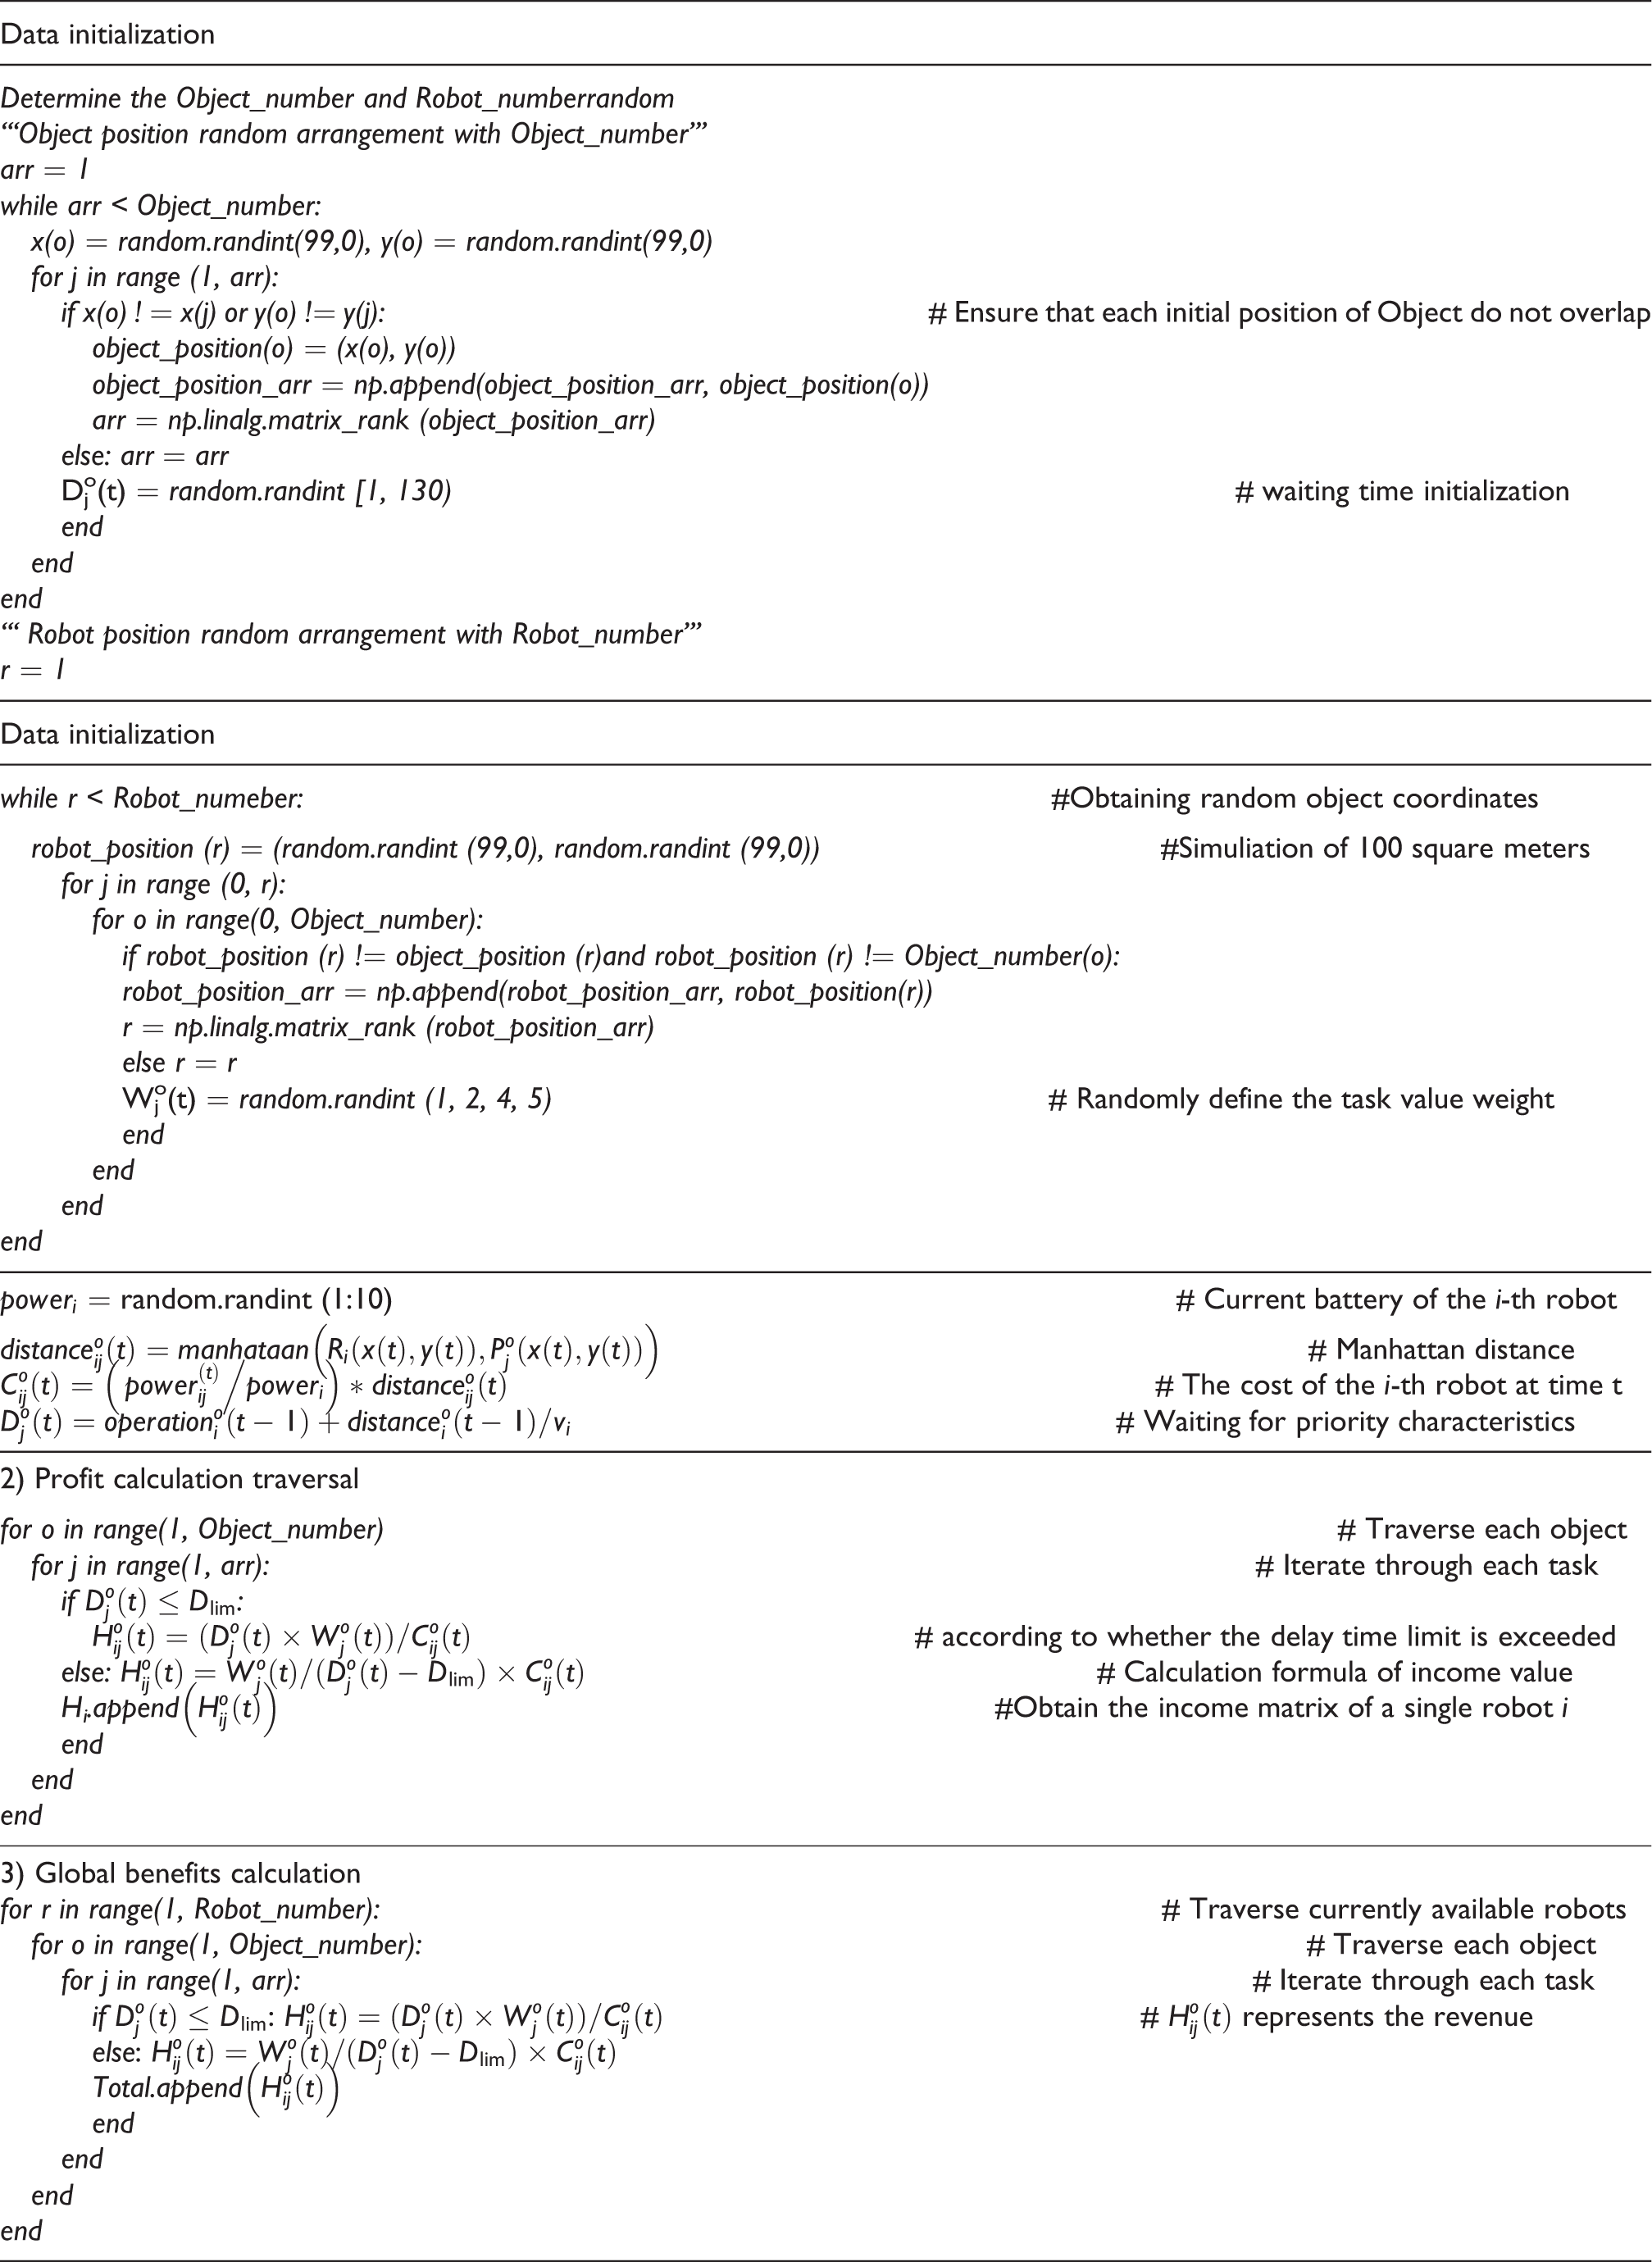
4). Assignment task uniqueness
The result of global optimization is that corresponding to the optimal value of one allocation, multiple robots may adapt to a task, respectively, or one or more tasks may adapt to the execution of one robot. To ensure the uniqueness of the assigned tasks, we defined when multiple allocation plans correspond to the optimal value of one allocation plan, we only executed the allocation plan that appears for the first time.

Experiments and data analysis
Experimental setup and data initialization
The application of our GOER model in the handling of cotton yarn rolls in the combing workshop is as follows. In the experiment, we assumed that all the robots were free from any interference during the task execution, and all the production equipment operated stably and the workshop environment did not change. The combing workshop is a limited two-dimensional area (this article refers to the workshop 100 × 100 m2), and the distribution of robots in the workshop is random, all robots are the same type, with primary navigation, obstacle avoidance, odometer, and communication

Schematic diagram of cotton yarn handling in the combing workshop.
Robots data initialization
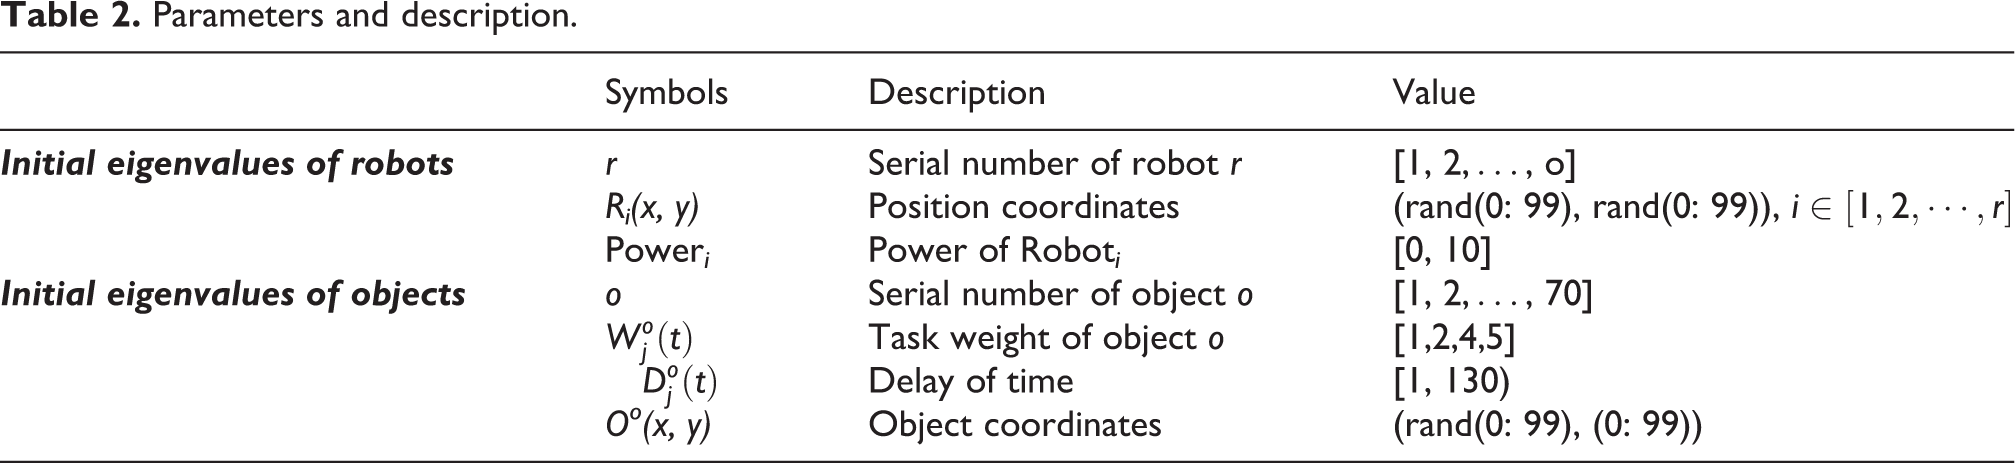
Robot object initializes two basic data: robot initial position coordinate Ri (x, y), the value is Ri (x, y) = (random(0, 99), random(0, 99)), The initial value range of robot power is power i = random(0, 10 and 0 is the autonomous charging demand bit.
Objects data initialization
The object needs to randomly generate three sets of data to initialize the object data:
The value weight is set as
Delay time
In actual production and processing, the time for workers to replace empty rolls and cotton rolls does not exceed 5 min. At the same time, the average value of the robot in this article is assumed to be v = 1.6 m/s, so the robots completed a diagonal reciprocating movement (4 × 100)/v = 250 s, it only takes 125 s to complete the farthest mission. Considering that the robot needs to complete turns and u-turns, in this experiment, we set the upper limit of the delay time of nonresponse of the object task as 130 s(
The object position coordinate is
Initial data set
The characteristic value of the multi-object is its two-dimensional space coordinate point. Take the simulated real work station distribution in a combing workshop as an example. In Figure 5, there are at least 66 spatial coordinate points that need to be reached (64 working points, 1 raw material supply point, and 1 robot charging point). That is, there are 66 object points, and we set the upper limit of the object points to o ≤ 70 in the experiment.
The number of robot i = [1, 2, r,…o], where r is the minimum number of robots to meet the production demand. When the number of robots is less than r, there is a delay time D for the target to respond
In this article, a traversal method was used to calculate the optimal value in accordance with the GOER optimization rules. For a fixed task size, we optimized the number of robots by half and increased or decreased the number of robots near the optimal number of robots in accordance with the trend of the GOER value. Take the experiment in this article as an example: For 70 targets within a 10-min time limit, the optimal number of robot groups obtained from the task set size of four task weights is 17.
Parameters and description.
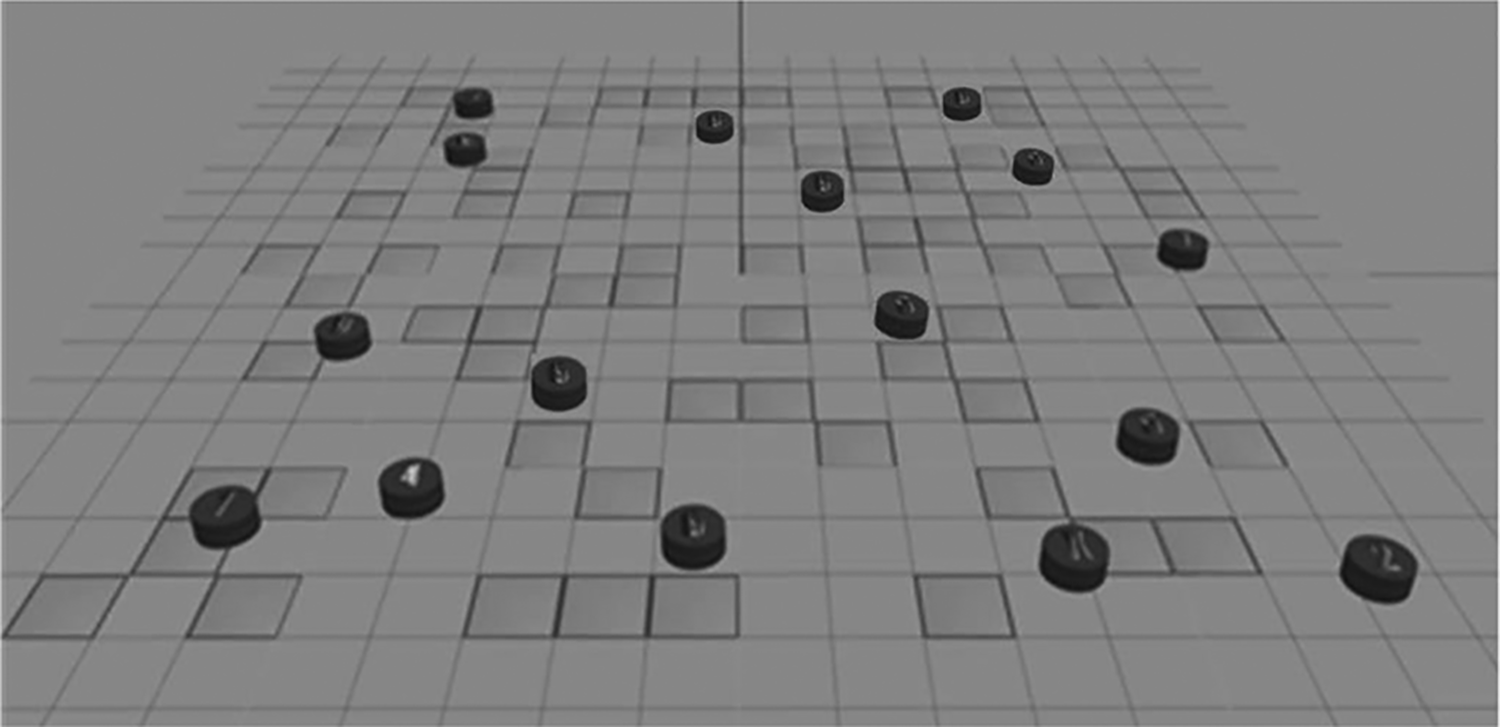
Schematic diagram of the simulation environment.
In Figure 5, after the experimental data are initialized, the target task will be randomly distributed in the graph (dark rectangle), and the number of robots performing the task will be set at the same time. The robots (black cylinder) will appear in the graph according to the specified distribution and will not overlap with the position of the random task. After the task starts, the robot begins to move autonomously, looking for its own target position, and starts to move to the target position until it reaches the target position. When all the target bits are traversed by the robot (the robot reaches all the rectangular boxes), the task assignment is completed.
Task distribution results and analysis
In the numerical simulation of task allocation, we used the naive half-divided method to discuss the optimal number of robot tasks. To ensure the uniformity of the task set data, we initialized the initial data of the object-task set in Table 3 for only one time. For different numbers of robots, we performed data initialization ten times. Then the numerical simulation of the distribution model was performed. At last, we verified the practicability of the model in this article through indicators such as optimal value, maximum delay time, and path length.
No response delay allocation
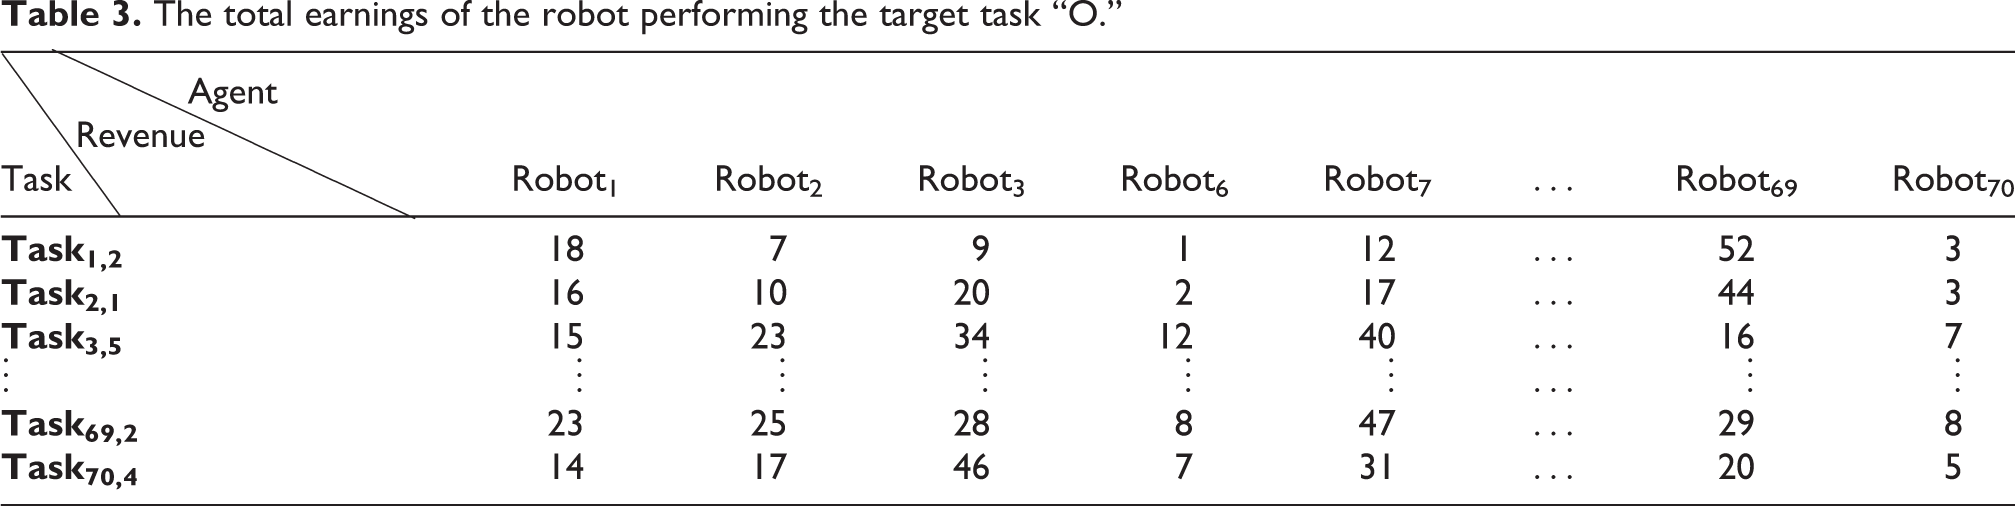
When the number of robots is equal to the number of object tasks, r = o = 70, each task will be directly assigned to all robots. That is, the robots can execute all the tasks simultaneously. At this time, the task can be quickly responded to and executed. There is no delay in the task allocation response, or the delay is only generated in the allocation calculation. According to the initial data set and equation (6), we are able to get the benefits of each robot for all tasks, as shown in Table 3. As shown in Table 3, we can clearly see the maximum benefits of each robot performing the task. The profit values of 70 robots for the 70 target tasks are as follows. Here we can see that for robot 1, the maximum gain value obtained is 23, corresponding to Task69,2. Correspondingly, we can see the maximum profit value of each robot and can quickly query the corresponding task.
In Table 3, Task ij means that after a task assignment is completed, the TASK is the i-th TASK and the j is TASK type. TASK1,2 means the task,1 means that the task is first task, 2 means the task type 2, (no-load is 1, empty roll is 2, single real is roll 4, double real roll is 5.).
The total earnings of the robot performing the target task “O.”
With the help of the GOER model, the result of multi-rob allocation corresponding to the optimal value is shown in Table 4.
Task distribution results.
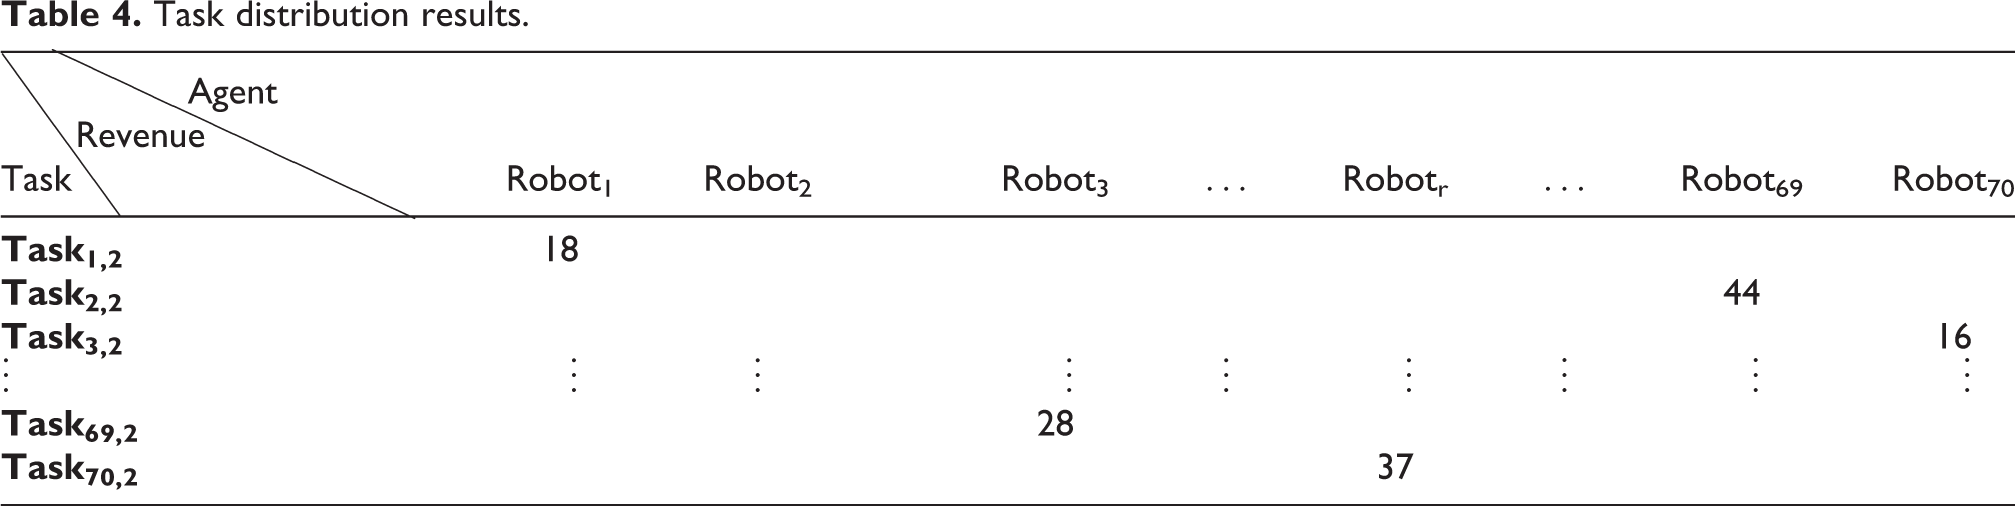
In Table 4, we can clearly see the profit value of each robot when performing different tasks of the same type after task assignment. Tables 3 and 4 show when the number of robots is the same as the number of tasks. Each robot can execute the assignment of tasks in time, which is obtained at the expense of the number of robots. However, the robot will be idle before the next moment. This situation causes a waste of resources. In a limited space, it is easy to cause blockage of the workshop path. For the profit value of the robot with different tasks, we found that the profit value selected in Table 4 is 18 instead of the optimal profit value of the robot in Table 3. The same is true for robot number 69, indicating that the global optimal value is not merely the sum of individual return values.
Task assignment with delayed response
For the allocation method that was wasteful of resources, we took
Compared with the redundant robots situation, the experiment took the number of robots as 1/2 and 1/4 of the object number, and the number of experimental robots was r = 35 and r = 18. The robot set generated 10 random initial data according to the elements in Table 4. And the profit value was calculated from the initial task data and GOER model, as shown in Table 5.
In Table 5, when the number of robots is 35, the average total income is 237.69, the average delay time is 60.40 s, and the maximum average delay time in 10 numerical simulations is 69.72 s. When the number of robots is 18, the average return value is 379.56, the average delay time is 98.50 s, and the maximum average delay time in 10 numerical simulations is 105.26 s. The data corresponding to r = 18 show that except the 10th experiment, the average delay time for task allocation is 105.26 s. The other nine delay times were all less than 105 s, and the minimum average delay time is 91.56 s. When robots number is reduced to 18, the profit value is increased, and the delay time response increases but does not exceed the time limit of 130 s.
The optimal return value table of 10 random robot collections when r = 35 and r = 18.

In Figure 6, the abscissa shows the frequency of waiting for the response, and the ordinate shows profit value, which are both dimensionless values. The “frequency” means the times of experiments. The income of task allocation under different numbers of robots was further analyzed, as shown in Figure 6. When the number of robots is 35, the mean value changes only 2% (maximum variance: 2.38, minimum variance: 0.08). When the number of robots is reduced to 18, the mean value changes within 2% (maximum variance: 1.65, minimum variance: 0.02). The comparison shows that as the number of robots decreases, the mean fluctuation and variance further decreases. This is because when the number of tasks is twice the number of robots, most robots do not have a waiting state. While waiting for response tasks occurs less frequently, the reduction in the number of robots results in continuity of operation and equalization of revenue.
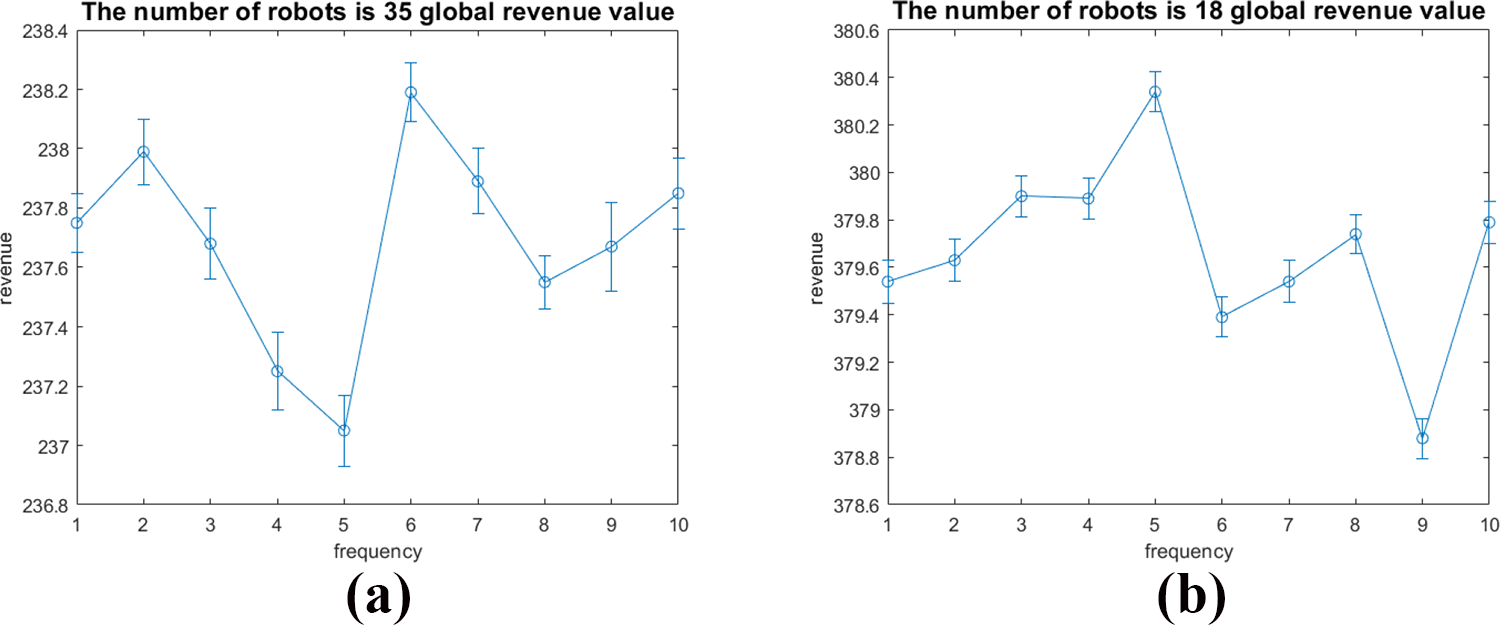
(a) The global revenue of 35 robots. (b) The global revenue of 18 robots.
When the number of robots is close to the optimal number, the search step is narrowed based on experience. Therefore, we selected 10 experiments with r = 17 and r = 16 to obtain return value, as shown in Table 6.
The revenue value of 16 and 17 robots is shown in Figure 7. In Figure 7, the abscissa shows the frequency is times, and the ordinate shows the revenue value, which are both dimensionless values. The “frequency” means the times of experiments.

The global revenue of 16 and 17 robot. (a) The global revenue of 16 robots. (b) The global revenue of 17 robots
In the data corresponding to r = 16 in Table 6, the maximum average delay time is 129.76 s, which is less than the limited delay time. However, after observing the 1, 2, 5, and 10 returns, they are all less than the average return of r = 17. This is because, although the average delay time does not exceed the upper delay limit, referring to Figure 8(c), the maximum delay time exceeds the limit (The dotted line is the upper limit of the delay time.). The corresponding maximum delay time is 130.18 s, 130.25 s, 130.26 s, and 130.72 s, respectively. Therefore, according to the formula (7) of GOER, when the delay time is over the limit, the difference will be used as a denominator and become a penalty factor. If the penalty factor is involved in return value, the return value will drop rapidly. The mean return value is only 375.82, which is 1.1% lower than the mean return value when r = 17, indicating that the GOER reflects the impact of exceeding the limit on the task assignment results better. At the same time, for the actual production situation, when the number of robots is 16, the unexpected overrun condition can cause an accumulation of delay time and a disturbance to the stability of the system.
The optimal return value table of 10 random robot sets when r = 17, r = 16.
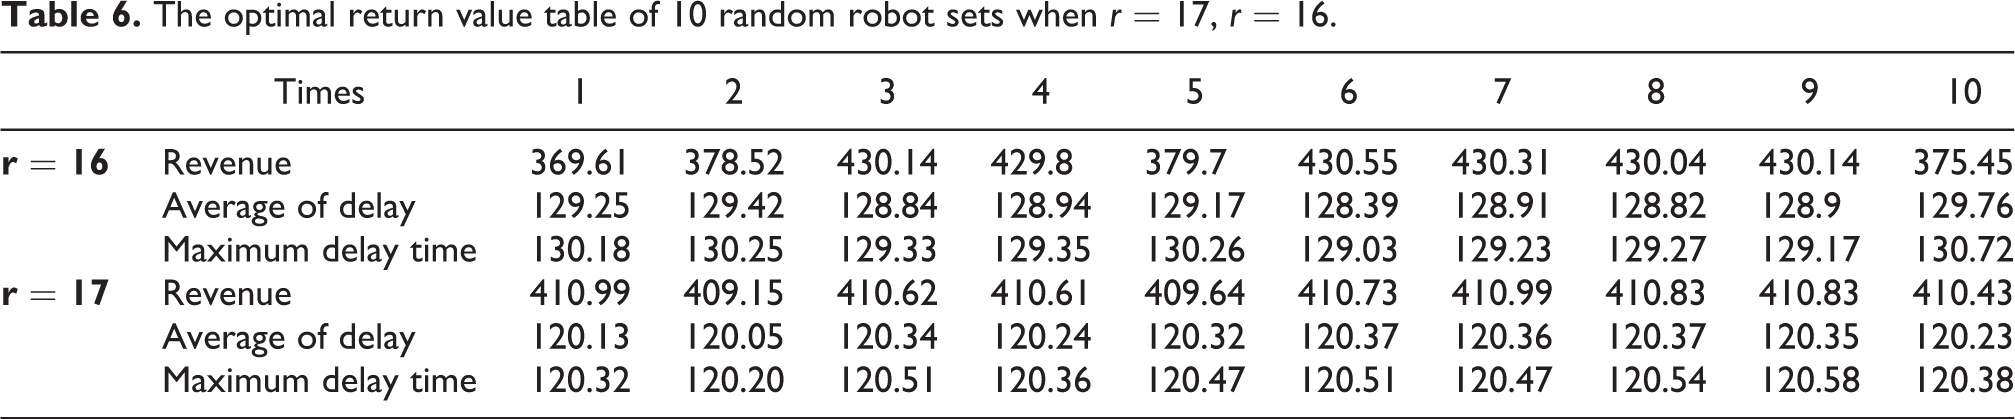
When the number of robots is 16, the delay time exceeds the limit. So we increased the number of robots to 17. When r = 17, the average maximum delay time in 10 optimizations is 120.37 s, and the maximum delay time is 120.54 s which occurrs in the 8th simulation, with no exceeding the maximum delay time of 130 s. The average return value is 408.23 with increases of 0.5%, compared to the number of robots 16. The result further proves the rationality of the income formula (7), which could be used to allocate over-limit tasks—correct profit evaluation.
To sum up, for the workshop tasks and robot hypotheses in this article, when the number of robots is 17, the optimal solution for task allocation under the GOER model can be obtained. It shows that the GOER model is a model that takes the benefit value and delay time as indicators under the constraints of limited space and limited task status.
The changes in the return value mention in increasing order show that except the return value depressions of 1, 2, 5, and 10, when r = 16, the other profit value increases as the number of robots decreases. This is because the robots work more efficiently. Meanwhile, the different robot numbers shows the variance of robot revenue is further reduced as the number of robots decreases. Because there is no stagnation in the robot’s work within a limited time, the difference in benefits is minimal.
Delay time analysis
Based on formula (4), the delay time of 10 random experiments was calculated as shown in Figure 8(a), (b), (c), (d), when the number of robots was 35, 18, 17, and 16. In Figure 8, the abscissa represents the frequency (dimensionless value) at which to wait for the response, the ordinate represents the delay time in seconds. The “frequency” means the times of experiments.

(a) Delay time of the robot multi-task response with 35 robots. (b) Delay time of the robot multi-task response with 18 robots. (c) Delay time of the robot multi-task response with 16 robots. (d) Delay time of the robot multi-task response with 17 robots.
We analyzed 10 numerical simulations of different number of robot sets and found the following characteristics. The maximum difference between the upper and lower value limits of the average delay time of a different number of robots is 2.6%. When the number of robots decreases to 35, the average delay time increases as the number of robots decreases.
As can be seen from Figure 8, when the waiting frequency is different, the delay time caused by any number of robots in the process of completing the task will fluctuate. Among them, when the number of robots is 35, the fluctuation times of the average delay time are the most obvious and the fluctuation times are the largest. With the reduction of the number of robots, the number and range of fluctuations decrease. When the number of robots is 17, the average delay time is relatively flat, and the amplitude and number of fluctuations are the least. When the number of robots is reduced to 16 again, compared with the number of robots is 17, the delay time has a larger fluctuation, and the amplitude and fluctuation times of the average time also increase slightly. When the number of robots is 17, we find that the delay time fluctuates within a small range, indicating that the current robot can perform the task stably, and the time required for the robot to complete the task can be guaranteed to be minimum. The robots are assigned tasks more reasonably. The above results show that the model in this article conforms to the actual application situation and can reasonably allocate the corresponding object multi-task under limited conditions.
Figure 9 shows the global optimal characteristic return value in 10 random experiments of different numbers of robots. The minimum difference between the upper and lower limits of the average revenue value of different numbers of robots is 7.5%. When the number of robots is 17, the revenue value is at least 9.5% higher than the other four digits. The minimum variance of the revenue value is reduced by 3%. As the number of robots decreases, the average return value gradually increases. We are able to prove the global optimal solution through each traversal of the GOER model due to each traversal of the optimal return value solution process. We regarded each traversal as a sub-traversal of the global optimal value. The global optimal value is obtained by repeated traversal.

Global optimal return value of different number of robots.
Analysis of robot situation distance
In the case of the same of object number and task type distribution, the difference in individual robot motion is caused by the different number of robots, which could verify the effectiveness of the allocation model. In this article, the whole road from the starting point to the target point is called the path, and the distance traveled by the mobile robot is called the path length. Figure 10 shows the path length of each mobile robot when the number of robots is 17 and 70, respectively. In Figure 10, the vertical axis path length represents the total path length generated by a single robot performing tasks. Figure 10(a) shows the length of paths taken by each of the 70 robots during the task execution. As we can see, the path length of 70 robots varies greatly. As shown in Figure 10, there is little difference in the length of paths taken by 17 robots. Comparing the subgraphs (a) and (b) in Figure 10, we found that as the number of robots decreases, the total path length increases. Based on the assumption in this article that the speed is 1.6 m/s, the difference of path distance in subgraph (b) is similar to the upper limit of delay time, and the difference of path distance between any two robots does not exceed the maximum delay time of corresponding distance (208 = 1.6 × 130), which indicates that in the experiment process, none of the robots exceeded the maximum delay time. A careful observation of subgraph (a) in Figure 10 shows that there is a significant difference in the movement distance of different robots in an execution time interval. This is because redundant robots only complete work once in an execution time interval. When r = 35, the task set does not change, so the robot with the first short path can perform two or even three tasks. Therefore, the path difference between individual robots is decreasing. Corresponding to the observation of subgraph (b), the difference in distance between robots is significantly reduced due to the optimization of the number of robots. This phenomenon is further reflected when the number of robots is 17 or 16, and the robot group executes multiple tasks. The phenomenon of path length change proves that the algorithm takes the path and electric power as one of the consumption parameters, which could better balance the dynamic change of robot electric power. This advantage is that the GOER could adjust the average consumption of multiple robots and avoid the overuse of a certain robot.

(a) The length of the path taken by each robot when the number of robots is 70. (b) The length of the path taken by each robot when the number of robots performing the task is 17.
Comparative experiment with different algorithms
To further verify the advancement of GOER infinite space optimization, we conducted comparative experiments with the classic Hungarian algorithm, auction algorithm, and game theory algorithm. First, under the same set of robots, we increased the number of tasks and compared their response time; second, we compared the number of robots required under the same number of tasks and the same time constraints. To ensure the objectivity and fairness of the algorithm comparison, all algorithms used the same numerical simulation computer environment: the operating system environment was Ubuntu Xenial (16.04 LTS), the numerical calculation used Pandas, the simulation environment was Robot Operation System, and the version number was Kinetic Kame and Gazebo 7.0 + Rviz.
Maximum response time
We took the optimal number of robots in section “Task distribution results and analysis” as an example. First, we chose r = 17 and set the number of tasks to 10–100. We only calculated the response time of robot multitasking. We ignored the movement process of the robot. That is, when the robot responded to a certain task, the robot immediately entered the next multi-task allocation link. When all tasks were allocated, we then compared the total response time of different algorithms.
The subgraph (a) in Figure 11 is the corresponding box diagram of the Hungarian algorithm. The Hungarian algorithm is a simple combinatorial allocation. Therefore, as the number of robots increases, the algorithm causes high computational overhead and low task allocation efficiency. Compared with other subgraphs, the total response time is the longest under a different number of tasks. The auction algorithm reduces the response time by 3% compared with the Hungarian algorithm. The sub-figures (b) and (c) correspond to the auction algorithm and game theory, respectively. The game theory algorithm has a better response time than the auction algorithm when the number of tasks is less than 100. At the same time, in the game theory algorithm, the response time increases linearly with the number of tasks. Sub-graph (d) corresponds to the maximum response time under a different number of tasks corresponding to this GOER model. The maximum response time of the proposed modeling method can be reduced by at least 1.6% compared with other algorithms. At the same time, the box plot diagram of response time corresponding to the number of tasks in each subgraph was analyzed. GOER has better stability, and the maximum deviation is reduced by at least 2.01% compared with other algorithms.

(a) Response time of Hungarian algorithm. (b) Response time of auction algorithm. (c) Response time of game theory. (d) Response time of GOER.
Figure 11 shows that the algorithm in this article has better convergence performance. The simpler model and the formulation of task priority weights can enable each task to be traversed by each robot. Through comparison, we used the profit value for task allocation and optimization, which could ensure the rapid speed of GOER as well as convergence. At the same time, we found that as the number of tasks increases, the superiority of this method decreases. At the same time, compared with other algorithms, GOER algorithm has a higher complexity, and the higher complexity is because the traversal optimization process of finite set is more sensitive to the change of the number of tasks, so GOER algorithm is not suitable for processing massive data. The computational resources that need to be consumed in the case of massive data are extremely high. For a limited set, such as the workshop environment simulated in the article, GOER model could improve reliability and reduce response time.
The number of robots required for the same task
When we used the same method in subsection “Maximum response time” on different tasks, the minimum number of robots needed and the necessary data settings are the same as in subsection “Experimental setup and data initialization”. The results are shown in Table 7. The GOER model needs 3% fewer robots completing the same number of tasks than the other four algorithms. As the number of robots increases, the advantages of the model are getting smaller and smaller. This is because the model is under the condition of priority task constraints. First, all robots need to traverse all the tasks to obtain the global optimal value. In this way, the smallest robot could complete the most tasks, avoiding robots’ waiting. Besides, the variance and error rate of this model are 1.1% and 2% less than the other three methods, respectively. The Hungarian algorithm allocates through combination and arranges and combines according to the actual number of robots and the number of tasks. Hence, the number of robots used is the largest. Auction algorithms and game theory both consider the maximum number of robots used to a certain extent. Still, due to the low model efficiency and poor global optimality, robots will wait. Therefore, in the case of completing the same task, the model
Total distance to perform tasks
In the experiment, under the same number of tasks, the number of robots is the minimum number of robots corresponding to each algorithm in Table 7. When the number of tasks is 10, the number of robots using Hungarian, auction and game algorithm is 3, and the number of robots using GOER algorithm is 2. As can be seen from Table 8, the total distance of GOER model is 12.3% smaller than that of the other three algorithms. However, with the increase of the number of robots, the advantages of GOER model are not obvious compared with the other four methods. When the number of robots is 100, the total distance of the model in this article is reduced by at least 9.8% compared with the total distance of the other three methods.
The maximum number of robots used to complete the same task.

Average maximum driving distance of robot.

This is because the article adopts the Manhattan distance to calculate the tasks and the distance between the robot, in addition this article puts the distance between the robot and tasks as part of the largest profit, when get the global optimal value takes into consideration the distance of driving robot to perform tasks, set up the task priority, consider whether the robot power to meet the requirements of the mission. The distance is considered before the task assignment, so the total distance of the task in this article is the minimum. Hungarian algorithm combination, auction algorithm bidding campaign, and Nash equilibrium in game theory do not take distance as the primary factor, and they all use Euclidean distance, so the maximum driving distance of the robot in this article is the minimum.
For using the Manhattan distance to calculate the distance between tasks and robots, in addition this article put the distance between the robot and tasks as part of the largest profit, when get the global optimal value takes into consideration the distance of driving robot to perform tasks, set up the task priority, consider whether the robot power to meet the requirements of the mission. The distance is considered before the task assignment, so the total distance of the task in this article is the minimum. Hungarian algorithm combination, auction algorithm bidding campaign, and Nash equilibrium in game theory do not take distance as the primary factor, and they all use Euclidean distance, so the maximum driving distance of the robot in this article is the minimum.
Maximum reVENUE value
As can be seen from Figure 12, after the profitability becomes stable, we compare the four methods and find that GOER has the largest profitability of 650, followed by Auction method with a profitability of 623, Game method with a profitability of 618, and Hungarian method with the lowest profit ability. Which value is 598. Therefore, compared with the other three scenarios, the GOER model has the most massive global return value and the fastest convergence speed. The revenue value is one of the important parameters of the experiment. Therefore, the revenue value reflects the feasibility of the four methods in the textile production workshop. The revenue value is the largest and represents the maximum utilization efficiency of the robot.

Comparison of task revenue status.
Analysis of experimental results
In terms of the maximum response time, compared with other algorithms, the GOER algorithm proposed in this article can shorten the maximum response time by at least 1.6% and reduce the maximum deviation by at least 2.01%, which is more stable than other algorithms. In the case of the same number of target tasks, the GOER algorithm needs fewer robots to complete the target task, which means that the robot is more efficient in use. The maximum return of GOER algorithm is 12% higher than that of other algorithms on average, which indicates the high return of GOER algorithm. This article compares the GOER algorithm with the other three algorithms in terms of the maximum response time, the minimum number of robots, and the maximum profit value, and all the results show that the GOER algorithm is superior to the other algorithms, which proves the superiority of the GOER algorithm.
Conclusion
In this article, a profit global optimal evaluation model of multi-objective, multi-task, multi-robot is proposed. This model is able to traverse all tasks and obtain a global optimal profit value for task allocation. The GOER has a good real-time executive, general applicability, optimality and high efficiency. First, the goal set and task set are defined. Second, the multi-task and robot revenue model is developed. Last, the multi-task and multi-robot global revenue model is defined. To verify the effectiveness and scalability of this model, we first used the GOER model to conduct ROS simulation experiments. Then we compared the GOER model with the Hungarian algorithm, auction algorithm, and game theory. We utilized four indicators to compare: maximum response time, total distance to perform tasks, number of robots used for the same task, and maximum profit value. Three indicators of the GOER model are better than the other three algorithms.
This article is a phased work summary of our research. In practical applications, there are many deficiencies. First of all, the workload changed randomly. For example, in an infinite unknown environment, tasks changed dynamically with time. So the ability of dynamic response needs further verification. Moreover, we limited the current response experiments to single-digit robots and a small number of tasks. There was no useful analysis and evaluation of the impact on the GOER for the communication problems caused by the increase of hardware equipment.
Footnotes
Declaration of conflicting interests
The author(s) declared no potential conflicts of interest with respect to the research, authorship, and/or publication of this article.
Funding
The author(s) disclosed receipt of the following financial support for the research, authorship, and/or publication of this article: This work was supported by the National Natural Science Foundation of China (No. 61971339 and No. 51905405); Shaanxi Natural Science basic research project (No. 2019JM567 and No. 2019JQ855); China Textile Industry Federation science and technology guidance project (No. 2018094); Training Program for University Students’ Innovation and Entrepreneurship (No. S202110709142).