
Abstract
The main purpose of this article is to study the detection of transparent film on the surface of tobacco packs. Tobacco production line needs an industrial robot to remove the transparent film in the process of unpacking. Therefore, after the industrial robot removes the transparent film, it is necessary to use machine vision technology to determine whether there is transparent film residue on the surface of tobacco packaging. In this article, based on the study of the optical features of semitransparent objects, an algorithm for detecting the residue of transparent film in tobacco packs based on surface features is proposed. According to the difference of surface features between tobacco and film, a probability distribution model considering highlights, saturation, and texture density is designed. Because the probability distribution model integrates many features of tobacco and film, it is more reasonable to distinguish the tobacco film regions. In this article, an appropriate foreground box with a trapezoidal mask and image segmentation algorithm GrabCut is used to segment the foreground area of tobacco pack more accurately, and the possible film area is obtained by image differential and morphological processing. Finally, on the basis of comparing the effect of various machine learning algorithms on the image classification of possible film regions, support vector machine based on color features is used to judge the possible film region. Application results of the system show that the method proposed in this article can effectively detect whether there is film residue on the surface of tobacco pack.
Keywords
Introduction
With the rise of Industry 4.0, smart factory has become a hot term in today’s industry. More and more traditional manufacturing enterprises are beginning to explore smart factory. 1 –3 The development of smart factory has become the guarantee of high quality and healthy development of the tobacco industry. Machine vision technology can be used to replace manpower in many processes of tobacco production line, thereby improving the production efficiency and intelligence of the tobacco industry. During the unpacking process of the tobacco packs on the tobacco production line, the film on the surface of the tobacco packs may fail to be removed. At present, enterprises mainly use manual monitoring. This article uses machine vision technology to solve the detection problem and improve the level of enterprise automation.
Nowadays, the application of machine vision technology is more and more widely, which shows its value in many aspects, such as video surveillance, engineering applications, and so on. Rivera-Castillo et al. used a camera and an optical scanning system to generate high resolution and quality images for 2D imaging and obtained 3D accuracy range data by photoelectric sensor signal. The system can be used to support expert users to analyze the structure of buildings and use the extracting spatial coordinate information from light emitters mounted over a structure as an indicator to evaluate any structural displacement. 4 Huang et al. proposed a new dynamic compensation robotic scheme for high-speed vision system, which solved the real-time adaptation problem of multijoint industrial robot to uncertainty in a flexible manufacturing system. 5 Flores-Fuentes et al. designed a machine vision system based on a customized particle image velocimetry to acquire the velocity field present in a fluid. 6
In the field of machine vision, object detection and recognition technologies are developing rapidly, and technologies such as pedestrian detection and vehicle detection are becoming more and more mature. 7 –9 However, there are few research on the visual detection of semitransparent objects such as transparent films, and the problem of semitransparent object detection in actual scenes has not been solved. Because of the unique optical features of semitransparent objects, it is difficult to detect them visually. 10,11 According to the special effect of semitransparent object on light and its weakening on background, this article designs an algorithm based on three optical features of highlight, saturation, and texture density to detect transparent film.
The research on transparency can be traced back to the last century. Metelli proposed that the theory of perceived transparency is usually developed in the background of a physical model that produces transparent perception. Metelli’s transparency model is mainly that a disk with reflectance e and an open sector of relative area α is rotated rapidly in front of a bipartite background with reflectances a and b. When this rotation is sufficiently fast, it leads to the percept of a transparent surface overlying the bipartite background. This generates reflectances p and q in the region of perceived overlay. Transparency is predicted through two qualitative constraints: one is polarity constraint (1) and the other is magnitude constraint (2), as shown in Figure 1. Perceived transparency is the phenomenon of seeing one surface from behind another surface 12


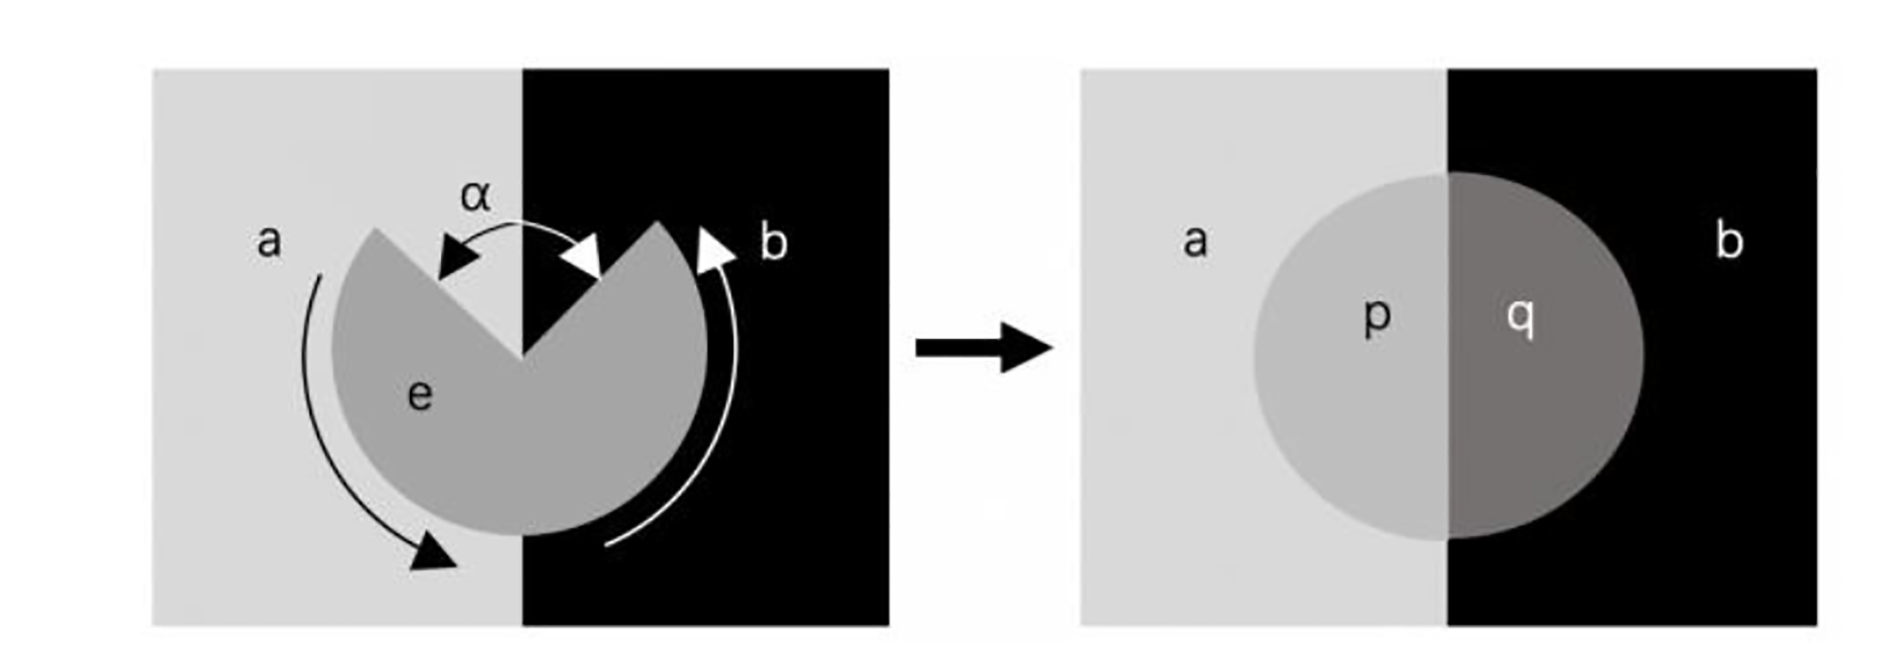
Metelli’s transparency model.
In 2003, Osadchy et al. used the specular highlight as a positive clue to identify luminous objects and proposed a simple and qualitative reflection model, which can effectively determine the consistency of the known 3D structure in the image and the possible specular reflection. It is proved that this method can be used to identify objects without Lambertian reflectivity. 13 However, this detection method has a relatively large limitation, that is, it requires an environment with a bright light source.
There is relatively little research work on the detection of transparent objects in actual scenes. By 2005, McHenry of the University of Illinois at Urbana-Champaign proposed some features of semitransparent objects, such as color similarity, blur, overlap consistency, texture distortion, and highlight. The method, which he proposed, uses the Canny edge detector to determine edge information to capture relevant clues across transparent objects and uses the features of semitransparent objects to effectively distinguish semitransparent objects in actual scenes, 14 but this method is only suitable for relatively concise scene and is impossible to estimate the pose. In the next year, McHenry proposed a region-based segmentation method to divide the area into transparent or not, and provided two measures (discrepancy measure and affinity measure). The discrepancy measure is used to indicate how close the area looks like other glass-covered areas, and the affinity measure can indicate whether the area belongs to the same material. This algorithm can be used to detect objects made of transparent materials (such as glass). 15
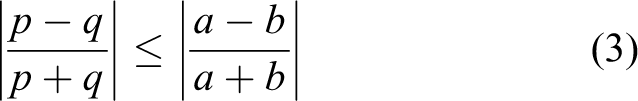
Singh and Anderson found that magnitude constraints alone were not sufficient to predict transparency. The conversion between transparency and nontransparency is mainly estimated based on Michelson contrast (3) 16
In 2011, Phillips of the University of Pennsylvania proposed a new idea that uses inverse perspective mapping to detect semitransparent objects. This method needs to capture multiple views and assume that the object is on a plane. However, the maximum error of attitude estimation is about 10.4 mm, and there is still much room for improvement in this aspect. 17
In addition to using optical features to detect semitransparent objects, there are some studies that use depth information to detect semitransparent objects. In 2013, Lysenkov et al. used Kinect to detect transparent objects by treating invalid depth information (shown as black areas in the depth image) as transparent objects and proposed an algorithm for calculating the pose of transparent objects. This method is suitable for manipulator grasping systems in the home environment. 18 He improved their algorithm in a paper proposed in 2015 so that the algorithm can deal overlapping instances and cluttered environment. 19
In recent years, with the rapid development of deep learning, the use of deep learning technology can greatly improve the detection accuracy compared with traditional algorithms in the field of target detection. Therefore, in the field of semitransparent object detection in recent years, more and more scholars tend to use deep learning models.
Xu et al. of Kyushu University in Japan proposed an algorithm for transparent object segmentation TransCut 20 in 2015. This algorithm does not rely on the color information of the foreground and background but uses LF linearity and occlusion detector in the 4D lightfield space to describe a transparent object. In 2018, the TOM-Net 21 deep learning framework proposed by Guanying Chen of the University of Hong Kong regarded the problem of transparent matting as an estimation problem of refractive flow. The TOM-Net framework consists of two parts: a multiscale encoder–decoder network for producing a coarse prediction and a residual network used for refinement. Madessa et al. used an advanced instance segmentation method mask region-based convolutional neural networks with higher robustness to detect transparent materials. 22 This method significantly improves the detection performance of transparent materials, and the binary mask of the detection result provides pixel-level information to improve the understanding and analysis of transparency. Xie et al. proposed a novel boundary-aware segmentation method TransLab 23 in 2020, which exploits boundary as the clue to improve segmentation of transparent objects. Its network architecture consists of two parallel stream: regular stream and boundary stream. The regular stream is used for transparent object segmentation, and boundary stream is used for boundary prediction to achieve the purpose of accurate segmentation of transparent objects. In addition, the author also proposed a large-scale database Trans10K for transparent object segmentation.
At present, the mainstream semitransparent object detection methods are mainly completed by depth camera or deep learning model, and there are few studies on judging whether there is a semitransparent object in the image collected by a RGB camera.
In this article, we study a transparent film visual detection algorithm to determine whether there are any film residues on the surface of the tobacco pack after the industrial robot has grasped it. In addition, we successfully applied the visual guided robot system using this detection algorithm to the tobacco production line.
Analysis of film removal process and system composition
In the tobacco production line, tobacco packs are wrapped with transparent film on six sides after being taken out of the tobacco box. Therefore, the transparent film on the surface of the tobacco pack needs to be removed before tobacco processing. This task is mainly completed through the film removal process of the tobacco production line, Figure 2 shows the position relationship of each station in the film removal process. In addition, when the tobacco pack enters the film removal process, the bottom surface is up.

Top view showing the position relationship of each station in the film removal process.
The first step of the film removal process is to cut the film horizontally around the side of the tobacco pack at the mechanical cutting station to divide the film into upper and lower parts to facilitate subsequent industrial robots to remove the film. As shown in Figure 3(a), the tobacco pack after the mechanical cutting process is placed in the bottom film removal station, where the bottom film is removed by KUKA industrial robot. After the bottom film removal process is completed, the tobacco pack is transported from the bottom film removal station to the tobacco pack turnover station through the conveyor. The turnover station turns the tobacco pack 180° around the central axis of the rotating device, which is convenient for the removal of the other half of transparent film. After the turnover is completed, the tobacco pack is transported to the multisurface film removal station through the conveyor at the other end of the turnover station, where the remaining film is removed. Industrial robots work in the bottom and multisurface film removal stations in turn to remove six films from each tobacco pack.

Position distribution of film removal process and industrial cameras. (a) Three main positions in film removal process and (b) installation position of industrial cameras.
The above process is the whole film removal process, but because the film is close to the surface of the tobacco pack, it is not easy to grasp and absorb, so there may be a failure in the process of removing the film. At present, during the removal of the film, the naked eye is always used to observe and judge whether the removal fails.
According to the above problems, we use machine vision technology to solve the problem, as shown in Figure 3(b). We install camera 1 above the bottom film removal station to judge whether there is residual film after the bottom film is removed. Cameras 2 and 3 are installed on the upright columns on the diagonal sides of the multisurface film removal station to collect the images of the remaining five surfaces of the tobacco pack after the residual film is removed. Each camera collects the top surface and two sides. To reduce the influence of ambient light as much as possible and improve the imaging quality, projection light sources are installed on the upright columns, where the camera is installed. Both the camera and the light source adopt the trigger mode. After the industrial robot complete the film removal work on any station, the camera and the light source on the corresponding station send the trigger signal through PLC to collect the image. In the multisurface film removal station, two pairs of camera light sources trigger the acquisition at the same time, so as to obtain the image of five sides of the tobacco pack at the same time. The collected image is transmitted to the workstation through Ethernet for image processing to get the result of whether there is residual on the surface of the tobacco pack. The system processes the collected images one after another. Figure 4 shows the latest images collected by three cameras at a certain time.

Images collected by three cameras. (a) Bottom image; (b, c) multisurface image.
Next, the specific configurations of the visual guided robot system for transparent film of tobacco pack are introduced. The three industrial cameras used in the image acquisition module are all HIKVISION CMOS Gigabit Ethernet industrial area scan cameras, the model is MV-CA060-10GC, and the pixel resolution is 3072 × 2048. The model of the industrial robot used in the film removal process is KUKA KR150-2 2000, as shown in Figure 5(a). The algorithm proposed in this article is implemented by C++. The algorithm runs on HP Z4 G4 workstation, as shown in Figure 5(b), with CPU of Intel Xeon W-2123, RAM of 16 GB, and NVIDIA Quadro P400 graphics card. The system stores the collected images and related information into SQL Server database and conducts human–computer interaction through the Web, as shown in Figure 5(c).

Part of the system configurations. (a) KUKA industrial robot, (b) HP Z4 G4 workstation, and (c) web human–computer interface.
Feature probability distribution model
In this section, we use the optical features of tobacco and transparent film to propose a feature probability distribution model based on HSV color space to divide the area of tobacco and film, thereby providing a basis for judging whether the film is completely removed. The images collected by the three cameras can be detected by the same algorithm principle, so, in this article, we take the image collected by the camera installed in the bottom film removal station as an example.
Optical features of semitransparent objects
The naked eye can clearly determine whether an object is a semitransparent object because a semitransparent object has some unique optical features. This semitransparent object detection algorithm mainly uses the following optical features of semitransparent objects: Under the illumination of the light source, some highlights will appear through the direct reflection on the surface of the semitransparent object.
24
Due to the uneven surface of the transparent film, there may be a lot of highlights, and the information of these highlights can help determine its existence. The reflectivity of semitransparent objects will significantly weaken the color and saturation of the background.
25
For some textured backgrounds, semitransparent objects can strongly weaken the gradient and texture density of the background. Due to the existence of semitransparent objects, the texture density of the semitransparent object area and the background area will be different.
In addition, the tobacco surface itself has a high color saturation, so this algorithm takes the HSV color space channel images as the input to design. HSV color space is a kind of color space created according to the intuitive characteristics of color. In this model, color parameters mainly include hue (H), saturation (S), and value (V).
Highlight feature probability distribution model
Considering that the transparent film will have many highlights under the illumination of the light source, we design the highlight feature probability distribution model to define the area near the highlights as the film area with high probability. By observing the images of each channel of the collected images in the HSV color space, we find that the tobacco area that is not covered by the film has a higher value in the saturation channel but has a lower value in the value channel map relative to the film area. Therefore, we use the differential image of the value and saturation channel map as the input of the highlight feature probability distribution model, so that the distinction between tobacco and film area is greater. The differential image is shown in Figure 6(a).
Calculation process of highlight feature probability distribution model. (a) The differential image of the value and saturation channel map; (b) binary image obtained after global threshold processing; and (c) the highlight feature probability distribution map.
According to the difference image, we adopt global threshold processing to segment the highlight area, as shown in Figure 6(b). The closer the area to the highlight is, the more likely it is the specular reflection of transparent film due to unevenness. It is likely that the surrounding of these highlights is also a film, but after diffuse reflection, there is no highlight. Therefore, based on the idea of Markov random field, 26 we design a convolution kernel for convolution operation to calculate the probability distribution map of the film due to the highlight feature. The convolution kernel is shown in formula (4), and the size of the convolution kernel is the best value according to the experiment. After convolution and blur processing, the probability distribution map of highlight features is obtained, as shown in Figure 6(c). The smaller the value of the pixel in the image, the greater the possibility that the area belongs to the film area

where x and y, respectively, represent the horizontal and vertical coordinates of the pixel, m and n, respectively, represent the horizontal and vertical coordinates of the center of the convolution kernel, and the constant c takes the best value of the experiment.
Saturation feature probability distribution model
Combining the apparent features of tobacco and transparent film, we found that the color saturation of tobacco is relatively high, and the saturation of the tobacco area covered by the transparent film is weakened. On this basis, we design the saturation feature probability distribution model to obtain the saturation probability distribution map.
Perform mean filtering on the saturation channel to smooth the saturation of each area to obtain the image shown in Figure 8(a), and calculate the histogram of the saturation channel. By observing a large number of smooth images of saturation channel, we find that there are usually more than two peaks in the image covered by partial film, and the maximum value of the peaks is the value corresponding to the tobacco area. Images without transparent film coverage and fully covered images often have only one peak, and the value of this peak will be different. The value of the peak of an image without transparent film coverage will be relatively larger. Based on the above analysis of the saturation channel histogram, we use the idea of Gaussian distribution to enhance the image of the saturation channel to expand the contrast between the tobacco and film areas. In the case of multiple peaks, the actual image is as shown in Figure 7(a), the tobacco area is partially covered by film. We take the maximum value of the peaks as the processing threshold of the saturation feature probability distribution model. The pixels larger than the threshold are tobacco areas not covered by transparent film, and the areas smaller than the threshold are weakened by a processing function similar to Gaussian distribution, as shown in formula (5). In the case of a single peak, the actual image is shown in Figure 7(b) and (c), and the situation can be judged by comparing the size of the peak


Histogram analysis of different film coverage cases: (a–c) Camera outputs with different levels of film coverage. (d–f) Corresponding saturation channel histograms.

Calculation process of saturation feature probability distribution model. (a) Image after mean filtering of saturation channel map;(b) Saturation feature probability distribution map.
Here, C can be calculated by formula (6), s represents the saturation value of the image pixel to be processed, and p represents the maximum saturation of the saturation channel histogram peak

where p and v, respectively, represent the maximum and the second-largest value of the peak saturation in the saturation channel histogram, and t is a constant, which is the best value in the experiment.
According to the model calculation, the pixels that are slightly less than the threshold are weakened slightly, and the pixels that are obviously less than the threshold are weakened greatly. The pixels that are greater than the threshold are directly set to 1, and the probability distribution map of saturation characteristics is obtained, as shown in Figure 8(b).
Texture density feature probability distribution model
In this scene, the texture density of tobacco leaf on the surface of tobacco pack is high, and the coverage of the film weakens the texture density. Therefore, designing the texture density feature probability model to calculate the probability distribution map of the film and tobacco under the texture density feature is obviously helpful for dividing the tobacco and film area.
We performed edge detection on the value channel map of the HSV color space to highlight the texture density of the surface, as shown in Figure 9(a). It can be clearly seen that the texture density of the area covered by the film is obviously smaller than that of the tobacco area.

Calculation process of texture density feature probability distribution model. (a) Gradient map after Canny edge detection of value channel and (b) texture density feature probability distribution map.
To obtain a more accurate texture density feature probability distribution map, we perform convolution processing on the gradient map. The convolution kernel is calculated by formula (7), where the convolution kernel is circular. Then, the texture density feature probability distribution map is obtained after image enhancement, as shown in Figure 9(b). It can be seen that the probability value of the tobacco area is higher than that of the area covered by the film

where r is the diameter of the convolution kernel we use.
Joint probability model of apparent feature
By calculating the above three feature probability distribution models, we have obtained the probability distribution maps under the highlight feature, saturation feature, and texture density feature, respectively. It can be seen that tobacco and film have a relatively large difference of distinction under these features. To improve the accuracy and robustness of the detection algorithm, we fuse the three feature probability distribution maps to obtain the joint probability distribution map, as shown in Figure 10(a).

Calculation process of joint probability distribution model. (a) Joint probability distribution map obtained by fusing feature probability distribution model of highlight, saturation, and texture density; (b) binary graph obtained by global thresholding.
According to the experimental analysis, we use the best global threshold to binarize the joint probability distribution map, and the processing function is shown in formula (8), so as to divide the tobacco region, as shown in Figure 10(b)

where
Film decision-making
In the third section, we realized the division of tobacco and film areas through the feature probability distribution model based on HSV color space. However, to determine whether there are film residues on the surface of the tobacco pack, further processing is required. In this section, we analyze the applicability of different image segmentation algorithms to this scene, and finally, use GrabCut 27 to extract the surface of the tobacco pack from the background and make image difference with the tobacco area map calculated by the feature probability distribution model and make a second judgment for the residual situation in the differential image to determine whether the area is a film or other misjudgment. The overall process is shown in Figure 11.
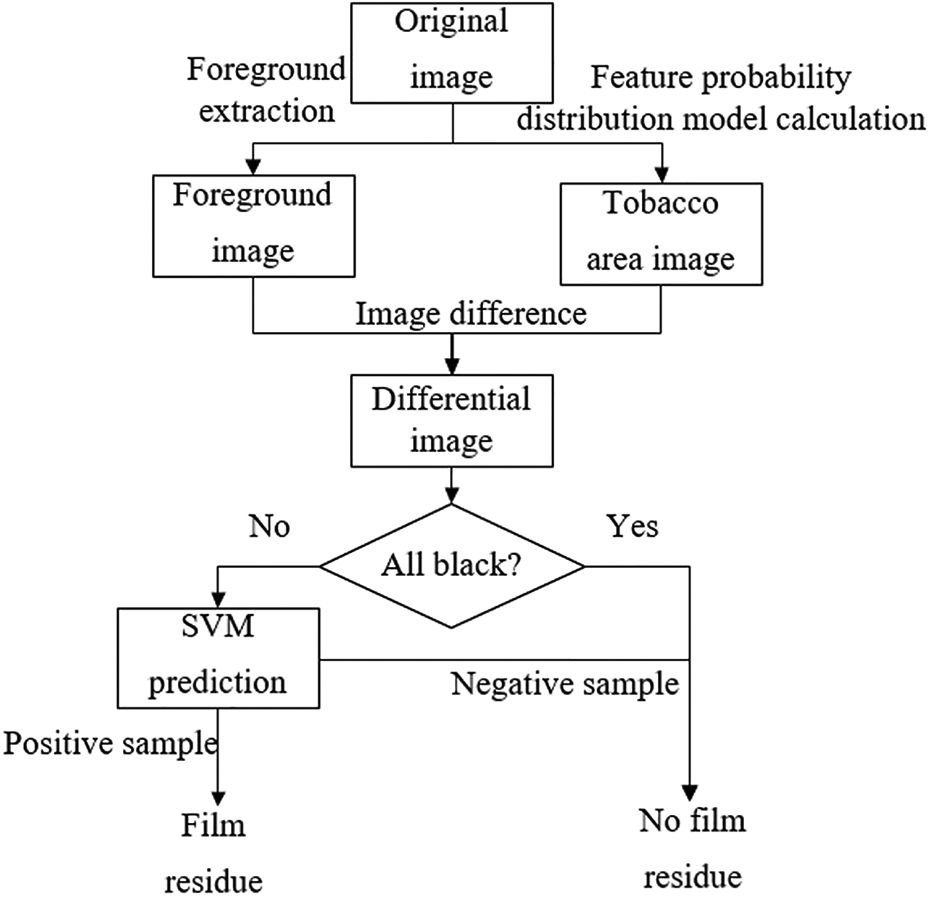
The overall process chart of the film detection algorithm.
Foreground extraction of tobacco pack
The GrabCut algorithm is a segmentation algorithm based on graph theory. Using the texture information and boundary information in the image and a small amount of user interaction, a good segmentation effect can be obtained.
The GrabCut 28 function in the OpenCV library implements the algorithm, so we directly use this function in the transparent film detection algorithm. This function requires some prior conditions by setting some pixels in advance as possible foreground areas, the remaining pixels in the image are regarded as the background, and then, the foreground area can be segmented through the calculation of the GrabCut function.
A situation in which the transparent film of the tobacco pack is not completely removed on the tobacco production line, as shown in Figure 12(a). When the number of iterations of GrabCut is 1, if the rectangular area shown by the red rectangle in Figure 12(b) is used as a possible foreground input, the calculation of GrabCut is likely to lead to inaccurate foreground extraction. As shown in Figure 12(c), the conveyor bracket for placing tobacco packs is also extracted as the foreground.

GrabCut segmentation process. (a, d) Original image, (b) using a rectangular foreground frame, (c) the segmentation result using a rectangular foreground frame, (e) using a trapezoidal foreground frame, and (f) the segmentation result using a trapezoidal foreground frame.
Because the position of the tobacco pack will change slightly, to minimize the influence of the background on the foreground extraction of the tobacco pack, we use the red trapezoidal area in Figure 12(e) as the possible foreground area. The foreground area extracted after the calculation of GrabCut is shown in Figure 12(f), different from Figure 12(c), the foreground removes the interference of the conveyor bracket and extracts the surface of the tobacco pack more accurately, which is convenient for subsequent decision-making.
In the case of using a trapezoidal mask as a possible foreground area, we tried to observe the accuracy of foreground segmentation using different iteration times for the GrabCut function. GroundTruth is our artificial decision, which means we think the best prospect area. The data in Table 1 present the intersection over union (IoU) and function processing time under different residual situation of tobacco packs and GrabCut iteration times.
The IoU and processing time of GrabCut in different residual situations.

IoU: intersection over union.
According to the experimental results, we can judge that the number of iterations of GrabCut function has no significant influence on the segmentation accuracy in the case of no film residue. In the case of film residue, the more iterations, the more deviation from our optimal segmentation region. The increase in the number of iterations will also significantly increase the function processing time. Therefore, one iteration is used here to extract the foreground of the tobacco pack.
Determination of possible film coverage area
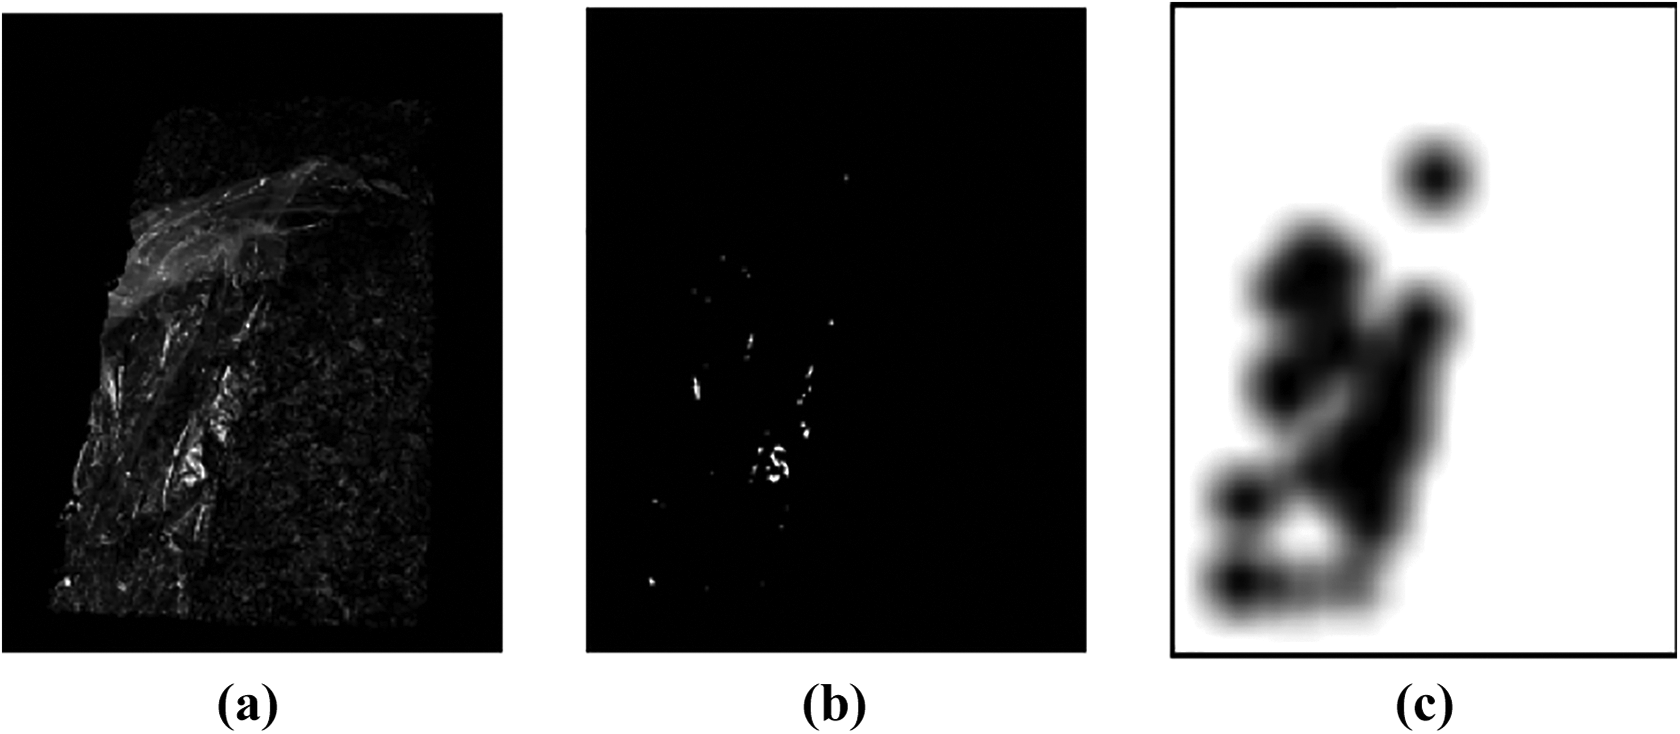
In the previous section, we segmented the foreground area of the tobacco pack, which represents the area where we need to detect whether there is a film residue. In the third section, we divided the tobacco area. Since we used the convolution operation in the design of the feature probability distribution model, the divided tobacco area will be slightly smaller than the foreground area of the tobacco pack. We perform linear processing on the foreground area and tobacco area of the tobacco pack, and remove some narrow edges due to the convolution operation through the morphological opening operation to obtain the possible film area, as shown in Figure 13(d) and (h). If the resulting image is a completely black image, it can be directly determined that there is no film residue, otherwise, follow-up processing is performed.

Pictures of residual film detection process of two tobacco packs. (a, e) Original image; (b, f) the foreground image of the tobacco pack; (c, g) the result image of the tobacco division; (d, h) the possible film area image.
Through the image segmentation in the previous section, we have obtained the area that may be films. However, due to the complexity of the actual scene, this area is not necessarily a film, it may be a misjudgment of the feature probability distribution model calculation algorithm. For example, in the process of dividing the tobacco and film areas, some areas may be misjudged as film areas due to the high reflectivity of the background and part of the tobacco leaves or the different surface texture densities. Therefore, it is quite necessary to judge whether this area is transparent film in this section.
Through the observation of the nonblack images, most of the images are normal film residual images, and some situations of nonfilms are mainly misjudged tobacco and background, as shown in Figure 14.

Misjudged images caused by (a) strong reflections of tobacco leaves, (b) low density of tobacco surface texture, and (c) strong reflections of the background.
The output images that are not fully black after processing by designed algorithm are further established as a data set. The images, where the nonblack parts are films, are positive samples, and the other images are negative samples. There are a total of 657 data sets, including 183 positive samples and 474 negative samples.
The machine learning algorithms used to solve the two classifications including support vector machine (SVM), logistic regression model, backpropagation (BP) neural network, and so on. Here, these three types of machine learning are trained and tested on this data set, and the training set and test set use a ratio of 3:2. The test results are given in Table 2. It can be seen from the experimental results that SVM and BP neural network algorithms can achieve very good results on this data set. In this article, SVM is finally selected for classification.
The average accuracy of the three machine learning algorithms tested on the data set.
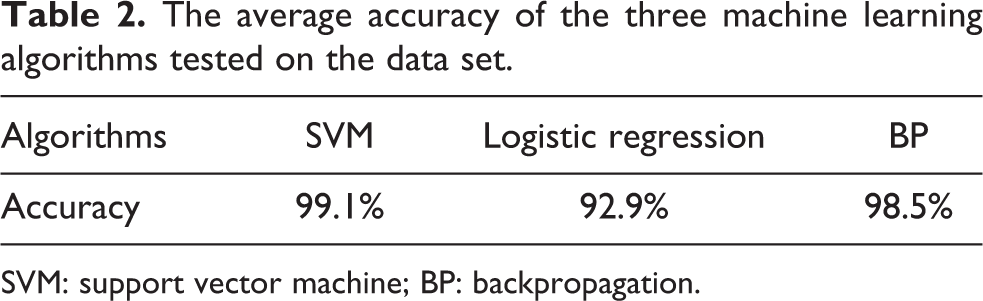
SVM: support vector machine; BP: backpropagation.
After fully comparing the difference between positive and negative samples, it is found that positive and negative samples are more distinguishable in color features, especially in the red channel of RGB color space. In addition, the residual area of negative samples is often smaller, and there are fewer highlight points. Therefore, we select the mean µ, standard deviation σ, skewness Skew, kurtosis Kurt under the red channel, residual area A and highlight ratio rat in the gray image as six-dimensional feature vectors for SVM training and prediction. The calculation formulas (9) to (14) of each feature are shown below


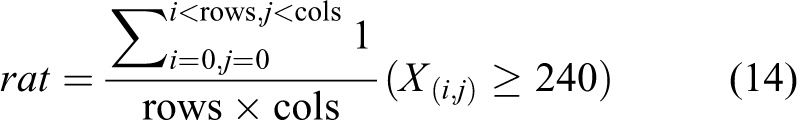
where N in formulas (9) and (10) represent the number of pixels in the whole image, rows, cols in formulas (13) and (14) represent the total number of rows and columns of the image, and i, j represent the ordinate and abscissa of the currently processed pixels, respectively. xi , X, and X (i, j) represent the corresponding values of each pixel in the image.
Experiments
In this section, to verify the effectiveness of the visual guided robot system and the accuracy of the detection algorithm, we apply the system to the tobacco production line film removal process for experimental analysis. There are mainly two experiments. One is the real-time detection of the images collected by PLC hardware trigger during the operation of the system to get the results of whether there is any film residue, so as to determine the stability of the system and the accuracy of the algorithm, the other is to randomly extract eight images of partial film residues. We determine the actual film region GroundTruth in these images and calculate the IoU with the detection results of the algorithm to determine the segmentation precision of the algorithm.The system runs in the tobacco production line for several days, and the results of each image are automatically obtained through the detection algorithm. To test the accuracy of the algorithm, we take the result of manual detection of each image as GroundTruth. By comparing the algorithm detection results with the manual detection results, we can get the number of correct and incorrect detections of the algorithm. A total of 10,335 images were collected, including 3445 bottom images and 6890 multisurface images. Table 3 lists the classification results of these 10,335 images; for the bottom image, the accuracy is 98.35% and for the multisurface images, the accuracy is 98.58%. In addition, the average time of a single case is 550 ms, and we find that the main time consuming is the GrabCut algorithm. After the previous acquisition is completed, it will take at least 30 s for the next acquisition, so this time consuming does not affect the normal production.
Classification results.

In addition, we randomly selected eight images of partial film residues from the collected images, labeled the film area of each image artificially, tested our algorithm on these images, and then calculated the intersection ratio IoU between the segmented film area and the artificially labeled film area. Table 4 presents the segmentation results of the algorithm on these eight images. According to the experimental results, our proposed algorithm shows good results in transparent film segmentation, and the detection time is short.
Test results of the algorithm on partial film residual images.
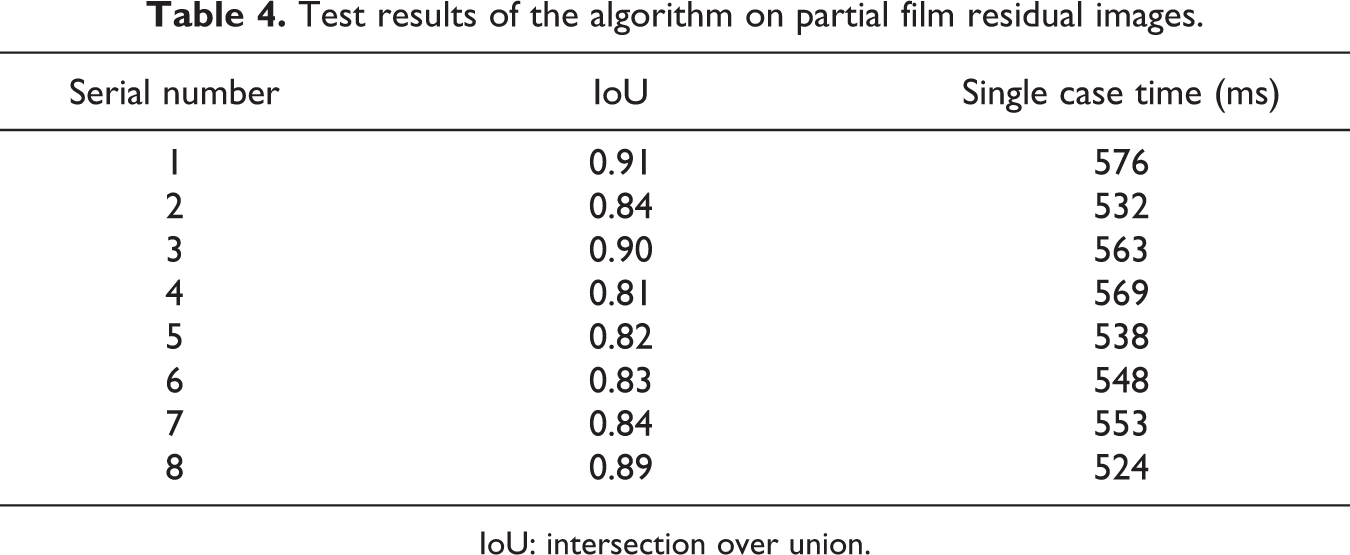
IoU: intersection over union.
After experimental analysis, it can be detected correctly in most cases, and a few images with incorrect detection are mainly due to some special circumstances. The incorrect bottom detection images are mainly the film covering the edge of the tobacco pack surface, as shown in Figure 15(a). In this case, it is not easy for the algorithm to determine whether these films cover the surface of the tobacco pack. The incorrect multisurface image is mainly because the film falls on the side of the multisurface station tobacco pack, and the camera on one side can only capture a small part of the film, as shown in Figure 15(b), there are also cases where the film mainly falls on the conveyor and covers the edge of the tobacco pack, as shown in Figure 15(c).

(a–c) Some examples of incorrect detection.
Conclusion
In this article, we propose a visual detection algorithm for tobacco packaging film based on apparent features. The algorithm is designed based on the difference between the optical features of tobacco and film and divides the tobacco and film regions by fusing the three feature probability distribution models of highlight, saturation, and texture density. In addition, this article uses the GrabCut algorithm to extract the foreground of the tobacco pack and conducts a secondary judgment on the difference image after the linear operation of the foreground image and the tobacco area image calculated by the feature probability distribution model. Based on the experimental analysis of the classification effect of various two-classification algorithms in this scene, SVM is selected to determine whether the possible film coverage area is a film or something else, and realizes the detection of the film residue on the surface of the tobacco pack. Finally, we run the system in the tobacco production line, and the accuracy of the system is about 98.5% on 10,335 images collected by the production line, which verifies the effectiveness of the system and the detection algorithm.
In the future, we will do further research from many aspects, one is to solve the problem of film falling in a variety of adverse places for production, the other is to improve the adaptability of the algorithm to the changes of production environment for the tobacco production line, and the third is to try to improve the accuracy of visual detection using the latest technology of artificial intelligence based on the daily collected images.
Footnotes
Acknowledgement
We would like to thank the anonymous reviewers for their suggestions and comments.
Declaration of conflicting interests
The author(s) declared no potential conflicts of interest with respect to the research, authorship, and/or publication of this article.
Funding
The author(s) disclosed the receipt of the following financial support for the research, authorship, and/or publication of this article: This work was supported by Science and Technology Project of China, Tobacco Zhejiang Industrial Co., Ltd [No. ZJZY2020E003].