
Abstract
The utilization of upper extremity exoskeleton robots has been proved to be a scientifically effective approach for rehabilitation training. In the process of rehabilitation training, it is necessary to detect the fatigue degree during rehabilitation training in order to formulate a reasonable training plan and achieve better training efficiency. Based on the integral value of surface electromyography (sEMG), heart rate variability, and instantaneous heart rate, this article proposes a fatigue judgment method for multi-information fusion. Based on the integral value data, the feature extraction of the bioelectrical signals were implemented separately, then the fatigue recognition was conducted using the decision-level data fusion method. The bioelectrical signal acquisition system of electromyogram signals and electrocardiograph signals was developed for upper limb exoskeleton rehabilitation robot, and the acquisition and processing of electromyogram signals and electrocardiograph signals were completed. Finally, the fuzzy logic controller with instantaneous heart rate, heart rate variability, and surface electromyography signal was designed to judge fatigue degree, including the fuzzy device, fuzzy rule selector, and defuzzifier. The moderate fatigue state data were selected for testing, and the experimental results showed that the error of fatigue judgment is 4.3%, which satisfies the requirements of fatigue judgment.
Keywords
Introduction
The utilization of upper extremity exoskeleton robots for rehabilitation of stroke patients has proven to be an effective approach. 1 –3 Among them, human–machine interaction is one of the key issues during the rehabilitation training of exoskeleton robot, which can provide safe, effective, and economical rehabilitation training measures for stroke patients. 4,5 Muscle fatigue is defined as a loss of the required or expected force from a muscle and has been a worldwide research topic. 6 –8
High exercise intensity can easily cause fatigue to the patient and even lead to muscle or bone damage 9,10 ; low exercise intensity makes it difficult for patients to achieve optimal training results. Therefore, the training plan needs to be reasonably designed according to the patient’s fatigue condition and to accurately determine the degree of fatigue of the patient, thereby adjusting the exercise intensity during the training period. Muscle fatigue is one of the commonly used indicators to describe the intensity of muscle exercise. 11,12 The exercise intensity is highest when the muscles work in a state of fatigue. At the same time, muscle fatigue can be used to assess the intensity of exercise. 13 In order to prevent muscle damage caused by excessive fatigue, different rehabilitation training plans should be developed according to the specific conditions of each individual, so as to achieve better rehabilitation training results. 14
The sEMG signals can be used to analyze the muscle state of the human body and help plan rehabilitation exercises. 15 In the medical field, the effective treatment of sEMG signals not only provides patients with a basis for diagnosis of muscle fatigue but also provides an effective treatment. 16,17 Due to the large differences in muscle characteristics of different individuals and the subjective nature of fatigue, no specific grading criteria can be proposed for the threshold of muscle fatigue.
In the poststroke rehabilitation process, monitoring of muscle activity is very important to know the developments of muscle strength. Nicola CD Armstrong et al. 18 investigated the effect of load carriage on pulmonary function during a treadmill march of increasing intensity. The results of muscle fatigue using surface electromyogram (sEMG) for rehabilitation training system were reported by Liu et al. 19 Jannatul Naeem et al. 20 proposed the mechanomyography-based muscle fatigue detection during electrically elicited cycling in patients with spinal cord injury; it could be implemented in functional electrical stimulation systems to increase patient safety and to optimize patient training. The use of a low-cost sEMG sensor was proved to be valid to measure muscle fatigue, and the developed system could be implemented in rehabilitation, ergonomics, or human–machine interaction. 21
The increase of heart rate, oxygen uptake, and electromyogram (EMG) activity could be detected during intense exercise. 22 –24 The detection of EMG information has been proved to analyze muscle fatigue. It is the mostly used method in the existing literatures. However, considering some constraints under dynamic conditions, it’s difficult to control EMG due to some confounding factors, such as change of force output, position of electrodes, and movement velocity during the tests. 25 The uncontrolled factors cause interpretation errors of the EMG signals as the highly dynamic movements in manual tasks. 26
The main contributions of the presented research are to (1) propose a novel approach which is used to detect muscle fatigue based on integral value of EMG, heart rate variability (HRV), and instantaneous heart rate (IHR) during rehabilitation training, (2) build fuzzy logic controller and acquisition system of bioelectric signals, and (3) prove the proposed multi-information fusion method is feasible to detect muscle fatigue with the developed exoskeleton robot.
Preprocessing method of sEMG signal
ADF test of stationarity of sEMG signal
Before modeling the sEMG signal, it is necessary to check the stationarity of the time series. The commonly used unit root test method is the augmented dickey-fuller (ADF) test method. The ADF test method adds a lag term to the right side of the equation of the DF test method, which can eliminate the autocorrelation of the residual when the sequence residual is not white noise.
If the constant term and the time trend term are included, the ADF model is
where Δ is the first-order difference operation, c is the constant term, αt is the time trend term,
In order to ensure that αt is white noise, the size of the optimal lag term k can be determined by the AIC method. The AIC formula is

where
Eigenvalue extraction
Time domain and frequency domain analysis of sEMG signals can make judgments on fatigue of rehabilitation patient. Time domain method is usually taken to analyze the amplitude, mean value, and other information of training signals.
ARV, RMS, and RIE of sEMG signal
When muscle is fatigued, the zero-crossing rate and the frequency of the sEMG signal decrease, and the relative integral electromyogram (RIE), the amplitude of the average rectified value (ARV), and the root mean square value (RMS) show an upward trend. The calculation of ARV and RMS is shown below


where T is the length of time window, t is the starting point of the instantaneous window movement, and
The calculation of RIE is

where T is the length of sliding window, ns is the starting point of the sliding window, X(p) is the sEMG sampling value, and N is the total amount for window calibration.
Taking the sEMG signal collected by the forward stretch arm movement as an example, we take the window length as 50 ms and record it during the 1500 ms fatigue training process. As shown in Figure 1, RIE shows an upward trend which linear fitting the sampling points in fluctuations. As RIE fluctuates and rises continuously, it is difficult to judge by a single eigenvalue, but its trend can provide a reference for judgment.
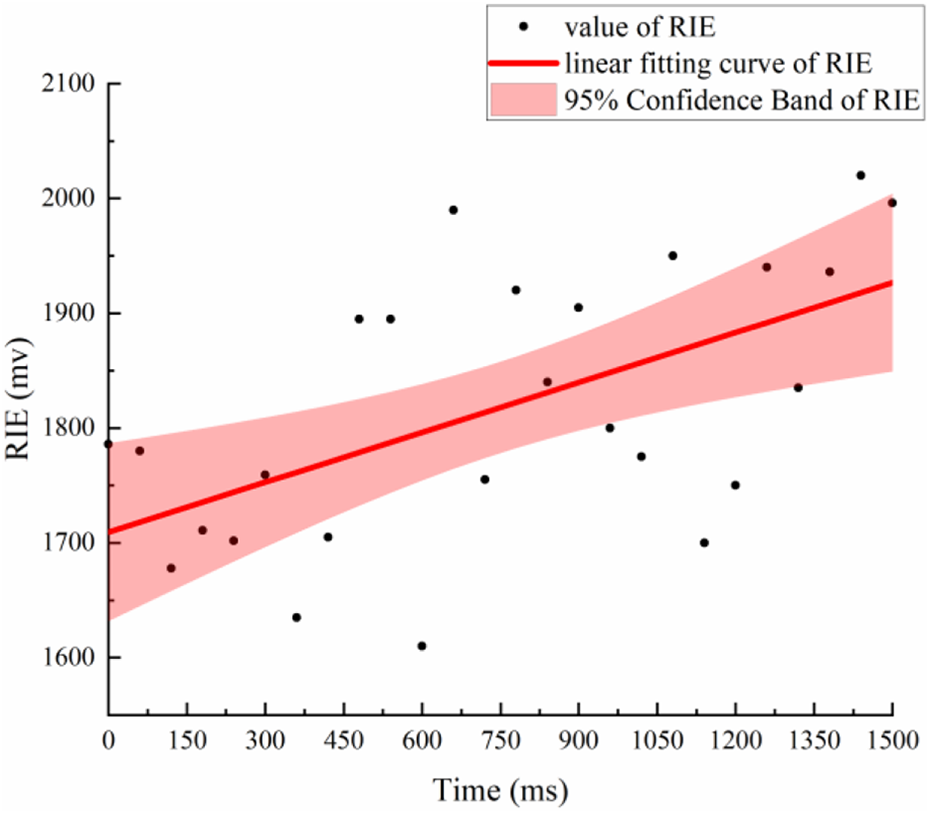
RIE trends during muscle fatigue. RIE: relative integral electromyogram.
IHR and HRV of ECG signalFrom the statistical data, the increase in fatigue will be accompanied by an increase in IHR. When processing the electrocardiograph (ECG) signal, set the range of the heart rate between 60 and 180. If the heart rate is not within the range, discard the sampling data and resample. Similarly, HRV is the standard for judging whether the heartbeat is abnormal. The difference between two IHRs is taken, and the absolute value of the difference is used to measure the HRV. The result shows that the greater the difference, the greater the degree of fatigue

where
AR model of sEMG signal
The autoregressive (AR) model (linear prediction model) is the main method for studying time series in the time domain. It refers to the sum of the linear combination of the previous sample input x(n) and the error term e(n), and each sample size is different from the previous sample size

where x(n) is the sampled value of the signal, ak is the AR model parameter, p is the order of the AR model, and e(n) is the error or residual sequence.
This model can be interpreted as a linear system with e(n) as the sEMG signal input and x(n) as the output. The transfer function of the system is as follows

AR model parameter identification
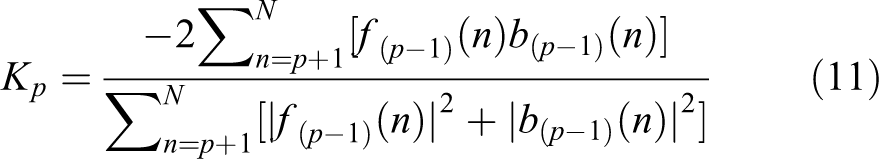
Because the Burg method is less computationally intensive and the spectrum estimation quality is better, the model adopts the Burg method for AR parameter identification. The Burg method uses the lattice error prediction filter, as shown in Figure 2. According to this method, the average power of the forward and backward prediction errors is obtained, and the reflection coefficient is obtained according to the principle of the minimum average, and then the Levinson recursive formula is used. Solve the AR model coefficients and noise variance from low order to high order.

Error prediction filter.
The average power of forward and backward errors is

According to the principle of the minimum average power of the previous and backward prediction errors of the data, the reflection coefficient Kp is
Find model parameters from low order to high order by Levinson recursive formula

PCA dimensionality reduction method
Principal component analysis (PCA) is currently the most widely used dimensionality reduction method. This article uses the PCA method to reduce the dimensionality of the 16-dimensional (16D) parameters of the AR(4) model of the four-channel sEMG signal.
The contribution rate of the principal component measures the size of the feature amount of the data set X contained in F after the transformation. The contribution rate refers to the proportion of the eigenvalue of the i-th principal component in all the eigenvalues corresponding to the covariance matrix. The larger the ratio, the more features of the i-th principal component integrated source information. The contribution rate calculation formula is


where λi is the eigenvalue of the corresponding covariance matrix, αi is the contribution rate of a single principal component, and Km is the contribution rate of the first m principal components.
In summary, the PCA method arranges the coordinate axes along the variance of the data to extract the main features from the data.
Fatigue assessment using multimodal information fusion
Feature classification based on SVM
The purpose of sEMG feature classification is to determine that a given action belongs to a type of support vector machine (SVM) in the action training set. At present, it has shown many advantages, especially in solving nonlinear, small sample, high-level pattern recognition.
Assuming that the training sample set
If there is a hyperplane

As shown in Figure 3, if the hyperplane is the optimal plane, the distance between the hyperplane and the closest data to the hyperplane is the largest.

Optimal hyperplanar structure.
Therefore, the discriminant function is as follows

where
From the point of view of signal analysis, relatively definite components with small changes often contain the overall trend of the signal. In this article, the four-channel integrated EMG value containing the overall trend of the sEMG signal is integrated into the sEMG feature to form a 7D feature space.
Considering that the sampling length of each channel is the same, the trend feature is defined as the relative area of the EMG signal. Define the sEMG signal data of a channel as


where sv is the mean value characteristic, i is the channel index, j is the i-th channel sampling index, and RIE is the relative integral value area characteristic. In summary, the final feature dimension used for SVM classification is seven dimensions.
Multi-information fusion
According to the data of heart rate, premature beat, and sEMG, this article adopts the method of decision layer data fusion. Firstly, the feature extraction is carried out separately, then performs fatigue recognition. Finally, the recognition results are merged and the final judgment is made. The principle of the scheme is shown in Figure 4.

Principle of decision layer fusion method.
Neural network is preponderant in processing nonlinear data. It can classify according to the similarity of multisensor input data and has certain decision-making ability. Fuzzy logic is multivalued, which is an extension of classical logic.
Fuzzy logic replaces classical logic with the concept of validity, expressed by the interval [0,1], which is suitable for ambiguous object control. In the process of muscle fatigue, ECG information can be used to analyze the relevant indicators as shown in Figure 5. The muscle fatigue judgment based on the data of heart rate, premature beat, and sEMG signal’s amplitude changes has ambiguous characteristics. Therefore, it is reasonable to use fuzzy logic to judge muscle fatigue.

ECG signal during muscle fatigue. ECG: electrocardiograph.
In this section, a fuzzy logic controller with IHR, HRV, and sEMG signals as input and fatigue level as output was designed.
In this article, the relative integral value of sEMG collected in the previous moment when the sensor starts to work is used as the reference quantity, and the relative integral value of sEMG at the subsequent time is compared with it. The larger the ratio is, the greater the degree of fatigue is.
The range of heart rate value is set between 60 and 180. If the heart rate is not within the range, the sampled data will be discarded and the sample will be repeated. When the IHR increases, the degree of fatigue increases. The variability of heart rate also can be the criterion for judging whether the heartbeat is abnormal. In this article, the difference between the two IHRs is taken, and the magnitude of the HRV is measured by the absolute value of the difference. Even if an accurate mathematical model of input and output cannot be established, the fuzzy logic controller designed in this section can also give an appropriate fatigue level standard based on the input data. The fatigue judgment fuzzy controller is mainly composed of three parts: a fuzzy device, a fuzzy rule selector, and a defuzzifier. Firstly, it originates from the existing research foundation, and 27 fuzzy rules were designed. The input and output of each language correspond to a set of triangular membership functions. The fuzzy controller for fatigue judgment is shown in Figure 6.
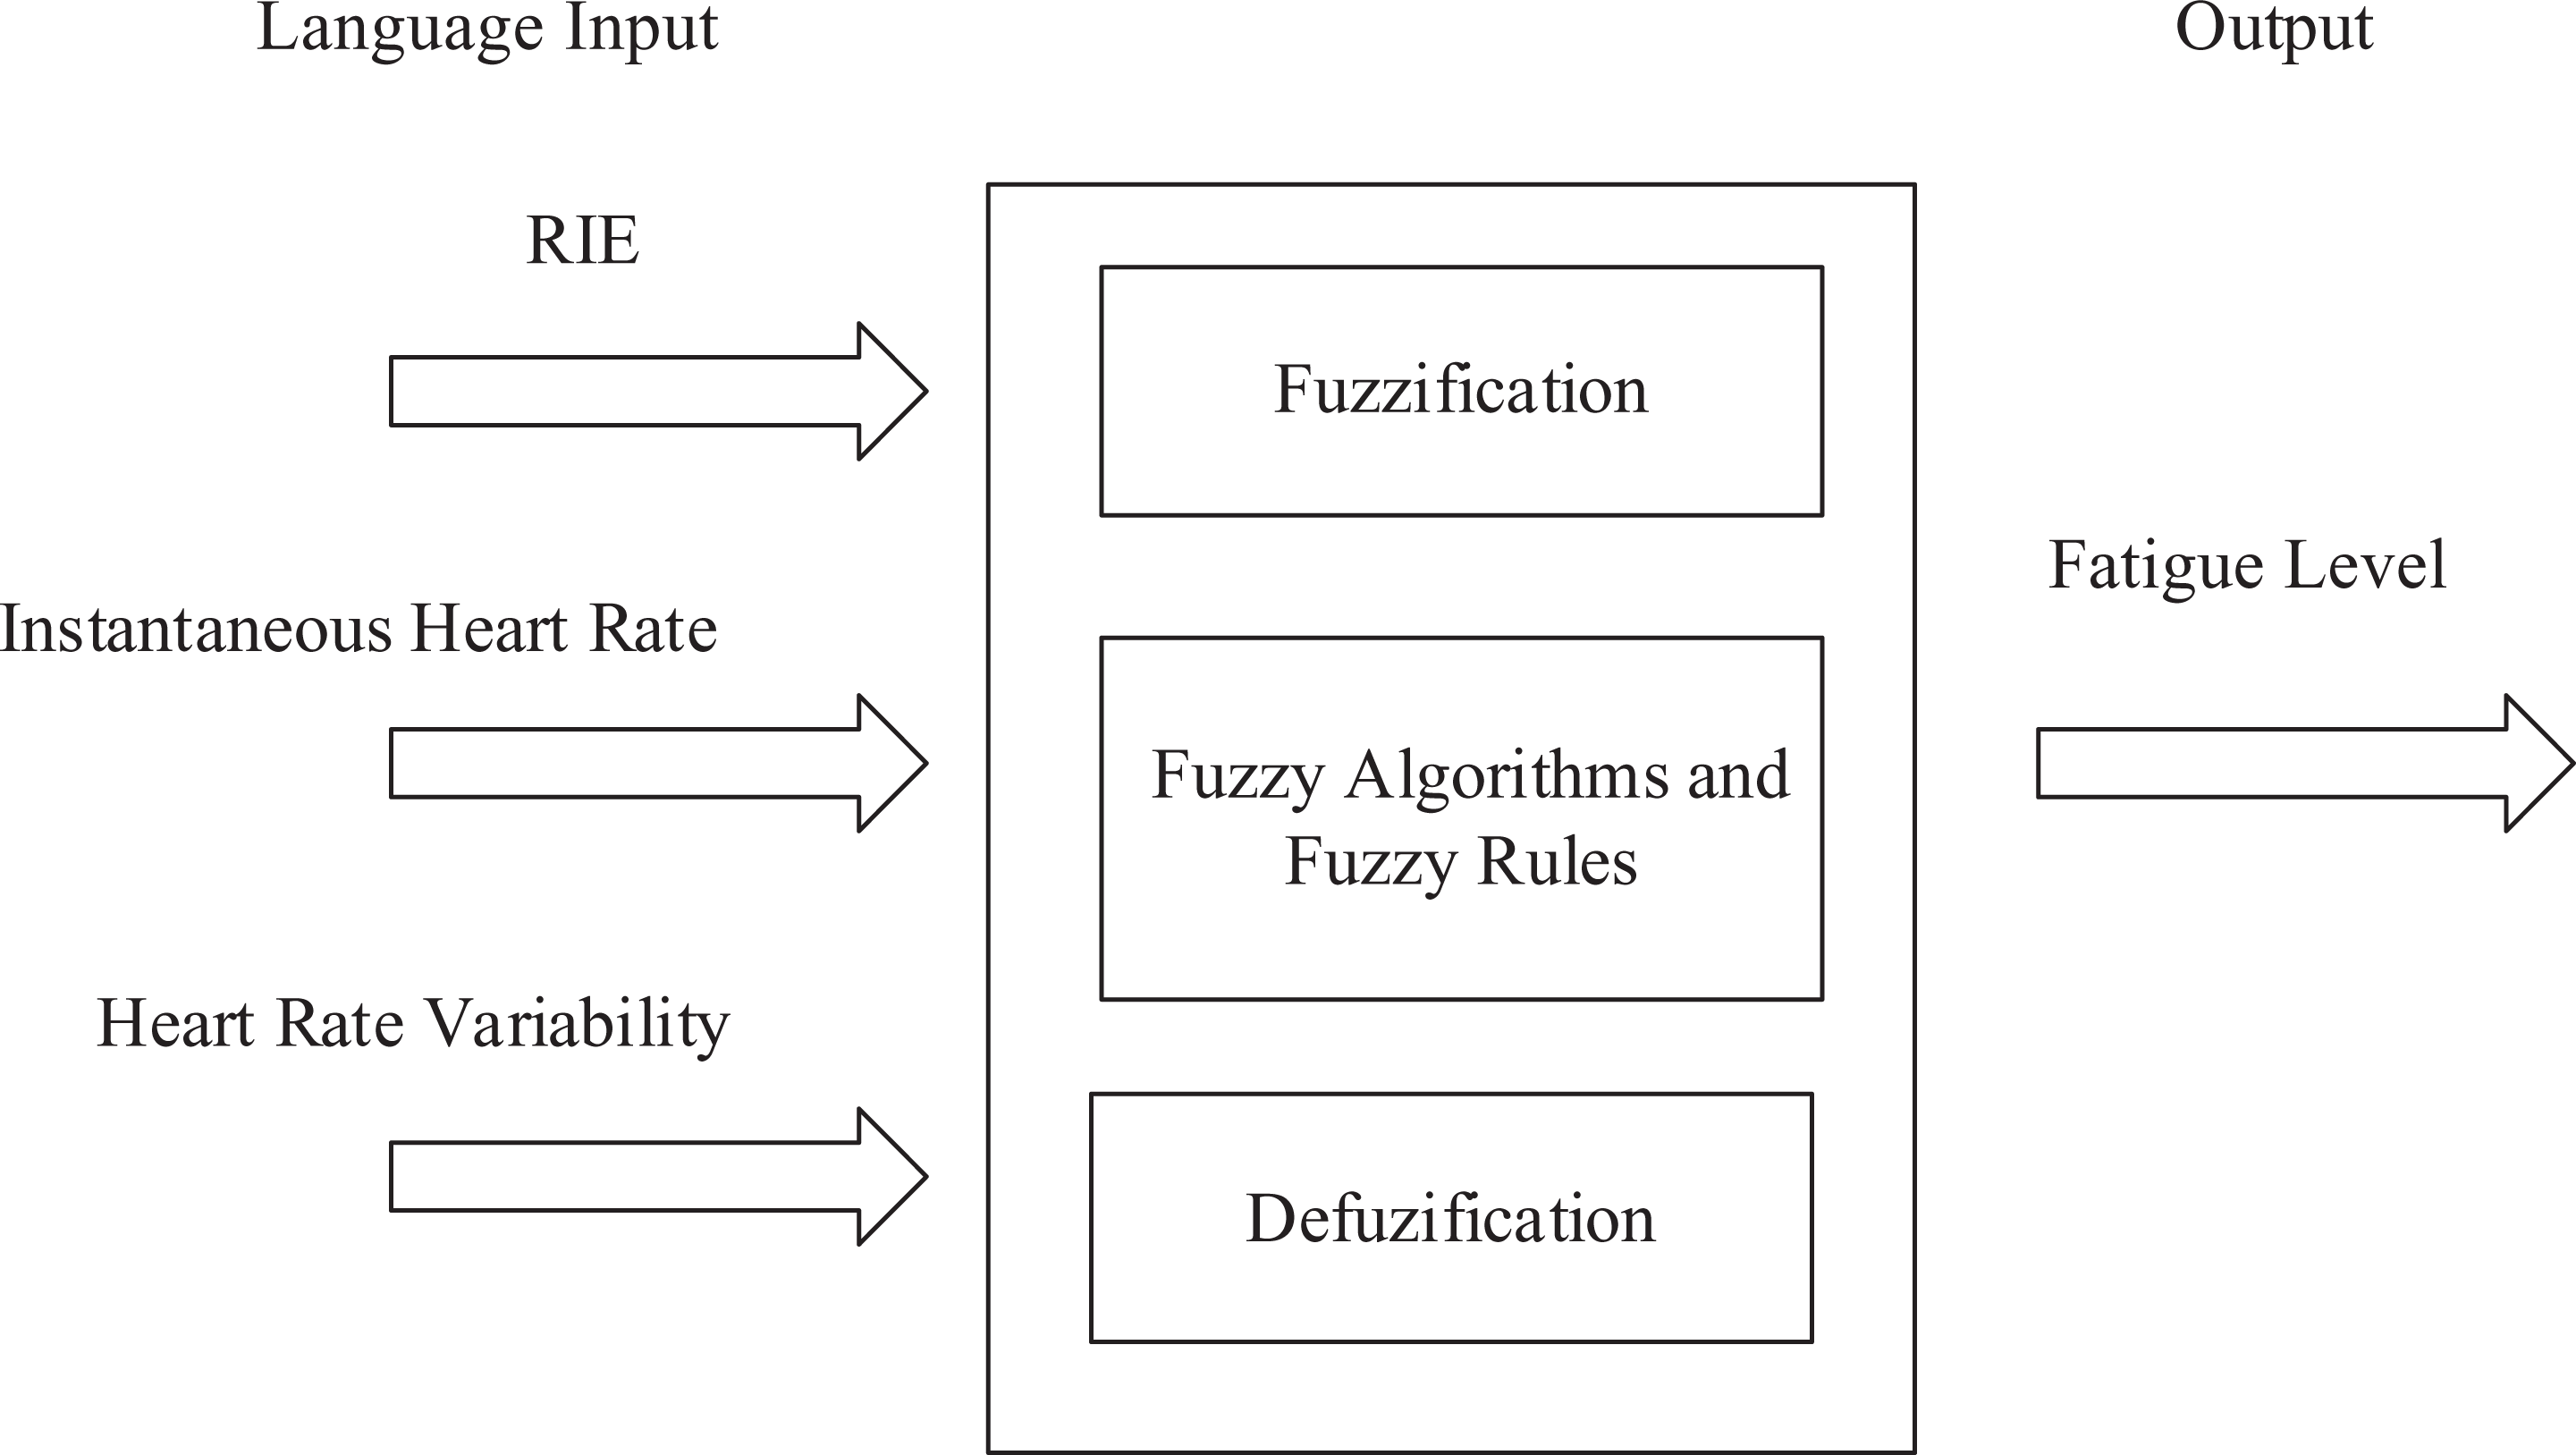
Fuzzy controller construction diagram.
Fuzzification is the process of mapping a clear input value as a fuzzy value using a membership function. The fuzzy controller makes the decision based on the fuzzy rule, which is a descriptive statement composed of “if” and “then.” The sEMG signal integral value, HRV, and IHR values were all divided into three levels, normal, moderate, and severe. The output fatigue level is divided into five levels, poor, lack, average, moderate, and severe. The rules table developed in this article is presented in Table 1.
Fuzzy rule.

Design and verification of experiment
Foundation
Upper limb exoskeleton robot
The five-degree-of-freedom upper limb exoskeleton robot was developed in our lab as shown in Figure 7. It can achieve the rotation of elbow, shoulder, and wrist, which is required during rehabilitation training. The control system was tested on the volunteers as it could provide effective assistance for the motion of forearm, postbrachium, and hand.
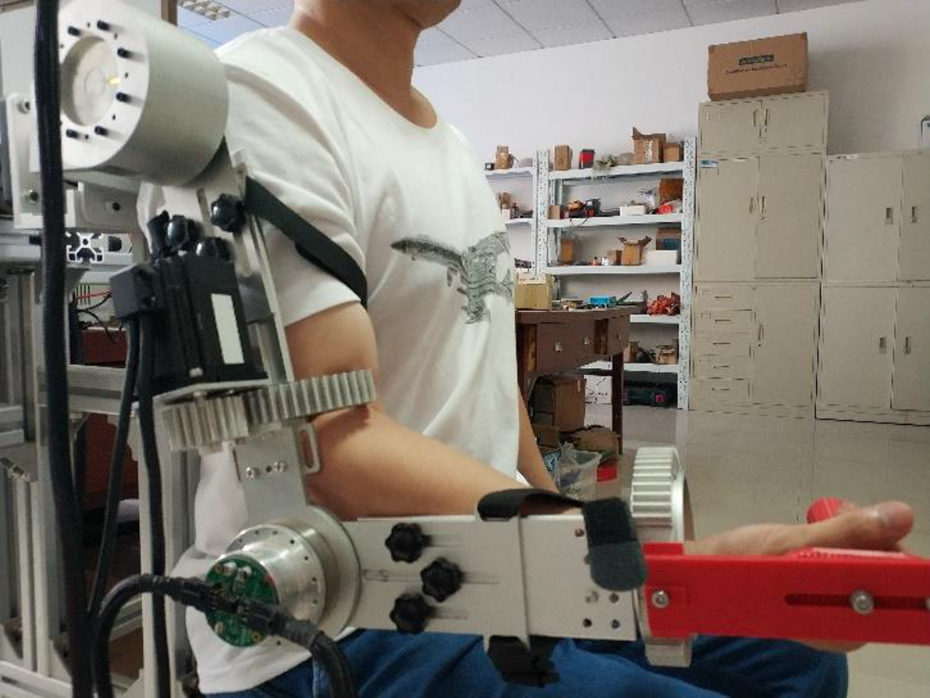
Upper limb exoskeleton robot.
Acquisition system design
The band-pass filter designed in this article retains the sEMG signal information with the frequency of 60–250 Hz after the filter circuit, which could effectively avoid the interference of 50 Hz power frequency. ADI’s AD7606 converter (ADI company, One Technology Way PO BOX 9106 Norwood, MA 02062) was chosen to perform analog-to-digital (AD) conversion of the sEMG signal.
In this article, STM32F401RCT6 was used as the main control chip to build a signal acquisition system (see Figure 8). The lower machine control unit mainly performs the following functions: The first is to read the data of AD conversion of AD7606 through SPI serial, the second is to ensure a certain storage space to store the sEMG signal value read from the AD7606, the third is to capture the rising edge of the ECG signal pulse processed by the hardware circuit and to calculate the interval time between the two rising edges and convert it to the IHR value, and the fourth is to send the sEMG signal and the IHR value to the host PC through the serial interface and the transistor-transistor logic (TTL) to USB circuit.

Signal acquisition system (ECG acquisition sensor in the figure). ECG: electrocardiograph.
ECG signal acquisition
The heart rate was collected by the heart rate clamp sensor module. This module was worn on the fingertips with a finger clip, which is shown in Figure 9. After the infrared light is transmitted through the fingers, the infrared receiver module receives the signal amplification to determine the heart rate. Subsequently, the filter circuit module, the amplification circuit module, and the AD conversion module convert the analog signal into a digital signal that is transmitted to the PC terminal for processing.
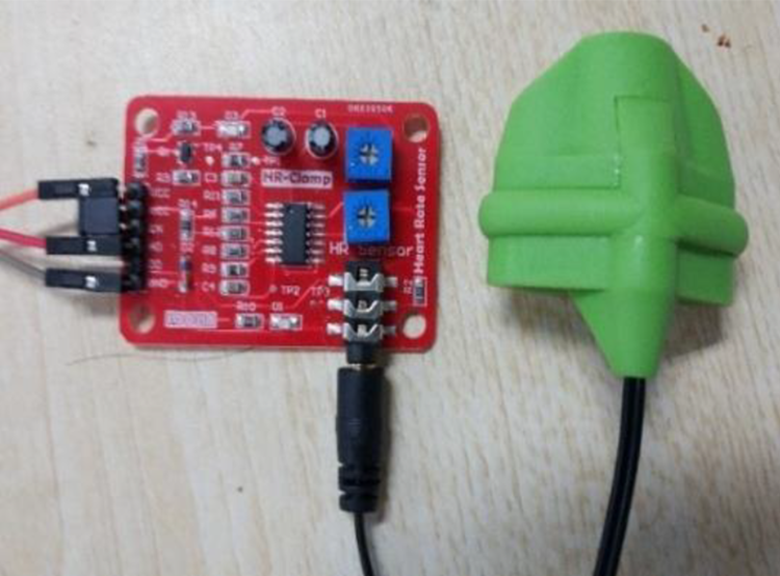
Finger clip heart rate signal sensor.
Experiment design
A total of eight subjects (N = 8, age 24 ± 2 years, weight 70 ± 15 kg, height 173 ± 8 cm, all male),four healthy subjects and four subjects with a history of muscle damage, participated in the experiment. All subjects provided their informed consent before participating. Each subject performs five repeated experiments based on three standard actions. Signal acquisition is performed in the surface EMG signal system and the heart rate signal acquisition system. This experiment which set the time constant to 0.08 s and sampling frequency to 3000 Hz uses disposable Ag/AgCl electrode pads. Subjects were affixed with disposable electrode pads according to the muscle type, and the electrode pad distance was 50 mm.
In the experiment, the sEMG and ECG signals are collected by four healthy subjects without a history of muscle strain, and four patients with muscle injury records who did not participate in intense activities within 24 h before the experiment. The subjects stood with their hands tied 1.5 kg bandage to do the forward stretch of the arm, the bent arm and fist, and the side stretch of the arm. The subjects continued the experiment (approximately 3 min) until the fatigue limit (the subject’s mental and physical double standards, and the subject stops it) and recorded the four-channel data of the sEMG and ECG signals.
Analysis of results
The table records the average value of five rounds of eight subjects of the experiments. Si means the i-th healthy population without a record of muscle damage, Ai means the i-th patient with a muscle damage record, TS means all healthy people, TA means all patients, and finally the different effects of the three methods are obtained. The specific values are shown in Table 2.
Different methods of recognition rate of different groups of people.

RIE: relative integral electromyogram; IHR: instantaneous heart rate; HRV: heart rate variability.
The analysis in the table shows that the overall recognition effect of the healthy group is higher than that of the patient group. The RIE feature contributes the main force in the whole process and the heart rate signal feature has a better recognition rate after fatigue occurs. Although the performance of the multi-mode information fusion method in some cases is not as well as the exclusive use of RIE or IHR and HRV, it has generally high recognition in a larger scale of subjects. Therefore, the use of fusion methods for network training will greatly reduce the errors caused by human anisotropy.
Results and discussion
PCA method of sEMG signal for dimensionality reduction
In this article, we sampled 20 times for each of the three movements of shoulder flexion, shoulder abduction, and elbow flexion and recorded the four-channel sEMG signal of each movement. The characteristic parameters were extracted through the AR(4) model to obtain a total of 60 groups of learning samples with a feature vector length of 16 dimensions. According to the above method, PCA training is performed on 60 sample sets containing 16 parameters, and the variance value, contribution rate, and cumulative contribution rate of the first five principal components are obtained, which is presented in Table 3.
The variance value, contribution rate, and cumulative contribution rate of the first five principal components.
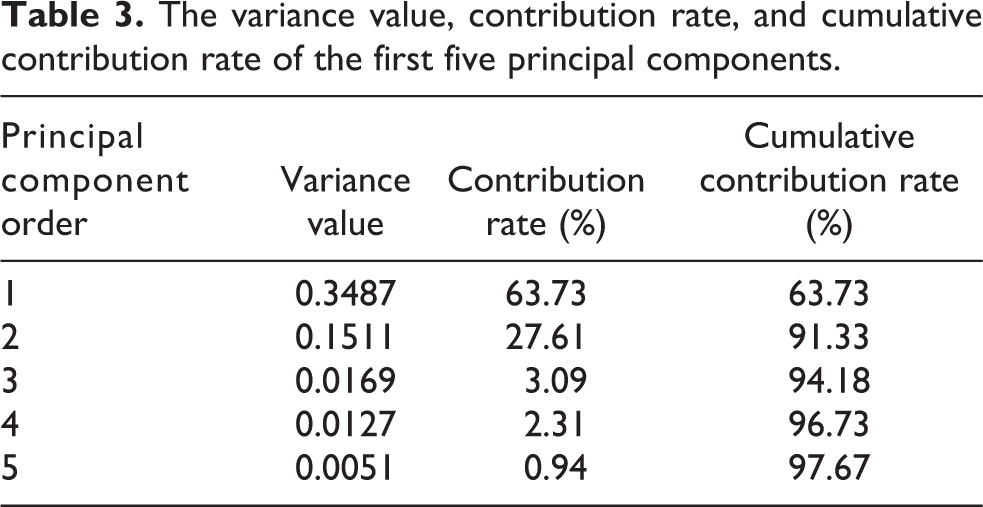
It can be seen from the table that the contribution rate of the first three-order principal components has reached 94.18%. As the order of the principal components increases, the amount of information contained in the high-order principal components decreases rapidly, and the cumulative contribution rate hardly increases.
Figure 10 shows the contribution rate and cumulative contribution rate of the first 10 principal components. Therefore, considering the effectiveness of feature dimensionality reduction, the first three-order principal components can be taken for subsequent analysis.
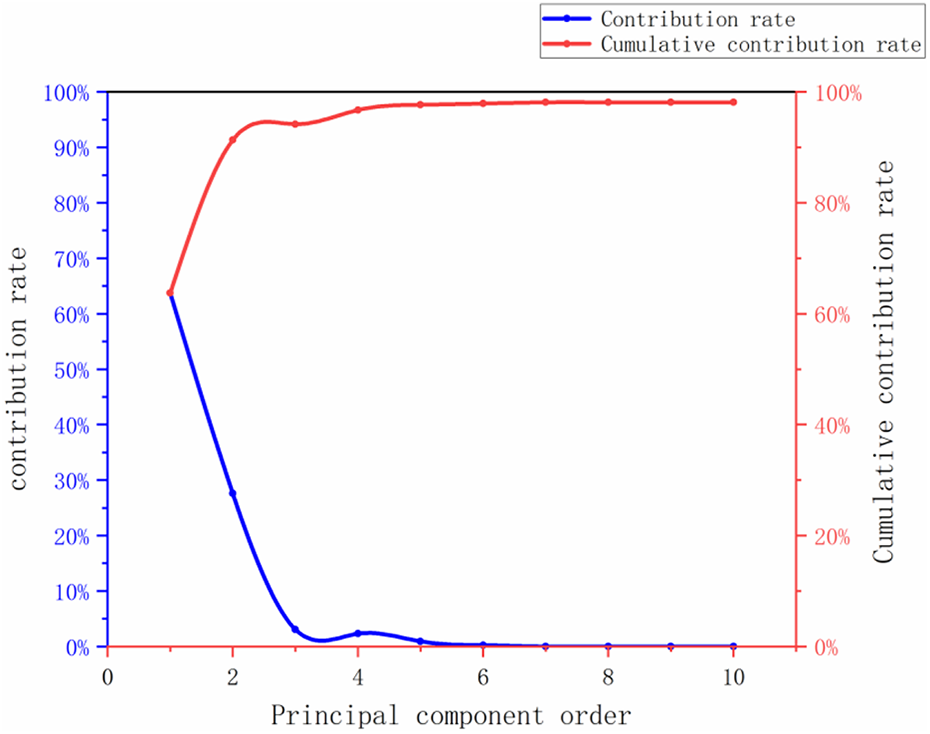
The contribution rate and cumulative contribution rate of the first 10 principal components.
SVM classification effect
The eigenvalues of A1, A2, and A3 are imported into a 3D scatter plot for cluster analysis after dimension reduction. It can be seen from Figure 11 that most of the experimental data are within the 90% confidence ellipse, except for the shoulder abduction label and the shoulder flexion label, which overlap in the A1–A3 plane. The reason for this phenomenon is that the sEMG acquisition channels of shoulder abduction action and shoulder flexion action are basically the same, and the two muscle actions are coordinated with each other, which leads to confusion. But in general, the remaining planes and spaces show obvious clustering, reflecting the higher overall recognition rate.

Feature cluster analysis after SVM dimensionality reduction. SVM: support vector machine.
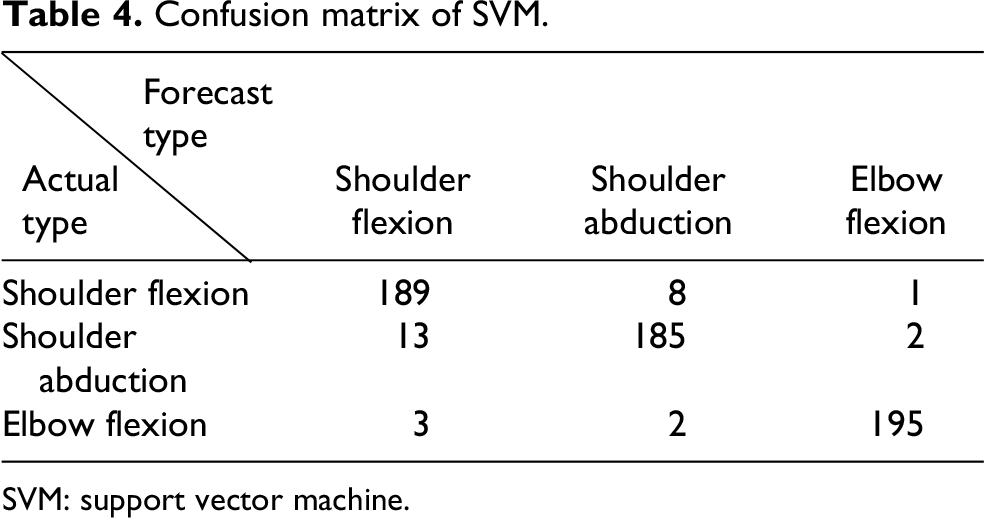
After processing feature extractions and label recognition of the collected data, 10 fivefold cross-validations were performed. Then 60 sets of training data were randomly divided, of which 45 sets of data were used for training, and 15 sets of data were used for testing training results. Using SVM linear kernel, the confusion matrix of SVM is presented in Table 4.
Confusion matrix of SVM.
SVM: support vector machine.
Based on the confusion matrix, three indicators can be used to judge the performance of the SVM classifier. The accuracy, recall, and F 1-score of the training results are presented in Table 5.
Accuracy, recall, and F 1-score of SVM.

SVM: support vector machine.
After training by randomly dividing samples for many times, the training accuracy, recall rate, and F 1-score obtained are greater than 93%. The classification accuracy of each action is as follows: weighted mean 96 ± 0.18%; shoulder flexion 95 ± 0.59%; shoulder abduction 93 ± 0.91%; elbow flexion 97 ± 0.28%, with three motion overall F 1-score is 0.9724. Therefore, the SVM has a good classification effect on the sEMG signal features as described in this article.
Fuzzy algorithm for fatigue assessment using multimode information fusion
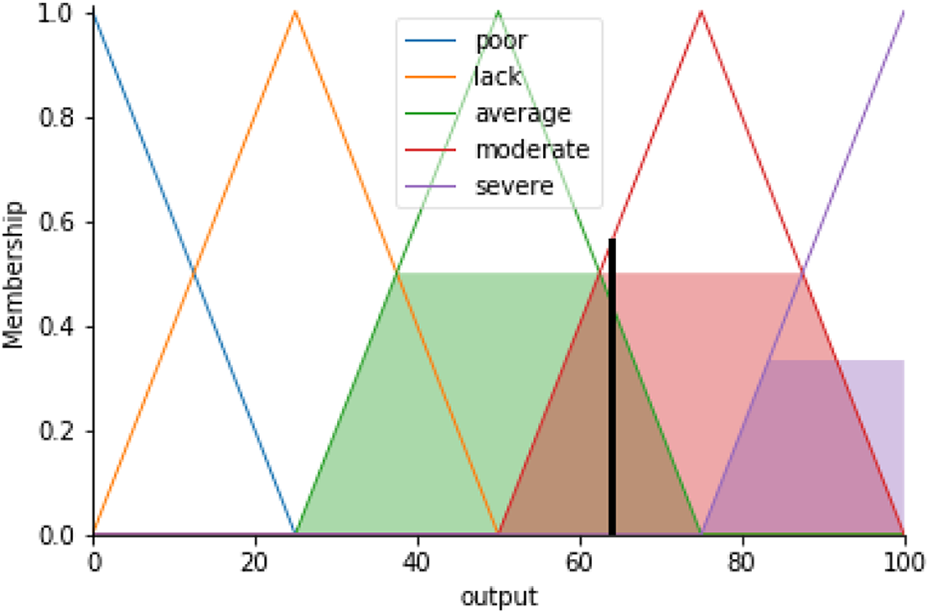
The membership function curves of the sEMG signal integral value, the IHR value, and the HRV value are shown in Figure 12.

Membership function diagram: (a) heart rate variabilitys, (b) instantaneous heart rate, (c) relative integral value, and (d) output value.
A set of data in a state of moderate fatigue was selected to test the proposed fuzzy algorithm, the HRV value is 15, the IHR value is 140, the increase of sEMG signal integral amplitude value is 25% as an input, and the calculated reference output is 69 by the gravity method which was used as the solver of fuzzification. There are four steps to calculate the fuzzy values according to the proposed method. Step 1, to cut the membership function curve of the output data. Step 2, to combine the membership function curves of the input parameters as a new curve. Step 3, to calculate the center of gravity of the enclosed area below the curve. Step 4, to obtain the abscissa value corresponding to the center of gravity which is the evaluate fuzzy value as output. The calculation results are shown in Figure 13.
Input data calculation diagram.
Based on the output data values, the designed fuzzy control strategy is shown in Figure 14. According to the above input values, the output value of the fuzzy control system is 66.0 and the error is 4.3%. The corresponding training strategy is interval training. In the specific process of controlling the manipulator, different training strategies are realized by adjusting the joint angle size, the joint angular velocity, and the angular acceleration in the joint parameters, thereby realizing the change of the training action amplitude and the training frequency.

Fuzzy control strategy.
Conclusion
In this article, a fatigue judgment method based on sEMG signal integral value, HRV, and IHR value was proposed for rehabilitation training. A bioelectrical acquisition system for sEMG signals and ECG signals was designed. To complete the acquisition and process of sEMG and ECG signals, the embedded hardware for data acquisition was manufactured, including the amplification, filtering, biasing circuit of sEMG signal and ECG signal, sEMG signal AD conversion circuit, ECG signal voltage comparison circuit, embedded controller circuit, and power circuit. Furthermore, the fuzzy logic controller with IHR, HRV, and sEMG signal was designed, including fuzzy device, fuzzy rule selector and defuzzifier, and 27 fuzzy rules. The moderate fatigue state data were selected to test the feasibility of the proposed method. The calculation error is 4.3% by defuzzification with gravity method, which satisfies the requirements of fatigue judgment. Therefore, it can be concluded that the proposed multi-information fusion method is useful to judge fatigue for exoskeleton robot-based rehabilitation training.
Footnotes
Declaration of conflicting interests
The author(s) declared no potential conflicts of interest with respect to the research, authorship, and/or publication of this article.
Ethical approval
The study was conducted in accordance with the Declaration of Helsinki, and the protocol was approved by the Medical and Experimental Animal Ethics Committee of Northwestern Polytechnical University, Xi’an, China (Reference number 6101030222595-202001001).
Funding
The author(s) disclosed receipt of the following financial support for the research, authorship, and/or publication of this article: This work was supported by Shaanxi Provincial Key R&D Program (grant no. 2020KW-058) and Natural Science Founda-tion of Shanxi Province (grant no. 2020JM-131).