
Abstract
Intelligent vehicles should be able to detect various obstacles and also identify their types so that the vehicles can take an appropriate level of protection and intervention. This article presents a method of detecting and classifying multiclass obstacles for intelligent vehicles. A stereovision-based method is used to segment obstacles from traffic background and measure three-dimensional geometrical features. A Bayesian network (BN) model has been established to further classify them into five classes, including pedestrian, cyclist, car, van, and truck. The BN model is trained using substantial data samples. The optimized structure of the model is determined from the necessary path condition method with a presupposition constraint (NPC+PC). The conditional probability table of the discrete nodes and the conditional probability distribution of the continuous nodes are determined from expectation maximization (EM) training algorithm with consideration of prior domain knowledge. Experiments were conducted using the object detection data set on the public KITTI benchmark, and the results show that the proposed BN model exhibits an excellent performance for obstacle classification while the full pipeline of the method including detection and classification is in the upper middle level compared with other existing methods.
Introduction
Research on intelligent vehicles is being in the ascendant with the aim of autonomous driving. Environmental identification is a basic module and a premise of autonomous driving. One of tasks of environment identification is to detect and identify multiclass obstacles. The existing research majorly focuses on obstacle detection for pedestrian or vehicle. The research on simultaneous detection and classification of multiclass obstacles is relatively limited. In fact, autonomous vehicles should be able to detect various obstacles and also identify their types so that the vehicles can take an appropriate level of protection and intervention, especially in urban driving scenarios. This work addresses this issue and proposes a stereovision-based approach combining with Bayesian network (BN) technique for detecting and classifying multiclass obstacles, including pedestrian, cyclist, car, van, and truck.
Existing vision-based obstacle recognition methods can be divided into three categories, including stereovision-based method, prior-knowledge-based method, and convolutional neural network (CNN) based deep-learning method. The stereovision-based method 1,2 is equipped with two cameras and creates a depth map in virtue of its 3D reconstruction capability. Objects in the scene are segmented in the depth map according to their spatial position. These methods are capable of detecting various obstacles no matter of their shape and motion status. These methods can also provide accurate distance and 3D geometrical size. However, these methods are not able to classify the obstacles, and object identification relies on other algorithms.
The prior-knowledge-based method normally makes use of some specific graphical features of objects (vehicle or pedestrian) that are known beforehand for detection purpose. For vehicle detection, 3 –5 the process can be divided into two steps: hypothesis generation (HG) and hypothesis verification (HV). In the HG step, the locations of possible vehicles are hypothesized using features like symmetry, shadow, shape and color, and horizontal/vertical edge. In the HV stage, tests are performed to verify the correctness of the hypothesis and to exclude nonvehicle targets by means of template-or-feature matching. For pedestrian detection, 6 –8 some research use either 2D body posture templates or head–shoulder model for template matching. Some research use motion features of leg or hand to capture a pedestrian. These methods are normally equipped with a monocular camera. The detection and classification are conducted simultaneously. However, these methods can only work on a single-type obstacle and the distance information is ambiguous.
With impressive advances in deep learning in the past few years, recent efforts in object detection exploit object proposals to facilitate classifiers with a powerful, hierarchical visual representation. Compared with traditional grouping superpixels-based methods (selective search) 9 and sliding window-based method (edge boxes), 10 the CNN-based deep learning is able to learn efficient features from the data without the need of manually extracting features and generate a classifier with high resolution. The basic deep-learning models are the region proposal CNN (R-CNN) 11 –13 and the single detection CNN (YOLO). 14,15 The R-CNN has higher detection accuracy while the YOLO can give a faster detection and meets real-time requirements. Both the methods can fulfill an end-to-end detection mode from image to result without the need of artificially extracting features. Li et al. 16 transplanted the fully convolutional network technique for car detection using 3D laser scanner data. Hosang et al. 17 applied the R-CNN on pedestrian detection and accordingly proposed the SquaresChnFtrs detector. Chen et al. 18 presented an improved CNN for vehicle detection and classification using feature concatenation to extract more rich features. Wang et al. 19 used the faster R-CNN to classify vehicles into four classes: car, bus, minivan, and truck. The modified faster R-CNN method realized vehicle detection and recognition with an average classification accuracy of 92%. 20 Chen et al. 21 proposed a 3D object proposal (3DOP) method using stereo imagery and encoding object size priors, ground plane context, and depth information into an energy function. The 3D proposals are then used to regress the object pose and 2D boxes using the R-CNN. Li et al. 22 extended the faster R-CNN and proposed a 3D object detection method by fully exploiting the sparse and dense semantic and geometry information in stereo imagery. Although the deep-learning-based methods have made a great progress in the field of object recognition, its performance strongly relies on whether the training samples cover the variations of the mode under detection. It may be lack of generalization ability in the case that the scenarios are out of the training sample set. It is also lack of distance information.
BN is a probability-based modeling technique and suitable for knowledge-based reasoning systems. BN enables us to model and reason about uncertainty, ideally suited for reasoning real-world problems, where uncertain incomplete data exist. Compared to CNN technique, BN features the following: (1) It has a transparent topology with all nodes (events), edges, and probability tables visible. (2) It can be data-driven or experience-driven, that is, the knowledge used for establishing the model can be from the data or from expert experiences. (3) It can make inference under incomplete data situations, that is, a BN model does not request evidence for all nodes. Kafai and Bhanu 23 presented a multiclass vehicle classification system based on hybrid dynamic Bayesian network by extracting features, including tail lights, license plate, and rear dimensions, which classified vehicles into four classes: sedan, pickup truck, SUV/minivan, and unknown. However, their work is only designed to classify various vehicles rather than multiclass obstacles.
Based on the above analysis, we proposed a novel method for detection and classification of multiclass obstacles. The method employs the stereovision for obstacle detection. The obstacles are segmented according to their spatial position, thus, moving and stationary obstacles with various shapes can be detected. BN technique is then employed to establish a classification model for identifying the type of the detected obstacles. In our BN classifier, measured geometrical features, including length, width, height, and observation angle, are modeled as nodes (variables). The structure and parameters of the BN model are determined by training the model with substantial data set and by considering prior domain knowledge. By inputting the feature information of the obstacles measured by the stereovision, the obstacle type can be inferred from the BN probability propagation process.
The main contributions of our work are as follows.
The method tactfully combines the stereovision with the BN and achieves a detection and classification of multiclass obstacles. In virtue of the BN technique, our classification model has a transparent topology with all variables, edges, and probability tables visible. Moreover, our model embeds both data-driven and experience-driven knowledge for classification, that is, the knowledge used for establishing the model can be from the data or from experiences. Furthermore, our model can make inference under situations with incomplete data.
To the best of our knowledge, this is the first work that applies the BN technique for classifying multiclass obstacles.
The proposed BN model exhibits an excellent performance for obstacle classification while the full pipeline of the method is in the upper middle level compared with other existing methods.
The remainder of the article is structured as follows. The second section introduces the proposed method that consists of two modules. The first module is stereovision detector, as described in the “Object detection using stereovision” section. The second module is BN classifier, as described in the “BN classification model” section. The third section presents the experiments and evaluations conducted on the BN classification model (“Experiments and evaluation of classification model” section) and the whole system (“Experiments and evaluation of the whole system” section). The fourth section presents the conclusions and future research plans.
Proposed approach
Figure 1 shows the pipeline of the proposed method. Firstly, stereovision is used to detect and segment objects from traffic background. The detected objects were outlined with 3D bounding boxes. The active contour model (snake model) algorithm is then adopted to extract complete contour curve of the detected obstacles. The location, 3D size of objects, and the viewing angle are obtained. Secondly, the BN is used to establish a classification model. The geometrical features, including length, width, height, and observation angle are modeled as nodes (variables) in the model. The model is trained using substantial data set. The optimized structure of the model is determined from the necessary path condition training method with a presupposition constraint (NPC + PC). The conditional probability table of the discrete nodes and the conditional probability distribution of the continuous nodes are determined from expectation maximization (EM) training algorithm with consideration of prior domain knowledge. The obstacle type, including pedestrian, cyclist, car, van, and truck, is then inferred from the BN probability propagation process.

The flow chart of the proposed method.
Object detection using stereovision
Object segmentation is a hard task, especially in highly cluttered urban environment. In virtue of its 3D reconstruction capability, stereovision can reconstruct 2D image into 3D space, therefore, allows position-based object segmentation. Such an approach can detect various obstacles no matter what the object shape is and no matter whether the objects are moving or stationary. After obstacles are detected, we use an active contour model (snake model) to extract the contour so that the accurate object size, including length, width, and height, can be obtained. The details of these methods are described in our previous research work.
1,2
Steps are summarized as follows: A stereovision rig is employed to capture left–right image pairs, and the region-based stereo matching algorithm is used to produce dense disparity map. The transformation from X-Y plane image to X-Z plane (bird-eye-view image) is conducted to generate a depth map using the stereo triangulation geometry. The points on the road surface and in the sky are removed. The objects are segmented in the depth map using region-growing method to gather points within the same objects. The spans of each object in lateral and longitudinal directions are the width and the length. The detected objects were projected back to the original X-Y plane image. The span in Y direction is the height of the object. Thus, 3D bounding boxes can be outlined. A disparity constraint is imposed on the bounding boxes to remove background noise. The geometrical contour of the objects is extracted using active contour models in the bounding boxes. This step helps to refine the 3D bounding boxes.
Figure 2 shows the process of the object segmentation and contour extraction. Figure 2(a) is a stereo image (left image and right image are displayed in the same plane). Figure 2(b) is the dense disparity map generated from the region-based stereo matching algorithm, where the colors denote the disparity scale. In Figure 2(b), the background and the obstacles are mixed together and cannot be separated directly. Therefore, we transformed the disparity map into X-Z plane (step ii) and obtained the depth image, as shown in Figure 2(c). In the depth image, objects are separated in terms of their positions and presented as point clusters. Figure 2(d) shows the depth image after removing the points on the road surface and the noise clusters with a small size. Objects 1–3 and other objects can be clustered in Figure 2(d) using region-growing method (step iv). The spans of each object in lateral and longitudinal directions are the width and the length. The detected objects are then projected back to the original X-Y plane image (step v). The span in the Y direction is the height of the object. Thus, 3D bounding boxes can be outlined, as shown in Figure 2(e). Steps vi and vii are to extract accurate object contour, as shown in Figure 2(f), using the snake model so that the 3D bounding boxes can be further refined. The observation angle is determined as the angle between the camera optical axis and the line connected the centroid of the bounding box and the camera coordinate origin.

Multiclass object segmentation and 3D contour extraction. (a) Stereo image, (b) dense disparity map, (c) depth image (bird-eye-view image), (d) segmentation results, (e) 3D bounding boxes, and (f) contour extraction using the snake model.
BN classification model
A BN is a probability-based graphical network model that allows complex events to be described graphically as a network, and accordingly reason about the causal relationship between the events in a probabilistic manner. Its foundation is graph theory and Bayesian probability theory. It consists of nodes, directed lines, and probability tables. In our BN classification model, nodes represent variables, which are object types and object features (observations). Directed lines indicate causal dependencies between nodes. Nodes can be discrete variables or continuous variables. The nodes are annotated with probabilities. For root edge nodes, these are prior probabilities. Other nodes use a conditional probability table (discrete variables) or conditional probability distribution (continuous variables) to describe the dependencies on the predecessor nodes. The conditional probabilities indicate the strength of causal relationships between the connected nodes. In this work, a hybrid BN containing discrete and continuous variables is used to build the BN classification model. To establish a BN classification model, three aspects of work are involved: (1) how to calculate the posterior conditional probability; (2) how to determine the structure of the network; and (3) how to determine the parameters.
Calculus of posterior conditional probability
The purpose of building a BN classification model is to reversely infer the most likely obstacle type, given the features are measured, that is, to calculate posterior probabilities of the type. The calculus of posterior probability involves calculating the joint probability for the model (probabilities of all combined states for all nodes within the model). To simplify the calculus of the joint probability, BN makes the following three assumptions of conditional independence:
All root nodes in the top layer of a network are independent of each other.
Any two unlinked nodes are independent, given the state of their common parent node.
A node is independent of their indirect parent (grandparent) nodes, given the states of all of its parent nodes.
Figure 3 gives an example of a BN illustrating these three types of conditional independence. The network contains five discrete nodes X1, X2, X3, X4, and X5 with a structure of three layers. In terms of the definition of the three types of conditional independence, X1 is independent of X2. Given the state of X3, X4 is independent of X1 and X2, and X5 is independent of X4, X1, and X2. The following derivation indicates how to calculate the posterior conditional probability P(X1 = true|X5 = true) in virtue of the three types of conditional independence. The Bayesian’s theorem gives

where P(X1 = true, X5 = true) and P(X5 = true) are called marginal probabilities and can be calculated from

and

where P(X1 = true, X2, X3, X4, X5 = true) and P(X1, X2, X3, X4, X5 = true) involve calculating the joint probability of the model. In terms of the definition, the joint probability of this model P(X1, X2, X3, X4, X5) can be calculated from


Three types of conditional independence.
Applying the three types of conditional independence, equation (4) can be simplified as

Substituting equation (5) into equations (2) and (3) makes the calculus of posterior probability much easier.
Structure learning
Structure learning of a BN is to find the close-to-optimum directed acyclic graph (DAG) from a given data set, which reflects the dependent/independent relationship between variables (nodes). This is a non-deterministic polynomial (NP)-hard problem without an optimum solution. But it can be learned using scoring search and constraint-based approach. In this work, we propose NPC algorithm 24 with PC (NPC + PC) to guide the structure learning.
The structure learning has two tasks. One is concerned with the presence of links between nodes; the other determines the orientations of the links. The NPC uses the NPC as heuristic to consider the uncertainty in the χ 2 statistical tests. Instead of randomly determining the directionality of the links that cannot be determined automatically from the data, the NPC allows the user to interactively determine the directionality of undirected links and resolves ambiguous links. The NPC + PC means we apply PCs before using the NPC.
(1) Necessary path condition
Let g be a relative scoring function,
1)
(a)
(b)
(c)
or
2) there exists a recursive complete path (sc-path) of length between a and b.
A skeleton of a BN can only be optimal if it meets the above conditions. However, not every skeleton that conforms to these conditions is indeed optimal. It is only a necessary condition. It says that in order for two variables a and b to be independent conditional on a set V, there must exist a path between a and x in
(2) Ambiguous regions
When two nodes are absent of a link, this link depends on the presence of another link, and vice versa. Assuming these two links to be interdependent, they constitute what we call uncertain links. An ambiguous region is a maximal set of interdependent links. That is, an ambiguous region consists of a set of uncertain links. The main goal is to obtain as few and small ambiguous regions as possible.
(3) NPC + PC algorithm
The algorithm is constituted by seven steps as below: Specify or remove links between the pairs of variables according to experiences. Perform χ
2 statistical tests for conditional independence for all the pairs of variables, except for those pairs with structural constraints specified or removed (as described in step i). Add an undirected link between each pair of variables for which no conditionally independences were found in the skeleton. Otherwise, it combines the definition of NPC to search and generate an undirected graph with many links in its neighborhood of an absent link. Identify colliders and ensure that no directed cycles occur. Enforce directions for those links whose direction can be derived from the conditional independences found and the colliders identified. Remove the undirected links if the marginal or conditional independence hypothesis holds, thus creating an uncertain network structure. Identify ambiguous regions (the remaining undirected links), perform in interaction with the user to solve the uncertain associated with the presence or absence of these links, and ensure that no directed cycles occur.
Parameter learning
Parameter learning of a BN is to determine the conditional probability table of discrete variables and the conditional probability distribution of continuous variables from a given data set. We employ the EM algorithm 25 for parametric learning. In our BN model, the conditional probability distribution of the continuous nodes is represented by Gaussian distribution that can be specified by its mean and variance. If a continuous node has one or more continuous parent nodes, the mean is linearly dependent on the states of these continuous parents.
As shown in Figure 4, the distribution of a continuous variable Y with discrete parents I and continuous parents Z is a Gaussian distribution conditional on the values of the parents

where I represents the discrete parent node of the continuous node Y. i represents the state of I, Z represents the continuous parent nodes (Z
1, Z
2
) of Y.
Conditional Gaussian distribution function for each state of I (where N (m, v) is the Gaussian distribution function with mean m and variance v)

The mean of each distribution function for Y is a sum of a specified mean parameter (intercept) and a weighted sum over the values of the continuous parents. The weights are, respectively, given by the numeric values in Z 1 and Z 2 rows in the table of Gaussian distribution of continuous node Y. Only the mean depends linearly on the continuous parent nodes. Both the linear function and the variance depend on the discrete parents. These restrictions ensure that exact inference is possible. Thus, for each discrete parent, intercept and the variance must be specified as well as the weights for each continuous parent.

An example of a BN, where the continuous node Y has one discrete node (I) and two continuous chance nodes (
Experiments and evaluations
Experiments have been conducted to evaluate the BN classification model and the performance of the whole system using the object detection data set on the public KITTI benchmark. 26
Experiments and evaluation of classification model
Training data set consists of 24,584 objects, including 3006 pedestrians, 18,480 cars, 1573 vans, 922 cyclists, and 603 trucks. Each sample is annotated with its ground truth of obstacle type, length, width, height, and observation angle. Figure 5 shows the typical samples of each class.

Typical sample image of each class: (a) pedestrian, (b) cyclist, (c) car, (d) van, and (e) truck.
Experiments are implemented on an Intel (R) Core (TM) i5-3210 M 2.50 GHz central processing unit. We use Hugin Research 8.1 27 for BN probability propagation and reasoning.
Result of structural training
Before training the BN, we determine the BN model has the following five nodes: Type: describes the type of object: “pedestrian,” “cyclist,” “cars,” “van,” “trucks,” discrete variable, size = 5. Alpha: observation angle of object, ranging [−π π], continuous observation variable. Length: the length of the object, continuous observation variable. Width: the width of the object, continuous observation variable. Height: the height of the object, continuous observation variable.
We first train the BN model with the sample images using the NPC algorithm without applying any PCs. The level of significance is set to 0.05. The link between any two nodes is determined by hypothesis test based on χ 2 statistics. The directions of the links are given to those links, whose direction can be derived from the conditional independences determined and the colliders identified. An uncertain network structure with some undirected links is generated, as shown in Figure 6(a). The remaining undirected links in Figure 6(a) indicate that the causality between the nodes is uncertain. Rather than randomly giving directionality for those links, the NPC algorithm allows the user to interactively determine the directionality by considering prior experiences. In this way, we can give the directionality between length and alpha. The network structure generated by the NPC algorithm is shown in Figure 6(b). The directionalities between the length, the height, and the width are randomly generated that can be considered as ambiguous region.
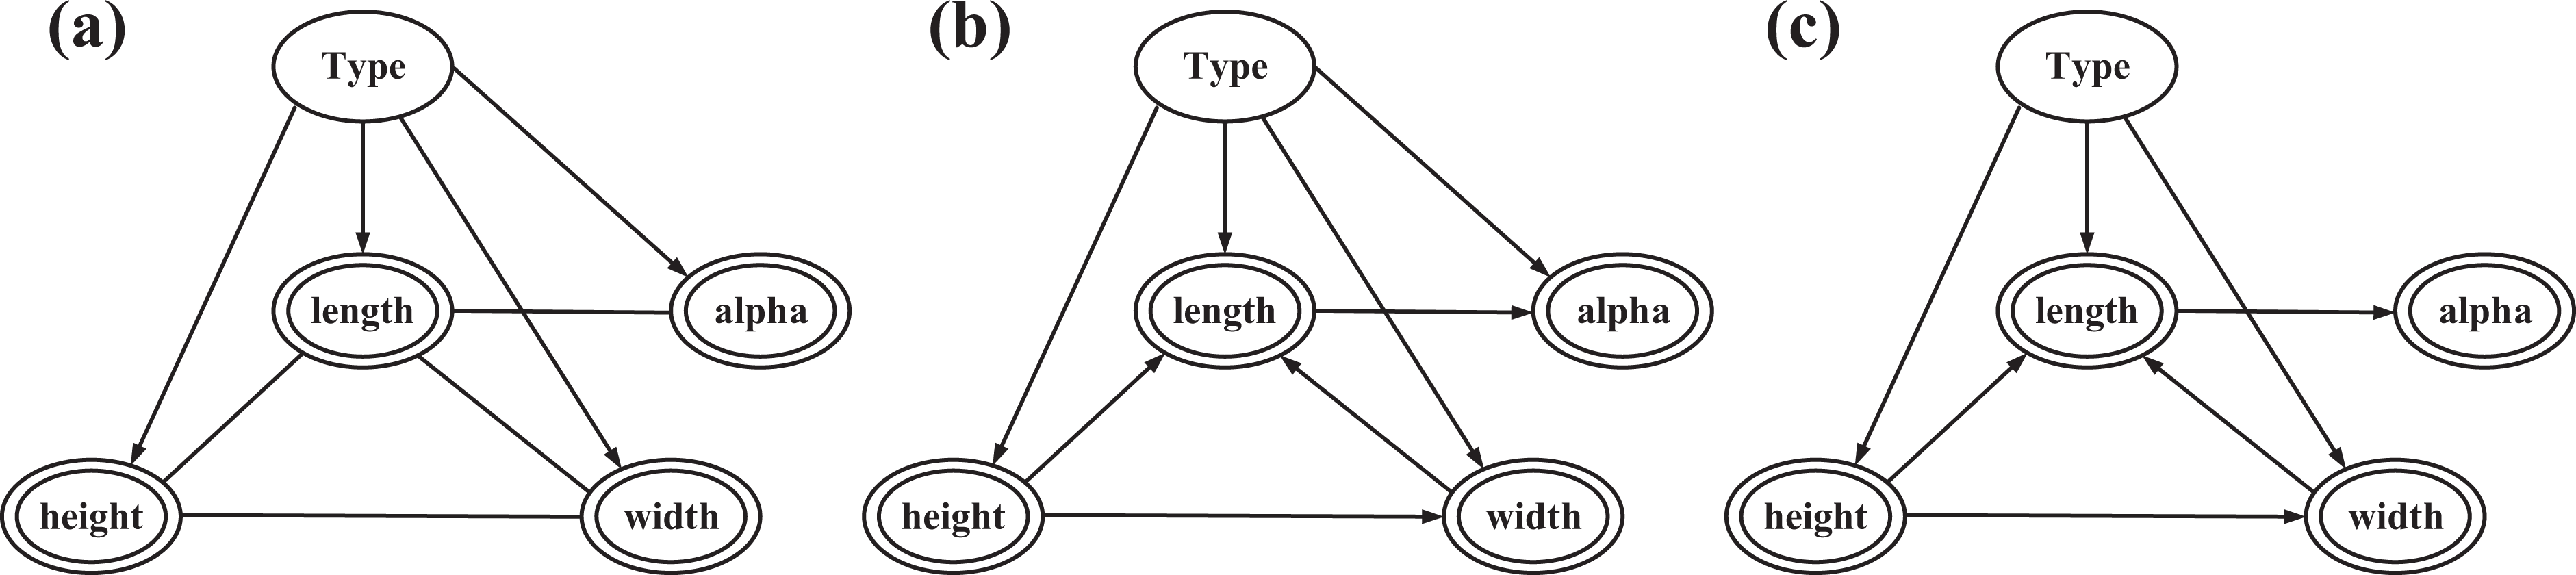
Bayesian Network structure generated by training. (a) Uncertain network structure by the NPC, (b) network structure by the NPC with intervention, and (c) network structure by the NPC + PC. NPC: necessary path condition; PC: presupposition constraint.
According to experiences, the type of object and the observation angle (alpha) have no causality between them. Thus, we apply this knowledge as a PC before applying the NPC, that is, to forcefully remove the link between the type and the alpha. The resulting network is shown in Figure 6(c), which is generated by the NPC + PC.
Result of parametric training
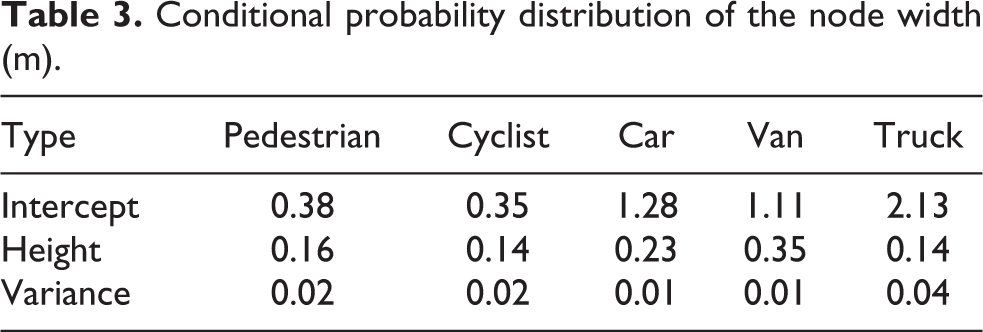
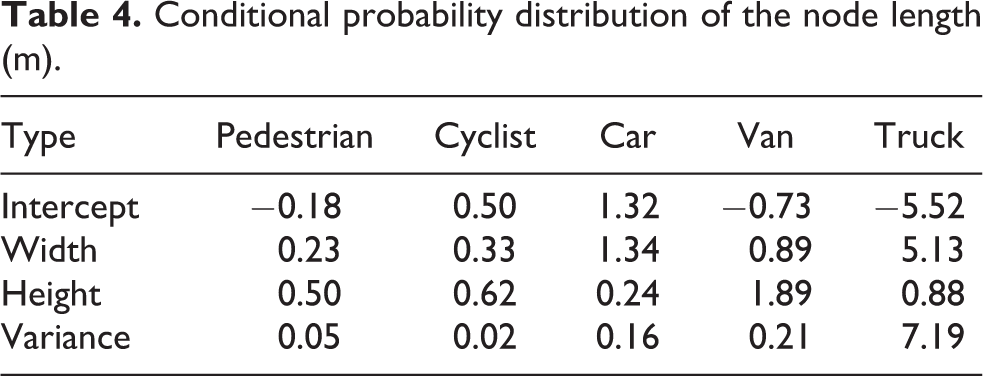
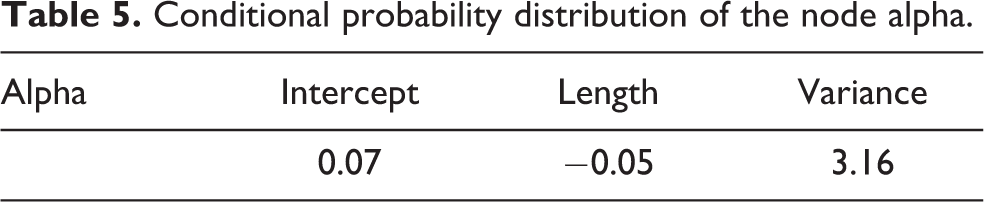
We train the BN model shown in Figure 6(c) with the EM algorithm to determine the conditional probabilities of each node. We set the iteration number as 0 and the convergence threshold as 10−4 so that the learning process ignores iteration number and stops until the convergence threshold is reached. The prior probability table of the discrete variables (type) is provided in Table 1. The conditional probability distribution of four continuous variables is provided in Tables 2 to 5, which are described by continuous Gaussian distribution, as introduced in “Parameter learning” section.
Conditional probability table of the node type.

Conditional probability distribution of the node height (m).

Conditional probability distribution of the node width (m).
Conditional probability distribution of the node length (m).
Conditional probability distribution of the node alpha.
The continuous node (length) in Figure 6(c) has one discrete node (type) and two continuous nodes (height and width). Table 4 provides the conditional probability distribution for the length. The mean of each distribution function for the type is the sum of “intercept” and a weighted sum over the values of the continuous parents, where the weights for all the states of the discrete parent are in the width and the height rows, respectively.
Classification results
The testing sample objects contain 1427 pedestrians, 423 cyclists, 9334 cars, 780 vans, and 301 trucks. The experimental results presented here evaluate the BN model classification performance, assuming the detection is correct.
The resulting confusion matrix generated by the network structure in Figure 6(c) is given in Table 6, which shows the matching degree of the true state and the predicted state. It can be seen that the pedestrian identification has a 100% success rate, while other identifications have some failures. For example, the second line shows that 420 cyclists among 423 samples were correctly classified and 3 of them were misclassified as pedestrian class.
Confusion matrix.
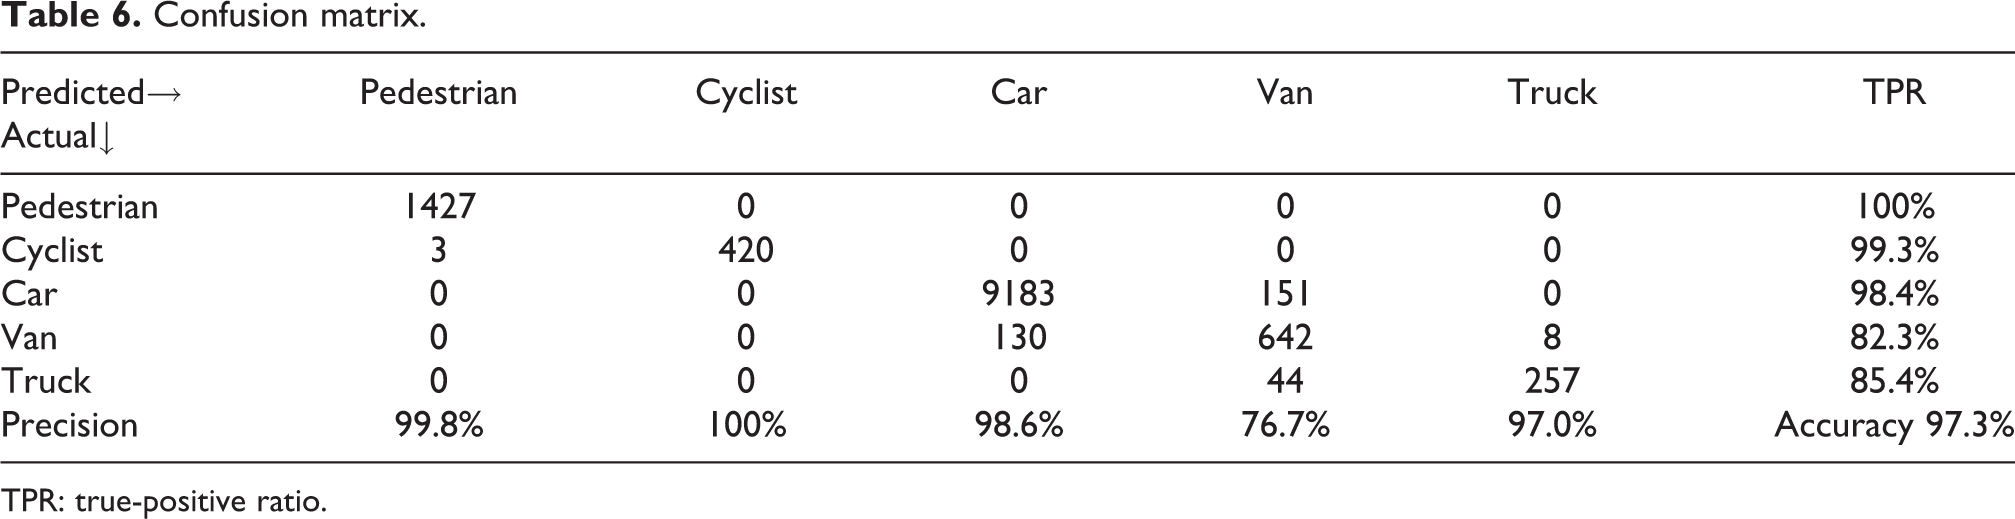
TPR: true-positive ratio.
A comparison has been made on the two BN classification models, that is, the NPC + PC model, as shown in Figure 6(c), and the NPC model, as shown in Figure 6(b). The true-positive ratio (TPR), the false-positive ratio (FPR), the precision, the error rate, and the accuracy are used for the performance comparison and evaluation


where TP represents true positive, FP represents false positive, TN represents true negative, and FN represents false negative.
Table 7 presents the comparison results. TPR indicates the ratio of the number of samples in the class that are correctly predicted and the total number of samples in the class. FPR is the ratio of the number of samples in other classes that are incorrectly predicted as the intended class and the total number of samples in other classes. Precision for a certain class is the ratio of the number of samples in the class that are correctly predicted and the total number of samples that are predicted as the class. The error rate is the ratio of the number of samples in all classes that are incorrectly predicted and the total number of samples.
Comparison of two BN classification model structures (%).
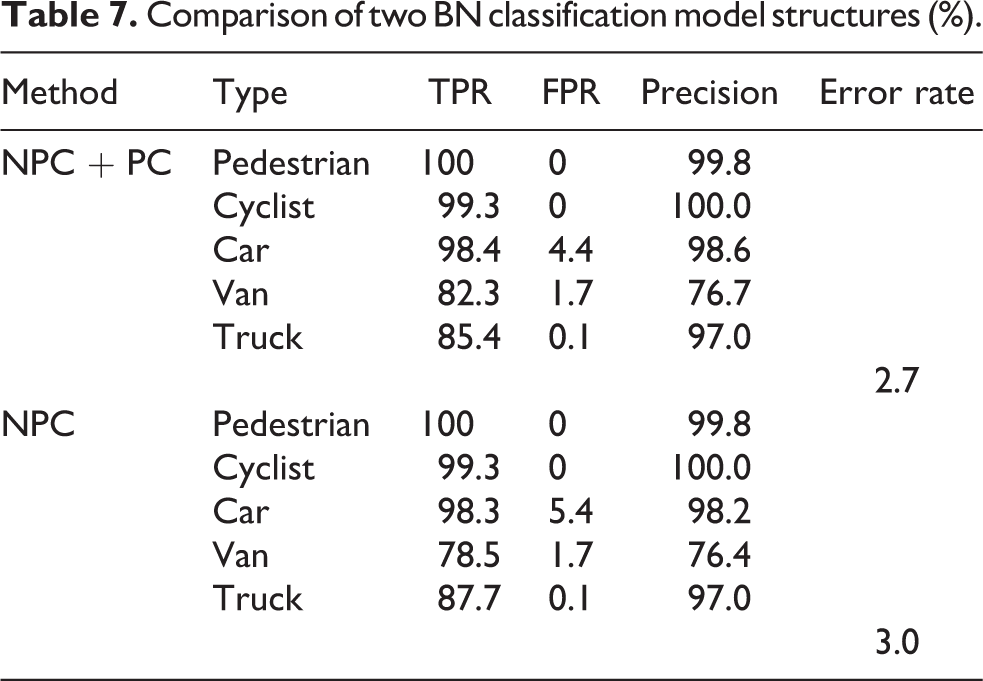
It can be seen from Table 7 that both the methods have similar effect on the classification of pedestrian, cyclist, and truck, but the NPC + PC has a significantly improved classification precision for van and car. The error rate of the NPC + PC is reduced from 3% to 2.7%.
Table 7 also provides that pedestrian and cyclist classes have the lowest FPR and the highest TPR and precision. That means they can be detected more positive samples in a basis of less false detection. Van class has the lowest TPR and the precision. Car class shows the highest FPR. Compared with cars, the pedestrians and the cyclists have more distinguished 3D geometrical size, so they can be more reliably identified. Comparatively, vans are more likely to be misclassified as the car class since they are not significantly distinguished in terms of their shape and size. That is why the van class has the lowest TPR and precision.
Experiments and evaluation of the whole system
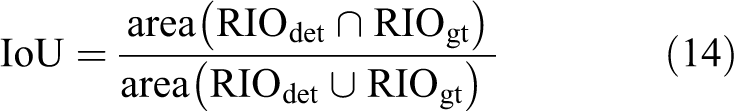
The “Classification results” section proves that our BN classification model can classify the five classes of obstacles with a high accuracy. Actually, the full pipeline including detection and classification should be evaluated as a whole. Therefore, we evaluate our system according to the convention of the KITTI detection benchmark. 26 In the convention, the KITTI detection benchmark categorizes objects into three classes, including car, pedestrian, and cyclist. The evaluation is conducted in three scenario regimes: easy, moderate, and hard, which are defined according to the level of occlusion and truncation.
The following metrics are used for evaluation, including the average precision (AP) and the average orientation similarity (AOS)
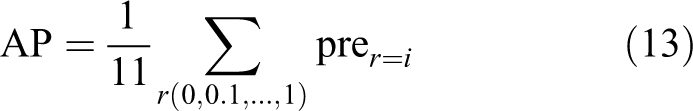
where r represents the recall of the object detection,
where
The AOS is the measure for the object observation angle


where
To show the effectiveness of the proposed method, we compared our method with two traditional methods and four typical CNN-based methods that have been cited in “Introduction” section. The results are provided in Table 8. It can be seen that our method outperforms the two traditional methods 9,10 and the two CNN-based deep learning 16,17 in all scenarios. Compared to the faster R-CNN 13 and the 3DOP, 21 our method is slightly worse. However, it should be noted that our method classifies obstacles into five classes, including pedestrian, cyclist, car, truck, and van, while the two methods only take three classes into consideration, that is, pedestrian, cyclist, and car. In general, our method ranks in the upper middle level of the seven methods.
Comparison with other works (%).
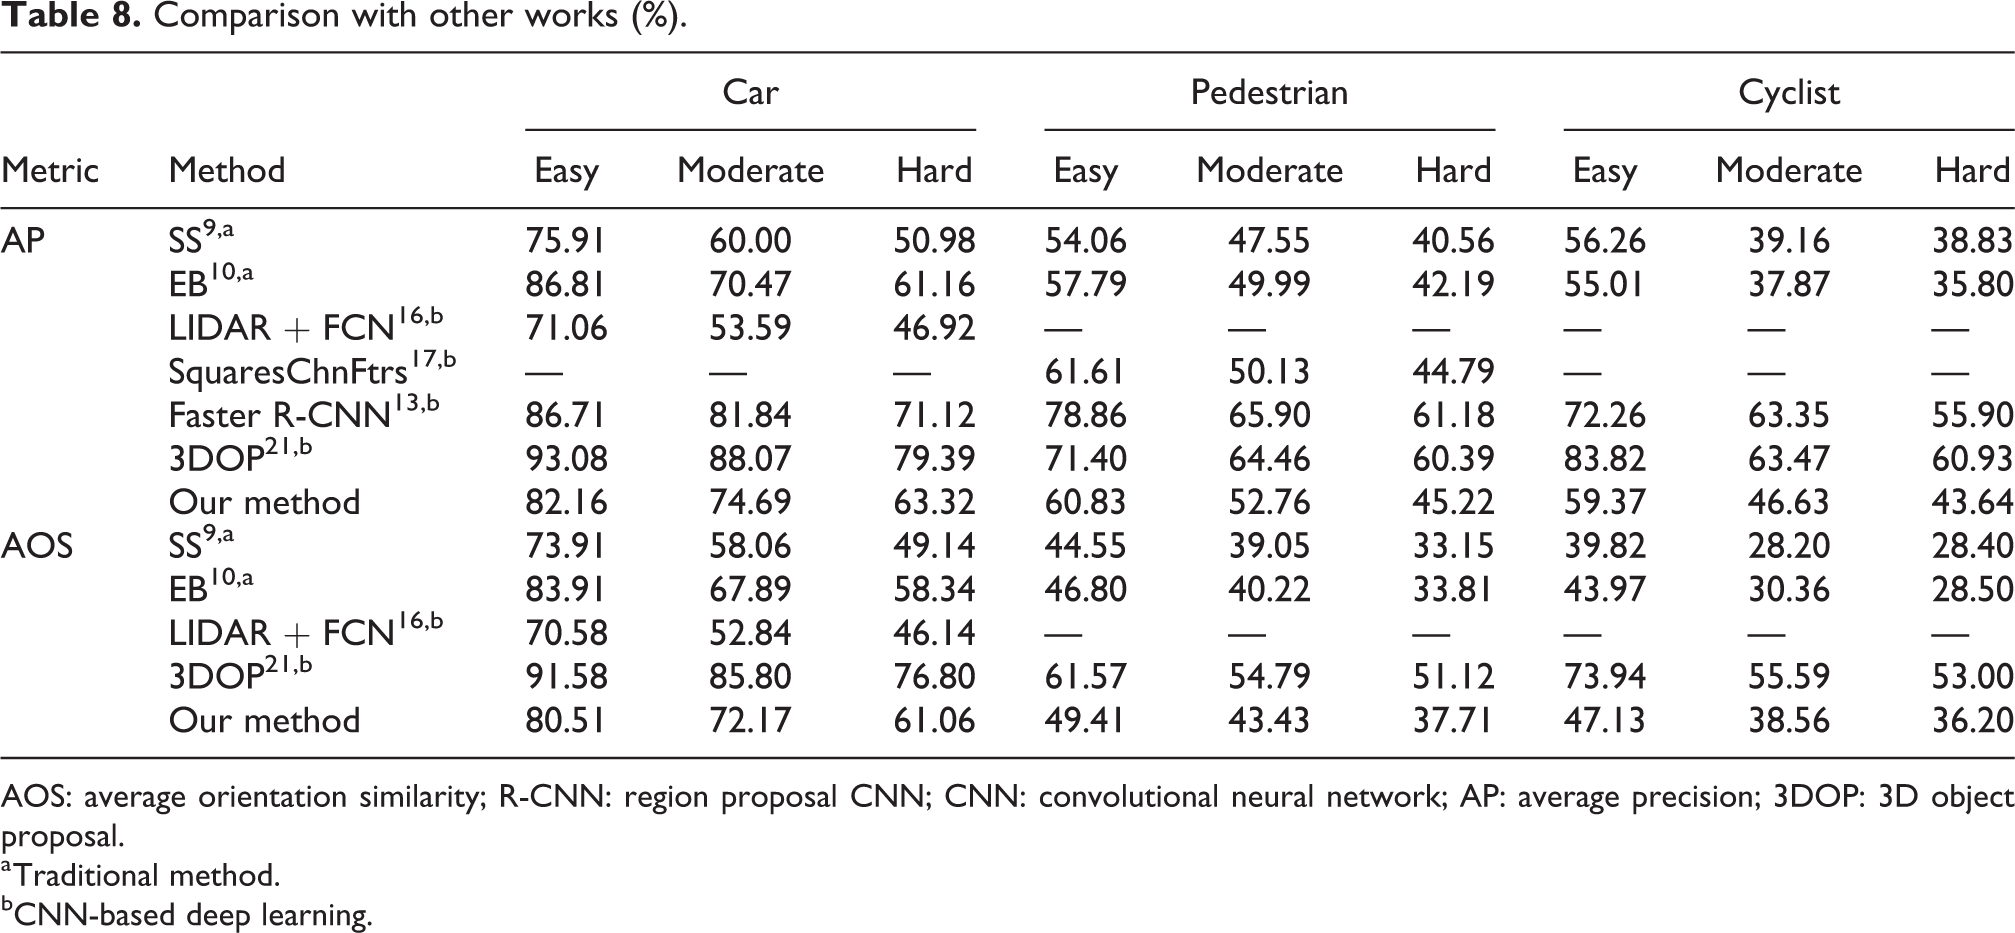
AOS: average orientation similarity; R-CNN: region proposal CNN; CNN: convolutional neural network; AP: average precision; 3DOP: 3D object proposal.
a Traditional method.
bCNN-based deep learning.
Table 9 gives a comparison on the running time per image. Our approach is fairly efficient and takes 0.25 s with similar performance as the faster R-CNN.
Comparison on the running time per frame.

R-CNN: region proposal CNN; CNN: convolutional neural network; 3DOP: 3D object proposal.
a Traditional method.
bCNN-based deep learning.
Conclusions and future works
Simultaneous detection and classification of multiclass obstacles are a challenge for intelligent vehicles. This article presents a novel framework that combines stereovision with the BN technique for this purpose. The stereovision-based method is used to segment objects from traffic background and to measure the 3D geometrical features. The BN is used to establish the classification model. The BN model is trained with substantial data samples using NPC + PC and EM algorithms to generate optimized model structure and conditional probabilities. One of the key points of our model is to interactively determine the directionality of some links according to experiences after generating uncertain network structure, which is infeasible for CNN models. The BN constructed by NPC + PC makes our classification model more reasonable. The experimental results demonstrate that our BN model can classify obstacles into five categories, including pedestrian, cyclist, car, van, and truck. The classification performance is excellent (an overall accuracy of 97.3%) while the full pipeline of the method, including detection and classification, is in the upper middle level compared with other methods.
Our object detection and classification framework are flexible and practical, where each module can be extended and further improved. The future improvements can be conducted in the following aspects: (1) The stereovision-based detection can be enhanced by adapting more robust stereo matching algorithms; (2) the BN classification model can be extended to a dynamic BN to accommodate temporal information; and (3) the BN classification model can be tuned with more accurate empirical knowledge and more features, such as color and motion cues.
Footnotes
Declaration of conflicting interests
The author(s) declared no potential conflicts of interest with respect to the research, authorship, and/or publication of this article.
Funding
The author(s) disclosed receipt of the following financial support for the research, authorship, and/or publication of this article: This work was supported by the National Nature Science Foundation of China [Grant No. 61374197] and Jiaxing Science and Technology Project [Grant No. 2019AD32026].