
Abstract
Many pieces of information are included in the front region of a vehicle, especially in windshield and bumper regions. Thus, windshield or bumper region detection is making sense to extract useful information. But the existing windshield and bumper detection methods based on traditional artificial features are not robust enough. Those features may become invalid in many real situations (e.g. occlude, illumination change, viewpoint change.). In this article, we propose a multi-attribute-guided vehicle discriminately region detection method based on convolutional neural network and not rely on bounding box regression. We separate the net into two branches, respectively, for identification (ID) and Model attributes training. Therefore, the feature spaces of different attributes become more independent. Additionally, we embed a self-attention block into our framework to improve the performance of local region detection. We train our model on PKU_VD data set which has a huge number of images inside. Furthermore, we labeled the handcrafted bounding boxes on 5000 randomly picked testing images, and 1020 of them are used for evaluation and 3980 as the training data for YOLOv3. We use Intersection over Union for quantitative evaluation. Experiments were conducted in three different latest convolutional neural network trunks to illustrate the detection performance of the proposed method. Simultaneously, in terms of quantitative evaluation, the performance of our method is close to YOLOv3 even without handcrafted bounding boxes.
Introduction
With the development of automation and intelligence, intelligent transportation systems and security surveillance systems are widely used in various fields. In those systems, the information of vehicles is inevitably needed to process due to different requirements (e.g. vehicle model recognition, 1 –4 vehicle re-identification (Re-ID) task, 5 –7 license plate recognition, 8,9 occupant violations 10 –12 ). Psyllos et al. 1 utilize license plate recognition to locate the bumper region and then use a set of scale-invariant feature transform (SIFT) descriptors to describe the region information to achieve the model recognition. Fang et al. 2 process the inputs by a coarse-to-fine convolutional neural network (CNN) to obtain the discriminative parts. Specifically, they rely on global and local parts combining feature to vehicle model classification. Additionally, a one-versus-all support vector machine classifier is applied for classification. He et al. 5 obtain the part features by a LocalNet (use YOLO in the experiment) to distinguish the subtle discrepancy. After that, part features concatenate with the global feature as a discriminative feature for the vehicle Re-ID task. Silva and Jung 8 recognize the license plate by CR-NET. CR-NET is similar to YOLO but has better nonlinearity. Artan et al. 10 consider 13 handcraft labeled landmark points to detect the windshield region through the model, which is based on a mixture of trees with a shared pool of parts. Three interesting regions are drawn according to their geometric relationship with the windshield region to detect the violations (e.g. front seat occupancy, driver cell phone usage, and seat belt violation detections) after the windshield localization.
Generally, the information in the windshield and bumper regions is enough for most vehicle tasks. Those regions contain abundant information (e.g. passengers, annual inspection marks, logo, and license plate), as shown in Figure 1. Our brain usually pays attention to the information which is personally interesting. 13 This is also in accordance with the human visual system. Therefore, usually we do not have to pay the computing costs for global information. In most vehicle missions, we only need to use the abovementioned information to achieve the goal. For example, annual inspection marks or unique sundries can provide discrimination information in vehicle Re-ID and vehicle retrieval tasks. Additionally, we also have reasons to believe that the bumper region and logo are more helpful for vehicle model recognition. At the same time, there is no doubt that license plate recognition only relies on the license plate region which is in the bumper region. For the occupant violations detection system, we should pay more attention to the windshield region. The status of occupants can be displayed through the windshield to further recognize the violations. 10
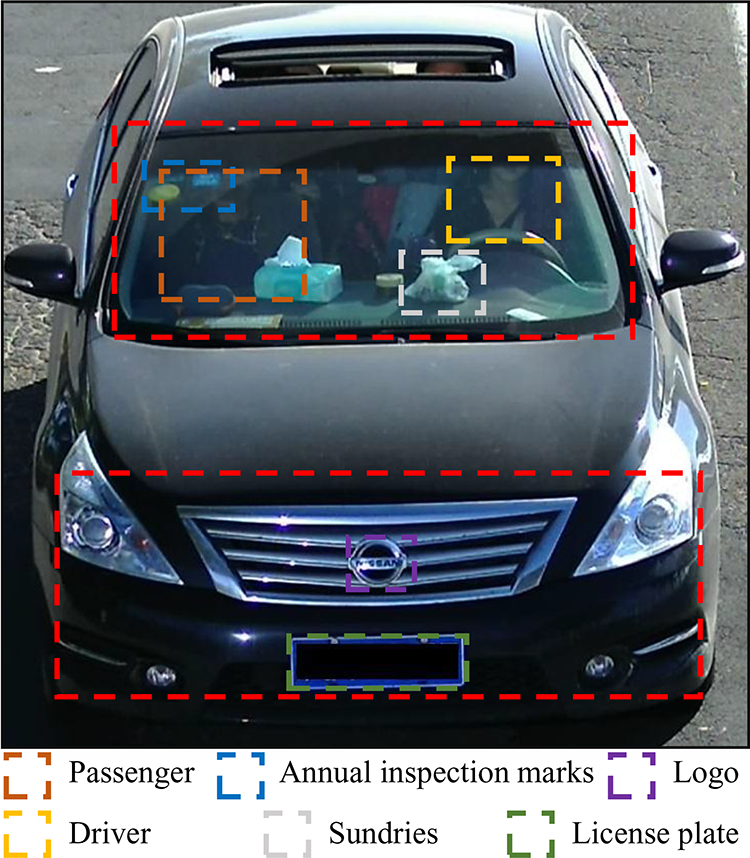
For a vehicle, bumper and windshield regions include most information shown as the red dotted box in the figure. Furthermore, some fine-grain information also marked up by different color dotted boxes. Passenger and driver regions adopt occupant violations detection. Annual inspection marks and sundries regions adopt vehicle Re-ID and retrieval, logo and bumper regions adopt vehicle model recognition, and license plate region adopts license plate recognition. Re-ID: re-identification.
Therefore, a robust windshield and bumper regions detection method can bring positive effects for many tasks, and if it does not rely on handcraft bounding box ground-truth and locates regions simultaneously, then the method will become more general. Although many state-of-the-art works have proposed some methods for the windshield or bumper detection, there is a lack of methods that can detect both regions simultaneously. There are some methods based on the traditional features 11,14 to generate the bounding box, but due to environmental changes, their efficiency and robustness are insufficient. Yuan et al. 11 segment the image by mean-shift firstly. Then the traditional method, Hough transform, is used to extract the windshield region. Finally, the histograms of oriented gradients are used as the feature to detect occupants. These traditional methods are computationally expensive or not robust. Artan et al. 10 combined traditional methods to generate windshield region bounding boxes and used manual annotations to generate windshield models. Similarly, Mountelos et al. 15 propose a fully convolutional network to segment the windshield region, but the model has to fine annotate the data set. Psyllos et al. 1 and Lee et al. 3 detect license plates first and then use the geometric relationship between the license plate region and the bumper region to figure out the bumper region to achieve the model recognition. These methods are sensitive to the position of the license plate and are easy to fail when the license plate is in a special position. Silva and Jung 8 identify the bumper region and the license plate region by two passes architecture CNN to achieve bumper detection. The method is similar to YOLO. It also needs to label the bounding box for training in regression iteration processing. Although Fang et al. 2 generate the bumper region by the feature map-based location and also consider the multi-grain information, they only pay attention to the bumper region for vehicle model recognition. Neither traditional methods nor CNN-based methods focus on multi-attribute-based multi-region detection. For vehicle Re-ID and retrieval tasks, windshield region and bumper region can extract discrimination features for different attributes to enhance the identification accuracy of different objects. Furthermore, the two regions also provide most of the multi-attribute and multi-grain information. Moreover, if local regions can be detected preferentially, the redundant information will be shielded in the subsequent processing and the filtered information can be more efficient and accurate to describe the feature difference.
Therefore, we propose a dual-branch-based architecture to detect vehicle local regions. Moreover, we also embed a self-attention block to enhance the independence of different attributes.
The main contributions of our method are as follows: We use a dual-branch CNN architecture adopt to the multi-attribute and train our model based on multi-attribute labels to obtain the attention map of different attributes in order to detect multi-local regions simultaneously. We propose a positioning method based on multistage pooling, which makes our multi-region detection unnecessary to label annotations. In other words, our method becomes an adaptive detection guided by feature maps. We embed the self-attention block into our framework to make multi-attribute features more independent. Furthermore, we also handcraft annotate 5000 randomly picked testing images; 1020 images for evaluation and the rest for YOLOv3
16
training. The experimental results show that our method achieves significant performance for multi-region detection on vehicles. In addition, the obtained Intersection over Union (IoU) values are close to that of YOLOv3.
The rest of the article is structured as follows: The second section details the proposed method in this article. The third section shows the experiments and compares the performance of our framework under different CNN architectures. Additionally, we compare ResNet-50-based framework with the handcraft annotation-based object method YOLOv3 and offer the result. The fourth section draws the conclusion.
Proposed method
Our method pays attention to the difference between feature maps guided by multi-attribute. Moreover, through our dual-branch architecture, we ensure the generated feature spaces have different regionalities. In other words, different attributes have different local sensitivity. Moreover, we reinforce the feature centralization by the embedded self-attention block and improve the performance. Then, the feature maps are generated from different attribute branches, and both feature maps are input into the proposed positioning method, so as to achieve adaptive acquisition of the bounding box. Furthermore, we pay attention to the preference regions of ID and Model label. The preferred regions for those labels are the bumper and windshield regions, both of which are invisible from the side, so we do experiments on PKU_VD 17 data set where all the images are front views. We will detail our method from four parts: dual-branch architecture, loss function, self-attention block, and the proposed position algorithm.
Dual-branch architecture
Currently, many state-of-the-art methods often make use of multi-attribute, 17 –20 but they lack attributes-guided multi-branch architecture. In multi-attribute tasks, a single-wire structure network can only generate one feature corresponding to each sample, but it must be associated with multi-attribute labels at the same time. For example, a sample and an anchor sample have the same model but different IDs. If we employ triplet losses in a single architecture network, the pair of features should be closer in model classification triplet loss and farther in ID classification triplet loss. The distance between the same pair of features cannot be increased and decreased at the same time. Inspired by some multi-branch architectures, 17,21 we propose a multi-attribute-guided dual-branch architecture. Different attributes have the same feature space under shallow, but they may have completely different feature spaces under depth. So we emphasize the transformation of the architecture. The features of different attributes become more independent and more consistent with their respective labels through the multi-branch architecture in our work. Hence, we separate our framework into dual-branch at the deep layer, as shown in Figure 2.

The pipeline about the proposed method. Gray trapezoids denote CNN downsample blocks, gray rectangles denote self-attention blocks, blue rectangles denote mathematical operators, and brown rectangle denotes positioning block. CNN: convolutional neural network.
It is necessary to declare that the gray trapezoid denotes the downsample block, the gray rectangle denotes self-attention block, and the blue rectangle denotes mathematical operator. We compare the performance of different operators in the experiment. The brown rectangle denotes the proposed positioning method. Our method feeds the input to a parameter-sharing block and then uses the output of the parameter-sharing block as inputs to different attribute branches (ID and Model are used in our experiments.). After the corresponding self-attention blocks and operators, these features are converted into heatmaps. Finally, by processing the heatmaps through the proposed positioning block, detection boxes corresponding to different attributes can be obtained.
In the training stage, we leverage multi-attribute and aim to separate the features as much as possible, so we combine the triplet loss and cross-entropy loss as the cost function. Many works prove that triplet loss is suitable for obtaining independent features.
17,19,22,23
Additionally, we sort the input as
Loss
Multi-attribute information is employed in our method. The Model and ID labels guide the training. Generally, there is no interference between different attributes, thus the contradiction caused by the interference is always ignored. In our case, Model and ID have interference. The triplet loss as part of the cost function contains the relationship among anchor sample, positive sample, and negative sample. It can make the features generated by the same attribute appear closer but the features generated by different attributes farther. When there exists an interference between different attributes, the conflict will appear. An example is shown in Figure 3. For instance, vehicles have the same Model attribute but different ID attributes. It means that although the positive samples have the same Model attribute with the anchor, they still may have different ID attributes with the anchor. In Model triplet loss, the distance from the anchor sample should be small, but in ID triplet loss the distance should be large. But an input image can only generate a corresponding feature through the CNN, so it will cause conflicts under multi-attributes. Therefore, we propose a dual-branch architecture to resist the conflict.

The visualization of the conflict. The left image has the same ID with anchor image and the right image only has the same model with anchor image. In ID triplet loss, ℓ1 tends to be smaller and ℓ2 tends to be bigger. In Model triplet loss, ℓ1 also has the same tendency but ℓ2 tends to be smaller. ℓ2 has different tendencies in different attribute triplet losses. That is unreasonable.
For classification, we employ the cross-entropy with a label smoothing regularizer 24 as the loss. We can formulate it as follows

where ε is a smoothing parameter, t equals 1 if the label is the ground-truth, N is the number of classifications, and pn denotes the logits or unnormalized log probabilities of the nth classification for the sample.
For triplet loss, we divide the input into three groups:

where

where

where ω denotes the weight coefficient.
Self-attention block
Inspired by some state-of-the-art works about self-attention in computer vision, 26 –28 we embed the self-attention block 29 into our framework. The framework about the self-attention block is shown in Figure 4. The attention mechanism originates from the human visual system. Humans often focus on the fine-grained local information of the fuzzy space range through the coarse-grained prior information of the global image. We employ the self-attention to calculate the weight of each feature by training.

The framework about the self-attention block.
Firstly, we map the input feature map through three convolution layers with
In our experiments, we compare the performance of two different

Then the results of both combination strategies will be shown in the “Experiments” section. We will also show a comparison of self-attention and without self-attention frameworks. We can see that heatmaps generated by the self-attention blocks become more concentrated. Furthermore, in the experiment, we also observed that the application of self-attention can slightly accelerate the convergence of the model in training.
Positioning
After we get the attention heatmaps, we locate the region by the proposed method called multistage pooling-based positioning (MSPP). The pseudocode of MSPP is shown in Algorithm 1, which aims to explain the mechanism of the part positioning.
The multi-attribute corresponding heatmaps are expressed as Hm
and Hv
, respectively. Both heatmaps are inputs of the MSPP. Hm
corresponds to the Model branch, and Hv
corresponds to the ID branch. For the two branches, their heatmaps are generated by combining their respective self-attention maps with
The framework of part positioning.


The part positioning block can implement region detection without handcraft bounding boxes. Moreover, the obtained regions have attributes preference.
Experiments
Data set and setup
We do our training and evaluation on PKU_VD data set. In PKU_VD, there are two subsets, VD1 and VD2. Both subsets are huge data sets and they have the same data structure. The training set of VD1 has 70,591 vehicle IDs and 1232 Models. The training set of VD2 has 39,619 vehicle IDs and 1112 Models. Moreover, the training set of VD1 has 422,326 images and VD2 has 342,608 images. Since VD1 has more images and classifications, it has more advantages in generating multi-attribute private functions. Therefore, we chose VD1 as the experimental data set. Furthermore, we strip out some IDs which have less than 12 samples. But that will not weaken the performance. On the contrary, it improves training efficiency. Finally, 160,000 images remain as our training set, which contains 8633 IDs and 863 models.
In the training stage, we employ ImageNet pretrained weights as our initial parameters to fine-tune our model. We set our batch size as 160. There are 16 randomly picked ID classes in one batch and each ID has 10 randomly picked images. In addition, we resize all images to 224 × 224 × 3 as inputs. And we normalize and flip inputs during data initialization in order to optimize the training and enhance the data. Furthermore, we manually set the learning rate. To ensure that the objective function can jump out the previous optimal point, we increase the learning rate follows equation (6) in the first 20 epochs. Then it drops to one-tenth every 60 epochs until the model converges. We set the margin of equation (2) to 0.3 and set ω of equation (4) to 1

Besides, we randomly pick 5000 images from the testing set, and draw the handcraft bounding boxes, and then employ IoU as a quantitative evaluation function. Because we use fixed kernel size pooling layers in the positioning, we also draw fixed size handcraft bounding boxes to ensure fairness. It is reasonable because all images in the data set have a similar vehicle-to-background ratio. In the rest of this section, we will show the ablation experiments of self-attention block and instantiate the results of our positioning. Furthermore, we also compare the performance of our method with different state-of-the-art CNN network backbones. Additionally, we also compare our ResNet-50-based method with the deep learning method YOLOv3. IoU is employed as a quantitative evaluation index and we also show the detection results in instances. Finally, we show some failure cases and give the analysis.
Evaluation criteria
We employ IoU as the quantitative evaluation index in our evaluation. It is widely used to measure the accuracy of a method in the object detection task. The calculation of IoU is related to two sets of bounding boxes, the ground-truth bounding boxes and the predicted bounding boxes from the trained model. So we randomly pick 5000 images from the testing set of PKU_VD and draw their handcraft ground-truth bounding boxes to calculate IoU. We can formulate IoU as the following equation

where p denotes the predicted bounding box and gt denotes the ground-truth bounding box. In other words, IoU is a ratio of the overlapping area of p and gt to the total area.
In our experiments, each sample needs to detect two local regions, the bumper region and the windshield region. We calculate IoU for them and expressed as IoUm and IoUv , respectively. Then the overall IoU all can be formulated as follows

where λ denotes the weight and set to 1. Finally, IoU all is used as the evaluation function in our ablation and comparison experiments in the next two sections to convenience for quantitative comparison.
Ablation analysis
As we mentioned above, the dual-branch architecture can help the features of different attributes become more independent and more consistent, the self-attention block can let the generated heatmaps become concentrating and also can accelerate the training convergence speed. So we show the performance comparison of different architectures and show the influence of the self-attention block in this section. In addition, we compare the performance of two different self-attention combining strategies that are formulated in equation (5). Moreover, we embed the self-attention block into a suitable place of the framework in order to maintain the number of the parameters in a reasonable range. If the insertion position is too shallow, the self-attention block cannot act on multiple attributes due to our dual-branch architecture. Conversely, if the insertion position is too deep, the number of parameters will increase significantly due to the increase of feature dimensions. Through experiments, we also discover that different insertion positions of the self-attention block do not significantly influence results.
It should be noted that in ablation comparing, we employ ResNet-50 as our backbone. In dual-wire architecture, we embed the self-attention block and separate the framework after Cov4_x layers, and choose the outputs of the self-attention blocks from both branches as our comparative heatmaps. For fairness, in single-wire architecture, we also choose the feature map after Cov4_x as our comparative heatmap, as shown in Figure 5. Besides, we also calculate IoUall values of those different networks for quantitative comparison and the results are shown in Table 1. We compare four different networks to prove the effectiveness of our dual-wire and self-attention block. As can be seen from the table, dual-wire architecture brings surprising improvement, and self-attention brings more concentrated heatmaps especially on the heatmap generated by the Model branch. From Figure 5, we can see that the heatmaps of the dual-wire O are more sparse, which may cause the obtained bounding box to deviate easily. On the other side, the heatmaps of dual-wire O + 1 are denser in the detected region, thus the bounding boxes will be more accurate and robust. Furthermore, the heatmap from the ID branch has higher heat values in the personalized local region at the windshield even both heatmaps are similar. Finally, we can make a conclusion from our results, the dual-wire O + 1 strategy is more satisfactory and it has the best performance. So we compare the performances of different backbones under dual-wire O + 1 strategy in the next section.
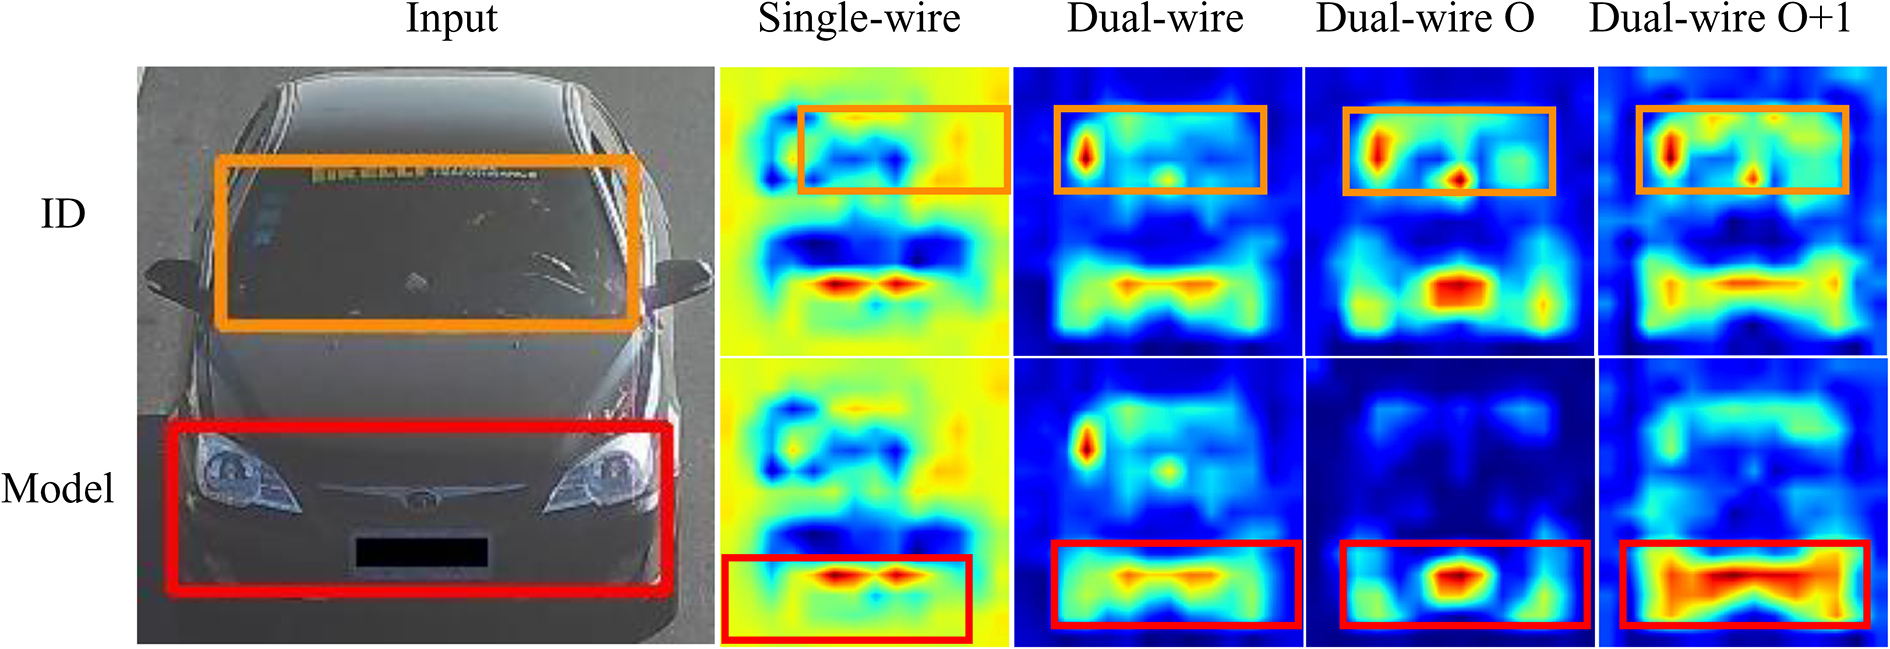
The results of four different architectures. Single-wire architecture has one line, dual-wire architecture has two lines which have partly sharing parameter layers, dual-wire O architecture is embedded self-attention follows the second combination in equation (5), and dual-wire O + 1 is embedded self-attention follows the first combination in equation (5). The image on the far left is the input with ground-truth bounding boxes. The smaller images in the top row on the right are heatmaps from the ID branch, and the bottom row images are the heatmaps from the Model branch. The yellow rectangle is the region of the windshield which is obtained by our architecture, and the red rectangle is the region of the bumper.
Results of different architectures (IoU all).

IoU: Intersection over Union. The bold-faced value is the maximum value of each column and means the method has the best performance.
Comparison
In this section, we compare the performance of our method with different CNN backbones. Three state-of-the-art CNNs are used in the comparison, namely VGG16, 30 GoogLeNet, 31 and ResNet-50. 32 Although they are all CNN frameworks, they differ in terms of structural details, number of parameters, performance of different tasks, and so on.
We insert self-attention block into a similar place in three compared architectures in order to be fair. We insert the self-attention block after the 10th weight layer in VGG16. And we insert the self-attention block after inception module 4e in GoogLeNet. In ResNet-50, we insert the self-attention block after cov4_x. Meanwhile, we also choose the output after self-attention block as our heatmap of every architecture. The local region detection results are shown in Figure 6. And we also quantify the comparison through IoUall and shown as Table 2.

The local region detection results of the proposed method under different CNN backbones. First row images are the samples of handcraft ground-truth bounding boxes. Rest rows show the results when ResNet-50, GoogLeNet, and VGG16 as the backbone successively. CNN: convolutional neural network.
Results of different backbones.

IoU: Intersection over Union. The bold-faced value is the maximum value of each column and means the method has the best performance.
As shown in Table 2 and Figure 6, ResNet-50 as the backbone network can always achieve the best performance. Although the ResNet-50-based architecture has the best quantitative evaluation and best instance performance, the computational complexity is higher than that based on GoogLeNet. Furthermore, VGG16-based architecture has a high computational complexity and the performance is worse than the other two. Nevertheless, our method still has robust and satisfactory performance in instance experiments, as shown in Figure 6.
We can give the conclusion that those three CNNs have obtained satisfactory regions detection with our multi-attribute self-attention guided dual-wire architecture. It can be seen from the evaluation function results that ResNet-50 has better results.
We also compared our method with the popular object detection method YOLOv3. But our method does not need to label the handcraft annotation. It costs a lot of resources. Compared with that we prefer to have a pure image data-driven object detection. Additionally, the essence of the two is also different. YOLOv3 achieves object detection through the feature similarity. But our method achieves the object detection through the feature discrimination. This is also due to the use of different type of labels as the training basis. We also provide the comparison results which are shown in Table 3.
Results of YOLOv3.

IoU: Intersection over Union. The bold-faced value is the maximum value of each column and means the method has the best performance.
Although our method does not rely on handcraft bounding boxes, the performance is close to YOLOv3 and even better on IoUm than YOLOv3. In addition, YOLOv3 detects the bounding box by regression, so the number of detected bounding boxes is inconstant. As shown in Figure 7, both the upper left image and the lower left image do not detect the windshield region and bumper region, respectively. The image in the lower right directly lost all regions. An additional windshield region was detected in the upper right image, and it was wrong.

The failure instances by YOLOv3.
Cases analysis
In this section, we show the results of some samples in Figure 8. It can be seen intuitively that the proposed architecture is robust in various environments. For example, our proposed architecture also has satisfactory local regions detection performance under point of view shift, occlusion, lighting changes, and so on. And our method is robust enough in those environments. The obtained bumper region can almost cover the areas which include valuable information like logo, license plate, and lights. And obtained windshield region can almost cover the areas of passengers, annual inspection marks, and decorations. Those regions precisely have the most important personal information for a vehicle and they can also be used in various vehicle tasks. Furthermore, from our experiments, it is obviously shown that our architecture is easily portable into various CNNs.
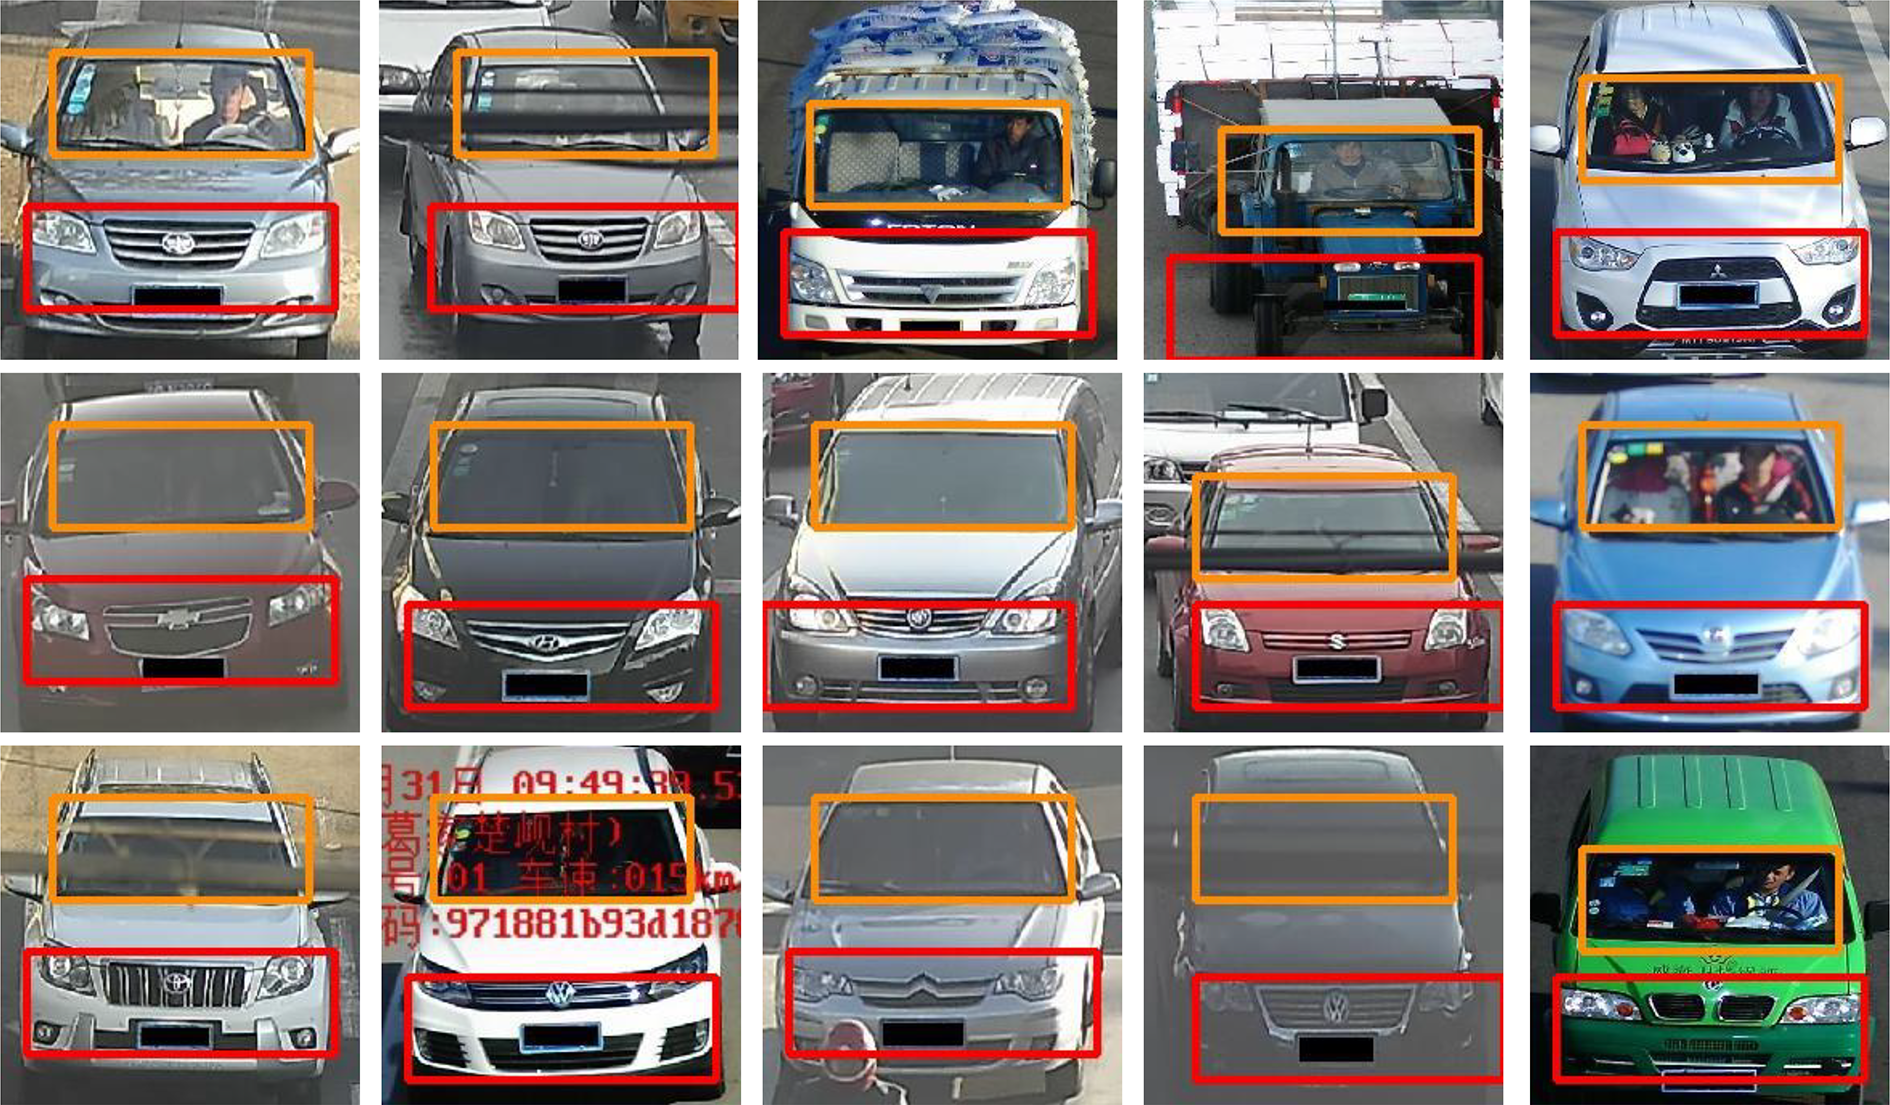
The local region detection results of the proposed architecture when ResNet-50 as the backbone.
We also show some failure cases through Figure 9. Although our method is sufficiently robust in most environments, there are still failures in real and complex environments. The left-top sample in Figure 9 shows the case of region missing cause by the longitudinal tensile. So, image distortion is negative to performance. The right-top sample in Figure 9 shows the case of region missing cause by the camera translation. It is no doubt that a complete input benefits detection. Furthermore, the structure of the training data set may also cause the detected bounding boxes to shift, which is similar to the left-bottom sample in Figure 9. Although our method has been robust for point of view change, the excessive rotation can bring the information loss, which will cause the detected bounding box deviation shown as the right-bottom sample in Figure 9.

The failure instances. There are four different types of failure instances shown in the above figure.
Conclusion
We propose a portable and multi-attribute self-attention guided dual-wire architecture for vehicle local region detection. Our method has achieved satisfactory results whether quantitative or qualitative indicators. We realize local region detection training without handcraft bounding boxes. It means that we can adaptively generate the different attributes corresponding region with the help of self-attention block and proposed MSPP. Although our method achieves satisfactory performance on reconstructed PKU_VD data set, it may fail on data sets that have inconsistent vehicle-to-background ratio. This is caused by a fixed scale pooling layer.
In future work, we will focus on how to use the adaptive kernel size pooling layer in our architecture to achieve the adaptive local region detection.
Footnotes
Declaration of conflicting interests
The author(s) declared no potential conflicts of interest with respect to the research, authorship, and/or publication of this article.
Funding
The author(s) disclosed receipt of the following financial support for the research, authorship, and/or publication of this article: This work was supported by the National Key R&D Program of China under grant 2018YFB1305200, and the National Natural Science Foundation of China under grants U1509207, 61876167, and 61802348.