
Abstract
Pedestrian detection is a particular case of object detection that helps to reduce accidents in advanced driver-assistance systems and autonomous vehicles. It is not an easy task because of the variability of the objects and the time constraints. A performance comparison of object detection methods, including both GPU and non-GPU implementations over a variety of on-road specific databases, is provided. Computer vision multi-class object detection can be integrated on sensor fusion modules where recall is preferred over precision. For this reason, ad hoc training with a single class for pedestrians has been performed and we achieved a significant increase in recall. Experiments have been carried out on several architectures and a special effort has been devoted to achieve a feasible computational time for a real-time system. Finally, an analysis of the input image size allows to fine-tune the model and get better results with practical costs.
Keywords
Introduction
Object detection is a central problem in Computer Vision. Its goal is to detect the location and class of each object in images or image sequences. Applications include person identification, video surveillance or autonomous car driving, among others. Regarding the last one, pedestrian detection constitutes one of the most challenging tasks to perform in terms of on-road object detection for two main reasons. First, pedestrians are the most vulnerable users of the road, with any accident potentially causing them major injuries, and even death. Second, their intrinsic variability (people of different shapes in different clothes, poses and light conditions) makes it especially difficult for vision-based recognition systems to detect them precisely and confidently. Therefore, despite recent large improvements in accuracy, the pedestrian detection task still has several difficulties that require more dedication on design, optimisation and evaluation. 1
Over the last 15 years, many tries to reach a strong pedestrian detector have been carried out. First attempts included the use of traditional algorithms for this purpose, such as AdaBoost and Cascade based detection structures, known as Viola–Jones 2 or Histogram of Oriented Gradients plus Support Vector Machine structures, 3 with very poor results, especially when considering small, occluded or cropped pedestrians. Later, more refined, ad hoc algorithms were proposed: Deformable Part Model, 4 Integral Channel Features, 5 Locally Decorrelated Channel Features 6 or Fast Feature Pyramids, 7 with better results. Nevertheless, they still rely on carefully designed features. Finally, over the last few years, major improvements have been achieved in terms of quality and confidence in pedestrian detection, 8 many of them based on Machine Learning (ML) techniques, mainly Neural Networks, such as Rich Feature Hierarchies (R-CNN), 9 Deep Parts, 10 Faster R-CNN, 11 Single Shot Multibox Detector (SSD) 12 or You Only Look Once (YOLO). 13 –15
However, not only there are variability constraints that make it hard to overcome human-like performance at detecting pedestrians in an automotive task, but also high computational power demands that Convolutional Neural Networks (CNN) pose. Because of that, some methods put special efforts into getting fast detectors (throughput), while others are focused on achieving state-of-the-art results in terms of detection quality (precision and recall, among other metrics).
These detectors can be classified as two-stage and one-stage methods. Two-stage algorithms predict detections in two phases: they use spatial features at pixel level to extract some Regions of Interest, and then use a second phase to classify all the proposals to decide if each region is a pedestrian or not. These methods usually produce better detection results, but they are more computationally expensive, 16 thus being less used in real-time (RT) detection tasks because of the limited computational power of most of the resource-constrained devices usually installed on-board. For these reasons, one-stage methods are very common: they use a single phase to detect relevant objects of many aspect ratios at multiple scales in the image. One-stage detectors involve lighter algorithms that are much more suitable for the available on-board hardware, but traditionally offer slightly worse detection accuracies. However, thanks to the special effort put into them, their detection quality tends to get closer to their two-stage counterparts. 15
Regarding studies on one-stage detectors for pedestrian detection, some articles can be found on literature but they tend to focus on one single database for INRIA 17,18 and KITTI. 19 In this article, we train and fine-tune YOLOv3 algorithm and apply it to multiple recent, on-road image databases, and consider a set of indicators to assess performance.
The article is organised as follows. First, the most commonly used databases for on-road tasks are presented. Then, a selection of the best one-stage detectors are described and a comparative analysis is performed. Later, performance and throughput of the analysed detectors is reported for a variety of architectures also including resource-constrained hardware. Also, an ad hoc training with reduction of the number of categories has been carried out for YOLOv3, achieving a significant increase in recall. Also, an analysis of the input image size is performed allowing to fine-tune the model. Finally, conclusions and future work on the topic are described.
Databases
Although generic-class databases, such as COCO, 20 are the starting point to develop general detection algorithms, we focused our effort on specific on-road and human image databases. After extensive research on the literature of the last 10 years and according to the number of images, number of categories, dissemination and usefulness, we have selected a subset of specific on-road databases that comprises Caltech-USA, 21 Daimler, 22,23 EuroCity Persons (ECP) 24 and nuScenes. 25
First, Caltech is chosen for its generality and size, including a variety of environmental conditions, such as rain, fog or variations of lighting, and the fact that its images are continuous sequences with more than 1200 unique pedestrians.
Besides, Daimler is a well-known, established dataset focused on pedestrian detection consisting of black and white (B/W) equalised images from a long video sequence.
ECP dataset is one of the most diverse and large automotive person dataset, including data from the 4 seasons, 12 countries, 31 cities, with high pedestrian density. The dataset comprises day and night images, with different weather and adverse lighting conditions, and its focus is on vulnerable road users (VRUs).
Finally, nuScenes is a very novel, public large-scale dataset for autonomous driving. It includes data from the full sensor suite of a self-driving car (RADAR, LiDAR, cameras, IMU and GPS), with more than 1.4 million camera images, and it provides manually labelled annotations for 23 classes, including VRUs.
Therefore, the databases used are joined to obtain a complete dataset that tries to represent as much variability as possible including different image sizes and aspect ratios, weather conditions, cities and roads, and a wide range of light conditions (see Figure 1).
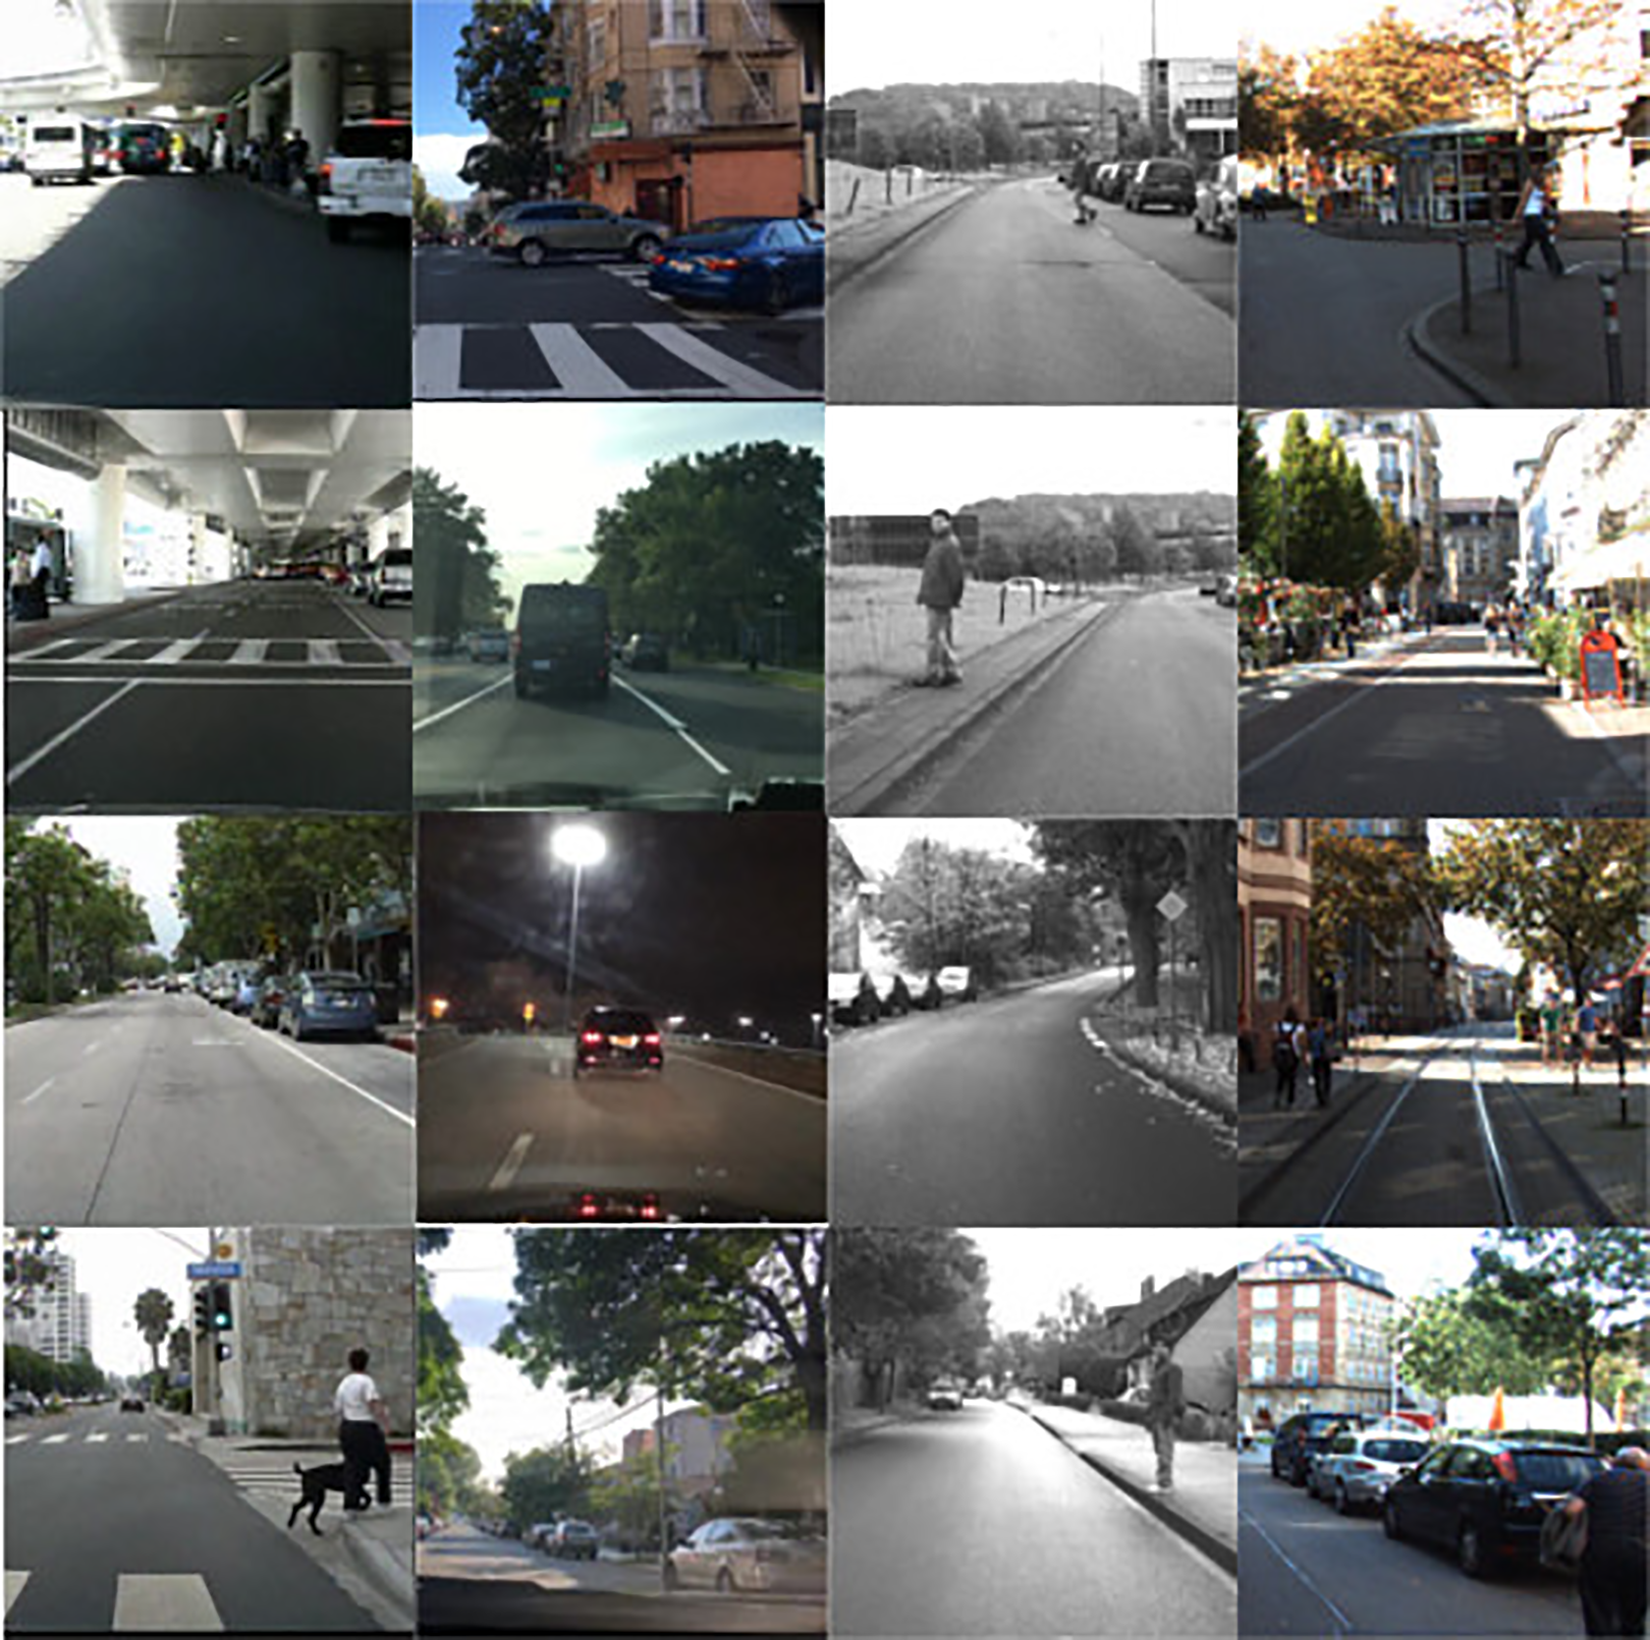
Samples of the databases used.
Algorithms
To test the databases selected for the experiments, we used some of the state-of-the-art generic detectors suitable for RT environments. These include SSD, 12 Mobilenets, 26 Spatial Pyramid Pooling YOLOv3, 27 YOLOv3 416 and YOLOv3 608. 15 All these detectors have been trained on generic datasets including objects such as ‘person’. Therefore, we were able to use the pre-trained models directly to perform our experiments.
Redmon and Farhadi proposed YOLOv3 15 : a one-stage detector which leverages its fully convolutional structure to create a predictor for images of any shape. It divides an image into grids at three different scales creating three grids of sizes 13 × 13, 26 × 26 and 52 × 52 (see Figure 4). Each cell of the grid is responsible for predicting up to three bounding boxes for objects whose centre pixel is within the cell. The bounding box format is

in which x and y are the shifts relative to the top-left corner of the cell; w and h are width and height of the bounding box relative to some preselected anchor boxes; c is the confidence YOLOv3 estimates for the detection and
SPP YOLOv3 27 is a modification of the YOLO-like architecture in which the last pooling layer is replaced by a Spatial Pyramid Pooling layer. YOLO’s pooling layer output size relies on the input image size, thus preventing the usage of a fully connected network at the end of the pipeline. Conversely, the Spatial Pyramid Pooling layer divides the feature map into a N × M grid and performs a max-pooling for each cell of the grid, giving an output size independent to the dimensions of the input image.
Mobilenets 26 is a lightweight CNN designed for resource-constrained platforms, such as mobile systems. It includes the concept of depthwise separable convolutions into one-stage detectors. These sort of convolutions represent a variant of the classical convolution with reduced computational costs. This allows the architecture to run in RT even on non-GPU resource-constrained systems.
Experiments
In terms of pedestrian detection, not only should we take into account detection performance, but also throughput, since speed is crucial to confidently implement a detection on-board system. For this purpose, first we go through the most widely used metrics to assess performance and throughput of a detector. Then, the behaviour of some detectors when applied to some important datasets is analysed. After that, results on training one of the best algorithms (YOLOv3) are presented in order to refine its detections. Finally, we modify an important CNN parameter (grid size) from this detector to evaluate how it affects performance.
Metrics
Common metrics usually used to assess object detection performance are the following

where TP, FP and FN stand for True Positives, False Positives and False Negatives, FPPI stands for False Positives per Image and MR for Miss Rate. Therefore, scanning the confidence threshold, the MR versus FPPI and Precision versus Recall curves are obtained.
Finally, summarising particular parts of the curves, three performance measures can be defined


with LAMR standing for Log-Average Miss Rate and AP for Average Precision, with lower values being better for the first one and higher for the other two. Besides, F1max_score represents the maximum value for F1-score at all recall values.
Detection results
Pedestrian is the most difficult instance to detect on a driving task and represents the most vulnerable users on the road. The so-called reasonable subset was established as unoccluded or partially occluded (up to 35%) pedestrians with a height of 50 pixels or more, intrinsically derived from the annotation design of the original Caltech introductory article 28 while the so-called difficult subset contains all the annotations. Thus, bearing this in mind, we applied the transformation required by the reasonable subset proportionally to the image sizes of the other three datasets to establish a common reasonable scenario in order to compare their complexity and the adaptation of generic algorithms analysed to each on-road dataset.
Figure 2 shows detection performance results of SSD, Mobilenets and the three YOLOv3 versions for Caltech and Daimler datasets. It can be noticed that YOLOv3 and its variants present a good performance for both databases. Besides, SSD shows poor precision with high recall, while Mobilenets has poor general performance due to its focus on low computational complexity.

Detection performance of the five analysed generic algorithms applied to (a) Caltech and (b) Daimler datasets in the reasonable scenario.
Figure 3 shows detection performance (LAMR) versus speed frames per second (FPS) on the Jetson TX2 mobile platform. It can be shown that YOLOv3 416 presents higher FPS while obtaining a similar miss rate. In our setup, it is important to get a RT response and for this reason YOLOv3 416 will be selected for the next experiments.

Detection performance versus throughput of the five analysed generic algorithms applied to the four aforementioned on-road datasets.
Hardware performance
As stated previously, even having constraints mainly due to limited power and space available on board, there is hardware available with enough computing power to deal with algorithms like those presented in the third section. Consequently, we selected an NVIDIA Jetson TX2 mobile board with multiple GPU and CPU cores that operates at a maximum power consumption of 15 W. Additionally, we also have included some powerful GPUs and general-purpose processors that allowed us to establish a comparison among three platforms: a desktop CPU (Intel Core i7-7700 CPU x 8), a GPU (NVIDIA GTX 1080 Ti) and the mobile GPU platform presented above (NVIDIA Jetson TX2).
We performed a comparative throughput analysis for YOLOv3 416 algorithm running on our three platforms with CUDA backend for GPUs, without any further code optimisation. For this reason, they represent a lower bound (baseline) from which a single forward-pass time of the net will decrease at prediction time in case any optimisation technique is applied.
An analysis of the forward-pass mean time is computed for two of the presented datasets, both containing fixed-size images. We present the results for the three computing platforms mentioned in Table 1.
Mean computing time and throughput of a single forward-pass of Daimler images on different platforms for YOLOv3 416.

YOLO: You Only Look Once.
Driving reaction time in humans is known to range from 500 ms to 2 s, 29 so we must guarantee that our system works at a lower reaction time. Jetson TX2 fulfils it.
The final goal is to achieve high-quality, RT detection of VRUs. Therefore, as our experiments were developed in Python, some optimisation techniques may eventually be applied in order to increase throughput (see the fifth section).
Specific training
In order to improve the network performance as well as to increase the recall levels while keeping precision, we modified the architecture of YOLOv3 detector by reducing the number of classes of the task.
The original YOLOv3 was trained on the generic dataset COCO, 20 which includes up to 80 different classes. However, in our task, we are only interested in pedestrians. Therefore, we trimmed the last layer of the network so that it predicts bounding boxes of only 6 floating point values (2 for position, 2 for shape, 1 for bounding box confidence and 1 for the class confidence) in contrast with the original 85 values (see Figure 4). YOLOv3 predicts 3 boxes for each grid cell at 3 different scales of size 13 × 13, 26 × 26 and 52 × 52. Thus, for each grid cell, the 3 boxes with 6 parameters are encoded in a 1 × 1 × 18 vector instead of the original 1 × 1 × 255 vector.

YOLOv3 structure after modifying the last layers with 18 channels instead of the original 255. YOLO: You Only Look Once.
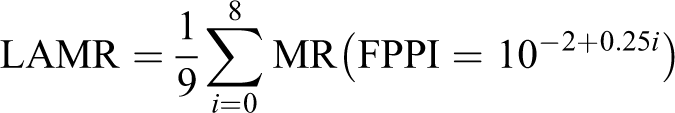
This new network has been trained on the same COCO dataset as the original one and tested using the 5000 images from the COCO 2014 validation dataset. Figure 5 shows the results for the COCO 2014 validation dataset. It can be noticed that the single class model outperforms the generic YOLOv3 results, and for a given precision, a higher recall is obtained for this model. Table 2 shows the increase in mean average precision (mAP), higher TP and lower FP, FN for the single class model.
Detection performance of the original YOLOv3 and the YOLOv3 single class for the COCO validation dataset. YOLO: You Only Look Once.
Results for the COCO validation dataset with the original 80 classes and for the single class model.a

YOLO: You Only Look Once; TP: true positives; FP: false positives; FN: false negatives.
a mAP is computed at IOU = 0.5 and the confidence threshold is set to 0.25.
As stated below, the trained model with one class gets better results under the COCO dataset, but it is also interesting to see how it performs for modern, specific, on-road databases such as ECP and nuScenes. For this reason, we have tested the model on ECP and nuScenes databases. Figure 6 also confirms the improvement of the single class model and Figure 7 shows that the single class model has a better recall without getting too much FP.

Detection performance of single class trained YOLOv3 for (a) ECP and (b) nuScenes on the reasonable scenario. YOLO: You Only Look Once; ECP: EuroCity Persons.

Pedestrian detection for the original YOLOv3 and the YOLOv3 for pedestrians on the ECP dataset: (a) berlin_00414, (b) berlin_00436, (c) budapest_00859, (d) barcelona_01293, (e) amsterdam_01078, (f) ljubljana_01051 and (g) hamburg_00681. From left to right: ground truth, original YOLOv3 and single class YOLOv3. YOLO: You Only Look Once; ECP: EuroCity Persons.
Grid size analysis
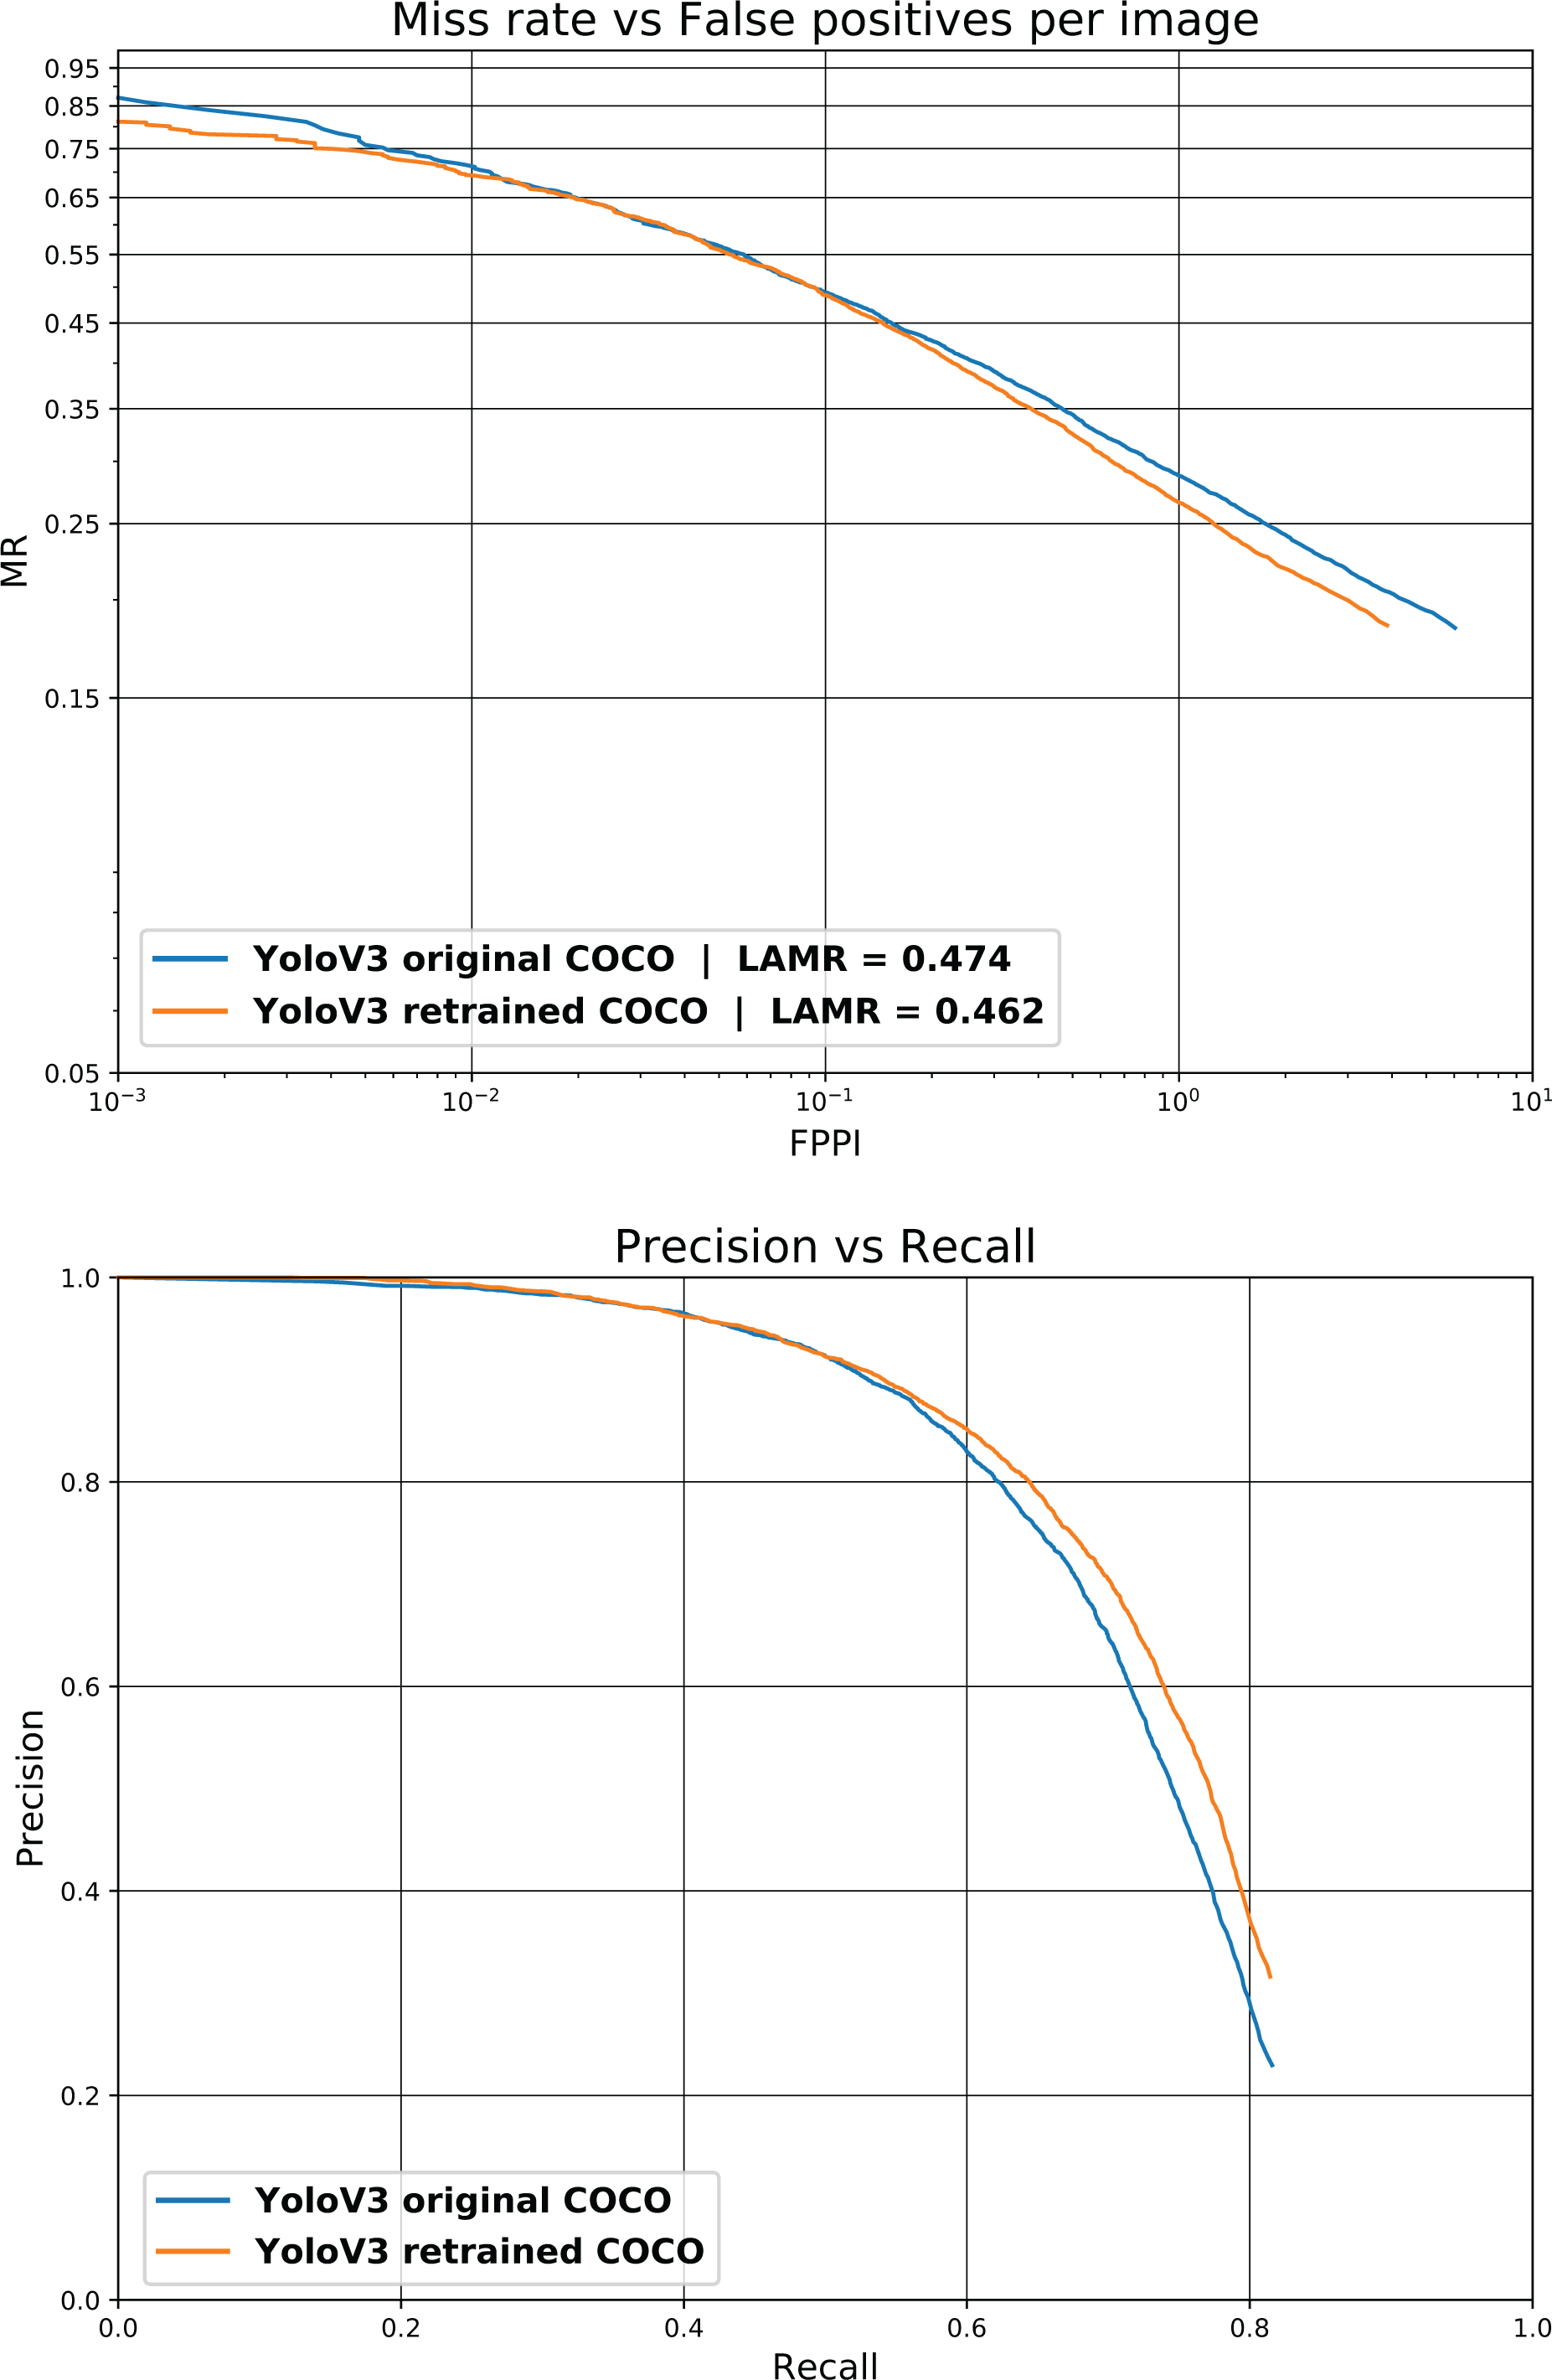
As shown below, we achieved a better mAP by training a model with only pedestrians. From the other side, the original YOLOv3 algorithm uses a 13 × 13 grid that corresponds to 416 × 416 pixels (grids are regions of 32 × 32 pixels) and YOLOv3 608 corresponds to a 19 × 19 grid. Each grid cell predicts 3 objects at 3 different scales, having a total of 10,647 objects. Figure 8 shows the default 13 × 13 grid.
YOLOv3 default 13 × 13 grid. YOLO: You Only Look Once.
It can happen that a 13 × 13 grid it is not the best setup for pedestrian class. Therefore, an extensive analysis has been carried out for different grid (image) sizes. One of the advantages of the YOLOv3 architecture is that image input (grid) size for inference can be different from the input size used to train the network, thus allowing a fine-tuning step to get the most from the model.
Figure 9 shows the detector performance depending on the grid size. Each line shows the performance for a grid of size width × height, with height being fixed (i.e. w: 13) and width being variable. Besides, the x-axis shows the grid area obtained by multiplying width and height, which is correlated with the computational cost.

mAP versus grid area (dotted line for YOLOv3 416). YOLO: You Only Look Once.
It can be seen that a higher or equal resolution for width instead of height works better than the opposite. Values for mAP for a given grid area increase with higher width and lower height values.
Moreover, it can be seen that some grid configurations get better mAP with similar grid sizes (computational cost). Taking into account that YOLOv3 416 uses a grid size of 13 × 13 resulting in an area of 169 regions, and YOLOv3 608 corresponds to 19 × 19, some intermediate configurations can be chosen in order to keep the computing time low while improving the mAP. Some of the selected points are near a grid area of 225, where the slopes of the curves begin to decrease having smaller mAP/grid ratio. Thus, we have selected 16 × 11 size, which has almost the same grid elements, and 15 × 15, which gets a considerably better mAP (74.12 vs. 72.78 at 13 × 13) with a slightly larger grid size. It is also worth to mention that 15 × 15 obtains a recall of 0.72 while 13 × 13 gets 0.70.
Finally, Table 3 shows the detection results achieved with our training against the COCO validation dataset baseline and the results with our single class model for different grid sizes.
Results for COCO validation dataset with original 80 classes and single class trained models.a
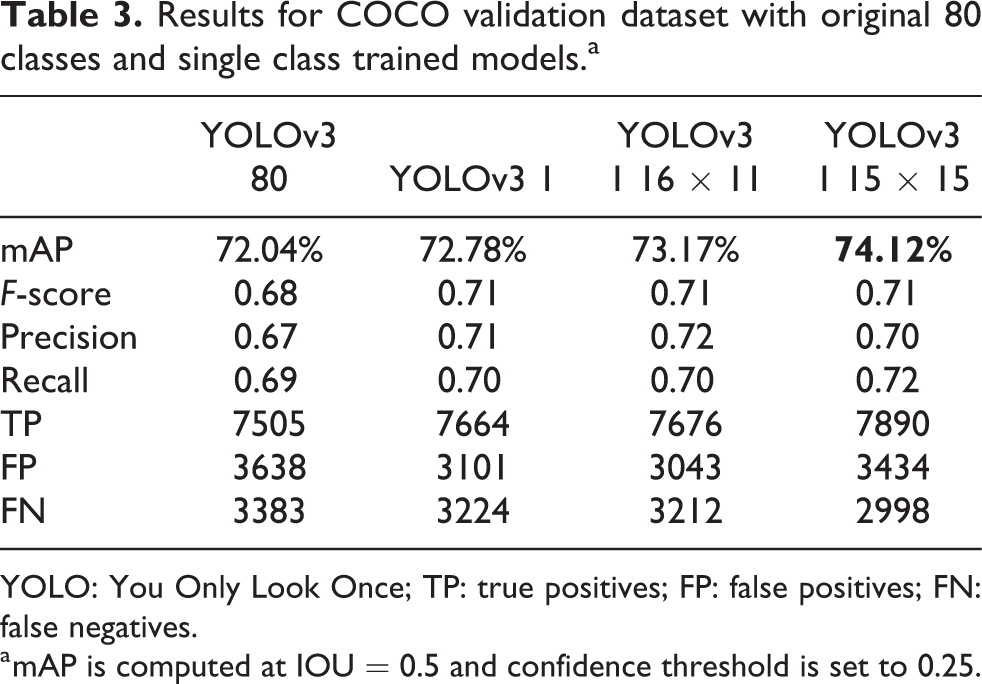
YOLO: You Only Look Once; TP: true positives; FP: false positives; FN: false negatives.
a mAP is computed at IOU = 0.5 and confidence threshold is set to 0.25.
Conclusions and future work
In this article, we have presented five generic-purpose object detection algorithms and their performance on pedestrian detection task for the on-road datasets Caltech-USA, Daimler, ECP and nuScenes. This set of databases includes images in very different conditions, sizes and locations. Then, an experimentation with the YOLOv3 algorithm was carried out on three different hardware platforms, including the mobile platform NVIDIA Jetson TX2, in order to establish a throughput baseline for further developments. Moreover, an ad hoc training experiment only with the pedestrian class was performed on the COCO generic dataset and we have been able to significantly increase recall, as we wish a decrease in type II errors in spite of an increase in type I errors which may be mitigated in subsequent stages (such as tracking or sensor fusion with other signals). Finally, as computation time is a critical parameter, different grid sizes have been evaluated, with some of them performing better at slightly higher computation times, getting an improvement in mAP from 72.04% to 74.12%.
As future work, further training of these generic CNNs on some of the presented on-road specific datasets to improve detection results for a number of interest classes (car, bus, pedestrian, bicycle, motorcycle, etc.) is likely to provide a detection performance that, when combined with RADAR and LiDAR inference and other post-processing techniques, delivers superior detection results. In addition, optimisations at code level and libraries, such as using TensorRT and porting Python functions to C, will be also considered.
Footnotes
Declaration of conflicting interests
The author(s) declared no potential conflicts of interest with respect to the research, authorship, and/or publication of this article.
Funding
The author(s) disclosed receipt of the following financial support for the research, authorship, and/or publication of this article: This work was supported by PRYSTINE project which had received funding within the Electronic Components and Systems for European Leadership Joint Undertaking (ECSEL JU) in collaboration with the European Union’s H2020 Framework Programme and National Authorities, under grant agreement no. 783190. It was also funded by Generalitat Valenciana through the Instituto Valenciano de Competitividad Empresarial (IVACE).