
Abstract
The cleaning of cement warehouse is a labor-intensive and high-risk operation. The applicability and cleaning effect of traditional work tools are poor. Therefore, most of the methods are manual cleaning, which is inefficient and prone to accidents. It is of great social significance and practical value to develop an intelligent flexible warehouse cleaning robot that replaces the manual cleaning of cement. When the top of the cement warehouse is small and the volume of the cement warehouse is very large, how to ensure that the working range of the cleaning system can cover the entire area, and effectively and quickly complete the cleaning operation, and the automatic control of the cleaning robot has become an automatic control. Key issues to be addressed. Although the human–machine interface configuration technology has been widely used in automated monitoring systems, its graphical and componentized interface construction methods and the flexibility and scalability of the configuration interface have been widely recognized, but the human–machine interface, the coding method is still used in the construction, the development efficiency is low, and the interface is not open and flexible enough. At the same time, there are few research attempts on interface configuration. Interface configuration mostly only stays in the graphical phase of interface construction. Data and interactive control cannot meet the configuration requirements, and there is no complete implementation plan for configuration. Therefore, it has become an urgent need to change the traditional interface development mode and realize the configuration of man–machine interface. Based on the above background, the research content of this article is the research on the automatic control system of intelligent flexible clearing robot. Based on the understanding of the relevant properties of cement powder, this article discusses its flow state in the cement storehouse theoretically and provides a basis for subsequent structural design and stability research. A modularized and component-based configuration method for the numerical control interface is proposed. The interface is divided into three modules: data, graphics, and interactive control. The functional modules are assembled and the components are combined to implement the interface configuration. The experimental simulation results in this article show that compared to the traditional method, the amount of code editing of the configured human–machine interface is reduced by 46.34%, the development cycle is shortened by 43.72%, and the development efficiency of the configured human–machine interface has been greatly improved. It is confirmed that the configuration technology studied in this article can meet the requirements of automatic control systems.
Introduction
At this stage, the cleaning of cement warehouses is mainly by using some special processes and outsourcing to a professional cement warehouse cleaning project construction team to regularly clean up the cement blocks in the cement warehouse. In the cement warehouse cleanup project, because the cement block inside the warehouse and the warehouse wall are very firmly bonded, it is difficult to remove. At the same time, the structure of the existing cement storage makes the operable space quite small, which brings great difficulties to the cleaning of the cement storage. Some cement production enterprises in the society do not realize the difficulty and danger of the cement warehouse cleaning project. In this case, how to design an intelligent flexible robot that can replace the cleaning staff is a big problem placed in front of the manufacturing enterprise or the cleaning construction unit.
At home and abroad, the main treatment methods for the cleaning of cement depots are the use of air cleaners (air cannons), exciters, tank wall vibrators, and scrapers. The working principle of the air cleaner is that the compressed air in the container, due to the reversing effect of the solenoid valve, the airflow is ejected instantly and at high speed, which directly acts on the material to cause it to spread or collapse. 1,2 This operation can be manual control or automatic control, which is quite easy to use. There are many types of shakers, the most widely used of which are electric shakers. The electric exciter converts the electric energy of the power amplifier into mechanical energy, and its advantages include a wide frequency range, almost a linear relationship between the exciting force and the current through the coil windings of the vibration system. The silo wall vibrator uses a vibration motor as the source of excitation and transmits power to the silo wall through high-frequency vibration to cause resonance. 3 Under the action of high-frequency vibration, the adhesive layer of the material and the warehouse wall will gradually separate. It has a good dredging effect on the arching in the silo, the material wet, and the wall. It has the following advantages: stable running ability, strong arch breaking ability, easy installation, simple structure, and long life. The shovel is a dredging device installed in the warehouse, and the blockage problem is solved by the shovel board or chain. When the material is wet and the viscosity is small, it has a certain effect; otherwise, mechanical seizure is easy to occur and the dredging equipment becomes a plugging point. 4 The problems with the above processing methods are driven by high-pressure air or a motor, which often shows insufficient driving force, especially for materials with high humidity and viscosity, the cleaning effect is poor; the structure is simple, and the level of automation is low; all need to be advanced. The interface is installed or left, so it has a certain degree of intervention, which introduces more blocking factors. 5
Due to the importance of clearing system research, many research teams have begun to study intelligent robots and have achieved good results. For example, Zeng et al. proposed a particle swarm optimization algorithm based on nonhomogeneous Markov chains and differential evolution. Path planning for intelligent robots when there are obstacles in the environment. A grid method was developed for environmental modeling. Finally, the switching local evolutionary particle swarm optimization (SLEPSO) algorithm was successfully applied to path planning in two different environments. 6,7 Luffing wheel leg robots are widely used in uneven ground operations due to their high mobility, strong obstacle surmounting ability, and strong stability. To ensure the smooth running of obstacles, Sun et al. introduced a new six-wheeled leg robot. This robot is a mobile device designed to actively overcome obstacles on forest roads. The experimental results show that compared with passive obstacle crossing, the roll angle and trim angle of the intelligent obstacle crossing system are greatly reduced from 4.5° and 2.5° to 0.75° and 0.4°, respectively. Simulations and experiments verify the effectiveness of the theoretical model and the effectiveness of the intelligent obstacle crossing method. 8,9 According to the requirements of social development and the latest technology level, Jingmei et al. proposed an M2M2A solution for multirobot collaboration, which can realize environmental adaptability, human–machine integration, and intelligent decision-making in industrial applications. Through the robot’s intelligent module, the robot reschedules the work time series and replans the path or trajectory when the surrounding environment changes to complete the task in an optimal way. 10,11 Luo and Kuo proposed a service-oriented multiagent system for controlling and analyzing cyber-physical systems in manufacturing automation using a noncontact dynamic obstacle avoidance seven degree-of-freedom robotic arm. Experimental results show that Luo’s method successfully achieves target recognition, target extraction, and dynamic collision avoidance based on three-dimensional (3D) models. 12,13 Yoo and Kim have developed an intelligent excavation robot designed to reduce fuel consumption by improving the efficiency and automation of traditional excavators in earthmoving works. The purpose is to develop a 3D local terrain modeling system using a 2D laser scanner, which can quickly and economically model the 3D local terrain of an intelligent mining robot. Finally, the application value of the proposed 3D local terrain modeling system in earthwork was verified. 14,15 Teng has developed intelligent detection robot systems such as robot body, communication and distribution system, track system and integrated monitoring and control platform system, aiming at the problems of detection difficulty, low efficiency and high safety risk in Sul tunnel manual detection. And experiments show that the robot system can be applied to other GIL projects and has potential application value. 16,17 Despite the remarkable achievements of robotic artificial intelligence, cybernetics experts believe that the limit of the level of intelligence it can possess has not been reached. The problem lies not only in the insufficient computing speed of the computer and the small number of sensor types but also in many other aspects.
In the research of the integrated control technology of mechanical and electrical integration automation, the automatic control system is a very good method. It can perform some manual tasks and solve the labor cost advantages. Therefore, it is widely used in the research of flexible robots, such as the Sadelli study. A 2D observer control of a magnetic microrobot navigating in a cylindrical vessel along a reference trajectory is presented. Especially, the nonlinear resistance that the robot faces is caused by pulsating blood flow, which is difficult to measure. Therefore, Sadelli et al. proposed an observer based on the median theorem, which estimates the blood flow velocity from the unique measurement of the robot’s position. The stability of the observer-based backstepping controller is proved. Then, the simulation results verified the estimation and tracking results as well as the robustness to the parameter uncertainty, measurement noise, and dynamic errors when the modeling of pulsating blood flow was incorrect. 18,19 Sanderud et al. propose an active strategy that enables robots to be aware of current risks. Based on the risk domain, Sanderud et al. proposed a control algorithm that continuously reduces current risks under task constraints. Under the premise of task constraint and risk minimization, the simultaneous execution of tasks is realized using motion redundancy. Sphere-based geometric models are used for humans and robots. The strategy has been simulated and experimentally verified on a NACHI MR20 seven-axis industrial robot. 20,21 Tang proposed a simple robust adaptive control method for a class of nonlinear systems with parameter uncertainty and bounded disturbance. Different from the traditional parameter adaptive control, the adaptive signal synthesis method proposed by Tang only updates the upper bound of parameter uncertainty and interference. This provides a simple control law for its implementation, because it avoids the difficulty of adjusting a large number of adaptive gains, and overcomes parameter drift due to interference, so it is robust to interference. Targeting virtual environments makes it possible to conduct extensive experiments in controlled scenarios without relying on a physical platform in a faster and cheaper way. 22,23 Pinho et al. propose a robot operating system (ROS) framework for SimTwo simulators and provide integration of ROS-based systems with SimTwo simulators. Therefore, the framework reduces the risk of damage to expensive robot platforms and can be used to develop new mobile robot controllers and also for educational purposes. 24,25 Due to the effectiveness of the automatic control system method, this article explores whether the automatic control system method can be applied to intelligent flexible robots to solve the problem of difficult manual clearance operations.
To solve the problem of the manual clearance operation, this article provides the basis for the subsequent structural design and stability research by studying the clearance system. Using the human–machine interface (HMI) system, the analysis model is established using the configuration interface method. A simulation experiment comparing the technical indicators of the traditional interface with the same function during the development and operation, the results show that the code editing of the configured HMI is reduced by 46.34% and the development cycle is shortened by 43.72%. The development efficiency of the HMI has been greatly improved. Due to the use of a data management center for data collection and caching, the time required for individual data access has been reduced by 98.34%. Therefore, the functionality of the configuration platform and the availability of the configuration interface are worthy of recognition, but the operating efficiency of the configuration interface needs to be improved.
Proposed method
Cement warehouse
Size range of cement particles
The material that can be directly seen by the human eye is the macroscopic system. The system that atoms, molecules, etc. come into contact with in theoretical research is called a microscopic system, while the material particles between macroscopic and microscopic are called a mesoscopic system. 21,22 Cement is an aggregate of a large number of particles. The division of particle size and the category of cement particles are shown in Figure 1.

The classification of particle size and the scope of the cement particles.
Physical properties of cement
The physical properties of cement are different due to the different physical properties and contents of various raw materials such as limestone, clay, iron powder, gypsum, coal, and coal powder. 23 Among the static properties of cement, the basic characteristics that are not related to the aggregate shape are particle and size composition, particle density, particle shape, chemical composition, apparent chemical properties, and so on; the packing characteristics related to the aggregate shape are filling characteristics, adhesion and agglomeration, powder pressure, friction between particles, particle composition, particle heat, light, electricity, and other characteristics. These static characteristics are very important to the cement industry design and equipment design. 24,25
The dynamic characteristics of cement are mainly manifested in four aspects in the cement plant: the flow of powder particles such as the material flow in the silo, the material flow in the screw conveyor or the vibration conveyor; the dust collection in settlement, the material flow in the cyclone, a two-phase flow system of particles and fluids such as material jets, raw material homogenization storage, liquid drying, and pneumatic conveying of cement raw materials in the silo; particle layer of the fluid flow system in the particle layer, dust collection, rotary type dryer, and fluid flow system such as gas flow in vertical kiln; particle deformation and crushing include crushing and grinding of limestone and other materials, grinding of raw materials and cement, and so on. 26
Fluidity of cement
There are three main methods for evaluating the flow properties of cement powder: the angle of repose evaluation method, the Carr comprehensive flow index evaluation method, and the Jenike powder material evaluation method. The angle of repose is used to evaluate the flow ability of cement powder. It can only roughly and qualitatively indicate the flow ability and the difference in flow ability caused by the same powder and granules due to moisture and particle size. The relationship between the angle of repose of the cement material and the fluidity is shown in Figure 2.

The relationships between repose angle of cement and flow.
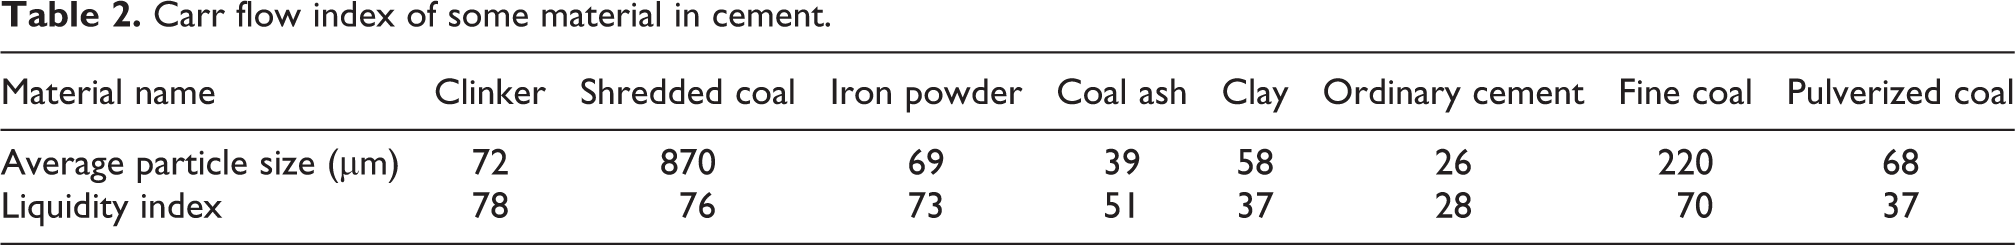
The Carr comprehensive flow index evaluation method is to measure the angle of repose, spatula angle, compression degree, and uniformity for a certain material, and use a certain point value to express it. 27 The total value of the last addition is the material flow index. The relationship between Carr’s flow index and liquidity is shown in Table 1. Table 2 shows the Carr mobility index of several materials in the cement plant measured by the laboratory.
Carr flow index.

Carr flow index of some material in cement.
The Jenike evaluation method is a set of indicators that scientifically represent the flow performance of bulk materials, and based on the theory of bulk materials flow, a set of practical methods for designing silo containers based on these measured flow ability indicators are derived. The factors that affect the flow properties of cement powder are particle size, moisture content, temperature and chemical changes, and vibration. The various forms of material flow in the cement plant can be roughly divided into six types if they are classified from the kinetic energy or driving force given to the material particles: gravity flow, mechanical forced flow, vibration flow, compression flow, liquid flow, and assist flow flowing. The flow state of materials in a cement plant is determined by the physical properties of the materials and the state of the equipment. In addition to rational design and selection of equipment, flow assisting methods are generally used to change the material’s fluidity, reinforced sealing methods are used to prevent material jetting, and particle design and surface modification methods are used to control the fluidity. 28,29
Factors affecting the flow pattern of the silo
Under normal circumstances, the integrated flow bin is the preferred flow pattern for the silo design, but because of the advantages and disadvantages of the integrated flow bin and the hopper flow bin, the hopper flow bin is also used. The factors that affect the flow pattern of the silo are the geometric factors of the silo, the physical properties of the silo material and silo, the loading form, and the influence of the fluid. 30 The geometric factors of the silo are the hopper inclination angle, the size of the discharge opening, and the hopper curve. Sometimes, in a large-diameter round silo, the use of a partial curve funnel can not only solve the problem of arching but also avoid the reduction of the storage bin volume. In addition to the hopper inclination angle and the size of the discharge port, in addition to affecting the flow speed of the silo, it will also affect the pressure angle distribution in the silo. To achieve the overall flow pattern, it is necessary to ensure that the inclination angle of each part is greater than the rest angle of the material, and at the same time select the appropriate discharge port size. The necessary condition for forming an overall flow is that θ is smaller than θ max, where θ max is

where ϕ is the effective internal friction angle and δ is the friction angle between the material and the silo wall.
The flow pattern design of the silo is based on the characteristics of the stored materials (effective internal friction angle δ and wall friction angle ϕ) to determine the half-vertex angle of the hopper and the size of the discharge port. For conical hoppers, the maximum half-apex angle required to maintain the overall flow is

In the formula, δ and ϕ are the internal friction angle and wall friction angle of the powder, respectively.
For wedge-shaped hoppers, the maximum half-apex angle of the overall flow can be determined by the empirical formula

where ϕ < δ − 3.
The wall friction angle ϕ has a great influence on the flow pattern of the silo. It can change the flow pattern of the silo within a small range. In actual design, the calculated value is subtracted from the safety threshold of 3°, which is used as the half-aperture angle of the overall flow hopper to prevent the center of the overall flow from alternately appearing in the bin and affecting the normal discharge.
For integral flow silos, the discharge opening is too small and a material arch will form. Two material arches may be formed at the discharge opening: mechanical arch and viscous arch.
For particles with larger average diameter (>3000 µm), mechanical arch is easy to form. At this time, the size of the discharge port can be determined by the following formula

where B is the diameter of the discharge port and dp is the average particle diameter.
For powder materials with a small average diameter, the minimum discharge opening size that does not produce a viscous arch can be determined by the following formula

where B is the discharge opening diameter; ρ is powder density (kg/m3); g is gravity acceleration (m/s2);
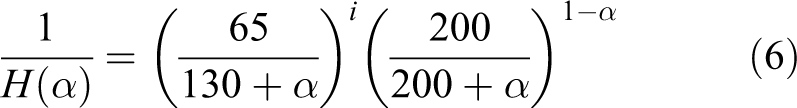
where α is the half-vertical angle of the hopper (°); when i is the round and square discharge opening, i = 1.
For the hopper flow silo, if the size of the discharge port is too small, pipe flow (also known as rat holes) will occur, making the discharge flow unstable. The minimum discharge port size Bo to prevent pipe flow can be determined by the following formula
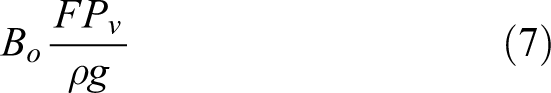
where F is a function of the effective internal friction angle δ; Pv is the axial pressure of the silo (Pa); Pv can be obtained from the following formula
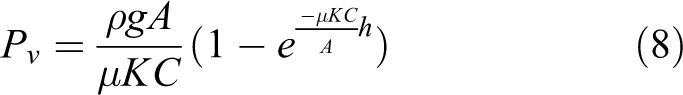
where μ is the friction coefficient of the inner wall surface of the silo,
Clearing system
The clearing system is mainly composed of a cleaning power head, a wire rope lifting mechanism, and a telescopic rotating working arm. The working area is a column ring body.
Cleaning the power head
The power head is the main part of cleaning the sticky wall material, and its performance directly determines the cleaning effect. The methods of crushing sticky wall materials can be divided into two types: linear crushing and rotary crushing. The former has low speed, and it is difficult to achieve reciprocating motion quickly, while the single crushing is difficult to achieve the desired effect; the latter can be driven by a rotary motor, which can achieve higher speed, and the cleaning effect is better than linear motion cleaning. Therefore, the system will use the rotating crushing method. The current driving methods mainly include electric driving, hydraulic driving, and pneumatic driving. Electric drive has the advantages of simple operation, high precision, accurate control, and fast response, but it is more expensive. The hydraulic drive can provide a large driving pressure and power, has the characteristics of simple structure, stable performance, and fast response speed, and can achieve high positioning accuracy and stiffness, but the oil system is complex, the working performance is greatly affected by the environment, poor mobility, and easy to cause oil unloading, It is often used in the super power system which requires a large driving torque and poor mobility performance. The pneumatic system has the advantages of convenient air source, low cost, quick action, simple operation, no pollution, and so on and can work in harsh environments.
Wire rope lifting mechanism
The lifting mechanism is a working mechanism that achieves large-scale lifting. The lifting mechanism is mainly composed of a driving device, a transmission device, a winding system, and a braking device. In addition, various auxiliary devices can be installed, such as lifting limiter, torque limiter, three-circle protection, and other safety devices. Most of the driving devices are driven by electric motors, which are convenient for arrangement, installation, and maintenance. The transmission device includes a reducer, a coupling, and a transmission shaft. The winding system mainly includes a drum and a wire rope pulley set.
Experiments
Experimental environment and data
Due to the limitations of the experimental site and related experimental equipment, all data in the experiment will be completely generated by LabVIEW software. LabVIEW software is the abbreviation of Laboratory Instrument Engineering Workbench (Laboratory Virtual Instrument Integration Environment) and is a graphical development environment created by National Instruments. LabVIEW is different from text-based programming language but a graphical programming language usually called G language. The programming process is to describe the behavior of the program through graphical symbols. LabVIEW plays an important role in the fields of test measurement, industrial automation, and data analysis. ANSYS software is a multipurpose finite-element analysis software that integrates structure, fluid, electric field, magnetic field, and sound field analysis. It has preprocessing, solving, and postprocessing capabilities. ANSYS software is divided into ANSYS Classic Edition and ANSYS Workbench Edition. The latter operation is relatively simple and suitable for engineering designers. First, establish the geometric model (imported in Workbench or imported from other CAD software); second, determine the material type, Workbench can automatically determine the elastic modulus, Poisson’s ratio, and density according to the defined material type; once again, meshing is performed. After the grid is divided again, workbench provides a variety of intelligent division methods, such as automatic division method, redundant sweeping method, etc.; then structural analysis is carried out, and constraints, loads and post-processing results are given; finally, optimization design can also be carried out, only the required parameters, optimization objectives and conditions are given, and optimization methods are determined, and workbench will give optimization results. The flowchart is shown in Figure 3.

Work flowchart of Workbench.
Experimental settings
Software anomalies can be understood as problems, errors, or hidden functional defects that disrupt normal operation. Most of them are introduced during the software development process and the operating environment. Some are caused by the programmer using some wrong algorithms or syntax. Some are caused by the programmer’s incomprehension of the existing software architecture or the system structure. Some of the existing functional exceptions caused by the programmers' incomprehension of the existing software architecture or the poor consideration of the system architecture, some of the new functions developed due to the inconsistent understanding of the customer's requirements are not really needed by the customer, and some of the system crashes or security problems introduced due to the failure to consider the reliability of the system operation. The occurrence of exceptions is inevitable, and the possibility of resolving all exceptions existing in the software product itself before the software release is almost zero. Therefore, the software exceptions that must be solved before software release must meet the following conditions: (1) the tbfi (to be fixed in) software exception management tool records the software exception of current release. (2) The software exception marked mustbefixed recorded in the software exception management tool, or the software exception with failure mode and effect analysis (FMEA) value ≥ 36 recorded in the software exception management tool.
The entry quality standards defined for each milestone are as follows: (1) Integration complete: All functional tests are over; regression testing is over; in configuration management, feature branches have been promoted to product release integration branches; all unsatisfied software anomalies for project release quality standards have been reviewed. (2) Anomaly lockdown (anomaly lock): All regression tests planned to be performed after functional integration are completed; functional tests after software abnormalities are resolved; the first phase of system testing is completed; submitted software abnormalities maintain a downward trend within 2 weeks; the software exception resolution branch has been promoted to the product release integration branch in configuration management. (3) Final stabilization (final stabilization): All regression tests planned before this milestone are over; system testing is over; newly submitted, pending, and resolved software exceptions maintain a downward trend within 2 weeks. (4) Release candidate: All tests scheduled to be performed before this milestone are over; all outstanding software exceptions have been reviewed; there are no software exceptions that do not meet the project’s release quality standards; all user documentation except release notices already generated. (5) Prepare for release: The final regression test is over; all image file tests are over; all software exceptions planned to be resolved in this version have been resolved; a release notice has been generated and signed. (6) Available for download: The product release image file has been delivered; the quality standard report has been generated.
Discussion
Comparison of automatic control systems
The configuration development platform is used to develop a simple high-end system configuration man–machine interface to verify the functionality of the configuration development platform. The developed configuration man–machine interface mainly includes multiple configuration screens such as the main processing interface, program management, parameter management, coordinate system, and so on to meet the most basic operation requirements. The comparison between its automatic control system and manual test is shown in Figure 4.

Comparison between automatic control system and manual test.
As shown in Figure 4, the environment for the two test methods is the same; however, in the automatic control system test solution, the relevant parameters need to be adjusted according to the test object, which increases the test work time. In the manual testing scheme, this step does not exist; from the overall situation, the entire process of automatic testing is very efficient, and it takes less time for different units.
After the development of the configuration interface is completed, the completed screen is converted into a QML script and deployed to the actual machine tool operating environment to verify the operation of the HMI and interactive functions. From the actual interface operation, the configuration interface can meet the needs of humans. Machine interface to run application requirements.
Interface comparison analysis
In the actual development and operating environment, the configuration interface is compared with the technical indicators of the traditional interface with the same function in the development and operation process. Figure 5 shows the comparison between the configuration interface and the traditional interface.

Comparison of configured HMI interface and ordinary HMI interface. HMI: human–machine interface.
As shown in Figure 5, from the perspective of the actual interface operation and part processing, the configuration interface can meet the application requirements of man–machine interface operation and processing. Table 3 shows the comparison results of related indicators.
Comparison of configured HMI interface and ordinary HMI interface.

HMI: human–machine interface.
As can be seen from the data in Table 3, during the development of the interface, due to the configuration platform’s visualized and componentized flexible construction method, the number of code edits for the HMI decreased by 46.34%, the development cycle was shortened by 43.72%, and the HMI development efficiency has improved significantly. During the operation of the HMI, due to the addition of a data management center and a component-based interface organization method, the configuration interface has increased system resource consumption compared to the traditional interface during the operation process. The time consumption of the startup and screen switching is basically the same. Because the data management center is used for data collection to cache, the time consumption for single data access is reduced by 98.34%. It can be seen that the functionality of the configuration platform and the availability of the configuration interface are worthy of recognition, but the operating efficiency of the configuration interface needs to be improved.
Quality analysis
By calculating the number of anomalies in each component on the current development version of the HMI software, the quality distribution of each component during the implementation of the new function is analyzed. Those components with more abnormal numbers have worse quality conditions. You can improve the quality control of the components by: (1) increasing the depth and breadth of the test, such as increasing test coverage. Discover as many exceptions as possible before the software is released. (2) By analyzing the solutions of the abnormalities that have been found, find out the modules and parts with the most code changes. Let developers reanalyze the feasibility of current architectures and designs. Analyze whether exceptions can be resolved fundamentally through code refactoring, design updates, or even architecture updates. The rate of weekly anomaly data discovery, resolution, and verification is shown in Figure 6.

Anomaly weekly run rate.
As shown in Figure 6, each anomaly contains information on the time of discovery, resolution, and verification. By analyzing this information, we can determine the overall situation of the anomalies found in the current version. Take the time interval of observations, usually 1 week as a cycle. A regression analysis tool was used to successively perform polynomial fitting on the number of anomalies found, solved, and verified to analyze the distribution of the number of anomalies. The independent variable X is time and the dependent variable Y is the number of abnormalities. Through analysis, it is not difficult to see that both the number of abnormal findings and the number of solutions and verifications are gradually increasing. There are many reasons for the increase in the number of abnormal findings. It may be caused by the introduction of an unstable functional module, or it may be that the current project has entered the stage of large-scale regression testing or system testing; the increase in the number of exception resolutions may also have multiple aspects. The reason may be that the number of exceptions found in the previous period is small, so the number of corresponding exceptions is small, or it may be caused by the increase of developers; the increase in the number of exception verifications may be less than the number of previous verifiable, it may also be caused by the recent large-scale abnormal verification work started by testers.
Specific analysis of quality
The cause of the increase in the number of abnormal findings can be found by analyzing the specific situation. The forecast of the abnormal trend is shown in Figure 7.

Projection of anomaly trending.
As shown in Figure 7, it is a method for predicting quality. It predicts future software product quality trends and when software quality standards can be met, based on the state of abnormal discovery, resolution, and verification on the current software development version. The yellow line represents the actual number of occurrences, it is an average value, each point on the blue line represents the total number of anomalies found at its corresponding time point, and each point on the red solid line represents its corresponding time point, the total number of exceptions resolved on. Each line corresponds to the fitting of actual values and the prediction of the development trend in the next half year. The independent variable X is time, and the dependent variable Y is the cumulative value of the abnormality. When the total number of predicted abnormal resolutions is equal to the total number of predicted abnormal findings, and the two trend lines are separated, it indicates that all the discovered abnormalities have been resolved. The slope of the anomaly resolution prediction curve is greater than the slope of the anomaly discovery prediction curve, indicating that the project team has the ability to resolve all the anomalies currently found. In the same way, when the total number of predicted anomaly verifications is equal to the total number of predicted anomaly resolutions, and the two trend lines in the figure are separated, it indicates that the resolved anomalies have been verified. The slope of the anomaly verification prediction curve is greater than the slope of the anomaly resolution prediction curve, indicating that the project team is capable of verifying all the anomalies currently resolved, and the product quality meets the standard at this time point.
Summary
This chapter sets up the configuration platform development environment and operating environment software and uses the configuration platform software to build a simple system configuration interface. At the same time, the configuration man–machine interface is compared with the traditional numerical control man–machine interface related technical indicators to configure the configuration. The functionality of the platform and the availability of the configuration interface are summarized. By constructing the NC configuration interface and the actual deployment, operation and processing of the machine tools, it is shown that the method of implementing the configuration of the man–machine interface as well as the modularization of the interface and the componentization of the functional units within the module are correct. The comparison of traditional interfaces also shows that the functional design scheme of the configuration platform is feasible, and the flexibility and efficiency of the configuration platform construction screens have been verified. However, there are also many shortcomings in the process of implementation and application of the configuration platform software that need to be improved.
Conclusions
Aiming at the limitations of the working environment and the requirements for safety and practicability, this article researches the system and strategy of cleaning up the warehouse. The research results of the cleaning robot and the research status of the cleaning robot are analyzed and summarized. Based on this, the research task of this article for the intelligent flexible clearing robot automation control system is determined. According to the relevant characteristics of the cleaning object, the relevant properties of the cement particles are analyzed, so as to provide a basis for subsequent structural design and stability analysis.
This article uses the proposed HMI configuration method and implementation technology to build a configuration platform and develop the simple configuration interface of the system. According to the characteristics of the system HMI, the data, graphics and interactive control of the man–machine interface components, which use components to render pictures instead of components in the editing process, to realize the visual editing of the interface, and use QML scripts to store and deploy the configuration interface. The comparison of related technical indicators verifies the feasibility and practicability of the configuration method.
This article studies the configuration technology of the man–machine interface of the numerical control system and builds the configuration platform of the numerical control interface. Due to the limitation of time, there are still problems in this research that need to be resolved in the next research, such as the state platform. Only the implementation mechanism of I/O device extension is proposed, and only a small number of extended devices are supported. It is necessary to add the drive of related devices and various types of data exchange and communication protocols in the next research to realize the configuration software for OPC, ModBus support for common data protocols or extended devices.
Footnotes
Declaration of conflicting interests
The author(s) declared no potential conflicts of interest with respect to the research, authorship, and/or publication of this article.
Funding
The author(s) received no financial support for the research, authorship, and/or publication of this article.