
Abstract
To conduct diagnosis and prognosis of gears, this paper introduces a novel short-frequency slip fault energy distribution-based demodulation method. As an essential step of the method, the resonance-based sparse signal decomposition algorithm is firstly employed to obtain the high-resonance part from the raw gear fault signal. To deal with the difficulty in determining the resonance frequency band, we establish a multi-input signal-output model to describe the signal components acquired from a faulty gear. Based on it, the short-frequency slip fault energy distribution graph is defined to locate the center frequency. Besides, the maximum amplitude in the short-frequency slip fault energy distribution graph can be used as a health indicator for prognosis, which is named as fault-induced resonance energy ratio. The effectiveness of the proposed method is validated with both simulated signal and test data. The positive results achieved in both experiments show the perfect property of the methodology for gear fault detection with high noise, especially when the fault is incipient. In addition, by comparing the fault-induced resonance energy ratio values of faulty gears with different severity, it is proved to be a reliable health indicator for gear prognostic.
Introduction
In modern intelligent manufacturing, the maintenance of production equipment is an important and essential mission to ensure the plant equipment continues to operate properly. 1 Gearboxes act as a significant part in many kinds of mechanical products, such as airplanes, cars, ships, and turbines. 2 Localized faults could appear because of long-term working time. 3,4 Once a localized fault occurs in the gearbox, it could result in component failure, the breakdown of the entire drive train, or even significant accidents. Therefore, gearbox diagnosis and prognosis are of great significance in modern intelligent factories.
The health condition of the gearbox can be monitored through analyzing vibration signals, 5 acoustic emission (AE) signals, 6 temperature signals, 7 and so on. For example, Li and Lee 8 proposed a model-based algorithm to predict the gear remaining life with a local crack using the gear torsional vibration signal. Man et al. 9 used the synchronous signal average model of the gear meshing vibration signal to monitor crack development and propagation of the gear tooth. Patil et al. 10 combined the multi-body dynamic model and asperity-based AE model to monitor the AE signal of the gearbox. Tan et al. 11 compared three different techniques for gear condition monitoring: AE, vibration signal, and spectrometric oil analysis. Tran et al. 7 proposed a method for gear diagnosis and prognosis based on thermal imaging technique.
As for gear fault diagnosis, vibration signal is most widely used. Various diagnostic methods by analyzing the vibration signal have been proposed, including time-domain statistics, 12,13 spectrum analysis, 14,15 time-frequency analysis, 16,17 and pattern recognition. 18 When a local fault occurs in the gearbox, such as tooth crack, the stiffness of the particular gear tooth reduces, which would give rise to periodic vibration impacts as the gear rotates. The short duration impacts would in turn excite the structure resonance of the system. 19 Under this circumstance, the resonance signals are considered as amplifiers to the low-energy impacts that carry much information related to the local fault. Therefore, the demodulation technique is a popular and useful tool for gear local fault diagnosis. It mainly includes three steps: (1) locate the resonance frequency band excited by the local fault, (2) demodulate the gear fault signal based on the frequency band found, and (3) diagnose local faults using the envelope demodulation spectra. During the process, the determination of the resonance frequency band acts as an important role in the diagnostic performance of the resonance demodulation technique. The exact parameters are known as center frequency and frequency bandwidth (BW). In practical working conditions, the transmission system is complicated, and it is generally not an easy task to locate the resonance frequency band because the sought signals may be covered by background noise and other vibration interferences. Therefore, measures should be taken to deal with the problem. Reviewing the existing literature, the measures are summarily divided into two sorts: (1) enhance the signal strength produced by the incipient damage and (2) calculate the statistical measurement of the signal and define an appropriate indicator.
The first category can be regarded as a pre-denoising step, which attempts to enhance the incipient damage in gears that may be buried among other vibration components, for example, meshing harmonics, sidebands, and noise. The so-called residual signal is widely considered as a strong tool for detecting local faults. It is acquired after eliminating the gear mesh harmonics from the time synchronous average signal. Wang 20 proposed the resonance demodulation method to detect the incipient gear tooth cracking based on the residual signal. Furthermore, Combet and Gelman 21 constructed an optimal Wiener filter using spectral kurtosis (SK) for dealing with the residual signal. Si et al. 22 presented a feature extraction method to detect the faults in planetary gearboxes with empirical mode decomposition. Yao et al. 23 put up a new method to find the fault resonance features based on the adaptive Morlet wavelet filter.
The second category has been widely studied, among which kurtosis is the most famous fault signatures. 24 Based on it, Dwyer extended the kurtosis into the frequency domain. 25 Then, SK 26 was proposed, which was a powerful tool for the fault diagnosis of rotating machines. 27 To better present the results, kurtogram was defined to represent the SK values on a graph. To reduce the computation time of SK, fast kurtogram 28 was put forward, which could obtain the same results but reduce the computation complexity. Both the SK and fast SK methods take into account various BWs and center frequencies. On the contrary, “Protrugram” was proposed to fix the BW and then find the optimal center frequency. 29 Moreover, Feng et al. 30 searched for the optimal frequency band by employing an infogram based on spectral negentropy. Wang et al. 31 proposed a new optimal frequency sub-band selection algorithm to detect faults in planetary gearboxes. Wang and Liang 32 presented an improved SK algorithm to determine the optimal frequency band for demodulation. Luo et al. 33 proposed a novel demodulation method using the tunable-Q wavelet transform (TQWT). Combining with the wavelet packet transform method, a new Kurtogram-based technique was presented using numerous filters. 34 Other than calculating the SK values directly, Wang et al. 35 proposed to calculate the ratio of SK values for the obtained signal and base signal, obtaining a SKRgram for optimal band selection. To separately locate the resonance harmonics produced by gear fault and bearing fault, Wang et al. 36 put up an improved scheme combing the SK method with meshing resonance phenomenon.
For the algorithms for gear diagnosis and prognosis mentioned above, they all belong to traditional feature extraction methods. They have some common shortcomings. Most algorithms can only identify the local fault when it develops to a certain stage, and many algorithms are noise-sensitive. Besides, fault diagnosis and prognosis of the gearbox usually need separate algorithms, which is complicated to carry out. Fault diagnosis based on deep learning is a research hotspot nowadays, but it requires a rich supply of data. 37,38 Therefore, it is of great significance to propose a noise-robust diagnosis method for incipient fault detection without using any historical data, which can be also used for prognosis.
This paper introduces a novel demodulation method for local fault diagnosis and prognosis of the gearbox. The overall proposal is based on the truth that local gear defects can induce periodic vibration impacts, which will in turn excite structure resonance. Different from the references mentioned above, the resonance-based sparse signal decomposition (RSSD) 39 technique is employed to extract the high-resonance component from the original gear vibration signal as a first step, which can exclude most random interferences contained in the low-resonance component. 40 Besides, this paper put up a novel method to precisely determine the resonance frequency band, which is a critical factor affecting the diagnostic performance. In our strategy, the BW is fixed. To determine the optimum center frequency, a multi-input single-output (MISO) model is established to describe the vibration data, from which the short-frequency slip fault energy distribution (SF-SFED) graph is defined to locate the resonance frequency. In the SF-SFED graph, the frequency which corresponds to the largest amplitude can be designated as the optimal center frequency. The value of the maximum amplitude can be used as a health indicator for gear prognosis, named the fault-induced resonance energy ratio (FIRER). The effectiveness of the proposed method is verified with both simulated signal and test data. The experiment results show perfect performance of the method for gear fault diagnosis with high noise especially when the fault is in the early stage.
The rest part is organized as follows: The novel SF-SFED-based demodulation technique for gear diagnosis and prognosis is explicitly introduced in the second section. In the third section, it tests and verifies the usefulness of the methodology using both simulated and experimental data. Lastly, we provide a conclusion in the fourth section.
Methodology: The SF-SFED-based demodulation technique for gear diagnosis and prognosis
This section mainly introduces the SF-SFED-based demodulation technique. Firstly, the RSSD algorithm is employed to obtain the high-resonance part from the raw gear fault signal. Based on it, the SF-SFED graph is obtained from the MISO model. In the SF-SFED graph, the frequency corresponding to the maximum amplitude is the center frequency that we want. The BW is fixed. Therefore, the resonance demodulation can be performed for gear diagnosis. The value of the maximum amplitude in the SF-SFED graph is named as FIRER, which can be used as a health indicator for gear prognosis. The overall procedure of the SF-SFED-based demodulation technique to conduct gear diagnosis and prognosis is described in Figure 1.
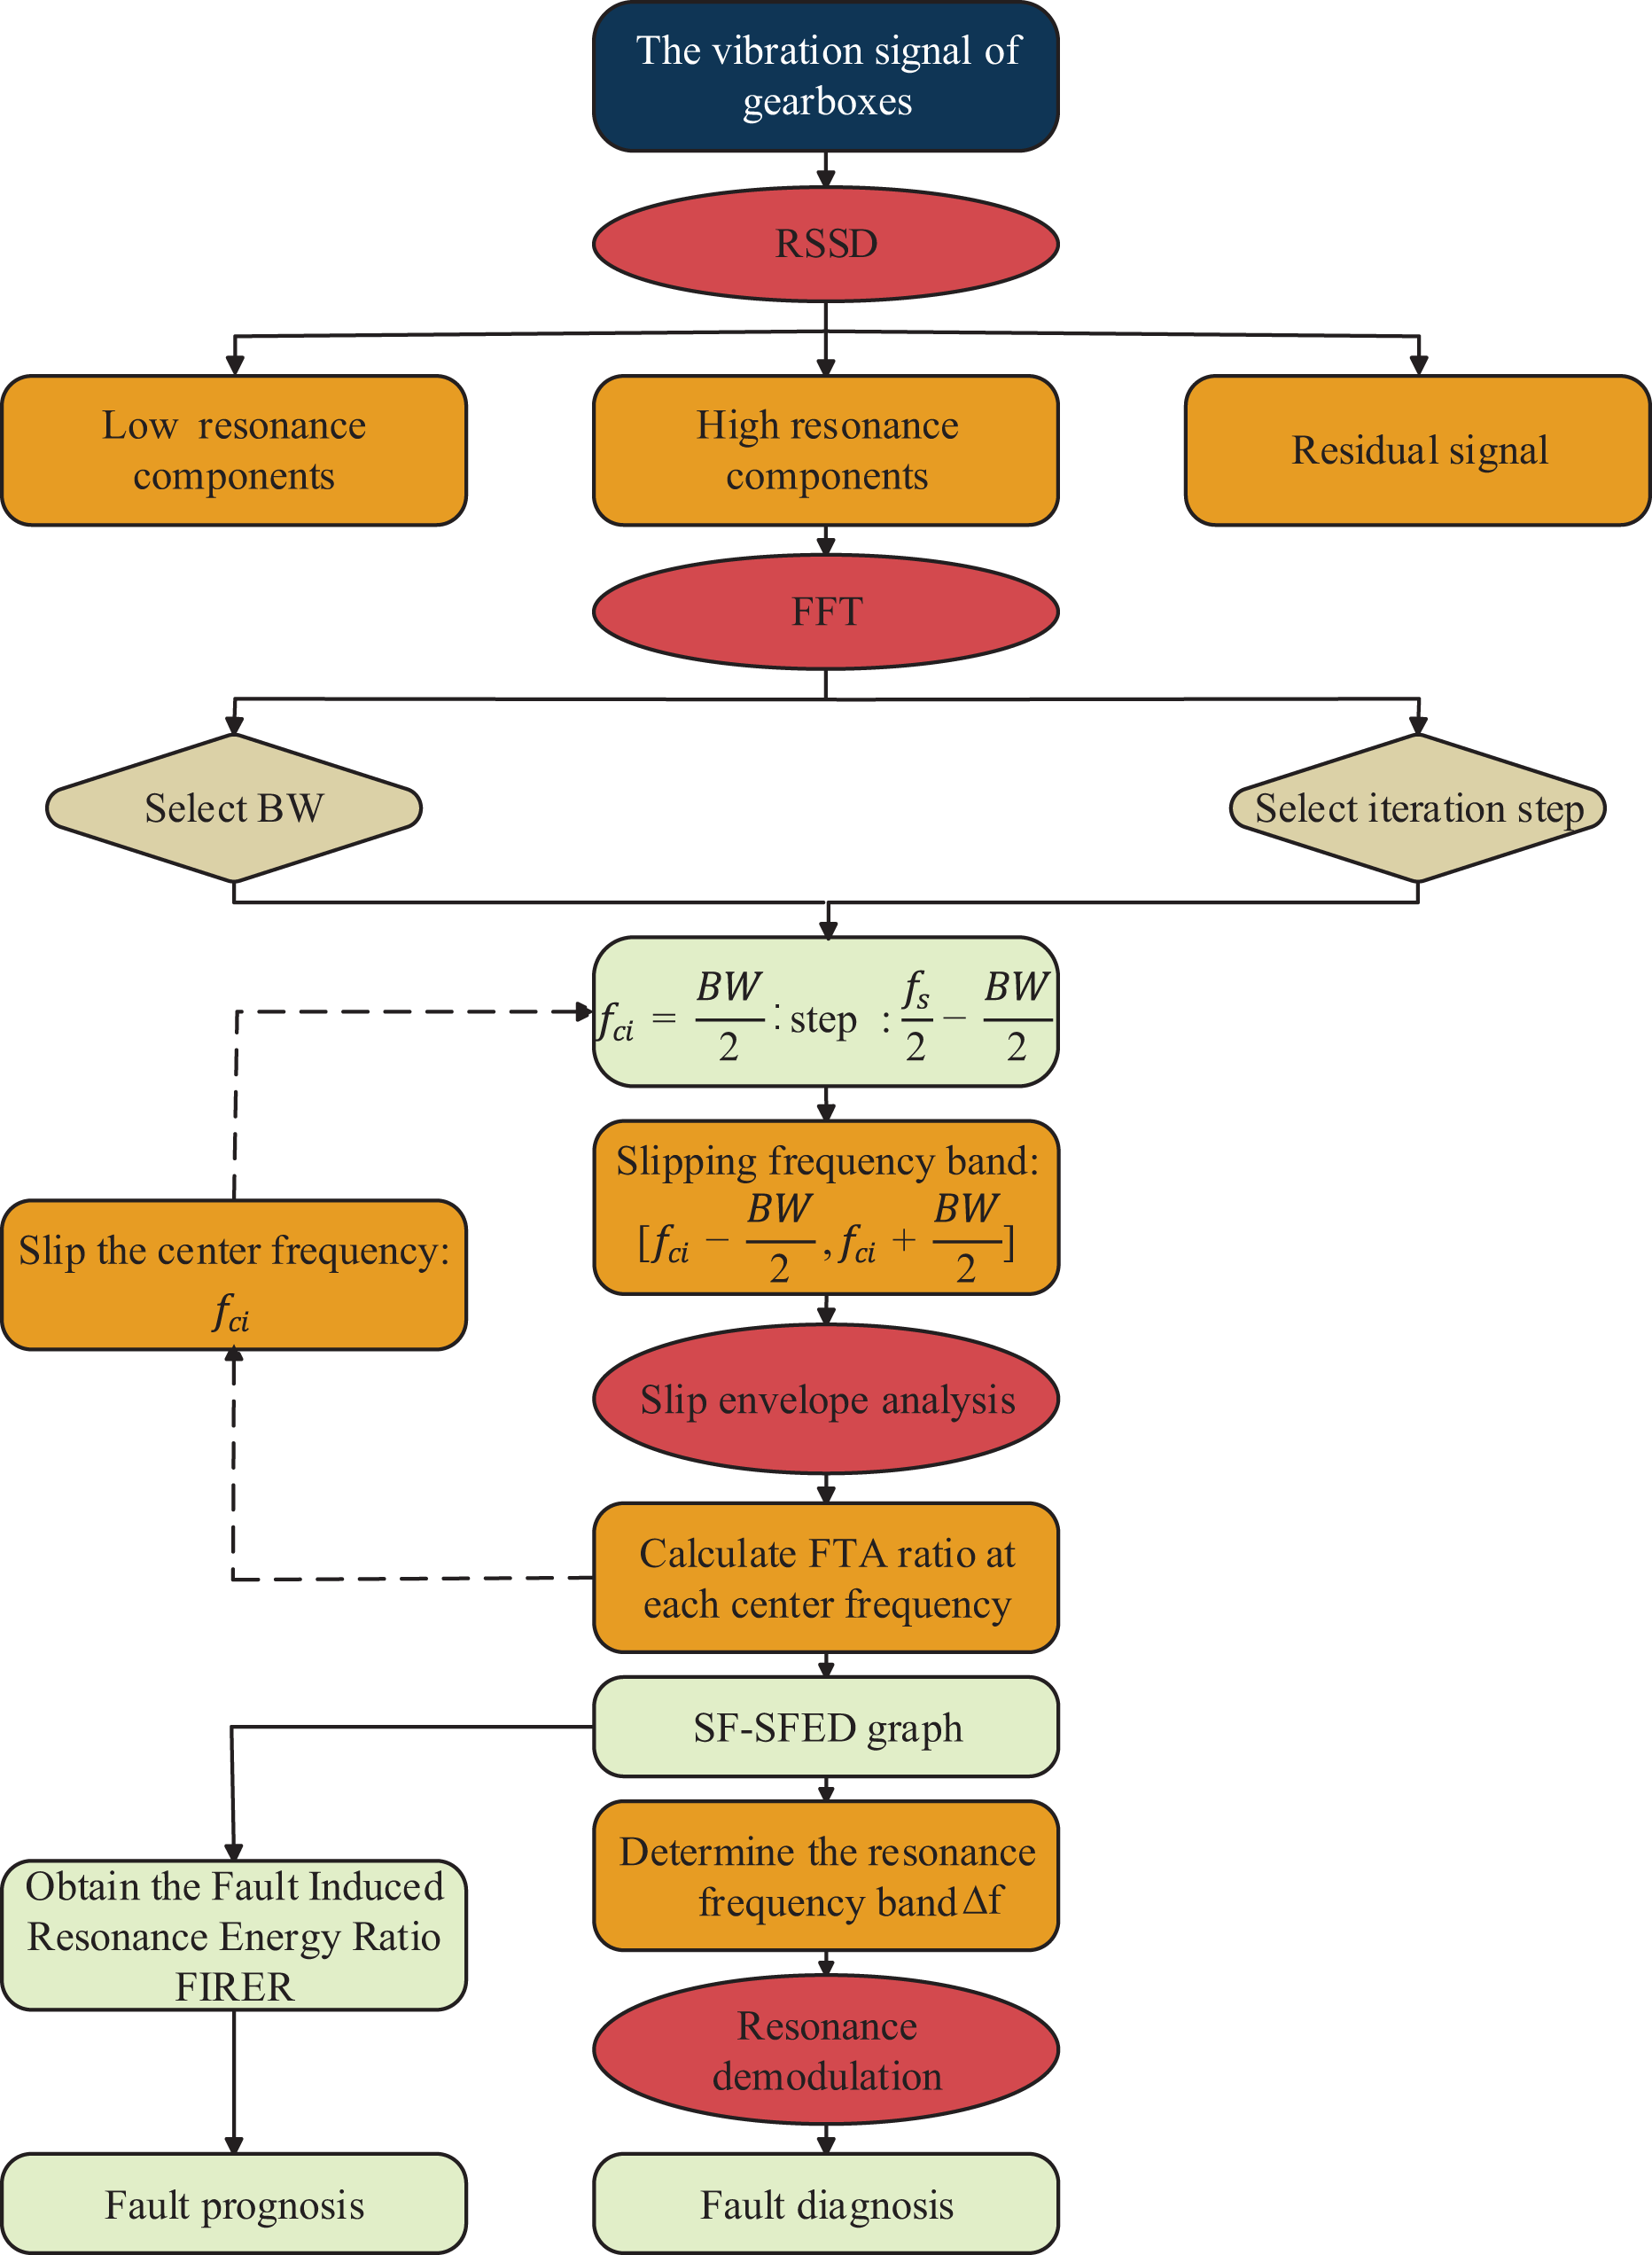
The overall procedure of the SF-SFED-based demodulation technique. SF-SFED: Short-frequency slip fault energy distribution.
Resonance-based sparse signal decomposition
The RSSD method was proposed to process the nonlinear signals based on the resonance property instead of frequency. 39 Using the RSSD technique, the signals are decomposed into the high-resonance part, the low-resonance part, and the residue. Chen et al. 40 pioneered to introduce RSSD to the mechanical fault diagnosis field and proposed a scheme to diagnose the roller bearing fault by combining envelope demodulation with RSSD. Afterward, a large number of researches employing RSSD to diagnose faults in rotating machines have been published. However, there are two different viewpoints about how to select the resonance component decomposed from RSSD. In the literature, 41,42 the authors thought that the response signal due to local faults in rotating machinery presented transient behaviors; therefore, it ought to be classified as the low-resonance component. In contrast, Huang et al. 43 regarded the impact response of the fault as a damped oscillation. They thought the amplitude of the impact response decreased continuously but still displayed successive oscillation characteristics. Besides, they believed that the low-resonance component belonged to stochastic interferences. According to the idea, Zhang et al. 44 proposed an energy operator demodulation technique for compound faults diagnosis in gearboxes using RSSD. They thought the gear fault characteristic signals had better frequency aggregations; thence, it should belong to the high-resonance component. In our experiments, it was discovered that the high-resonance part carried more useful information, and the low-resonance component, on the contrary, corresponded to random interferences. Therefore, in this study, we extract the high-resonance part from the original gear fault signal employing the RSSD technique.
The resonance property of the gear vibration signal can be indicated using the quality factor Q. It represents the ratio between its center frequency to its BW. The higher the Q value, the stronger the resonance property.
TQWT
45
is used to get basic function libraries of high and low Q transforms and obtain corresponding transformation coefficients of the RSSD method. It is realized using the two-channel band-pass filters which are shown in Figure 1, where

Diagrammatic sketch of L layer TQWT. HPS: High-pass scale; LPS: low-pass scale; TQWT: tunable-Q wavelet transform.


where

It can be checked that


It can be seen that as the decomposition level increases, the center frequency and BW reduce accordingly.
Signals acquired from physical systems are seen as the composite of two different parts, and each of them has an oscillation behavior, namely sustained oscillations and transients. The signal components are individually sparsely expressed with a TQWT. To establish the perfect sparse expressions for both high- and low-resonance components, a famous feature separation method, morphological component analysis (MCA), 46 can be used to disentangle the two parts nonlinearly. Suppose the observed signal y consists of the high-resonance part y 1 and the low-resonance part y 2

The aim of MCA is to estimate y
1 and y
2 from y. Assuming y
1 and y
2 can be represented by the basic functions with high and low Q values
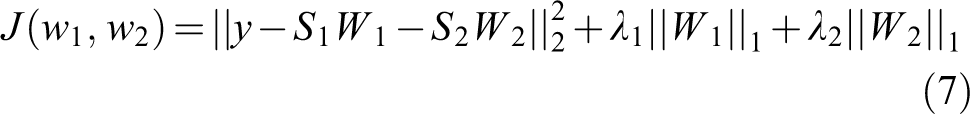
where
Assume the cost function J reaches a minimum value when the corresponding transformation coefficients are

Resonance frequency band determination
Multi-input single-output model
Under practical working conditions, the vibrations inside a gearbox are very complicated. Therefore, the data collected from the gearbox is perplexing. In our study, we use an MISO model to express the vibration of the gearbox,
19
which is displayed in Figure 3. In the system, The MISO model. MISO: Multi-input single-output.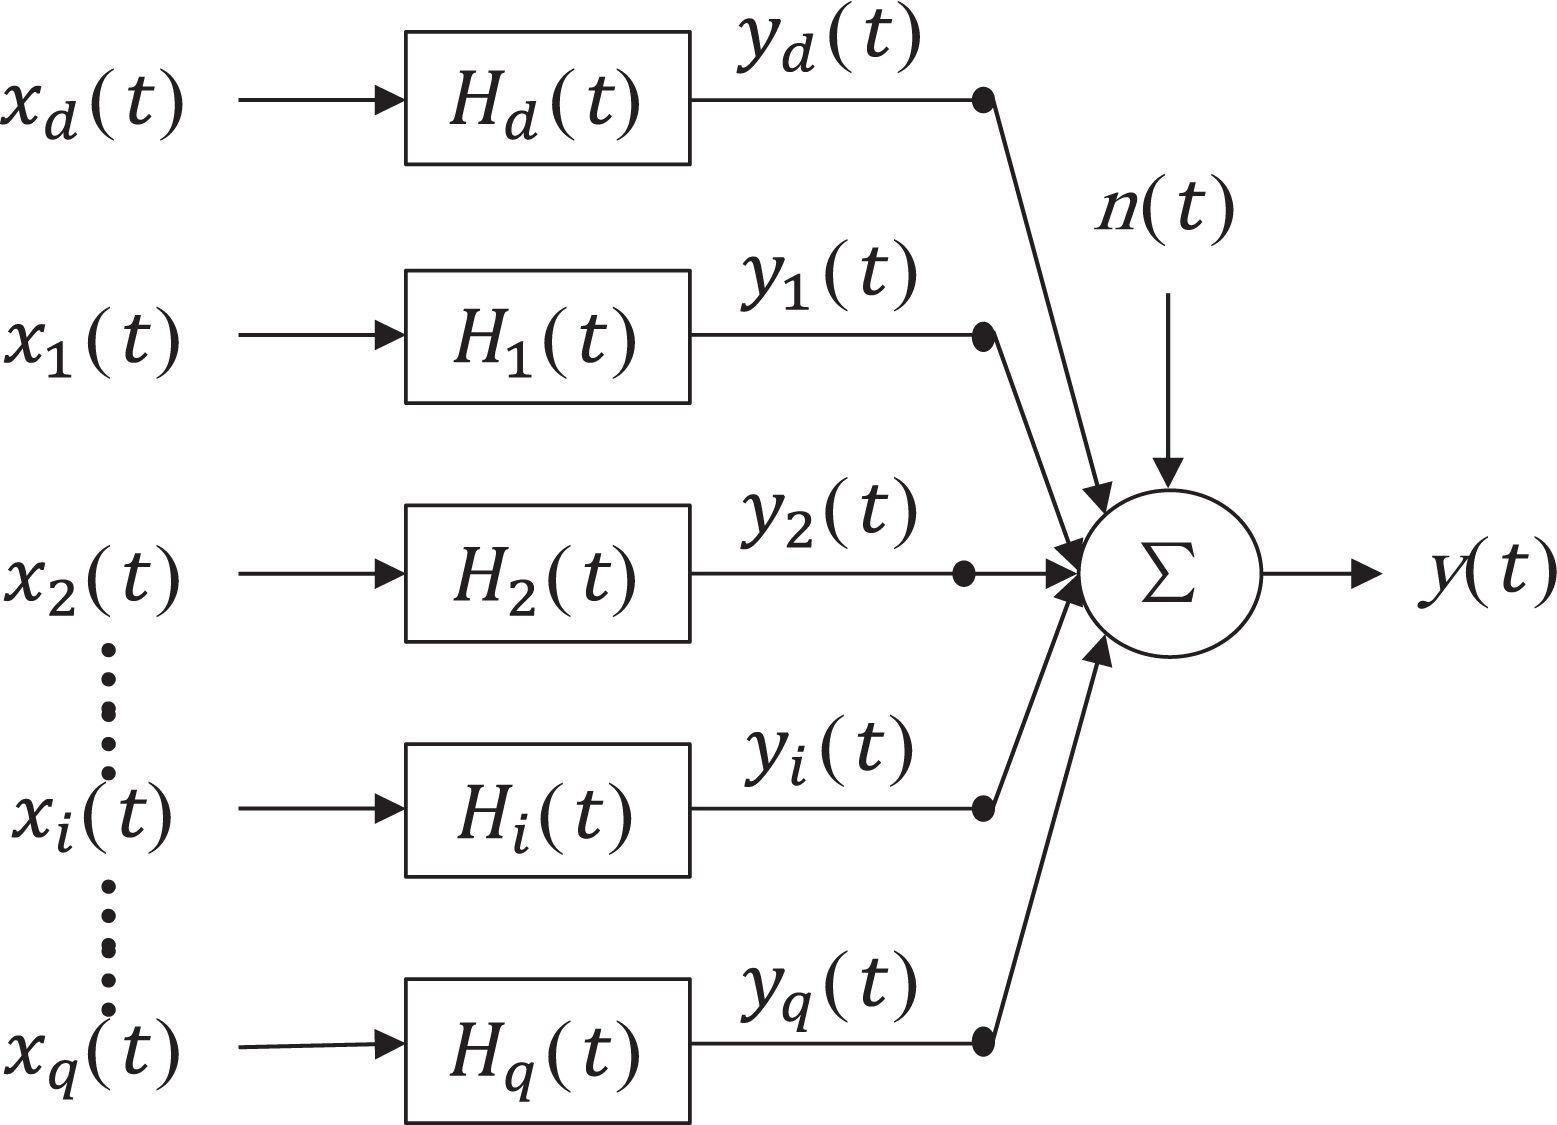

Using the Fourier transform technique, equation (9) is rewritten as
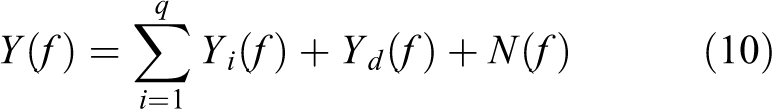
All the outputs are transferred through the transfer functions


Therefore, equation (10) can be expressed as

where
The established MISO model can provide insights into finding the structure resonance induced by the local defect. To achieve the purpose, the “fault-to-all” (FTA) ratio is defined to describe the proportion of output due to local defect, which is represented as

It can be seen that the FTA value is a function of frequency f, which indicates the proportion of vibration energy related to local defect distributed along the frequency axis. To find the resonance frequency band induced by local defect, it should be a good idea to focus attention in the frequency band where the FTA ratio is highest, in other words, to locate the frequency band where the vibration energy produced by the local fault is dominant. This is realistic when the structural resonance of the system induced by local fault exists in one frequency band, but other signal components in the band are small. Therefore, the next section introduces a solution of finding out the frequency range where the FTA ratio is highest, namely the fault-induced resonance frequency band.
Determination of the center frequency with SF-SFED graph
The specific idea is to fix the BW and slip the center frequency

where

The Fourier transforms of

where fd
is the fault-related frequency, the frequency band
According to the definition of FTA, when the center frequency
Determination of the BW
The determination of the BW is a compromise in many aspects. It should be as small as possible, as this can make the filtered signal clearer. Theoretically, in gear fault diagnosis with a demodulation technique, the BW can be small enough to demodulate only a single frequency related to the local fault. However, this is impossible. The main reason is that the signal within the BW is supposed to include a relatively large percentage of energy produced by the local fault. Taking these considerations into account, we suggest selecting a BW that only includes the first three harmonics of the characteristic frequency.
Resonance demodulation
As we have obtained the center frequency fc
and BW, the demodulation technique is utilized to extract the gear fault-related information. The found frequency band is

where

The Fourier transforms of
Health indicator for prognosis
From the SF-SFED graph, it is an easy task to locate the center frequency where the corresponding FTA ratio is the highest. According to our analysis, the maximum FTA value is considered as the proportion of output vibration energy due to fault-induced resonance. The maximum value of FTA is named as FIRER, which can be represented as

When a localized defect such as gear cracking takes place, the stiffness of a particular gear tooth reduces as the crack propagates. Therefore, the vibration impacts produced by the defect will be more severe, and it will in turn excite stronger structure resonance. According to the definition of FIRER, the value of it will increase accordingly. Therefore, FIRER can be used as a health indicator to measure the amount of gear degradation.
Experiment analysis
Application to simulated data
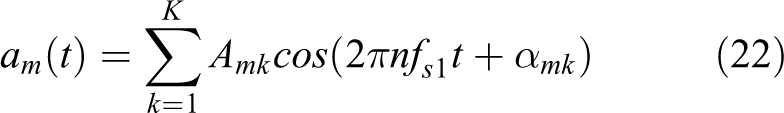
First of all, the performance of the algorithm was validated using the numerically simulated data. Generally, the vibration signal collected from a healthy gear transmission can be modeled by meshing vibrations accompanied with amplitude and phase demodulation. Considering the background noise, the gear vibration simulation can be described by the following formula 48

where m (0, 1,…, M) is the number of mesh harmonics, Pm
is the amplitude of mth harmonic component at the gear mesh frequency fm
, and

where

where N is the tooth number of the pinion.
When there exists a local fault, it will generate vibration impact which will in turn excite structure resonance. Suppose the local fault occurs on the gear, the vibration impulse signal, produced by the fault, can be modeled as

where

where A is a constant coefficient and
During the simulation, we assumed that the driving and driven gears had 13 and 35 teeth, respectively. We set the sampling frequency to 20,000 Hz. The pinion shaft rotational frequency

(a) Time waveform, (b) frequency, and (c) envelop spectrums of the simulated signal and (d) time waveform, (e) frequency, and (f) envelop spectrums of the high-resonance component.
By referring to the principle for determining the BW presented in the second section, we suggested selecting a BW which only included the first three harmonics of the characteristic frequency, here

The SF-SFED graph acquired from the high-resonance component. SF-SFED: Short-frequency slip fault energy distribution.
Since the center frequency and BW had been determined as 1000 and 20 Hz, an optimal filter could be established to perform the resonance demodulation technique. The demodulated time waveform and the corresponding envelop spectra are demonstrated in Figure 6. The time-domain signal successfully reveals the vibration impacts produced by the local fault. Similarly, the gear-shaft rotational frequency, which is also the fault characteristic frequency, can be clearly identified in the envelop spectra. It is proved that the proposed methodology has a great performance in gear fault diagnosis.
(a) Time waveform and (b) envelop spectrum of the demodulated signal.
Application to rig test data
In this section, the gearbox vibration signal was collected from a gear test bench. The faulty gears with different depths of tooth cracking were used in our experiments to verify the effectiveness of the proposed methodology.
Experimental setup
Figure 7 demonstrates the configuration of the gear test bench. Two spur gears were installed, and the gear numbers of the pinion and gear were 19 and 55. The gearbox was connected with an electromagnetic brake, which was controlled by a tension controller. The power of the system was provided by the servo motor, which was dominated by a servo drive to change the rotating speed. The vibration of the gear with artificial local fault was measured by an acceleration transducer. The sampling frequency used in the experiment was 25,600 Hz.
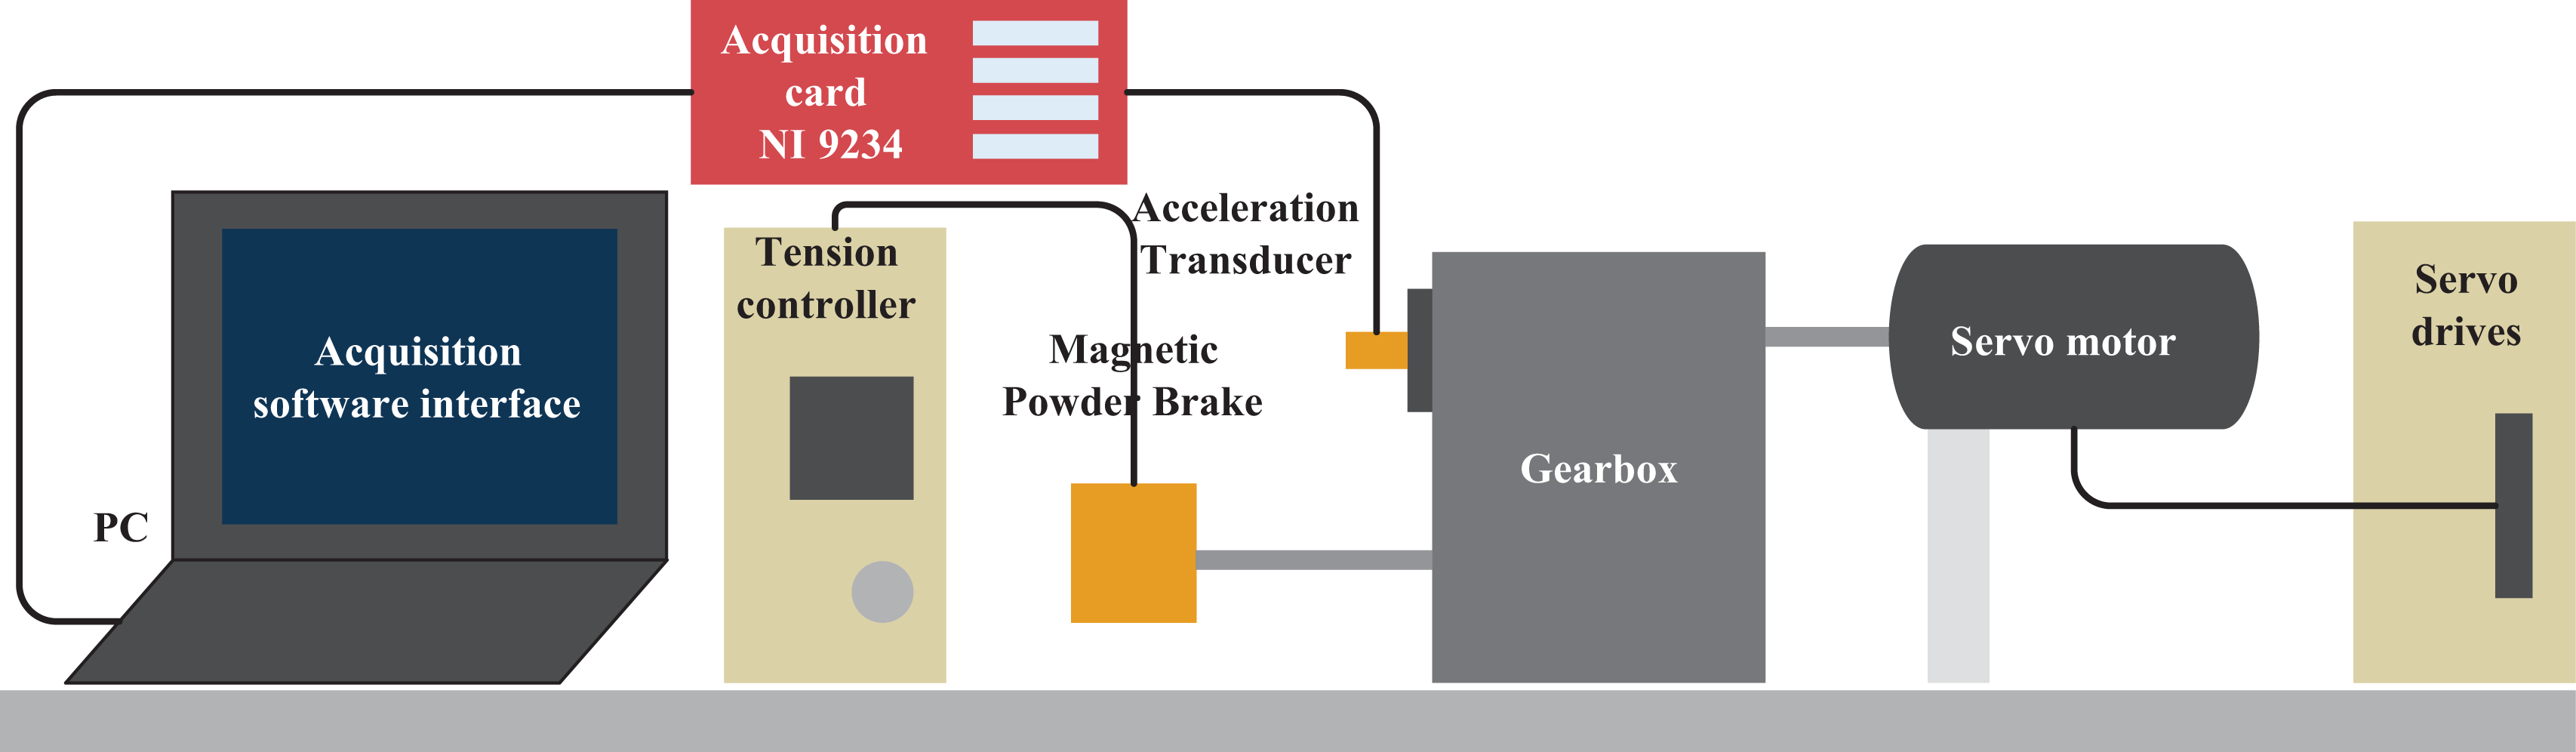
Test rig diagram of the rotor-gearbox system.
Experiment with mildly cracking gears
To test the usefulness of the proposed methodology for incipient fault detection, the proposed method was applied to mildly cracking gears under two different rotating speeds.
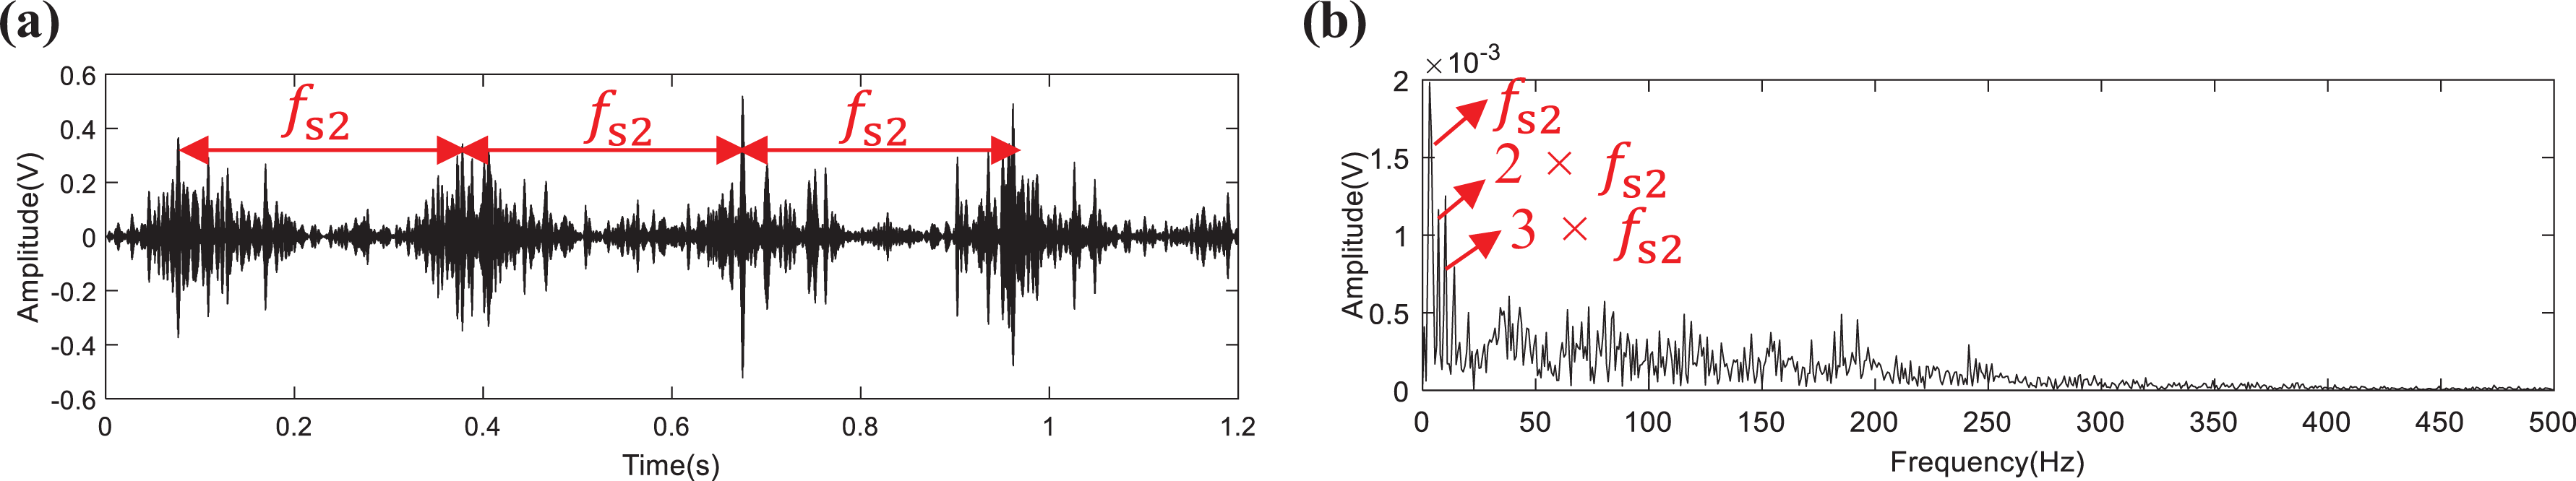
Figure 8(a) to (c) demonstrate the time waveform, its frequency, and envelop spectrums of the vibration signal collected as the rotating speed is 607 r/min. Accordingly, the fault-related frequency
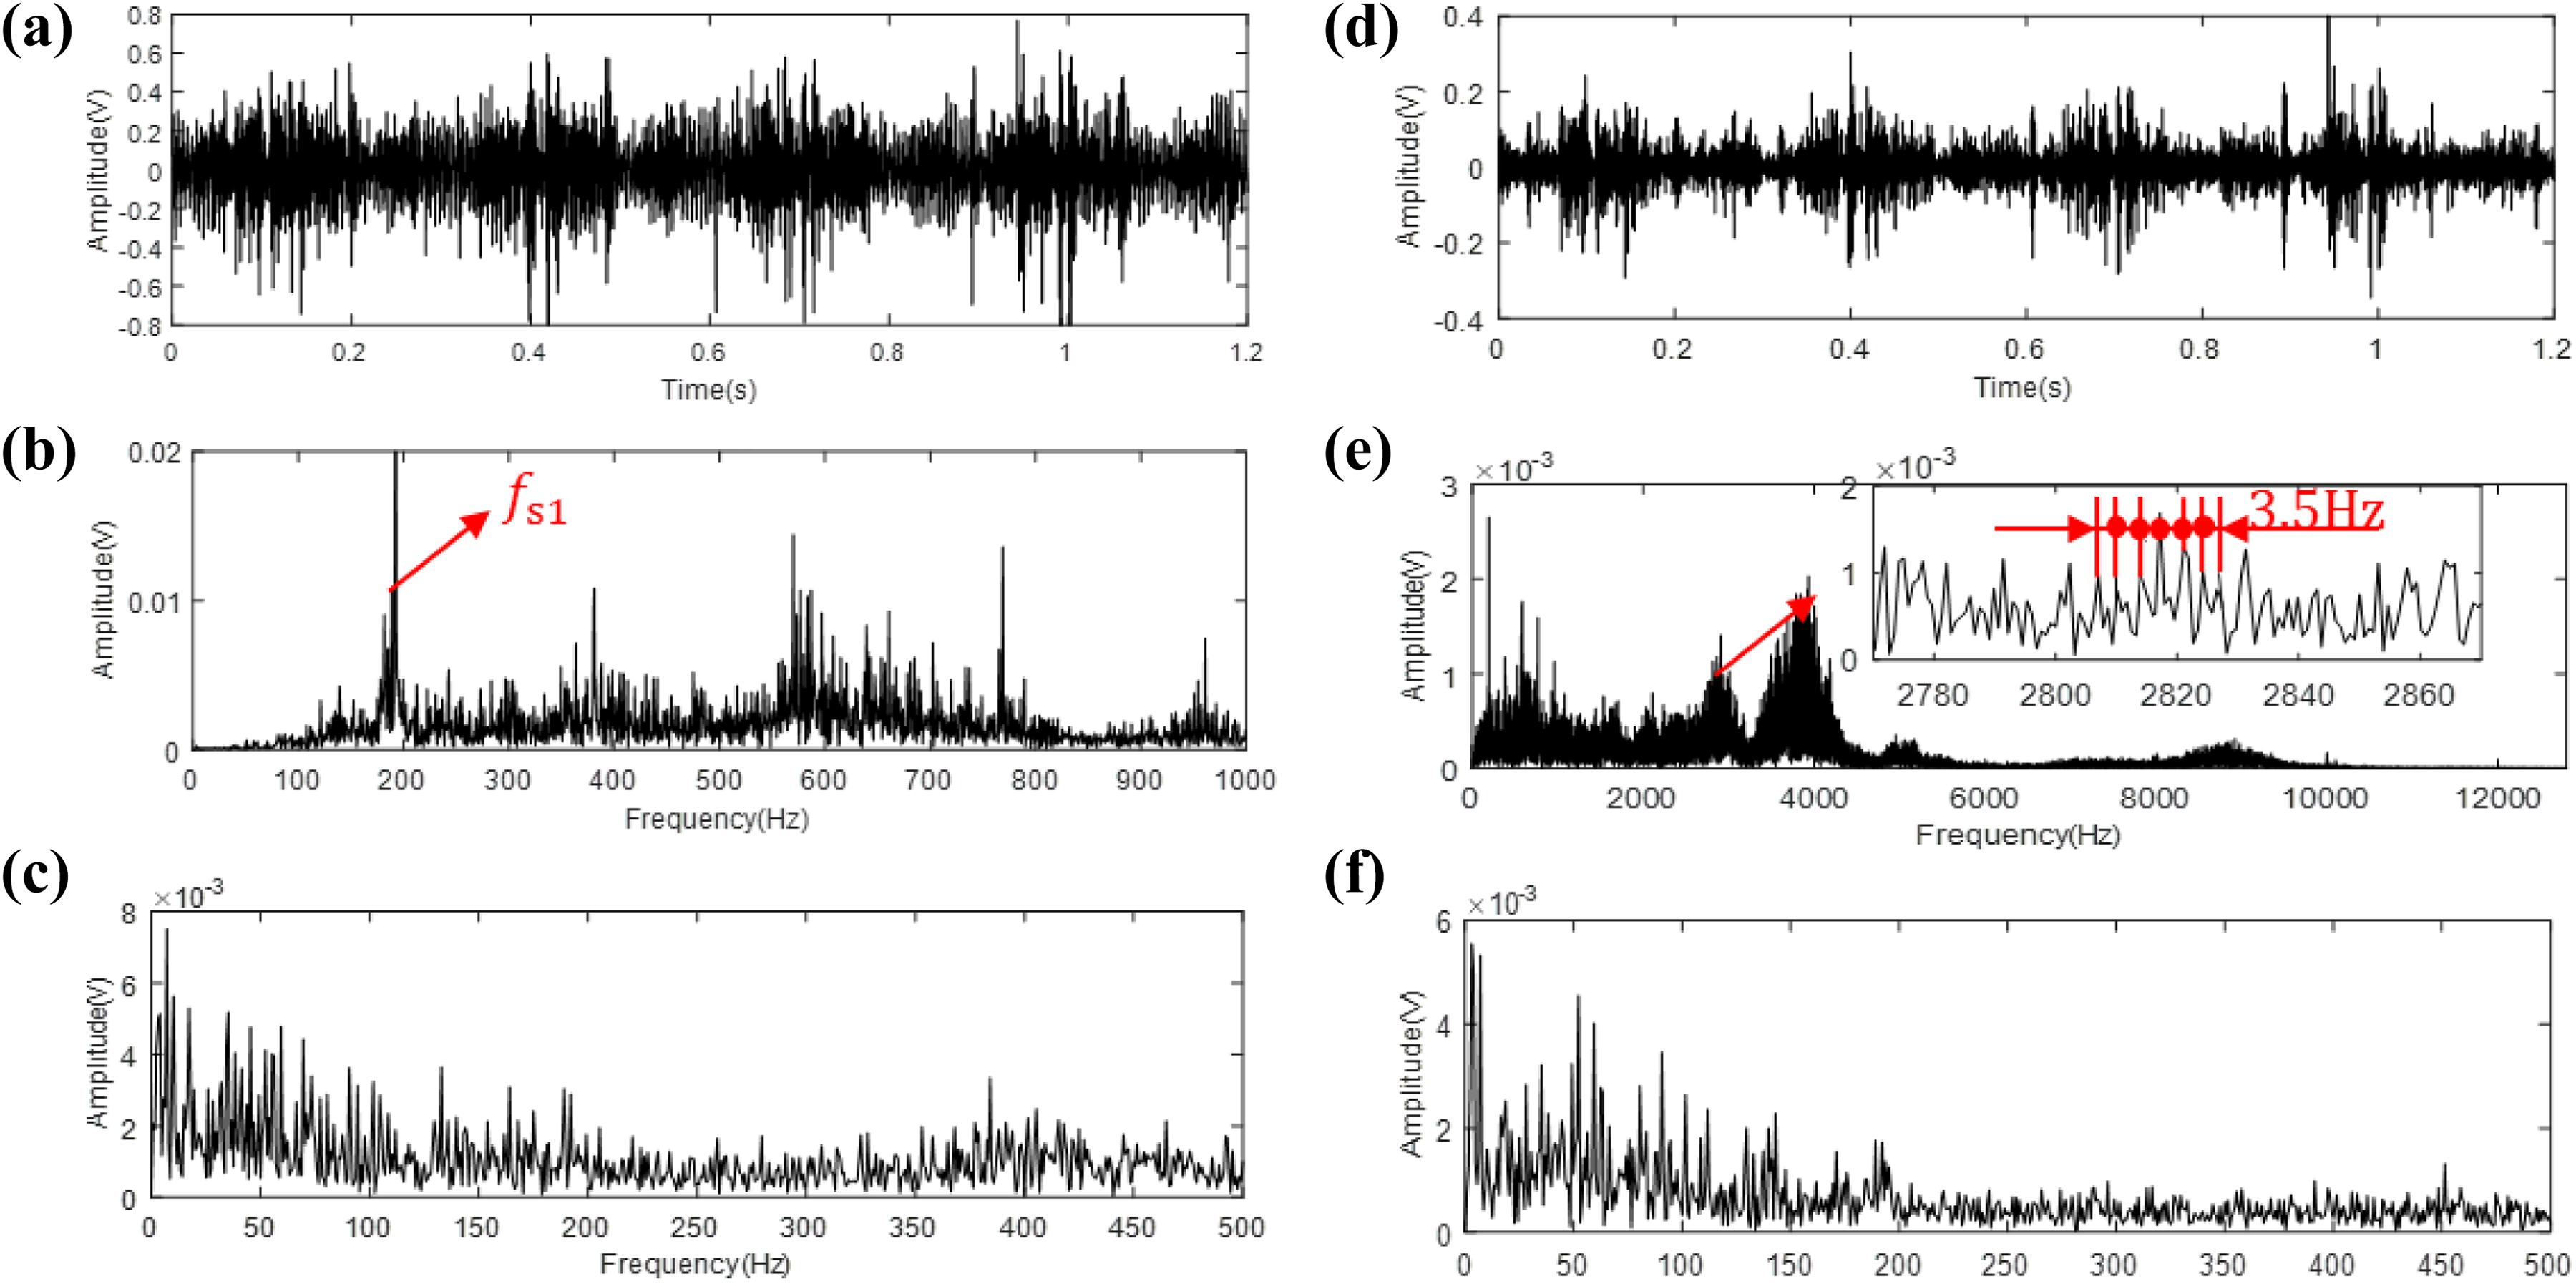
(a) Time waveform, (b) frequency, and (c) envelop spectrums of the mildly cracking gear signal collected as the rotation speed is 607 r/min and (d) time waveform, (e) frequency, and (f) envelop spectrums of the high-resonance component.
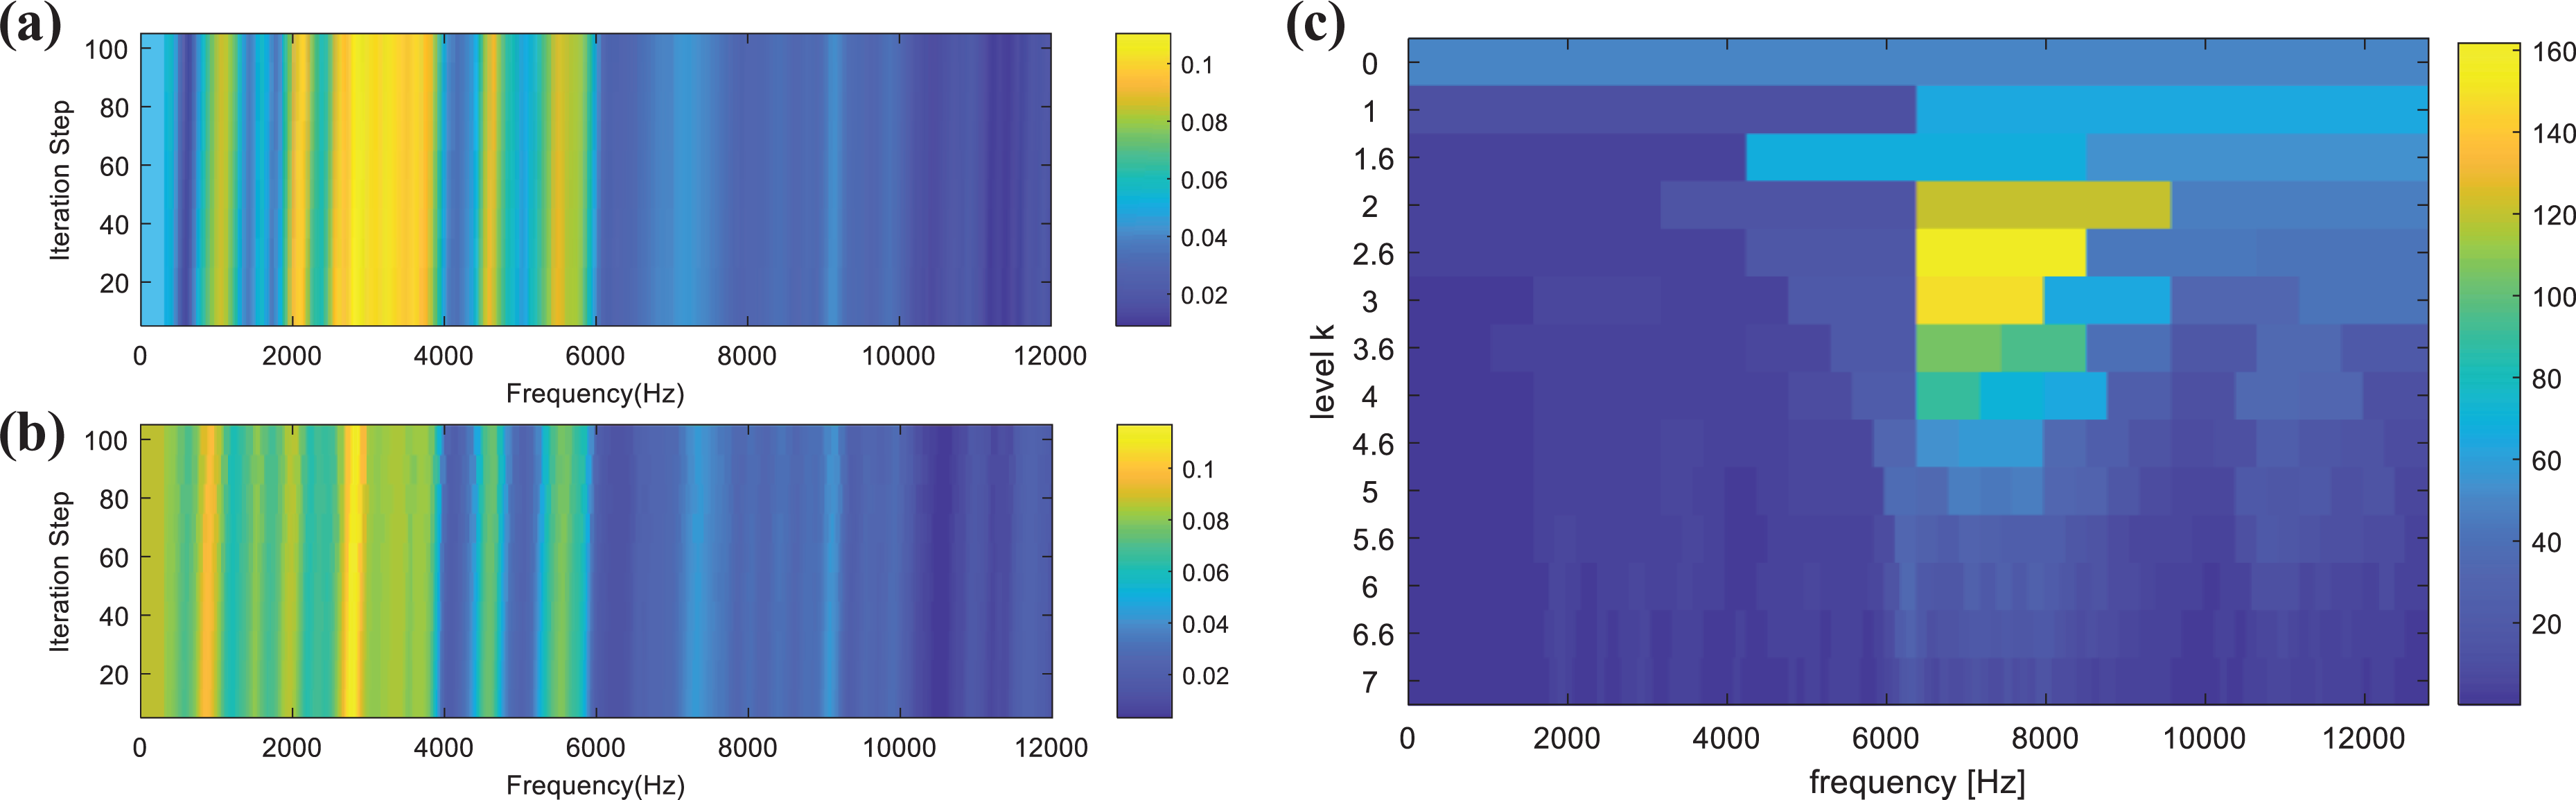
The SF-SFED graphs acquired from (a) the original time-domain signal and (b) the high-resonance component signal of the mildly cracking gear signal collected as the rotation speed is 607 r/min. (c) The fast Kurtogram acquired from the high-resonance component signal of the mildly cracking gear signal collected as the rotation speed is 607 r/min. SF-SFED: short-frequency slip fault energy distribution.
To better test the superior performance of the algorithm, we compared the results obtained from the SF-SFED graph with that from kurtogram. The fast kurtogram of the high-resonance component is illustrated in Figure 9(c), which detects the center frequency as 7466 Hz and the BW as 2133 Hz. According to the frequency spectrum in Figure 8(e), the results are obviously incorrect.
Once the resonance frequency band had been determined, the demodulation technique could be used to separate the fault-related signals. The time-domain signal demodulated from the high-resonance component and the corresponding envelop spectra are shown in Figure 10. The vibration impacts produced by the local defect can be clearly extracted from the demodulated time waveform. Furthermore, the fault-related frequency and its first three harmonics can also be successfully found out from the demodulated envelop spectrum.

(a)Time waveform demodulated from the high-resonance component and (b) the corresponding envelop spectrum of the mildly cracking gear signal collected as the rotation speed is 607 r/min.
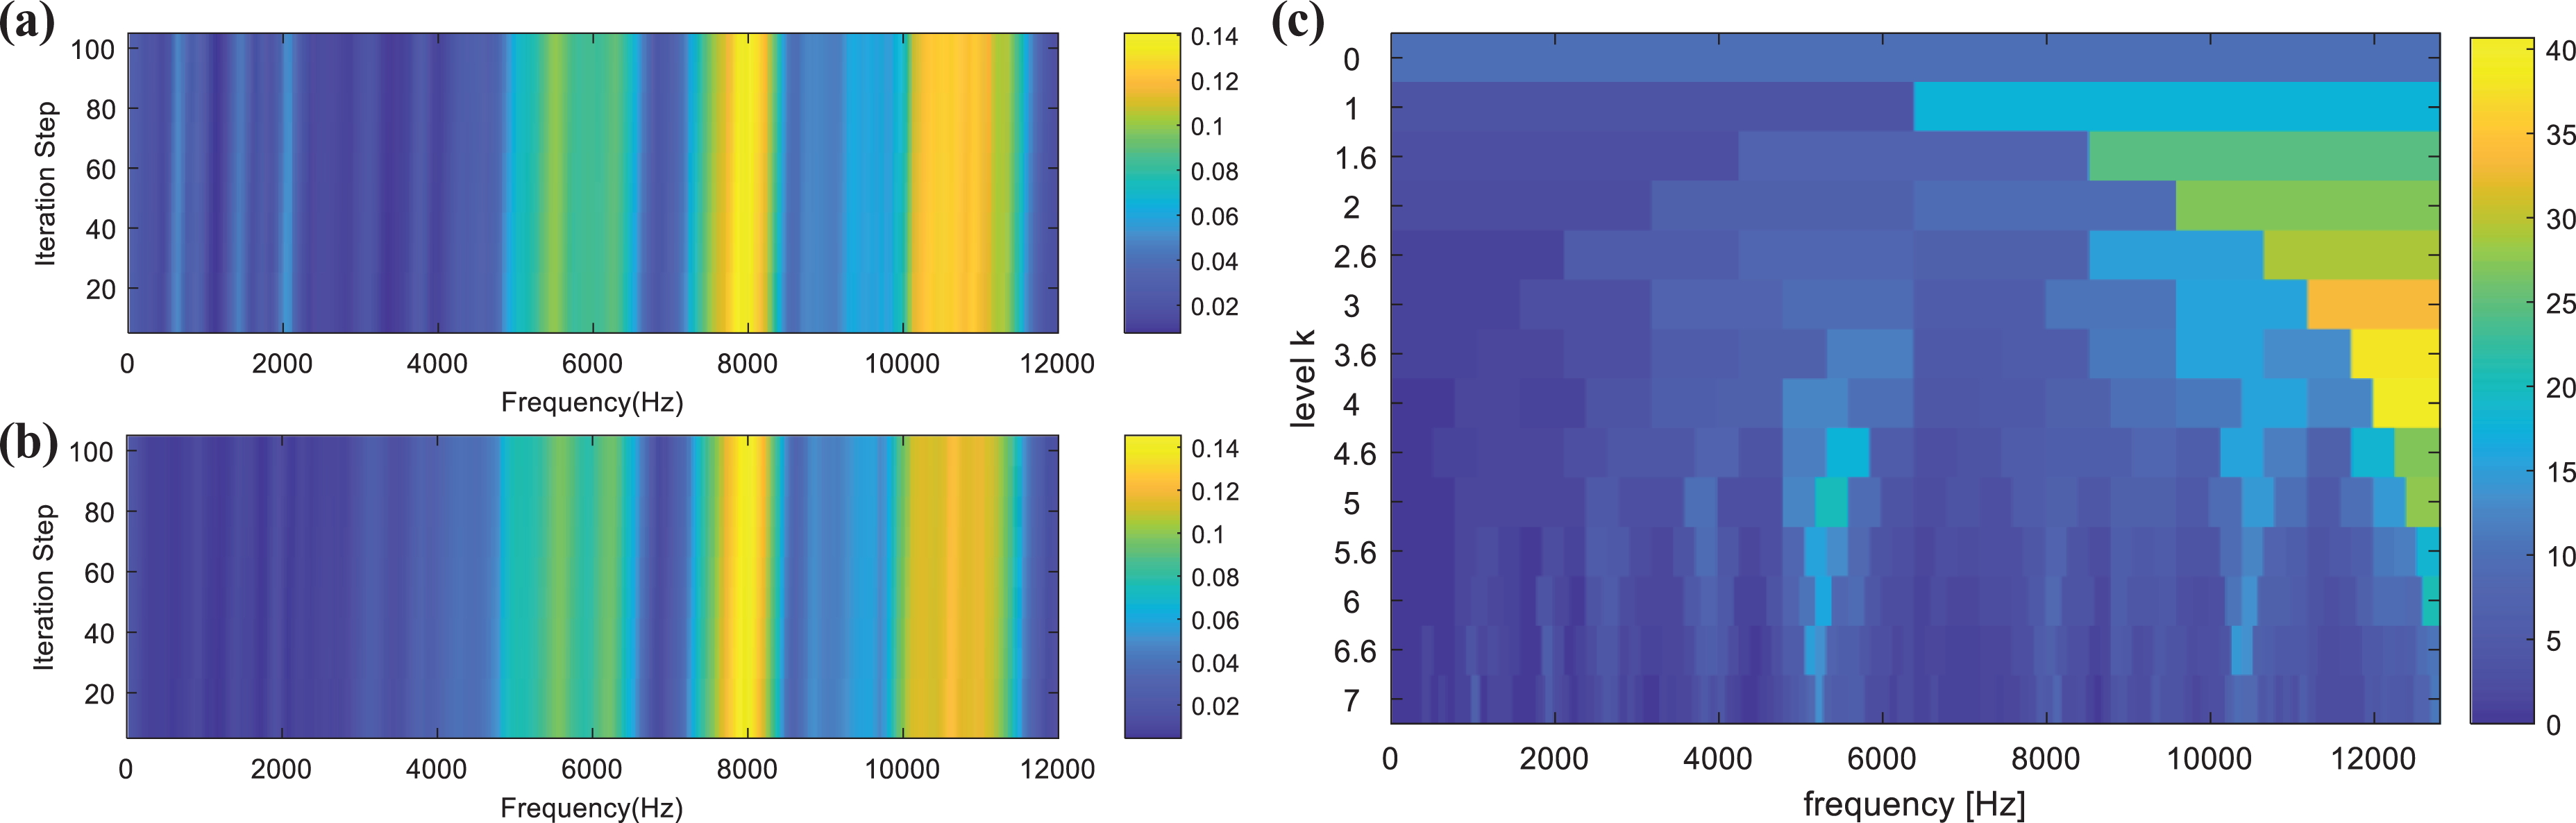
Then, the same procedures above were applied to gear vibration data acquired as the rotating speed was 1215 r/min. The corresponding fault passing frequency could be calculated as 7 Hz. Figure 11(a) to (c) displays the original time-domain signal, its frequency, and envelope spectrums, from which almost no fault-related information can be found. Similarly, to achieve the aim of fault diagnosis, the high-resonance component, the corresponding frequency, and envelop spectrums were firstly obtained and displayed in Figure 11(d) to (f). The BW was chosen as 30 Hz. Based on it, two SF-SFED graphs obtained from the original time-domain signal and the high-resonance part are illustrated in Figure 12. We can see that it is much easier to locate the center frequency from the SF-SFED graph obtained from the high-resonance component. In Figure 12(b), the maximum FTA ratio locates approximately at 3890 Hz. In Figure 11(e), there is also an obviously defined resonance peak centered at around 3890 Hz, and the sidebands are exactly 7 Hz. Similarly, the fast kurtogram of the high-resonance component was obtained and demonstrated in Figure 12(c). Again, it does not detect the accurate center frequency and BW.

(a) Time waveform, (b) frequency, and (c) envelop spectrums of the mildly cracking gear signal collected as the rotation speed is 1215 r/min; (d) time waveform, (e) frequency, and (f) envelop spectrums of the high-resonance component.

The SF-SFED graphs acquired from (a) the original time-domain signal and (b) the high-resonance component signal of the mildly cracking gear signal collected as the rotation speed is 1215 r/min. (c) The fast Kurtogram acquired from the high-resonance component signal of the mildly cracking gear signal collected as the rotation speed is 1215 r/min.
Finally, by designing the optimal band-pass filter, the resonance demodulation technique was employed to highlight the change in amplitude created by the local defect. The demodulated time-domain signal and the envelop spectra are illustrated in Figure 13. The vibration impulses in the time waveform clearly reveal the fault-induced impacts, and the fault-related frequency and the first three harmonics can be easily extracted from the envelop spectra.

(a) Time waveform demodulated from the high-resonance component and (b) the corresponding envelop spectrum of the mildly cracking gear signal collected as the rotation speed is 1215 r/min.
Experiment with severely cracking gears
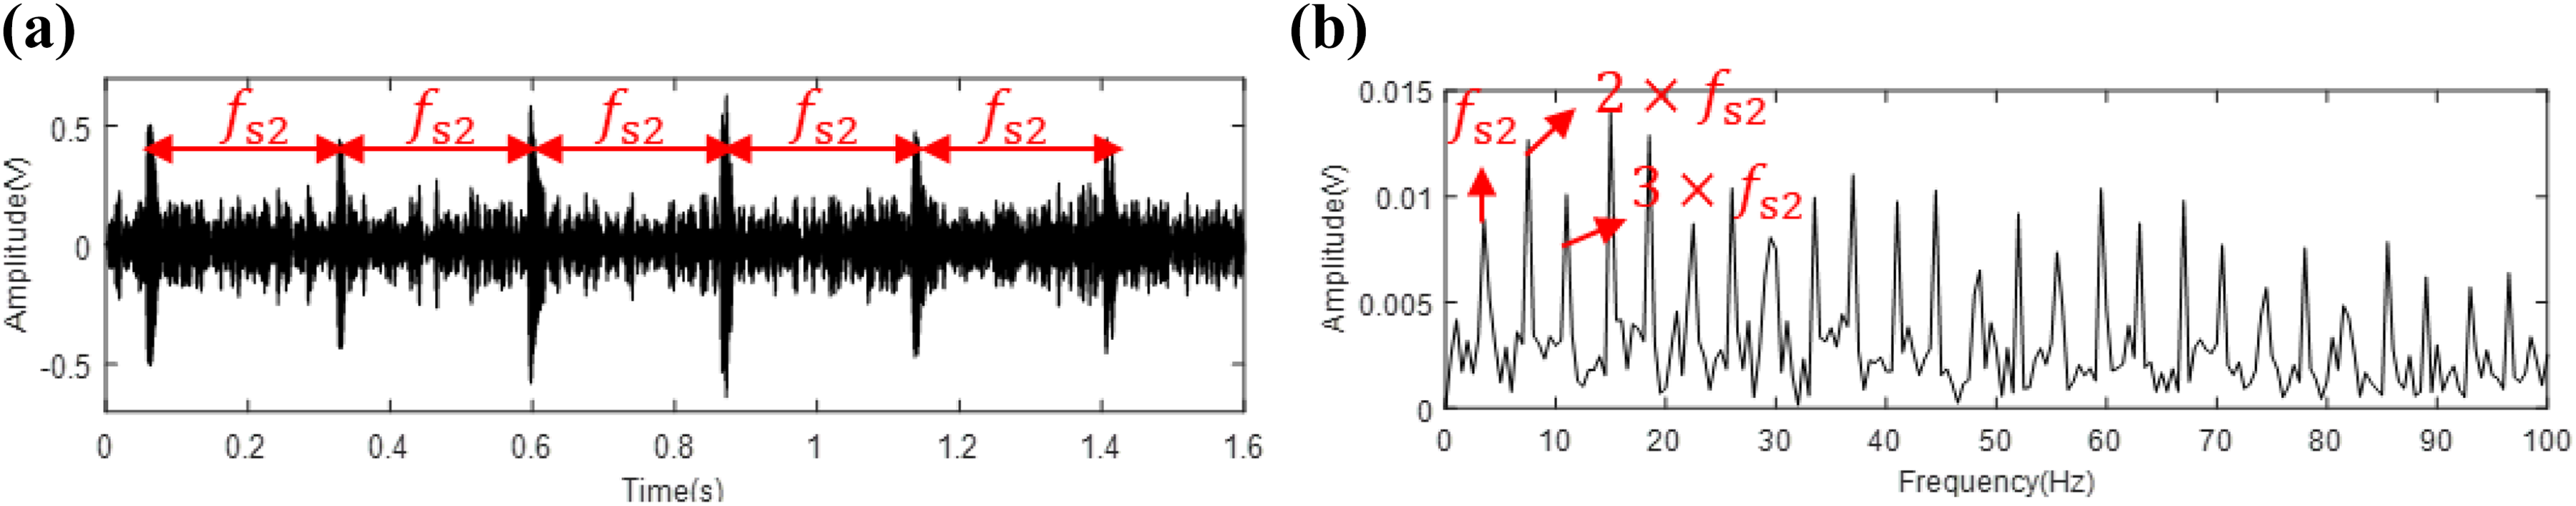
The proposed technique was also applied to severely cracking gears under two different rotating speeds, to study the performance of the method for prognosis. Figure 14(a) to (c) shows the time waveform, its frequency, and envelop spectrums of the gear data collected when the rotating speed is 607 r/min with the severely cracking gear. The fault passing frequency was 3.5 Hz. Inspired by the strategy detailed in the third section, the high-resonance component was firstly decomposed from the original signal and displayed in Figure 14(d). Based on it, the SF-SFED graphs obtained from both the original time-domain signal and the high-resonance part are illustrated in Figure 15(a) and (b) from which the center frequency is chosen as 7950 Hz. The fast kurtogram of the high-resonance part is demonstrated in Figure 15(c). This time, the fast Kurtogram cannot indicate an effective frequency band. By performing the resonance demodulating technique, the demodulated time-domain signal and its envelop spectra are demonstrated in Figure 16. It can be noticed that the fault-induced impacts are easily marked out in Figure 16(a). Besides, the fault passing frequency 3.5 Hz and its harmonics are clearly identified from Figure 16(b).

(a) Time waveform, (b) frequency, and (c) envelop spectrums of the severely cracking gear signal collected as the rotation speed is 607 r/min; (d) time waveform, (e) frequency, and (f) envelop spectrums of the high-resonance component.
The SF-SFED graphs acquired from (a) the original time-domain signal and (b) the high-resonance component signal of the severely cracking gear signal collected as the rotation speed is 607 r/min. (c) The fast Kurtogram acquired from the high-resonance component signal of the severely cracking gear signal collected as the rotation speed is 607 r/min.
(a) Time waveform demodulated from the high-resonance component and (b) the corresponding envelop spectrum of the severely cracking gear signal collected as the rotation speed is 607 r/min.
Then, the same procedures were applied to the gear signal collected as the rotating speed was 1215 r/min. The time waveform, the frequency, and envelope spectrums are displayed in Figure 17. The fault-related frequency was 7 Hz, which could not be easily identified in the envelop spectrum. According to the proposed method, the high-resonance component, its frequency, and envelop spectrums were firstly obtained and shown in Figure 17(d) to (f). Based on it, the center frequency was determined by drawing the SF-SFED graph, and it was chosen as 8000 Hz from Figure 18(a) and (b). According to Figure 18(c), the fast kurtogram still cannot detect an effective frequency band. By performing the resonance demodulation method, the demodulated time-domain signal and its envelop spectrum are demonstrated in Figure 19. The vibration impulses are clearly identified in Figure 19(a); the fault-related frequency is dominant in Figure 19(b).

(a) Time waveform, (b) frequency, and (c) envelop spectrums of the severely cracking gear signal collected as the rotation speed is 1215 r/min; and (d) time waveform, (e) frequency, and (f) envelop spectrums of the high-resonance component.

The SF-SFED graphs acquired from (a) the original time-domain signal and (b) the high-resonance component signal of the severely cracking gear signal collected as the rotation speed is 1215 r/min. (c) The fast Kurtogram acquired from the high-resonance component signal of the severely cracking gear signal collected as the rotation speed is 1215 r/min.

(a) Time waveform demodulated from the high-resonance component and (b) the corresponding envelop spectrum of the severely cracking gear signal collected as the rotation speed is 1215 r/min.
Results and discussion
The four experiments above follow the same procedures, no matter what the rotating speed is or how severe the fault is, the original signals do not show any fault related information. However, after processing with the proposed method based on resonance demodulation, the vibration impacts induced by the local fault can be easily marked out in the demodulated time-domain signal. Moreover, the fault-related frequency becomes dominant in the envelop spectrum. The positive results successfully validate the diagnostic performance of the algorithm. Besides, the RSSD technique is proved to be an essential step pre-performed to exclude the random interferences, especially for early detection of local gear defects. By comparison with the fast kurtogram method, the proposed algorithm has also been proved to have superior performance in extracting the local fault features of the gearbox with high background noise.
To test and verify the prognostic performance of the defined health indicator, the FIRER values of the four experiments are summarized in Table 1, which can be easily obtained from the four SF-SFED graphs. As can be concluded from Table 1, for both rotating speeds, the severer the defect, the higher the FIRER values. The most likely reason is that as the crack propagates, the stiffness of the gear tooth reduces, the fault-induced vibration impacts, and the structure resonance produced by it become stronger thereby. Since FIRER denotes the proportion of vibration energy devoted by the local defect, its value is supposed to increase when the fault becomes severer. Considering the experiment results and the analysis, the FIRER value can be used as a perfect health indicator for gear prognosis.
Comparison of the FIRER values.
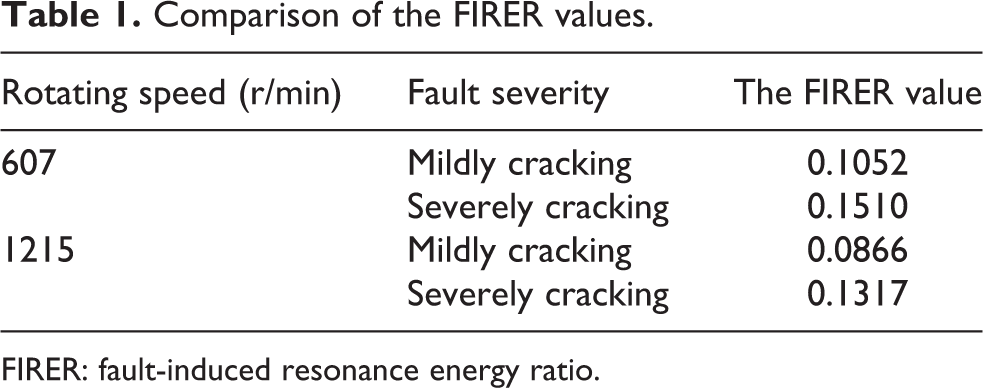
FIRER: fault-induced resonance energy ratio.
Conclusion
The gearbox is the core component in most rotating machines; the diagnosis and prognosis of it are significant for both economic and security concerns. 49,50 In this paper, a methodology was put forward to detect local defects in the gearbox utilizing the SF-SFED-based demodulation technique. The scheme is based on the truth that local gear defects can induce vibration impact pulses which would conversely excite structure resonance. By employing the RSSD method, the high-resonance component was extracted from the original signal because it contained sustained oscillation signals with high-resonance property. Considering the difficulty in determining the resonance frequency band, an MISO model was set up to describe the vibration data of a faulty gear, from which the SF-SFED graph was plotted to locate the center frequency. In the SF-SFED graph, the maximum amplitude corresponding to the found center frequency was defined as FIRER, which was proved to be a perfect health indicator for gear prognosis.
The performance of the proposed methodology was examined with both simulated signal and test data. In the simulated experiment, the fault-induced resonance frequency obtained from the SF-SFED graph was consistent with the theoretical value, which checked the correctness of using the SF-SFED graph for finding the center frequency. In the test rig experiment, the RSSD technique was proved to be an essential step pre-performed to exclude the random interferences, especially when the fault was weak. Moreover, both the simulation and the test rig experiments showed positive results of the proposed algorithm. While the original signals carried no clear information about the local fault, the demodulated time waveform and the envelope spectrum could successfully reveal the fault-induced vibration impulses and its frequency. All these results showed the perfect capability of the proposed methodology to detect local defects in the gearbox. By comparing the experimental results with fast keratogram, the proposed method was proved to be better at extracting the local fault features of the gearbox with high noise especially when the fault was incipient. In addition, by comparing the FIRER values of mildly cracking gears with severely cracking gears, we could conclude that the FIRER value was a reliable health indicator for gear prognosis.
Footnotes
Authors’ note
ST and YH have contributed equally to this work.
Declaration of conflicting interests
The author(s) declared no potential conflicts of interest with respect to the research, authorship, and/or publication of this article.
Funding
The author(s) disclosed receipt of the following financial support for the research, authorship, and/or publication of this article: This study is supported by the National Key R&D Program of China (grant no. 2019YFB2004604); National Natural Science Foundation of China (grant no. 51821093); Zhejiang Provincial Natural Science Foundation (grant no. LR19E050002); and The Key R&D Program of Zhejiang Province (grant no. 2018C01020).