
Abstract
With the rapid development of the equipment industry, people pay more attention to the stress research of materials. However, there is no more suitable and effective method to detect the variation of residual stress. To find an efficient and useful method to analyze the residual stress of the welded parts, this article selects the Q235 component as the research object and produces a detection robot with the core of processing vibration signal and extracting signal data. In combination with the vibration signal extracted by the robot, we study the influence law of the residual stress of the material through numerical simulation and experimental verification. The detection of residual stress is related to the change in the number of taps of the robot and the increase or decrease in the number of taps of the robot. We used the vibration signal extracted by the robot and analyzed the orthogonal parameters of the high-frequency induction welding process parameters to obtain a set of the most unique process parameters: The tapping angle was 7° and the tapping frequency was 300 Hz. We also set up the robot to extract and analyze the vibration signal using four different hammerheads. The results show that the sub-resonance analysis results as the standard, the deviation of the steel head and the aluminum head hammer is about ±10, the result is more accurate, and the frequency of the nylon and plastic hammer is lower, because it is softer. When the hammer is struck, the contact time of the hammerhead with the workpiece is lengthened, so that a lower frequency can be excited.
Keywords
Introduction
Key components in critical equipment areas require long-term operation in high-temperature, high-pressure, and heavy duty environments, and their critical performance determines the stability and reliability of the equipment. The residual stress of the mechanical parts will affect the strength, fatigue, dimensional stability, and corrosion resistance of the parts. Therefore, it is necessary to effectively control the residual stress of the parts during the manufacturing process. Therefore, how to use robots to find and study high-strength materials with higher precision and higher accuracy algorithms to ensure the reliability of material application design has become the focus of current research. 1 It is of great theoretical and practical significance to pay attention to and study the residual stress produced in the process of structural design, production and operation, and to take measures to eliminate and adjust the stress in time, so as to prolong the service life of parts, guarantee the quality of product production, and guarantee the efficiency of production and operation of enterprises, which are important for extending the service life of parts, ensuring product quality and ensuring production and operation efficiency.
Many research teams have begun in-depth analytical research on the importance of measuring residual stress. In the literature, 2 –4 the authors explore the effect of differential growth on peak stress through simple, concentric geometry. The results show that the axial differential growth reduces the peak stress of the inner layer, and changing the thickness of the inner membrane does not greatly affect the peak stress in the residual stress cylinder. In the study by Toribio and Kharin, 5 the authors analyzed the distribution of residual stress and plastic strain obtained after different drawing conditions and their effects on the hydrogen embrittlement (HE) sensitivity of the wire. It is therefore possible to optimize the conditions for industrial cold drawing to produce commercial prestressed steel wires with improved resistance to HE phenomena. In the literature 6,7 the complex thermal history of parts manufactured by the authors through selective laser melting leads to complex residual stresses. The results show that the distribution and evolution of residual stress along the height direction is significantly affected by the subsequent thermal cycle. In the literature, 8,9 to solve the difficulty of stress gradient testing and calibration of mechanical parts in depth direction, the authors proposed a new technique based on acoustic elastic theory for nondestructive testing and ultrasonic method to characterize residual stress gradient fields. 10 The characterization results show that the stress gradient distribution is consistent with the simulation results in ANSYS. In the literature, 11,12 the authors propose an optical and semi-destructive method for determining surface residual stress, which combines digital image correlation with clear indentation testing. The article uses the indentation test to test the relationship described for different stress states in aluminum. In the literature, 13 –15 the authors consider the steady-state response of periodic excitation in a linear fractional vibration system using a fractional derivative operator. The authors discuss the effects of fractional derivative terms on stiffness and damping. For periodic excitation, the authors use the Fourier series to decompose the periodic excitation into a superposition of harmonic excitation and then uses the result for the principle of harmonic excitation and superposition. In the study by Niu et al., 16 for a given variety of excitation frequencies, the authors used different optimization formulas to compare the analytical solution of the two degrees of freedom (DOFs) system in the numerical example with the topological design of the planar structure. In the study by Huachao and Qin, 17 the authors used the plane beam element to establish the vibration analysis model of the flexible spur gear with elastic foundation and studied its inherent characteristics. The results show that the vibration type of the flexible ring gear with elastic foundation can be divided into three categories: translational vibration mode, flexural vibration mode, and scalable vibration mode. In the study by Panigrahi and Pohit, 18 the authors transform a set of nonlinear algebraic equations into a first nonlinear differential equation of motion for beam amplitude vibration using harmonic balance method. Subsequently, the authors used amplitude-incremental iterative techniques to obtain steady-state solutions in the plane of frequency amplitude. In the study by Lin et al., 19 the authors proposed an analytical solution for the vibration response of a ribbed L-shaped plate using a modal expansion solution. The authors then used an analytical model to study the effect of the ribs on the transmission between the damping and the two plate members of the L-shaped plate.
In the literature, 20,21 the authors proposed a 3-DOF translation parallel manipulator called a three-cone robot. By considering the variation of structural parameters and the distribution of output stiffness, the authors can obtain the maximum stiffness working space through numerical optimization, which provides the basic constraints for the parameter design of the three-cone robot. In the literature, 22,23 the authors studied a reduced-port robot for left colon cancer, comparing the clinical pathology between the reduced port of left colon and the conventional multiport robotic colectomy. In the literature, 24 –27 the authors developed an accidental human–computer interaction system that relies on the instantaneous line-of-sight behavior of human users to control interactive robots in real time. The system can systematically manipulate the robot’s gaze on the face of the human partner in real time in response to the gaze behavior of the robot. In the literature, 28 –30 the authors concluded that the clamp-assisted robotic partial nephrectomy was associated with increased intraoperative blood loss, and the authors demonstrated through experiments that which tumors are most suitable for this technique. In the study by Mei et al., 31 the authors studied the kinematic calibration method of the one-dimensional cable measurement system, established the parallel four-link error model of the robot palletizer by the cyclic increment method, and established the kinematics error model. The effectiveness of the method is verified by computer simulation and calibration experiments. In the literature, 32 –34 the authors abstracted the complex muscle system of the upper limbs into a muscle function network for the position of the electrodes and the internal relationship between the electromyography (EMG) channels. Firstly, the correlation characteristics between the upper limb myoelectric channels were analyzed by mutual information method, and the muscle function network was established. Secondly, by analyzing the characteristic indexes of network nodes, the characteristics of muscle function network under different exercise conditions are analyzed.
From the research and analysis at home and abroad, on the one hand, there is no suitable algorithm model for how to detect the residual stress of materials, 35 which can effectively monitor and analyze the residual stress of materials. Research at home and abroad has found that no team has attempted to detect residual stress through robots, and it is impossible to process vibration signals efficiently and accurately. This is the research point of this article. To find an efficient and useful method to analyze the residual stress of the welded parts, this article selects the Q235 component as the research object and attempts to make only one detection robot that deals with vibration signals and extracts signal data. We extract the vibration signal obtained by the robot and study the influence law of the residual stress of the material through numerical simulation and the method of test verification. At the same time, the process optimization parameters with residual stress are obtained.
Method
Vibration and response model based on robot settings
Direct method for frequency response
The direct method solves the coupled matrix equation directly by the complex algebraic method without decoupling the equation. When there is damping, the dynamic equation of the system is

For forced vibration under harmonic excitation, the solution of the equation is also set to a simple harmonic form:

If the system damping or phase difference is considered, the above equation is a complex equation. The complex algorithm can be used to solve the response of the equation at each frequency according to the solution of the static problem. When finite element solution is used in MSC.NASTRAN, the mass matrix, damping matrix, and stiffness matrix of the structure are assembled by superimposing the matrix of the elements. The overall damping matrix [C] is composed of a unit damping matrix of the same overall matrix dimension and a direct input of the overall damping matrix element

where
Modal frequency response analysis
When the system is undamped or defined as modal damping, the equation of motion can also be decoupled to avoid directly solving the coupled matrix equation. As part of the structural dynamics, the modal shape needs to be calculated in advance, so the modal frequency response analysis can be seen as an extension of the main modal analysis. Transform the displacement vector

Using the modality, the displacement is transformed from physical coordinate

The equation of motion at this time contains the modal mass matrix and the modal stiffness matrix. Since the mode shape has orthogonality, both the modal mass matrix and the modal stiffness matrix are diagonal matrices with no non-diagonal elements. In this form, the equation of motion is not coupled, so the equation can be rewritten as a set of uncoupled single-DOF systems that are solved separately. That is to achieve the purpose of decoupling

where mi is the ith modal mass, ki is the ith modal stiffness, and pi is the ith modal force. Since the equation of motion is decoupled, the modal method solves the equation of motion much faster than the direct method. After the response of a single modality is calculated, since it is a response under modal coordinates, it is also necessary to linearly superimpose the modal response and transform back to the response under physical coordinates.
Basic theory of residual stress and related test methods
In general, the definition of residual stress will be different in different fields, and people’s understanding of residual stress also goes through a long process of exploration. China’s revised GB7704 “X-ray stress measurement method” defines residual stress as macroscopic stress existing in the component or material without external force or external moment and self-balance.
In the calculation process, we generally assume that the surface of the specimen is in a plane stress state, and the stress field around the hole is redistributed by drilling. We use a three-direction strain gauge to measure the release of stress caused by the drilling. We use the foil strain gauge and the resistance strain gauge to measure the strain change, which can be obtained by substituting the formula calculation. The two principal stresses σ1 and σ2 and a main direction θ angle at the drilling point are calculated as

where ε1, ε2, and ε3 are the measured changes of the strain gauge; A and B are the release coefficients; and θ is the angle between the direction of the residual principal stress σ1 and the axial direction of the strain gauge 1. We assume that the surface of the test specimen is in a plane stress state, and the principal stress σ3 ≈ 0 along the thickness direction is considered. The strain in either direction of the space can be expressed by the elastic mechanics formula

where εϕ,ψ is the strain in either direction of space, E and ν are the elastic modulus and Poisson’s ratio, respectively, σϕ is the actual stress value to be measured, and ψ is the normal between the crystal plane of the diffraction and the surface normal of the material angle. The sum of the principal stresses σ1 + σ2 can be regarded as a constant quantity, and there is a linear relationship between the lattice strain εϕ of different angular directions and the sine square of the azimuth angle (i.e. sin2 ϕ) in any cross-section determined by the flat diameter angle ϕ. In the actual measurement, we only need to record the lattice strain values of different corners. On this basis, the lattice strain value is plotted on the abscissa through the drawing method, and the calculated sin2ϕ value is plotted on the ordinate to obtain a linearly correlated line segment for data processing, the formula is simplified as
The above formula is simplified to

where θ0 is the Bragg angle; K is the X-ray stress constant, MPa/(°); M is the slope of the line position of the diffraction line angle
Mathematical model based on residual stress of welded parts
The strain gauge is used to measure the strain value before and after the stress release of the material, and the basic stress–strain relationship is used to calculate the principal stress direction of the residual stress generated by the welding process and the angle between the strain measurement direction of the strain gauge itself and the principal stress direction. The testing principle of the drilling method is based on the basic stress–strain relationship

where σ1 is the principal stress of the measuring point, σ2 is the principal stress of the measuring point, β is the angle between σ1 and the X-axis, ε1 is the measured strain value in the 0° direction on the strain gauge, and ε2 is the measured strain value in the 45° direction on the strain gauge. ε3 is the measured strain value in the 90° direction on the strain gauge, and A and B are correction coefficients related to the strain gauge size, the material, the size of the hole, and the like.
Due to the crystal incompleteness of the actual material itself, in the process of irradiating the crystal surface with radiation, we found that the shape of the X-ray diffraction peak is wider than the theoretical value, the peak value is lower than the theoretical, and the diffraction region is distributed. The width is wider than the theoretical curve

As the most mathematically strict expression, if the diffraction peak is applied to the residual stress calculation, the main problem is that the calculation amount is too large and difficult to implement. So we consider using a relatively simple, more general-purpose Gaussian, Cauchy, and Cauchy square function for engineering:
Gaussian formula

Cauchy function

Cauchy square function

By applying these three formulas, a series of numerical conversions will be used to convert the formula to the final

Table 1 shows the welding processes and methods used in this article. The residual stress values of more than 300 measuring points have been measured by X-ray stress tester and accumulated rich residual stress measurement experience. Through repeated measurements, I found that from the development of the current X-ray stress tester, this method is more suitable for measuring the residual stress in the laboratory due to the complexity of the equipment.
Welding process and method.

Experiment
Data source
The Q235 steel plate with a specification of 250 × 6 × 250 mm3 (width × thickness × length) is supplied in a hot rolled state. The test piece was sampled and processed from the sample by a wire cutting method. Welding method adopts tungsten argon arc welding, V-shaped groove is opened, and the power source adopts DC direct connection; the steel plate preheating temperature is 100°C, the welding material is ER80S-G solid core gas-shielded welding wire, the wire gauge diameter is 2.4 mm; filling and the cover faces are all tungsten argon arc welding.
The welded steel plate is sampled and processed into standard samples according to GB/T2651-2008 and GB/T7232-2012. In addition, all but weld tensile specimens are leveled at the weld height during processing. The test piece is subjected to stress relief annealing after the steps of welding and machining are completed. The tensile mechanical properties of the welded joints were tested using an INSTRON 8801 electronic tensile tester.
Experimental equipment
Instron electro-hydraulic servo fatigue testing machine
Instron8801 testing machine has a dynamic load range of ±100kN, a strain accuracy of ±0.005% of the full range of extensometer or ±0.25% of the indicated value, a displacement accuracy of ±0.5% of the full range of extensometer, a load accuracy of ±0.005% of the full range of load sensor or ±0.5% of the indicated value; it can be used for tension, compression, low cycle fatigue, crack propagation, and other kinds of dynamic tests. Static mechanical properties test is used to test the tensile mechanical properties of welded joints.
Metal magnetic memory stress concentration measuring instrument
The measuring range of normal leakage magnetic field HP (y) of TSC-1M-4 measuring instrument's normal leakage magnetic field Hp (y) measurement range ± 1999A / m; the signal acquisition interval is 1 mm; the maximum scanning speed is 0.25 m s−1; the relative error of magnetic field measurement is less than or equal to 0.2%. A test platform was built to study the weld quality of Q235 steel. The stress-strain curve of the Q235 butt weldment was measured using a conventional U-shaped probe, and the change law of the test signal with tensile stress and the change law of the test signal with tensile residual stress were measured. 36
Experimental methods
The nine Q235 steel flat weld specimens used in this test were numbered 1#, 2#, 3#, 4#, 5#, 6#, 7#, 8#, and 9#. The welding methods used are all manual argon arc welding. The test variables are set by controlling the welding current and the welding conditions, respectively. The welding current is 150 A and 190 A (the normal welding current is 190 A), and the welding conditions are single-sided welding and double-sided welding to control (as shown in Table 2). A total of nine samples of this batch were divided into three groups, among which 1# test piece, 2# test piece, and 3# test piece were single-sided welded (welding current 150 A); 4# test piece, 5# test piece, and 6# test parts were double-sided welded (welding current 190 A); and 7# test piece, 8# test piece, and 9# test piece were single-sided welded (welding current 190 A).
Test variable control.

Results and discussion
Analysis of the results of residual stress test by the number of different tapping excitations
Number of different tapping incentives
Six weld specimens were metal tapped before the test and then scanned using a water immersion ultrasonic C scan. The detection principle is that the ultrasonic probe and the test piece to be inspected are all or partially immersed in water, and water is used as a coupling agent, and the ultrasonic wave enters the test piece through water to complete the defect detection. Due to the thinness of the test piece, the C-scan method can be used to narrow the detection dead zone, resulting in higher defect resolution and more accurate detection results. The defect judgment method is that there is a defect echo of a certain height in the bottom wave region to determine whether there is a defect in the weld area of the test piece. Through the metal tapping verification of the six test pieces used in the test, it was found that only the defect samples of the three test pieces numbered 1#, 2#, and 3# were more obvious, and the other three test pieces were not found to be obvious. For the 1# test piece, the defect echo height is not large, and it is judged that there may be a small defect in the weld area. While Figure 1 shows that the 2# and 3# specimens have small defect echoes, it is determined that there may be minor defects in the weld area. In general, the defect echo height values of the three test pieces are not large, and there may be slight defects such as inclusions or pores in the weld area of the test piece.

Metal tapping ultrasonic C-scan results.
It can be seen from Figure 1 that in the initial stage, the cooling first starts from a point of the edge, spreads to other bright spots in the center of the surface layer, and then infiltrates into three different points inside. In Figure 1, 6 to 1# to 6# analysis data of the component show that the three different points are located on the surface of the sample, and the first point is located at the edge. The first cooling starts and the temperature difference changes greatly, and then spreads to the other two points on the surface, and the surface of the sample cools and shrinks. By the pinning of the core, the tensile stress is generated in the surface layer, the compressive stress is generated in the core, and the stress value at the edge is smaller than the center; as the number of metal tapping increases, the residual stress difference between the metal members is further enlarged. 37 When the residual stress increases to the yield limit of the material at this temperature, it will cause plastic deformation of the surface elongation core compression, and the internal stress will be released to a certain extent; then the rate of metal knocking will decrease below the lowest point. At this time, the difference in residual stress between the metal members is different from the previous three points, and the difference in residual stress between the surface and the metal member is decreased, at this time, the core shrinks beyond the surface, but the surface is not easily deformed due to the difference of the previous residual stress, and the first point near the surface maintains the same stress change tendency as the other three points on the surface, and maintaining a certain compressive stress state, and the stress changes of the remaining two points in the center appear as the tensile stress first increases and then decreases, and the final stress state of the sample decreases with temperature, eventually leading to the occurrence of thermal stress reversal, that is, the surface layer exhibits compressive stress and the core exhibits tensile stress.
The relationship between the detection signal and the number of taps
In the tapping excitation test, the increase in the number of knocking of the ferromagnetic test piece and the deformation of the member are performed simultaneously. This time, the test piece is used to measure the relationship between the detection signal and the number of tapping times, and the test piece has a knocking rate of 2 min−1, both of which are 2 kN steps. The metal tapping test was carried out in advance. The measured data are processed into the software to obtain the curve as shown in Figure 2.

Analysis of detection signals of metal tapping times and residual stress.
The 7# test piece has a brittle fracture before the yield strength of the test piece due to possible internal defects, while the 8# and 9# test pieces are plastic fracture. It can be seen from Figure 2 that the detection signal slightly increases when the number of taps increases at the beginning, and the detection signal rapidly decreases when the number of times the test piece is struck increases to 220 times. When the number of times the test piece is struck increases by 320 times, the detection signal rapidly decreases as the number of metal taps increases. Among them, the 7# test piece signal change amount is 0.25 mV, the 8# test piece signal change amount is 0.38 mV (as shown in Figure 2), and the 9# test piece signal change amount is 0.42 mV. It can be concluded that the detection signal is closely related to the stress state of the welded specimen. At the same time, the variation of the detection signal also reflects the variation of the permeability of the specimen. This is roughly the same result as a flat-plate metal test piece. The results show that the detection signals of Q235 steel flat seam welds have different detection signals under the two conditions of increasing the number of metal taps and detecting residual stress. The signal change caused by the residual stress of increasing the number of beats is more obvious than the component that reduces the number of beats. It is shown that the residual stress is more sensitive to the increase in the number of taps; obviously, the detection sensitivity of the residual stress by using the number of metal taps is higher.
The results show that the detection of residual stress is related to the change of the number of taps and the increase or decrease of the number of taps. As the number of taps decreases, the weld strength and residual stress gradually decrease, and brittle fracture is easy to occur in the weld zone. Reducing the number of taps will cause the residual stress of the joint to become larger and the welding quality to decrease. Conversely, when the number of metal taps is increased, the welding quality of the joint is increased; when the welding quality is poor, the specimen is brittle fracture in the weld zone; the test piece with good welding quality and no defects is plastically fractured in the base material area.
Analysis of the knocking angle and frequency of residual stress of welded components
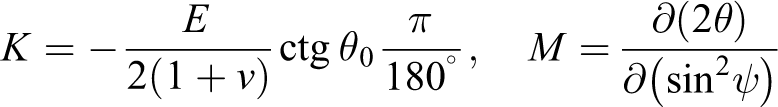
Figure 3(a) and (b) shows the graphs of the maximum residual stress and the maximum deformation of the pipe after the welding is completed, respectively, after changing the tapping angle of the metal, the residual stress field, and the overall deformation of the welded pipe. It can be seen from the figure that when the tapping angle is changed from 5° to 7°, both the maximum residual stress and the maximum deformation of the pipe body change significantly, and the change trend is most obvious at 5°–6°. During the welding process, the temperature of the weld seam is the highest; after the welding is completed, the temperature of the weld seam gradually moves towards the pipe body, forming a temperature gradient. The thermal stress accumulated in the welded pipe cannot be released, resulting in residual stress and deformation of the welded pipe. When the V-type tapping angle of the tube blank is smaller, the higher the temperature of the welding heat source, the higher the weld temperature, the larger the temperature difference of the pipe body, the larger the residual stress accumulated in the welded pipe, and the larger the deformation amount of the pipe body. In addition, too small angle will cause deep pit and pinhole defects caused by over burning in the welding process; too large angle will weaken the proximity effect, reduce the welding efficiency, and the welding heat source can not meet the welding requirements and other defects, which will affect the weld quality and the qualification rate of welded pipe.
Curve with different metal tapping angles: (a) maximum residual stress and (b) maximum deformation.
Figure 4(a) and (b) are graphs showing the residual stress field of the welded pipe and the overall deformation of the welded pipe at different tapping frequencies and the maximum residual stress and deformation of the welded pipe at different tapping frequencies. According to the variation graph of Figure 4, it can be seen that with the increase of the tapping frequency, the welding temperature is increased, the residual stress and deformation of the welded pipe are gradually increased, the residual stress and deformation are more concentrated near the weld, and the welding is performed. The slits are symmetrically distributed in pairs. As can be seen from Figure 4, when the tapping frequency is changed from 200 Hz to 300 Hz, the maximum residual stress increases sharply, and the trend of the overall deformation of the welded pipe is also increased. Combined with the temperature field analysis, the higher the tapping frequency during high-frequency induction tapping, the higher the temperature of the tapping heat source of the high-frequency induction heating, the higher the weld temperature, and the higher the thermal stress in the weld zone; the welded pipe is in the cooling process. The weld temperature is gradually moved toward the pipe body around the weld seam, and the temperature gradient is increased. The larger the temperature difference of the pipe body is, the larger the residual stress accumulated in the welded pipe is, and the larger the deformation of the pipe body is. When the high-frequency induction is tapped, the knocking frequency is too large, which causes the heat-affected zone to be widened. If the frequency is too small, the welding heat source temperature is lower than the welding temperature requirement, causing defects such as desoldering during the tapping process. Choosing the appropriate tapping frequency is beneficial to reduce the residual stress and deformation of the welded pipe, reduce the subsequent correction process, and improve the quality of the welded pipe.

Component graphs with different tapping frequencies: (a) maximum residual stress and (b) maximum deformation.
Analysis of residual stress results of different excitation vibration responses
In the following, the modal parameter analysis results of the system are compared with the traditional sub-resonance method to verify the results and performance of the system. The measured structures were subjected to sub-resonance analysis, hammer analysis, and replacement of hammerheads of different materials to analyze the natural frequencies measured by these methods.
Sub-resonance analysis and force hammer hammer method to identify the natural frequency comparison
The traditional sub-resonance method for identifying the natural frequency is based on the principle of forced vibration, and the sinusoidal excitation force of the forced vibration spectrum is slowly increased by the exciter. The natural frequency of the structure is obtained by plotting the amplitude curves of the response points at different frequencies.
The traditional sub-resonance method is accurate and reliable. The shortcoming is that it takes a long time. According to the aging process, the aging time is minute, but the search frequency is about 12 min, which is nearly half of the total time, low efficiency, and not in the exciter. The workpiece in the speed range cannot achieve forced vibration. This part of the workpiece accounts for nearly 67%, so this method is more restrictive. Due to the difference in excitation speed, the formant with a frequency of 66 Hz (speed of 4000 r min−1) is lost during the first-scan frequency. In the hammering analysis experiment, the hammer is first hammered and the structure to be tested is struck vertically. In this process, the phenomenon of double strike under one tap is avoided, especially the small damping and high natural frequency structure. When there is no separation from the workpiece, the workpiece may undergo elastic deformation for the second time, causing a combo phenomenon, causing the excitation spectrum to be distorted, or causing unnecessary trigger sampling, resulting in inconsistency, which may “contaminate” the force spectrum.
Through the above experiments, Table 3 summarizes the above experimental results for comparative analysis. It can be seen from the experimental results of excitation at three different positions that the difference between the modal frequency values of each order is basically between ±7. Therefore, the test results of the test location are not affected. In addition, the results of the three sub-resonance methods correspond to the natural frequency values of each order, and the difference is between ±10. It can be seen that the hammering method is feasible and efficient for acquiring the modal frequency. Through the comparison results of the hammer hammer method and the sub-resonance method, it can be concluded that the vibration test analysis method based on the hammer hammer method solves the disadvantages of the traditional sub-resonance method, and the detection result is efficient and accurate. Moreover, the time when the hammer excitation method obtains the modal frequency is much smaller than the sub-resonance method, which breaks the bottleneck of the vibration range of the exciter and reduces the cost. The equipment is environmentally friendly and easy to operate. It is suitable for large, medium, and small structures and broadens the application range of residual stress relief.
Comparison of sub-resonance analysis method and incentive method.

Replace the other three materials with hammerhead repeated excitation method analysis
Take the excitation point in the middle position of the machine base for the excitation experiment, the result obtained by the hammering of the steel hammer and the result of the modal parameters, the result obtained by the hammering of the aluminum hammer and the result of the modal parameter, the result obtained by the knocking of the nylon hammer and the results of its modal parameters, the results obtained by the hammering of the plastic hammer and the results of its modal parameters.
Table 4 compares the modal frequency results of the hammerhead excitation of these different materials. According to the results of the above four different hammerheads, the sub-resonance analysis results are used as the standard in the frequency range of interest in this article. The deviation from the result of the aluminum head hammer is about ±10, the result is more accurate, and the frequency of the nylon and plastic hammerhead is lower because the material is softer and the contact time between the hammer and the workpiece is longer when hammering. This will motivate lower frequencies. Since the frequency range of the hammer of different materials is also different, the selected hammer should ensure that all the modalities of interest can be excited in the frequency range of interest. When using hammering test, the hammer must be continually tested. To select the appropriate hammerhead, it can more effectively arouse all the modalities of interest and obtain accurate results.
Comparison of four different hammerhead results using the incentive method.

Conclusions
To find an efficient and useful method to analyze the residual stress of the welded parts, this article selects the Q235 component as the research object and attempts to make only one detection robot that deals with vibration signals and extracts signal data. Combining the vibration signals extracted by the robot, the numerical simulation and the experimental verification method are used to study the influence law of the residual stress of the material, and the process optimization parameters with the residual stress as the characteristic quantity are obtained. The main research contents and conclusions are as follows: The detection of residual stress is related to the change of the number of taps of the robot and the increase or decrease of the number of taps of the robot. As the number of times the robot beats the test sample decreases, the weld strength and residual stress gradually decrease, and brittleness easily occurs in the weld zone. When the robot reduces the number of taps, the residual stress of the joint becomes larger and the welding quality decreases. Conversely, when the robot increases the number of metal taps, the welding quality of the joint increases; when the welding quality is poor, the specimen is brittle in the weld area. For test pieces with good welding quality and no defects, plastic fracture occurs in the base metal area. We used the vibration signal extracted by the robot to analyze the orthogonal parameters of the high-frequency induction welding process parameters and obtained the most common combination of process parameters: the tapping angle is 7° and the tapping frequency is 300 Hz. The robot also numerically simulates the temperature field and stress field at different times during the welding process and obtains a cloud map of the displacement distribution of the welded pipe. The welded pipe optimized by simulation analysis has no obvious deformation, which has guiding effect and significance for actual production. We set up the robot to extract and analyze the vibration signal using four different hammerheads. The results show that the sub-resonance analysis results as the standard, the deviation of the steel head and the aluminum head hammer is about ±10, the result is more accurate, and the frequency of the nylon and plastic hammer is lower, because it is softer. When the hammer is struck, the contact time of the hammerhead with the workpiece is lengthened, so that a lower frequency can be excited.
Footnotes
Declaration of conflicting interests
The author(s) declared no potential conflicts of interest with respect to the research, authorship, and/or publication of this article.
Funding
The author(s) disclosed receipt of the following financial support for the research, authorship, and/or publication of this article: This work was supported by the Key Scientific and Technological Project in Jilin Province Department of Education [grant no. 222170102055].