
Abstract
Unmanned aerial vehicle is a typical field robot which can work in many unstructured environments like mines, forests, and even radiation areas. In our mine monitoring system built in a northeast province of China, special designed unmanned aerial vehicle is applied to take photos and perceive the environment. We select a series of image-based techniques to process aerial pictures to monitor the slope. The visual features are initially refined by histogram equalization. Then, the rocks and cracks can be detected by different digital image processing operators, like Canny, so as to assess displacements. Advanced semantic segmentation model, U-Net, is also selected to process the problem. Experimental results show that both Canny and U-Net can perceive the edges in pictures effectively, better than other operators. In addition, we model the inspection mission for mine slopes into a traveling salesman problem, then plan the path for unmanned aerial vehicle by swarm intelligence-based optimization.
Introduction
Landslide hazard is regarded as one of the most common geological disasters in many developing countries. There are almost a thousand slope sliding accidents in China per year, posing threat to people’s life and property. In the mining production, the rock slopes are more fragile since they are always weaken in the blasting operation, the mining process, and even in the rainfall erosion. It is an important issue to detect and monitor the surface displacement, then warn the potential risks so as to avoid rockfall disasters. The classical method, manual measurement, is time-consuming and inefficient. Due to the fact that the field is always complicated with arduous conditions, the labor costs for this work are very high.
As pointed by Whittaker, future robots are expected to work in field sites, in the unstructured environment (like mine), relieving humans of duty in hazardous environments and facing more challenges. 1 In recent years, unmanned aerial vehicles (UAVs) are widely used in many remote sensing and monitoring tasks. Mozas-Calvache et al. utilized unmanned aircraft systems for photogrammetric flights. 2 Based on the aerial photos, the authors designed some effective linear elements-based metrics and methods to analyze the particular behavior of landslide. 2 D’Oleire-Oltmanns et al. chose UAV to monitor soil erosion in Morocco. 3 The method is able to reduce the “gap” between the satellite scale data and field scale data. 3
For UAVs in slope monitoring system, the problem is more complex which is associated with coordinate transformation, lens distortion, scene reconstruction, data transmission, and the UAV position control. In this article, we mainly focus on two subworks: (1) image processing techniques which will extract slope features for stability analysis and (2) path planning strategies which can adaptively generate suitable routes for UAV in different monitoring requirements.
Our UAV-based slope monitoring system is constructed in a northeast province of China. The open-pit mine has already transferred into a deep pit and the risk of slope instability is very high. Against this background, we adopt a series of image-based techniques to detect rock edges which are valuable information for mine scene analysis. In addition, a swarm intelligence-based route planning strategy is employed for UAV.
Related work
Slope monitoring and stability analysis
As the landslide has become a growing concern, many displacement monitoring approaches are utilized in different environments. Global positioning system (GPS) is an effective technique. After the GPS positioning instruments are installed in slopes, the coordinates of each points can be determined with the satellite data (always from three satellites). Gili et al. applied GPS to monitor the landslide of Vallcebre, Eastern Pyrenees (Spain). 4 Their results show that GPS can obtain a larger monitoring coverage. The main disadvantage of GPS is that the instruments are very expensive and the precision of civil GPS is lower than that for military. Power supply is another problem for many GPS tools.
Light detection and ranging (LiDAR) is also common device for displacement monitoring. Airborne laser altimetry can provide rich terrain information with high resolution. 5 However, laser scanning time is relatively long and the device is often used for static measurement.
Another monitoring method is employing different remote sensing instruments, for example, synthetic aperture radar (SAR) 6,7 and satellite. 8 Remote sensing-based method can also obtain spatial information and measure it, but the cost is relatively high. For most small- and medium-sized mines, the method is not economical.
With the development of photography equipments, photogrammetry is widely used in many geological projects. 9,10 UAV can be regarded as good carrier for camera. Compared with other methods, UAV is more flexible. The flight height and photo-frequency can be set and adjusted according to different situations. Furthermore, the instruments are cheap and easy to maintain. These years, more and more monitoring systems adopt more than one measurement devices. UAV is good supplement for other methods like GPS.
After the data, points and displacements, are recorded in the system, they will be further processed and calculated so as to generate timely and effective prediction. Classical methods applied statistical approaches to analyze the observed data, for example, Saito method 11 and Fukuzono method. 12 According to different signal receiving strategies, the data can be reconstructed in different styles and then matched in a new feature space. 13,14 In this article, we mainly focus on the image-based techniques for slope perception.
Edge detection techniques
In a slope monitoring system, the most important issue is to detect object edges and key points. To evaluate the fissures and rocks so as to monitor the mine, scholars carried out many valuable computer vision-based and digital image processing-based works. Computer vision and digital image processing are correlated but different concepts. As the words, “digital image processing” is more relevant to signal processing. The pictures are regarded as two-dimensional (2-D) signals. The most common form is to transform images by different mathematical functions so as to make them easier to handle by computers. For example, X-ray images can be enhanced and deblurred by filters. In computer vision tasks, we focus more on the understanding of visual data, just like human vision, recognizing and analyzing different objects and understanding the scenes. Most computer vision methods are utilized to help computers achieve more information and infer by them, like the perception of categories, sizes, locations, and colors about the objects in the pictures. These methods are always correlated with machine learning models. It can be summarized that in digital image processing, image details are processed by pixel-wise mathematical functions. Then, the processed images are further modeled in computer vision tasks by machine learning algorithms.
Traditional edge detection methods adopt different digital image processing operators. The photos are dealt in different steps: filtering, 15 feature extraction (like color and texture features), and edge detection. Common filters include median filter, average filter, low-pass filter, and morphological filter. 15 In addition to Red Green Blue and Hue Saturation Intensity 16 color features, Harris, 17 scale-invariant feature transform, 18 and Gabor 19 are all effective feature extractors to perceive surface information.
Among these methods, edge detection operators are closely correlated with the analysis about the slopes. Roberts, 20 Sobel, 21 and Prewitt 22 are general first-order differential operators to detect the edges. The second-order differential operators are represented by Laplacian, 15 Laplacian of the Gaussian function (LoG), 23 and Canny. 24
In recent years, along with the development of deep learning-based algorithms, a series of models with deep networks, like fully convolutional neural network (FCN), 25 Mask R-convolutional neural network (CNN), 26 and U-Net, 27 are utilized in semantic segmentation tasks. The methods can also extract edges of different objects in the picture. In general, semantic segmentation models need dense (pixel-level) labels.
Path planning for UAV
For UAV in slope monitoring system, a notable problem is to obtain a suitable route which can guide the UAV fulfill shooting missions in the mine. UAV path planning methods can be divided into the following two categories.
Geometric approach or graphical approach: In these methods, the map for UAVs is modeled according to geometric theory, then UAV will search for possible path in the constructed map (feasible points and obstacles) by certain rules. Graphical approaches include Voronoi diagram,
28
Grid,
29
probabilistic roadmap,
30
visibility graph,
31
and so on Since the construction of maps is the key point of these approaches, they are not flexible in dynamic environments. It also should be noticed that graphical map modeling strategies are also applicable to other methods, like grids for A*
32
and ant colony optimization (ACO).
33
Heuristic searching approach: Heuristic methods depend on random search in the solution space and some of them adopt swarm intelligence. These methods build many acceptable routes and then optimize and select the better one according to heuristic information gradually. The searching will continue until the optimal solution is obtained. A*,
32
D*,
34
genetic algorithm,
35
particle swarm optimization (PSO),
36
and ACO
33
are common heuristic methods. The main disadvantage of these methods is that the computing costs for a larger solution space will be very high.
There are also some classical methods that do not belong to the categories above, like Dijkstra 37 and artificial potential field. 38
Background
As mentioned above, our slope monitoring system is built on an iron mine located in a northeast province of China. Figure 1 is the panorama of the mine pit.
After years of mining, the mine is already changed from a hill to pit with lots of unstable factors. 39 The exploitation depth reaches −270 m and different strata have been exposed. The geological structure of the mine is very complex with huge differences in different parts. After mechanical mining and blasting operations, the slope is very fragile. Besides, different instruments like excavators and drillers are put aside the pit which may bring more loads. There are also different kinds of geological compositions, making the problem more complex. 39
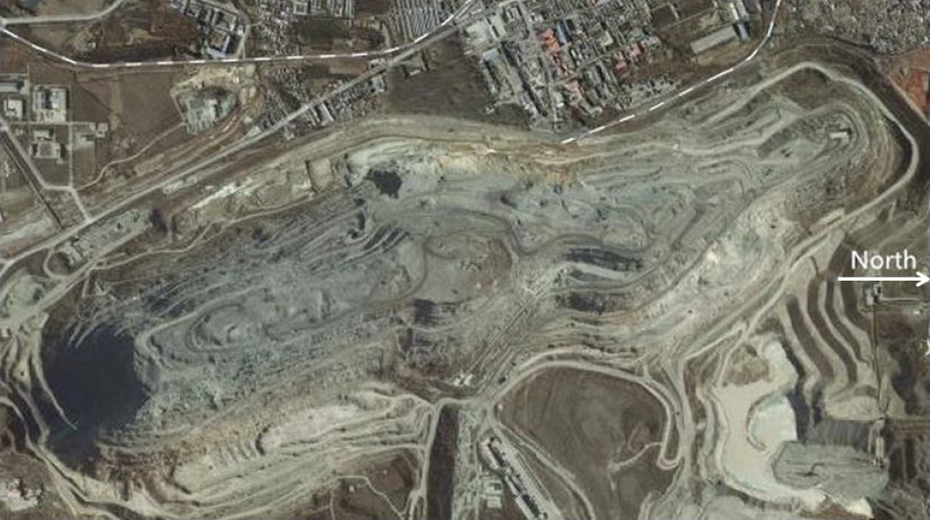
The panorama of the iron mine.
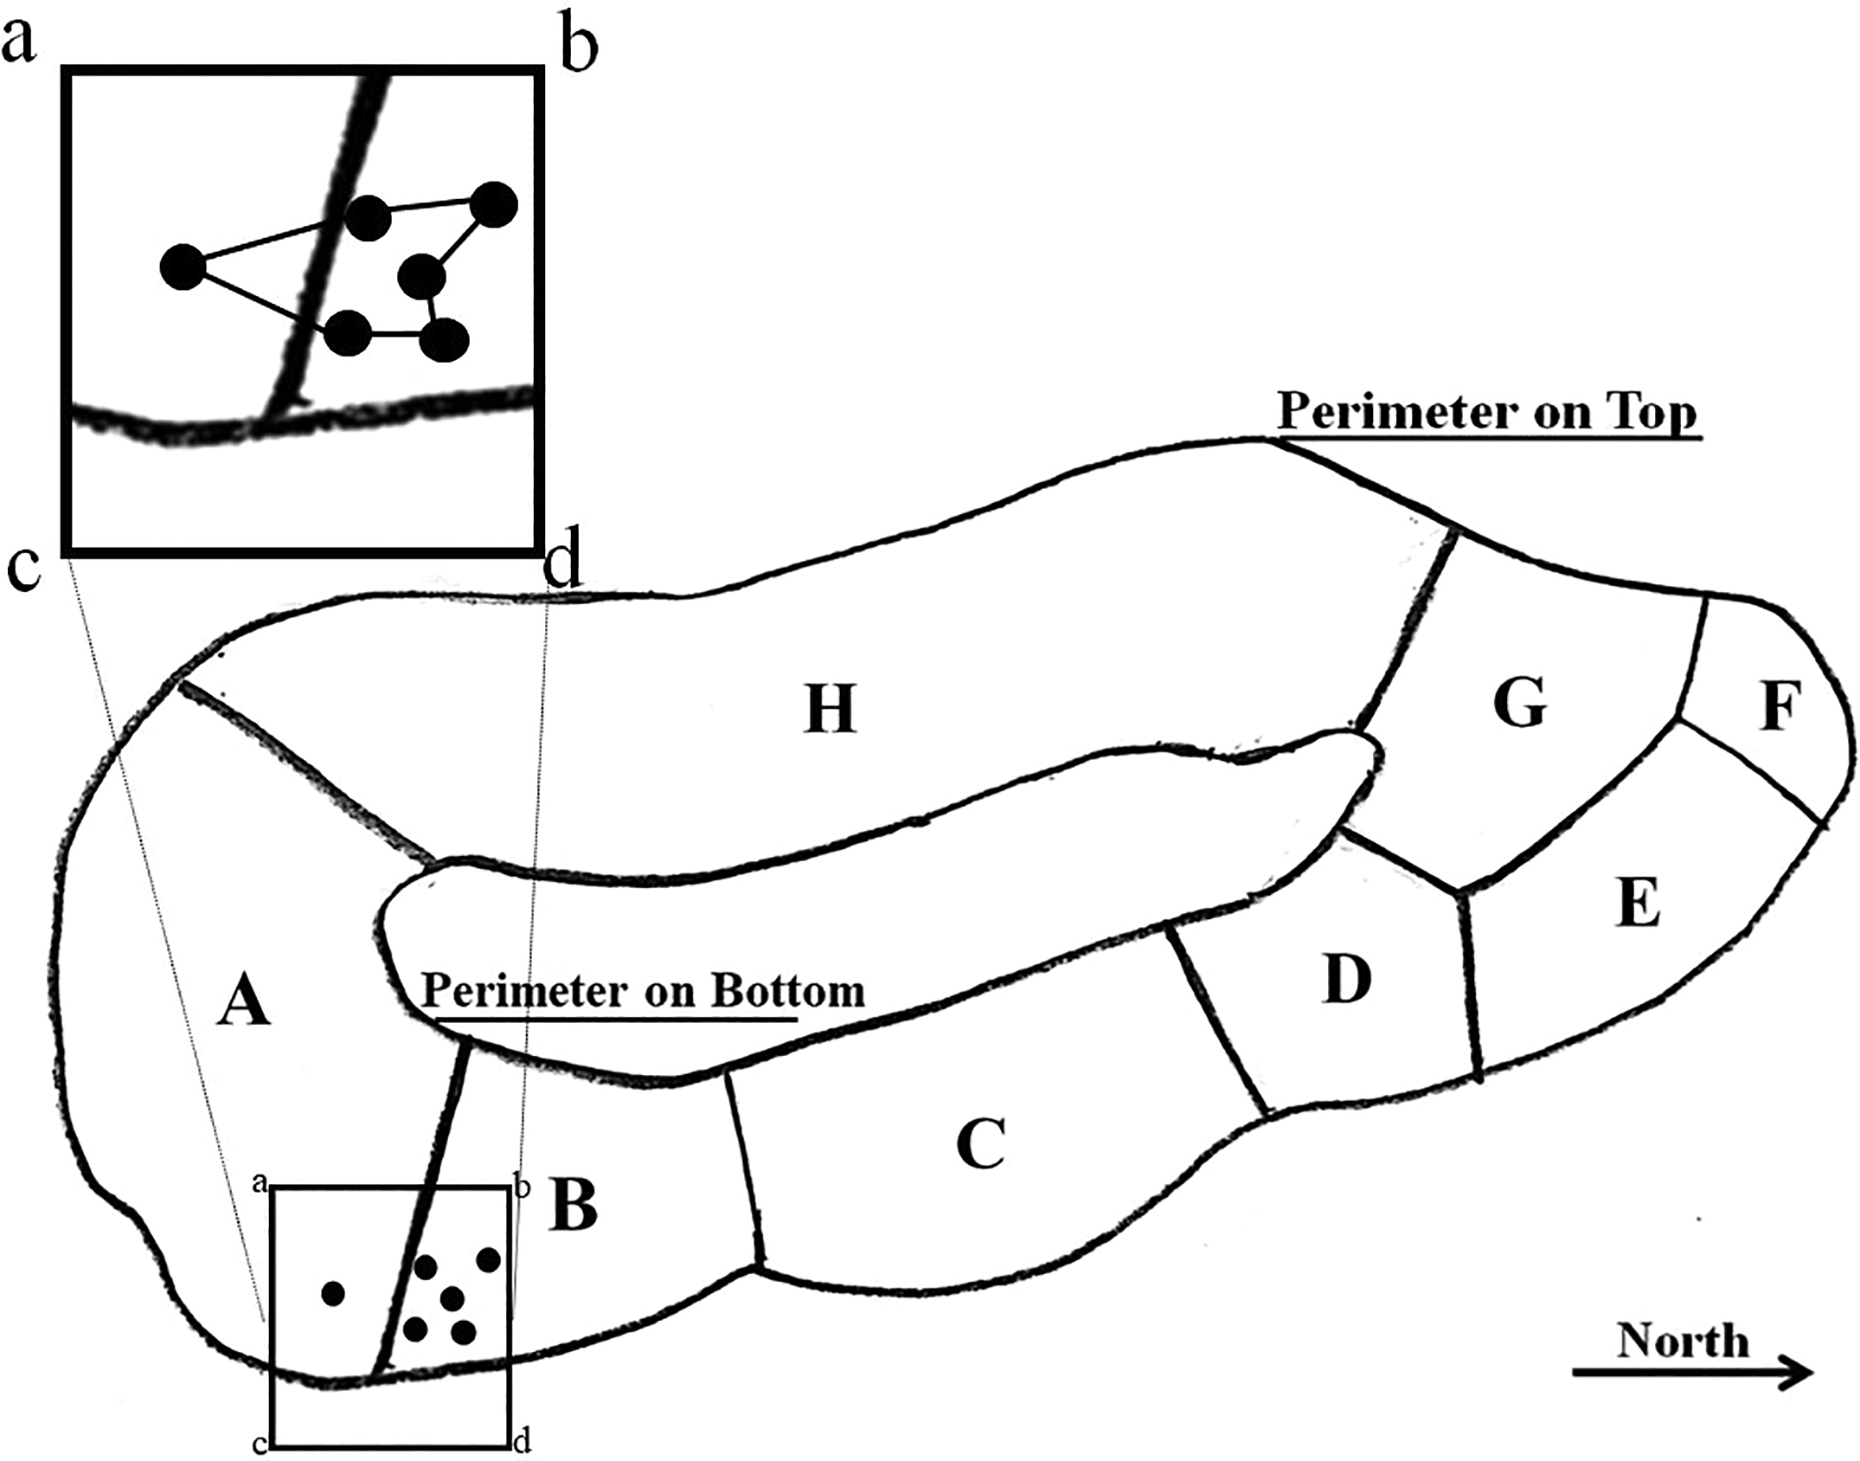
According to the analysis using stereographic projection, the pit can be divided into eight parts, and the parts are numbered from A to H, as shown in Figure 2. 39

Region partition of the mine. A: The rock is solid with relatively stable geological faults. B: The periphery is mountainous region in high terrain, existing slides. C: Impacted by river water and loess layer, the slope is unstable. D: Backed to the mountain, the slope is relatively stable. E: The geological faults are mature which may trigger landslides. F: The region is in the north point of the mine with gentle slope and higher stability. G: There are loess and underground water in this region, bring landslide risks. H: The part is in the upper of the slope, with topsoil in 30 m thick. 39
In this context, we design an integrated monitoring system with GPS monitoring points, photogrammetry observatories, and a UAV to perceive the mine environment comprehensively. The UAV needs to fulfill two tasks: taking slope pictures aerially and inspecting regions (points) periodically. The UAV can not only monitor the rocks and gaps in the slope but also inspect the devices in the system so as to make them work normally.
The used UAV in the system is shown in Figure 3.
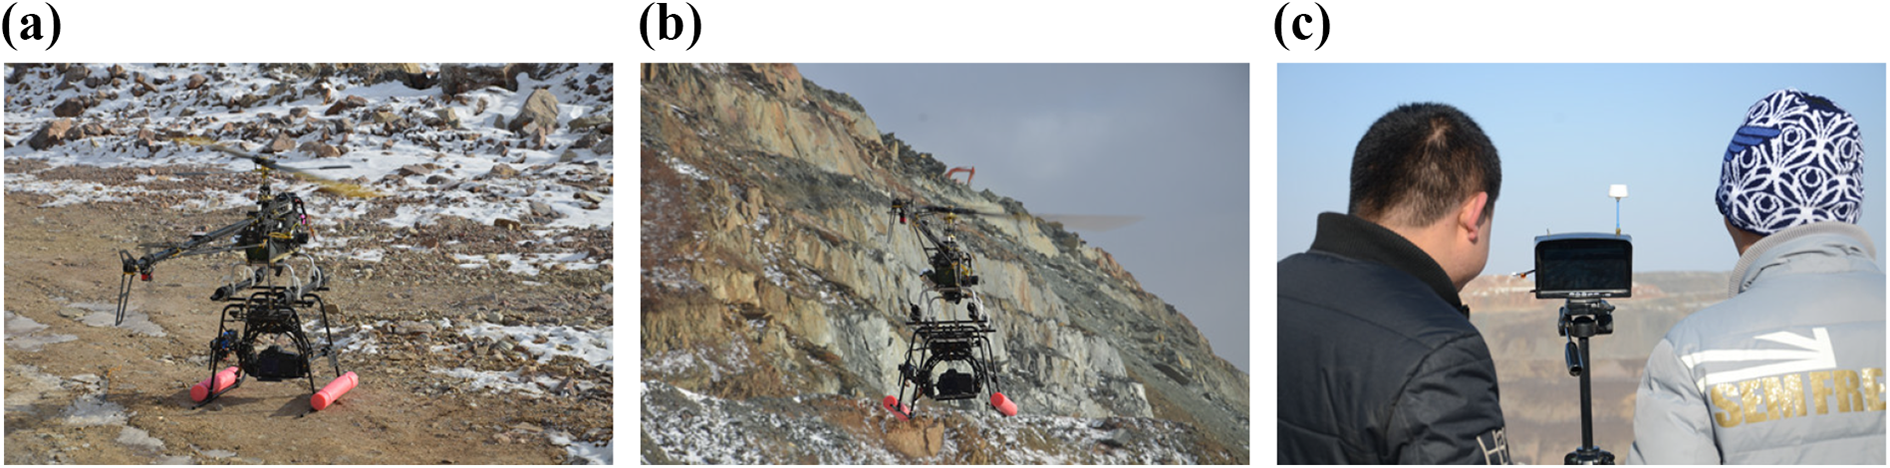
The UAV in our system: (a) UAV, (b) UAV in flight, and (c) remote control. UAV: unmanned aerial vehicle.
Edge detection and scene understanding for slope monitoring
As analyzed in the “Background” section, to relieve people of the dangerous, burdensome, and inefficient fieldwork, UAV is adopted in the monitoring system. Appropriate sensing strategy for mine environment is the key point. In this article, we pay more attention to edge detection in the photos taken by UAV. For this task, we utilize both traditional digital image processing methods and deep learning-based computer vision segmentation model. Edge detection is essential for the perception of environment for UAV. The task is able to help the UAV navigate. The perceived visual signals are also important data for monitoring.
Preprocessing
In our system, the pictures can be processed both on the terminal (UAV) and the computer station. For those original pictures taken by UAV, due to the fact that the pictures may be affected by the weather and light, we refine the picture by histogram equalization. 15 We also visualize the color pictures by same strategy (equalize the picture in three channels then merge them). The noisy pictures and equalized pictures are shown in Figures 4 and 5.

Image refinement by histogram equalization, example 1: (a) original, (b) equalized (gray), and (c) equalized (color).

Image refinement by histogram equalization, example 2: (a) original, (b) equalized (gray), and (c) equalized (color).
It can be seen that after equalization, the pictures are clearer with higher contrast.
When the visual signals are transmitted to the computer station, considering the noise during the transmission, the pictures will be processed by a median filter. We adopt median filter instead of average filter so as to keep the edge information. Since Gaussian filtering is one step in “Canny” operation (it will be described in the next section), we do not design other filter in the image processing module.
Edge detection based on Canny
Along with the CV technique development, many edge detection methods have appeared, 20,23 Canny operator has been regarded as one of the most effective methods in the past many years. Compared with other operators, Canny has a better anti-noise capability and robustness. Because of that Canny applies two different thresholds for “strong edges” and “weak edges,” and judge the “weak edges” to be “positive” if they are connected to “strong edges,” the operator has excellent performance in those “weak edges.” 24
Canny is a four-step algorithm. At the beginning, the pictures are denoised by Gaussian filter. The Gaussian function can be written as equation (1)


where
In the next step, the gradients in two directions can be calculated by equations (3) and (4)


These two gradient values can be used to approximately generate the intensity and direction of each pixel gradient, as equations (5) and (6)

where
The third stage is non-maximum suppression which will refine the edges in
Comparing the gradient intensity of one point in
In the final stage, two thresholds are utilized to evaluate the edges detected in step 3. If the intensity of one point is above the higher threshold, the point is part of the final edges (“strong edges”). For those points with the gradient between the lower threshold and the higher, they are considered as the “weak edges.” If the “weak edge point” is isolated without any connection to “strong edges,” the point is also suppressed, setting to zero.
In the designing of Canny detector, the designer defined detection and localization criteria: signal-to-noise ratio (SNR) and localization accuracy. 24 Based on these two criteria, the operator design problem is concluded into the maximization of them simultaneously. 24 Due to the definition and consideration of these criteria, Canny operator performs better in many applications than other previous methods.
In these article, we adopt another three common metrics, mean squared error (MSE), peak signal-to-noise ratio (PSNR), and Structural SIMilarity index (SSIM) for a more general and appropriate comparison. The mathematical expressions of these are written in equations (7), (8), and (9) respectively.

where

where

where


where k 1, k 2, and L are set to 0.01, 0.03, and 255, respectively, in our experiments.
When MSE is expected to be lower, the performance is better, while other two metrics, PSNR and SSIM, are higher, the performance is better.
In this article, we select two typical scenes, “rock slope picture” and “ore picture,” in the slope to process and analyze. The algorithms’ performances on these two scenes are able to show the ability of them on the focused two different kinds of objects of interest, fissures and dangerous rocks, in the slope. This is valuable to evaluate edge detection methods in the slope monitoring system. Edge detection for slope pictures can measure the displacements of different objects. The texture and fissures in the slope are able to illustrate the changes in different layers, too. The analysis about the ore particle sizes can directly detect those dangerous rocks which are bigger or instable. This is the reason why we take these two pictures as examples.
We carry out comparative experiments with other operators including Roberts, 20 Sobel, 21 Scharr, 40 Prewitt, 22 Laplacian, 15 and LoG. 23 Statistical results on different metrics are listed in Tables 1 and 2. We also make line graphs for the data in these two tables, as shown in Figures 6 and 7. The detected edges are shown in Figures 8 and 9.
The performance of different detectors on three metrics for rock slope picture.
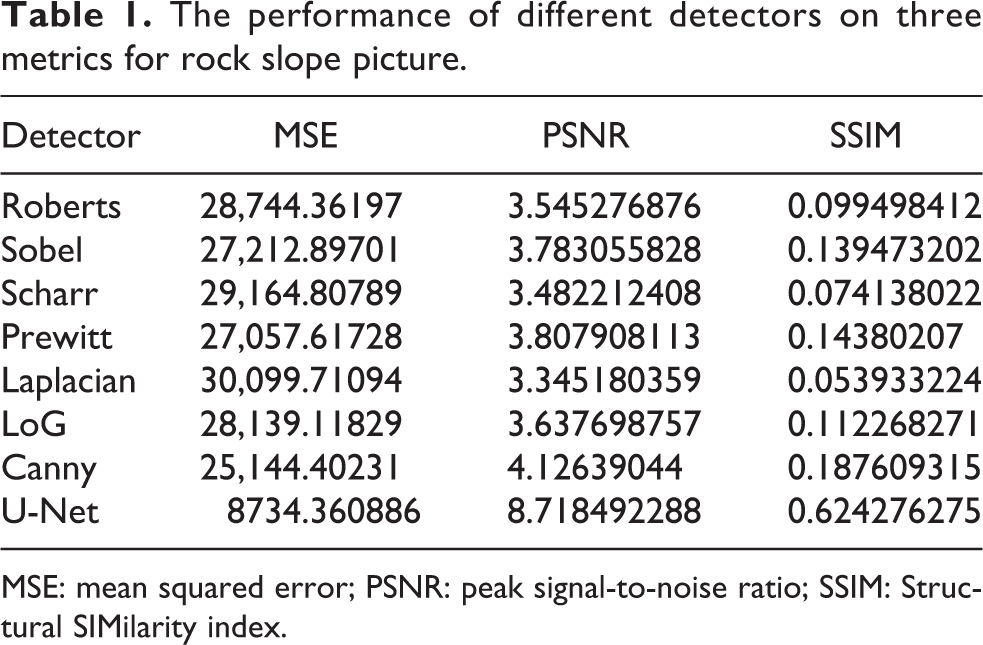
MSE: mean squared error; PSNR: peak signal-to-noise ratio; SSIM: Structural SIMilarity index.
The performance of different detectors on three metrics for ore picture.

MSE: mean squared error; PSNR: peak signal-to-noise ratio; SSIM: Structural SIMilarity index.

The performance of different detectors on three metrics for rock slope picture: (a) MSE, (b) PSNR, (c) SSIM. MSE: mean squared error; PSNR: peak signal-to-noise ratio; SSIM: Structural SIMilarity index.

The performance of different detectors on three metrics for ore picture: (a) MSE, (b) PSNR, (c) SSIM. MSE: mean squared error; PSNR: peak signal-to-noise ratio; SSIM: Structural SIMilarity index.
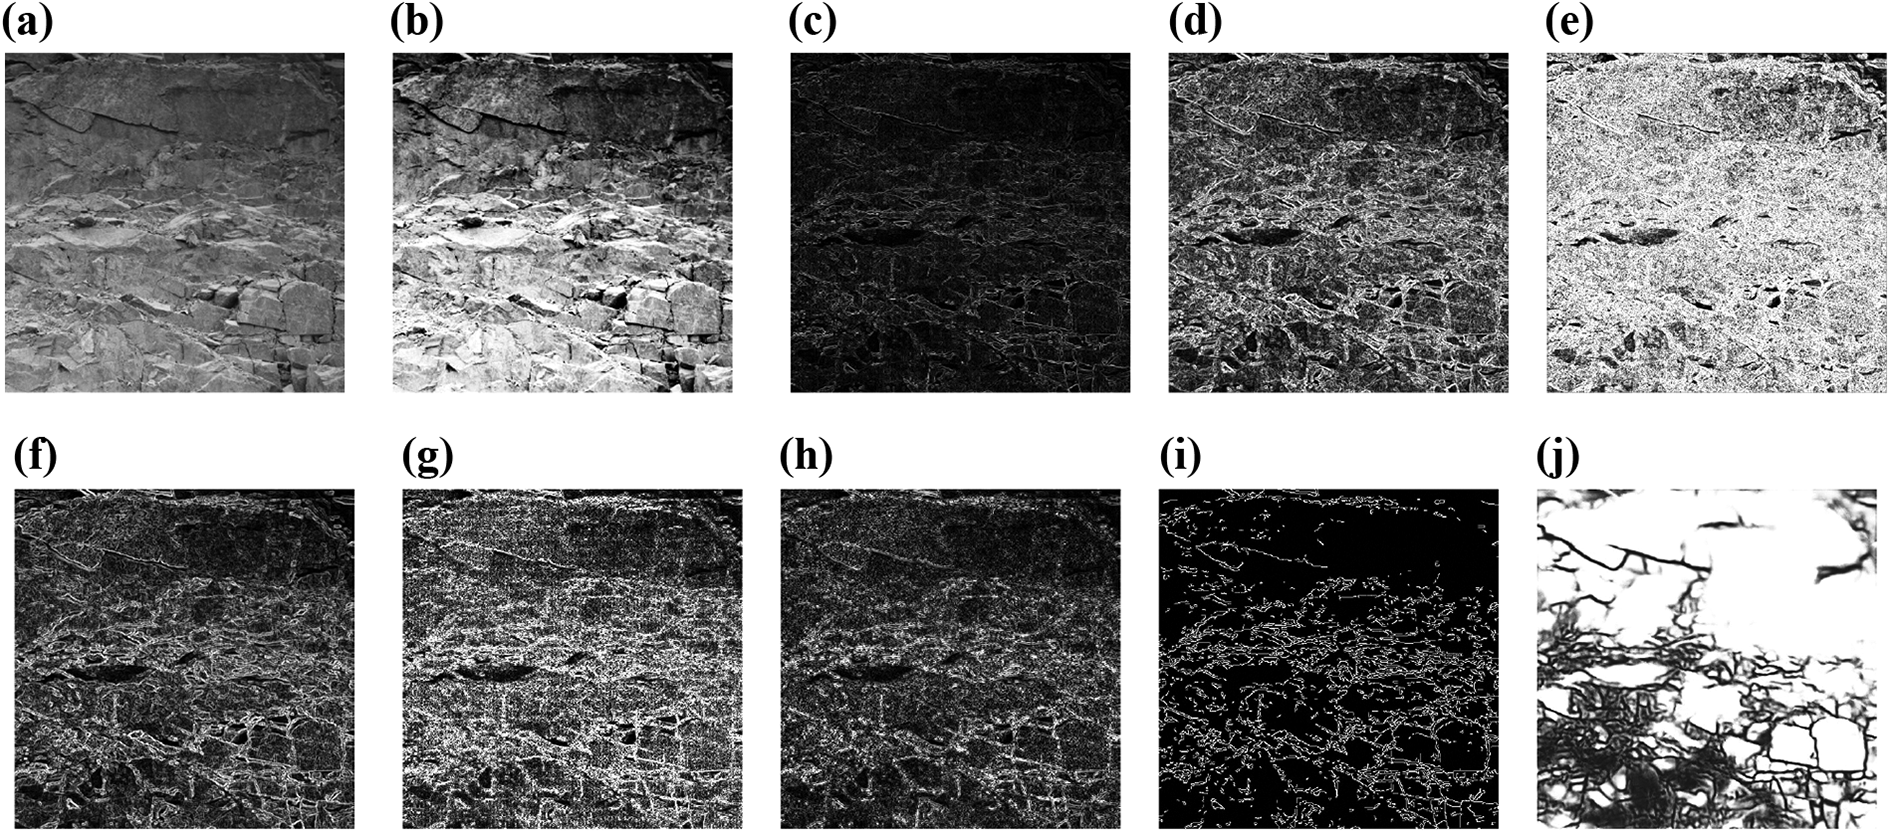
Edge detection by different image-based techniques for rock slope picture: (a) original, (b) equalized, (c) Roberts, (d) Sobel, (e) Scharr, (f) Prewitt, (g) Laplacian, (h) LoG, (i) Canny, and (j) U-Net.
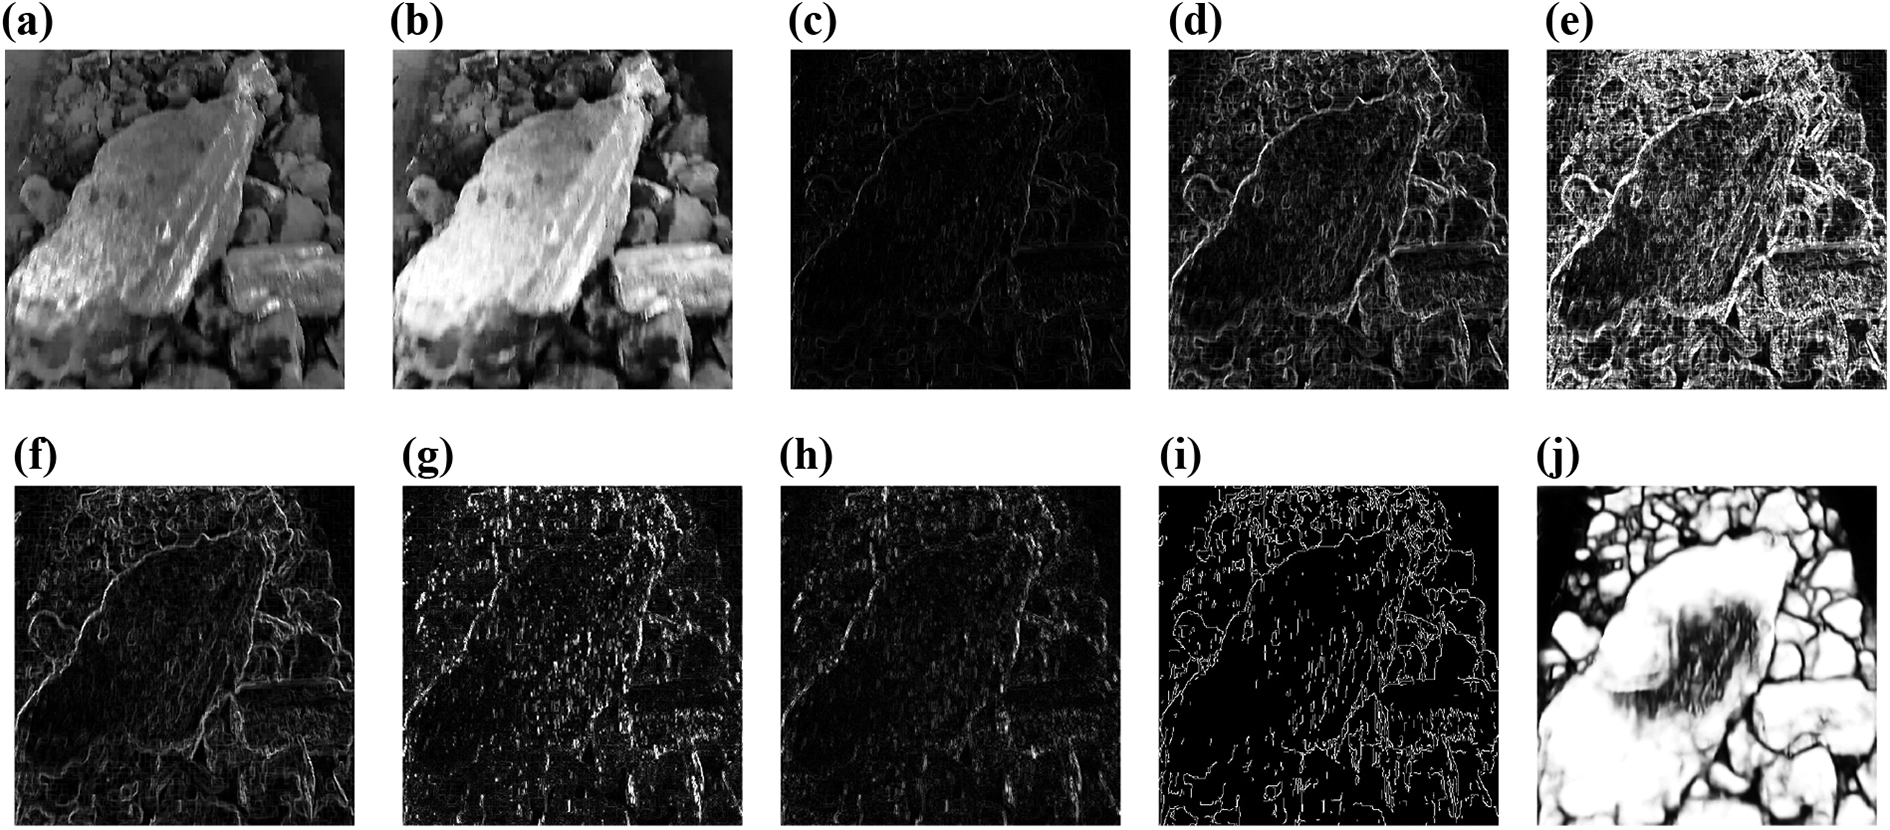
Edge detection by different image-based techniques for ore picture: (a) original, (b) equalized, (c) Roberts, (d) Sobel, (e) Scharr, (f) Prewitt, (g) Laplacian, (h) LoG, (i) Canny, and (j) U-Net.
For the rock slope, as illustrated in Table 1 and Figure 6, Canny has a lower MSE and higher PSNR, SSIM than other classical edge detection methods (the methods not based on deep networks). In first-order operators, Prewitt and Sobel perform better than Scharr and Roberts, also better than two second-order operators, Log and Laplacian. This is probably because there are many curved edges in different thickness. For LoG, too thin edges may lead to the loss of edge details in the points that the derivatives are zero. Compared with other operators, the noise reduction effects of Prewitt are better and stable.
In Figure 8, it is observed that classical methods are more susceptible to the noisy points. Canny has a better performance to perceive the main textures in the slopes and segment objects in loose rock zones. Compared with the edges obtained by Sobel and Prewitt, those processed by LoG and Laplacian are somewhat vague.
As listed in Table 2 and shown in Figure 7, in the detection for a picture about ores, Canny also performs best among all classical detectors. Prewitt performs weaker in these experiments. Sobel has a similar performance to Scharr and Roberts in all the indicators, weaker than Laplacian in MSE and PSNR. Since the objects and noises are complicated and varied in this picture, average pixel value-based noise reduction method may lead to a poor edge locating ability, like the method in Prewitt. This is the possible reason why Prewitt is weaker than other detectors. It is a difficult problem to keep edge details and suppress noise interferences. Two thresholds in Canny help this algorithm obtain better edges.
In Figure 9, there are so many stones in different sizes that the detected edges are fragmentized and inconsecutive. The edges detected by Canny are more distinct and the noisy points and lines are relatively few compared with them obtained by other classical operators.
Edge detection based on U-Net
The popular semantic segmentation framework, U-Net, 27 is also used to detect rock edges in the pictures. The proposal of U-Net is based on FCN. 25 As the typical CNN 41 segmentation model, U-Net also use pixel-level labels. However, in many real-world applications, like medical image processing, the data with dense labels are scarce and expensive.
In this context, U-Net further design different down-sampling, up-sampling middle layers in different scales and connect them in different dimensions. The down-sampling layers work as a “contracting path” which can help to keep the contextual information in the feature maps. On the other hand, the up-sampling layers form the “expanding path.” With this ‘expanding path,’ the model can effectively detect the objects and locate them. In general, the “contracting path” and “expanding path” are symmetrical, constituting the U-like structure. Due to the introduction of U-like structure, there is no fully connected layer in U-Net, reducing the trainable parameters significantly, thereby enabling the model more independent of training samples and computing resource.
The application scenario of U-Net is similar to our slope monitoring system: to detect the edges of objects and the main textures in the pictures (slopes), with limited training samples. We transfer the pretrained parameter weights on electron microscopy segmentation data set,
42
then further train the model using newly labeled slope images and their corresponding segmentation maps. VGG 16
43
is selected as the backbone. To avoid gradient disappearance, we also adopt residual mechanism.
44
The training of U-Net is conducted on a workstation with one Intel Core(TM) i7-8700 CPU @2.4 GHz, 1 16 GB RAM, and 1 11 GB GeForce 1070 GPU. The development environment is Pycharm on Windows 10 (Anaconda). The deep learning platform is Keras 2.2.4 using TensorFlow 1.8 as backend. The hyper-parameters are set as this:
We use same criteria, MSE, PSNR, and SSIM written in equations (7) to (9) to evaluate the performance of U-Net. In these experiments, we label 15 images as a group for a typical region of interest.
Similarly, the statistical results and detected edges are recorded and demonstrated along with those obtained by other detectors, as presented in Tables 1 and 2 and shown in Figures 6 to 9.
It can be seen that the performance of U-Net on rock slope picture is excellent, even better than Canny. Compared with other detectors, U-Net’s MSE reduces significantly. Its PSNR doubles, the value obtained by Canny and the SSIM is three times as high as that obtained by Canny. In Figure 8(j), the detected rock edges are distinct and smooth.
In the processing for ore picture, U-Net also outperforms other methods with labeled training data. It can reduce the MSE by nearly 50% compared with Canny. The PSNR and SSIM obtained by U-Net are also the highest among all the detectors. As shown in Figure 9(j), U-Net is able to detect clear and continuous edge profiles of ores in different sizes. The noise points in this subgraph are also fewer than others obviously.
Image processing for slope monitoring
As mentioned in the “Related work” section, the main purpose of image processing is to detect and perceive the valuable information for scene understanding. As analyzed in the “Edge detection techniques” section, edge detection for rock slopes can measure displacements of different objects. The changes in different slope layers can be illustrated by the texture and fissures. The analysis about the ores can directly detect those dangerous rocks. These perceived data will be recorded and reconstructed in the system, and then fed into a predictor. In general, the predictor can be built by statistical analyses 11,12 or data-driven model training, for example, support vector machines and neural networks. The predictors will be described in our future work. In addition, the visual signals are also important references for the expert to make appropriate decisions.
In this article, to make more analyses about the mine status, we adopt Canny and U-Net27 to process the image sequences taken by UAV, as shown in Figures 10 and 11. The original pictures in these two figures are two typical slopes in the mine. They also represent different two flight directions relative to the slope: flying close to the slope, or near the slope, from one side to another.
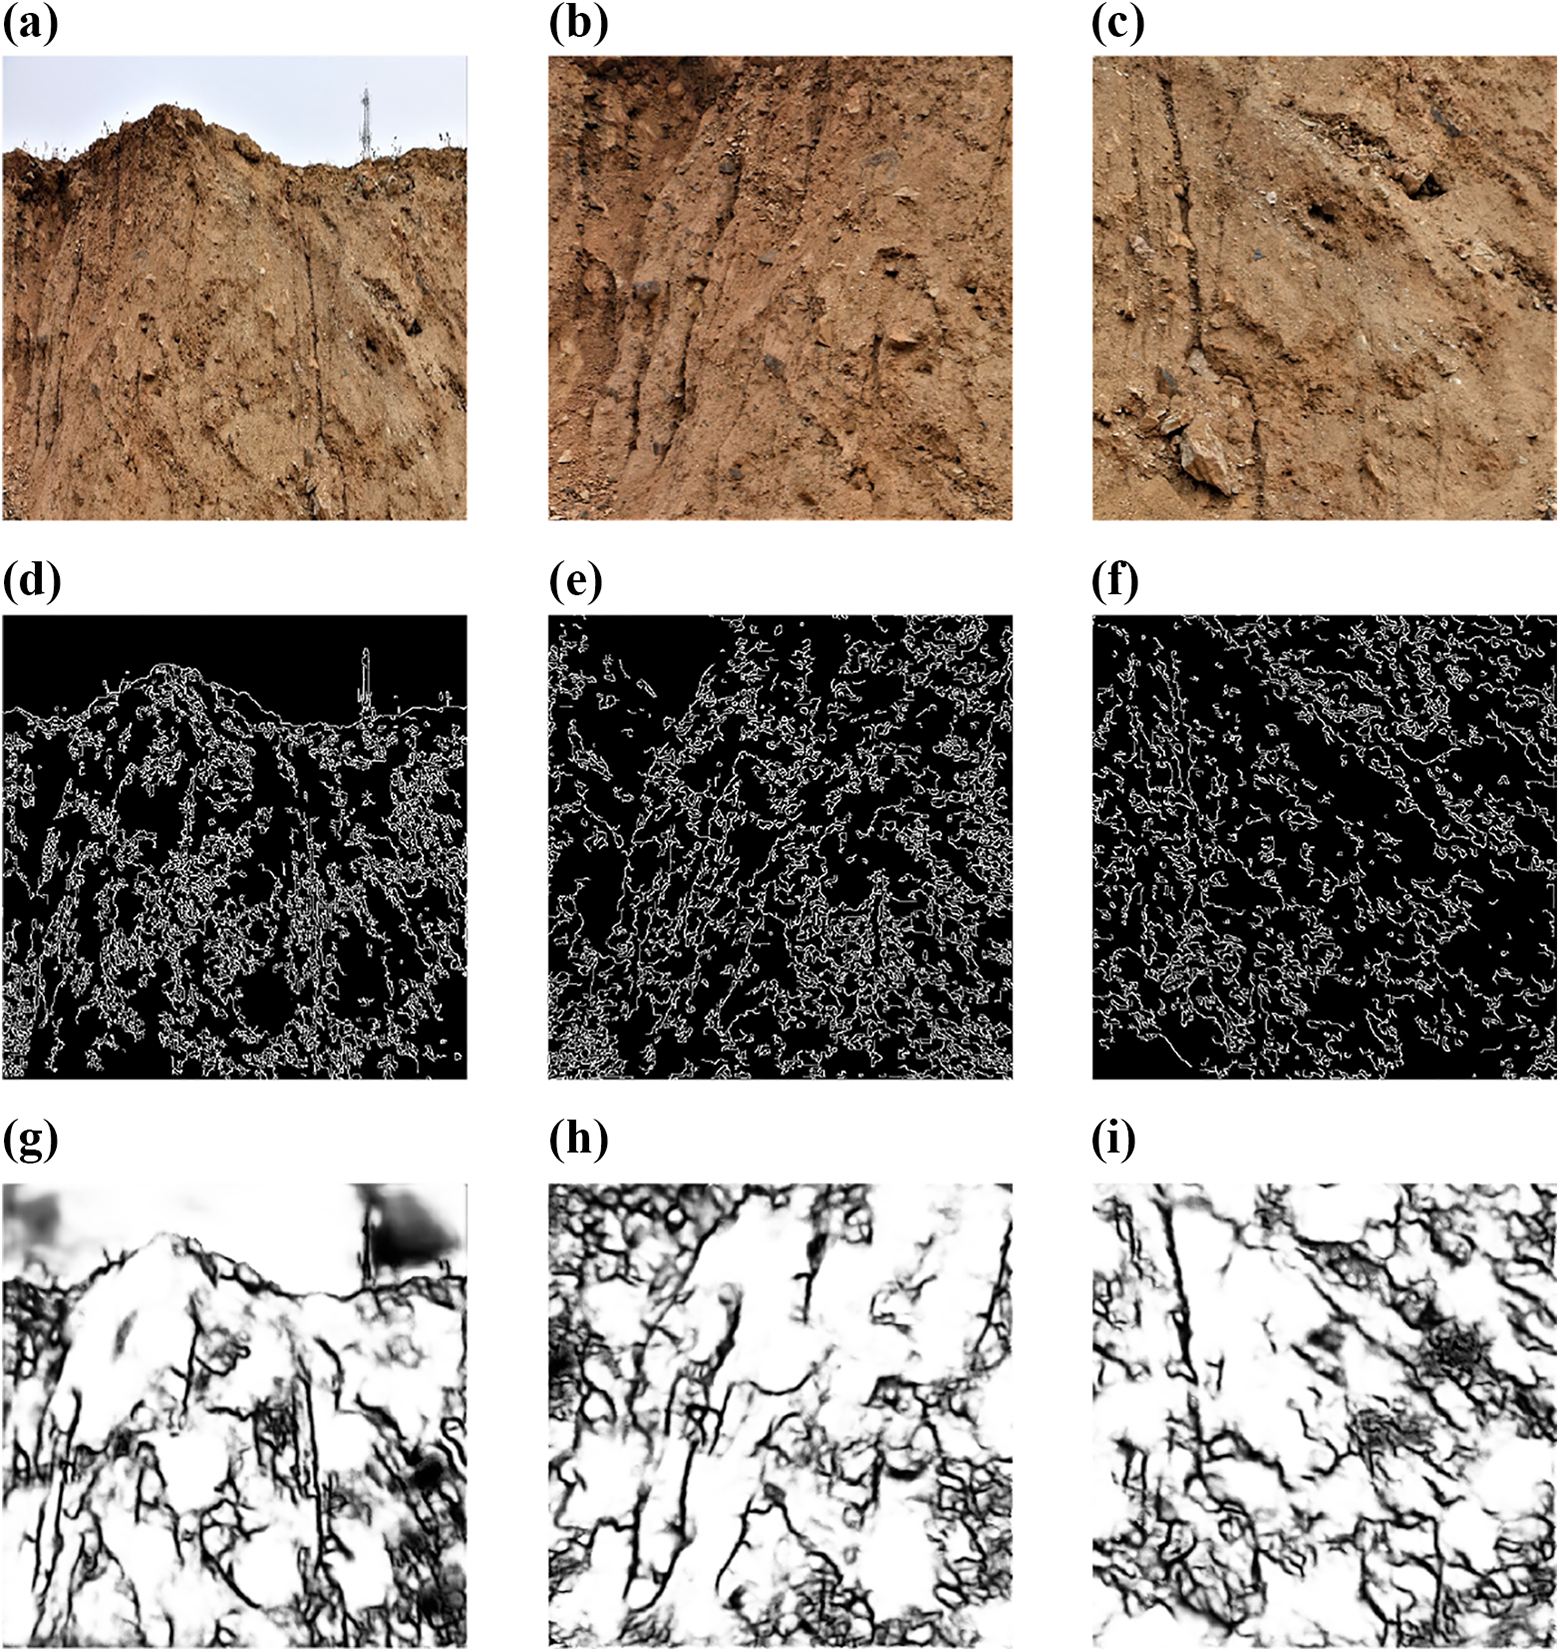
Edge detection by Canny and U-net on typical slope images (flying close to the slope): (a) original 1, (b) original 2, (c) original 3, (d) Canny 1, (e) Canny 2, (f) Canny 3, (g) U-Net 1, (h) U-Net 2, and (i) U-Net 3.

Edge detection by Canny and U-Net on typical slope images (flying from left to right near the slope): (a) original 1, (b) original 2, (c) original 3, (d) original 4, (e) original 5, (f) Canny 1, (g) Canny 2, (h) Canny 3, (i) Canny 4, (j) Canny 5, (k) U-Net 1, (l) U-Net 2, (m) U-Net 3, (n) U-Net 4, and (o) U-Net 5.
As shown in Figure 10, it is obvious that the objects are more explicit in (b) and (c) than those in (a). Similarly, both Canny and U-Net can detect the edges in pictures. The detected edges in (b) and (c) are more fitting to the ground truth. The performance of Canny is stable. It is able to perceive the stone grains in the loess, although with noises, as those in (e) and (f). U-Net has better performance to detect the main veins in the slope, as demonstrated in (g), (h), and (i), obvious and smooth.
The perceived visual information in Figure 11 is with the similar characteristics to Figure 8. In the long zone taken by UAV, the detected edges by U-Net are more distinct with good continuity. For those small gravels and small structures, Canny is more likely to perceive their edges and the surface textures. Compared with U-Net, the edges detected by Canny are more fragmentary.
Swarm intelligence-based UAV path planning
Problem formulation
Apart from visual perception, another basic mission for UAV is to determine an appropriate flight path, as described in the “Related work” section. In our system, the regions, the points of interest in the mine, are changing. The status of rocks and the cracks in the slope are also changing all the time. Besides, there are different kinds of instruments installed in the field and needing periodic inspection. Considering the power and flight time limits, it is necessary to plan a suitable path adaptively for the dynamic flight mission. Then, the UAV can take photos according to the route, processing them online or off-line and transmitting them to central computing station.
As demonstrated in Figure 12, the objects in the slope and several instruments are pointed in the map with different colors.

Objects and instruments in the mine.
In the system, shooting points for the objects are recorded by their longitudes, latitudes, and heights. Table 3 lists an example of a few points on one flight.
Points of interest in one flight.
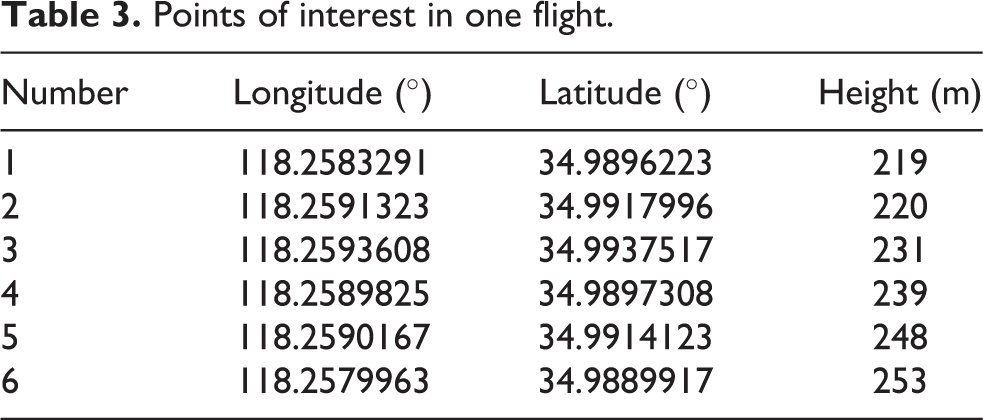
At the present stage, we measure the UAV flight cost by the distance. Due to the fact that our background is an open pit and there are few obstacles for UAV in the environment, the route planning problem can be formulated as a traveling salesman problem (TSP) 45 : the salesman (UAV) needs to travel around all the cities (points of interest) by the optimal route.
As shown in Figure 13, for a group of targets in the mine, our UAV needs to inspect them at a set of suitable positions for photograph, keeping proper distances from the slopes and also in the air. If we can obtain the coordinates, or longitudes and latitudes of these shooting points, the inspection flight path for UAV can be obtained by solving TSP with nodes like those recorded in Table 3.
UAV path planning by solving TSP. UAV: unmanned aerial vehicle; TSP: traveling salesman problem.
Method for cost calculation
With the longitude, latitude, and height of each point, we can calculate the distance between every two points, i and j, as the following equation
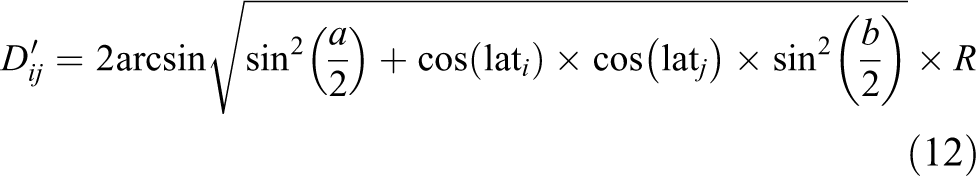
where


Considering the 3-D background, we further add heights as listed in Table 3. Then the distance, also the cost of the segment [i, j],

where hi and hj are the heights of point i and point j.
Due to the fact that our environment is an open pit and there are few obstacles, the cost of UAV is measured by flight distance. For a route Rk
, assuming that the serial number of nodes are

where
When the cost between every two nodes are determined, the path planning problem is transformed into a TSP which can be solved by many optimization algorithms. 46,47
Path planning by ACO
In our system, limited by the power supply, the flight time of UAV is less than 1 h at a time. This is the reason why the shooting points are also less than 10 during each UAV flight.
For TSP with fewer nodes, classical optimization methods with larger population size are already more than adequate and they can also obtain an appropriate route. We simply adopt the classical model, ACO 33,48 for this task.
ACO is a popular heuristic optimization algorithm over the last few decades. This algorithm is inspired by the foraging behavior of ants who will release pheromone in different routes. Since the amount of pheromone of an “artificial ant” is a fixed value, the concentration is higher in the short routes and lower in the long routes. The ant will consider the concentration in path when it moves to the next position. After a number of iterations, more and more ants will select the shorter route and find the optimal solution gradually. There are many variants and improvements of ACO like Ant System including
In this article, we adopt classical
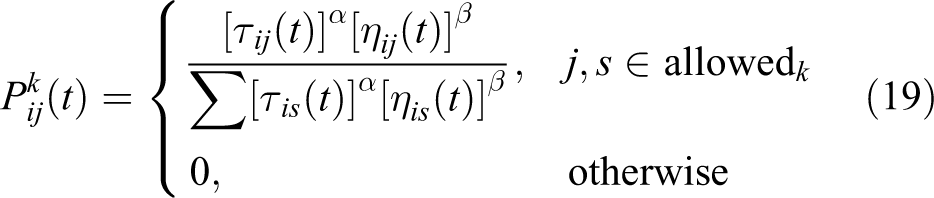
where


where ρ is an important parameter in the model, the coefficient representing the evaporation on the path;

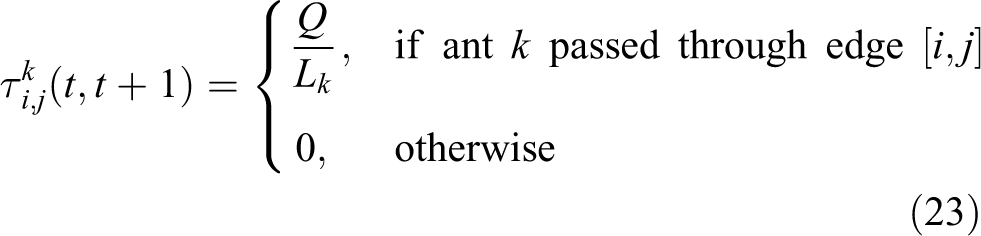
where Q is the preset parameter, a constant representing the total amount of pheromone; Lk is the length obtained by the kth ant among K ants.
In previous studies, there are some rules summarized for the determination of ACO hyper-parameters. If the number of ants, K, is higher, the algorithm’s global searching ability is stronger. But bigger K will also bring higher computational costs and time. In our applications, due to the fact that the nodes in one inspection mission are less than 10, we simply use the basic ACO model and slightly more K, 50, so as to find a better solution. Similar to the determination of K, we also choose a slightly more
The obtained sequence for the nodes in Table 3 is [1–6–4–5–2–3], and the cost is 1134.2444 m.
Conclusion
In this article, we introduce a UAV-based slope monitoring system and describe two major works in this system: image-based edge detection and swarm intelligence-based path planning.
For visual perception, we employ Canny and U-Net to detect edges, cracks, and ores. Comparative experiments show that these two methods can detect edges effectively. Without the training process and labeled data, Canny has a better ability to detect the targets in the slope. For closely shooting pictures and ore pictures, U-Net can obtain clearer and smoother edges without the manual threshold setting.
The periodic inspection task for the pit is transformed into a TSP. ACO is utilized to deal with the TSP and find an appropriate route for the points of interest in the mine.
In our future work, we will make improvements to extend the battery life so as to increase the monitoring points on one flight. More deep learning-based semantic segmentation methods can further be applied. The data analysis model for landslide prediction will also be researched in the system.
Footnotes
Declaration of conflicting interests
The author(s) declared no potential conflicts of interest with respect to the research, authorship, and/or publication of this article.
Funding
The author(s) disclosed receipt of the following financial support for the research, authorship, and/or publication of this article: This work was supported in part by the National Natural Science Foundation of China [grant no. 61673098] and in part by the Fundamental Research Funds for the Central Universities, China.