
Abstract
Corrosion of large storage tank bottom has been identified as the main threat to tank security around the world. Corrosion detection becomes the main approach to ensure the safety of large storage tanks. In this article, we propose a two-stage tank bottom corrosion analysis and remaining useful life prediction framework. In the first stage, the causes and mechanisms of tank bottom corrosion are analyzed, the evaluation metric system is established, and the fuzzy comprehensive evaluation method is used to evaluate the health status of tank bottom. The preliminary evaluation result in the first stage determines whether a subsequent remaining useful life prediction is required. If the tank bottom is not in healthy state, in the second stage, the remaining useful life prediction of the tank bottom is implemented by acoustic emission and risk-based inspection. Both qualitative and quantitative evaluation are carried out to provide a basis for the operation and maintenance decision of storage tanks.
Keywords
Introduction
With the sustainable growth of China’s economy and the turbulence of the international crude oil market, sustainability has become a global concern in recent years. 1,2 As the current global market is rapidly changing, China’s demand for strategic oil reserves is growing steadily and continuously. Serving as the storage equipment for petrochemical raw materials and related products, large atmospheric storage tanks are playing an increasingly important role. The storage capacity of crude oil in these tanks is usually very large. Affected by the changes of serving environment and operating conditions, some damage will be gradually accumulated, which may eventually lead to serious safety accidents. 3 The corrosion of tank bottom can cause the failure of oil tank, which is the main factor endangering the normal operation of tank. 4,5 The corrosion status prediction of the tank bottom is crucial for tank maintenance and is also the main approach to ensure the safety of tank operation. 6
At present, magnetic flux leakage (MFL) testing and acoustic emission (AE) testing are widely adopted to evaluate the corrosion status of large storage tank. Liu et al. discussed the principles, the use of inspection equipment, and the application of MFL testing technique for atmospheric storage tank inspection. The authors also proposed a practical solution for inspecting and evaluating atmosphere storage tanks using MFL. 7 Shi et al. introduced the main principles, measurement, and processing of MFL data. As the key point of a quantitative analysis of MFL detection, the identification of the leakage magnetic signal is also discussed. The advantages and disadvantages of different identification methods are analyzed. 8 Yu et al. established the three-dimensional finite element model of tank bottom, which is then used as a simulation tool to study the propagation characteristics of AE signals. They concluded that multipoint measurements can be used to help understand the status of bottom plate. 9 Gong and Hu constructed an AE system to detect and evaluate tank bottom corrosion. A corrosion detection process was designed and put in practice for qualitative evaluation. 10 Jirarungsatian and Prateepasen carried out AE experiments on different types of damage and analyzed the parameters of AE signals. 11 The experimental results were used for on-site detection of atmospheric storage tanks. Liu et al. analyzed the advantages and disadvantages of AE detection and MFL detection and proposed a tank corrosion detection method by combining the above two methods. 12 Based on the risk-based inspection (RBI) technology, Guo et al. carried out risk assessment on 20 large atmospheric storage tanks. By setting different risk levels and implementing maintenance methods and strategies for each storage tank correspondingly, the reliability of RBI technology was verified. 13 Park et al. monitored the corrosion state and AE data of tank bottom in acidic soil and verified the consistency of the AE technology and risk-based method. 14,15 Zhang et al. conducted an experiment on AE monitoring of tank bottom in a laboratory condition. He analyzed the emission signals collected in the experiment and obtained the AE characteristics during tank bottom corrosion process under different working conditions. A corrosion detection mechanism was provided with improved reliability in AE testing and evaluation field. 16 Yu et al. claimed that in some circumstances, the types of corrosion AE signal of the tank bottom are unknown. He thus proposed a weighted fuzzy clustering recognition method to distinguish corrosion types with each other. Nearest neighbor method was used for optimizing initial clustering. The data redistribution is adjusted with the weighted distance between the gravity and center. The experimental result shows that the detection accuracy increases by about 9%. 17
Although some achievements have been made both in research and in application, the AE method can only be used for qualitative evaluation. Other detection methods, such as MFL testing, 18,19 can effectively quantitatively evaluate corrosion defects. However, it usually causes unnecessary tank opening, which may result in over maintenance of storage tanks, affecting the normal operation. The deficits of both methods greatly encourage the proposal of our health analysis framework.
The rest of the article is organized as follows: The “Overall framework for tank bottom health analysis” section gives an overview of our tank bottom health analysis framework. The “Preliminary health evaluation” section introduces the preliminary health evaluation. The “Residual life prediction based on AE and corrosion risk pace” section illustrates the accurate diagnosis. The “Case study” section presents a case study to verify our proposed framework. The “Conclusion” section concludes the article.
Overall framework for tank bottom health analysis
In this article, a two-stage health state analysis method for tank bottom is proposed. In the first stage, a preliminary health evaluation of tank bottom is made: firstly, a scientific risk evaluation metric system for tank bottom corrosion is established based on expert experience and failure analysis. Then, the weights of evaluation metrics are determined by combining the analytic hierarchy process (AHP) and the entropy method. Finally, fuzzy comprehensive evaluation is adopted to give health status. The preliminary evaluation result in the first stage determines whether a subsequent remaining useful life (RUL) prediction is required. If the tank bottom is in good condition, it is unnecessary to carry out AE testing so as to save tank maintenance costs. If the tank bottom is not in good condition, the second stage is carried out to make accurate diagnosis. We establish a quantitative evaluation model based on the historical experimental data collected through AE testing and MFL testing. Then, the AE experiment is implemented and the result is used to estimate the corrosion rate and predict the RUL of storage tank. The overall framework for tank bottom health analysis is shown in Figure 1.

Overall framework of tank bottom health analysis.
Preliminary health evaluation
Corrosion analysis
Preliminary health evaluation reflects the current operating status of tanks, hence it is extremely significant to establish a system of evaluation metrics to give an accurate, credible, and objective evaluation result, which is also a guarantee for the long-term effective operations of oil tanks. To establish the risk metric system of tank floor corrosion, we first summarize all types of tank floor corrosion and study the main influencing factors that cause corrosion.
The corrosion of tank floor mainly consists of two types: internal corrosion and external corrosion. Internal corrosion mainly includes atmospheric corrosion and liquid corrosion, and external corrosion mainly includes electrochemical corrosion and soil corrosion. The main factors affecting the corrosion of tank floor are as follows: Sedimentary water at the bottom of tank: Sedimentary water mainly comes from produced fluid, reinjection water, condensate water, and rainwater, which is the main source of the internal liquid corrosion. The corrosivity of sedimentary water usually differs in terms of its components. The main influencing factors include pH value, chloride concentration, sulfur amount, salinity, and so on. The pH value determines the corrosion type of tank bottom, especially in strong acid or alkaline environment, which usually result in a significant increase in corrosion rate.
20
The chloride concentration is the main factor affecting the corrosion rate of tank bottom.
5
Sulfides can be decomposed into corrosive substances that result in corrosion. The salinity is mainly affected by the concentration of calcium and magnesium. When the concentration is too high, it will promote the formation of local cell corrosion. At the same time, calcium and magnesium can increase the conductivity of water, thus accelerating the corrosion rate. Gas effect: Due to the constantly rising and falling of liquid level in the tank, a certain amount of air will be mixed into the tank. Hydrogen sulfide gas has the greatest impact on tank bottom corrosion, which can dissolve in water to form acid that has very high corrosivity.
21
At the same time, hydrogen sulfide gas is the catalyst for cathodic reduction of tank bottom, which can promote the absorption of hydrogen in reduction reaction and further deteriorate corrosion. Production factors: In daily production, the operation of the tank’s charging and discharging will cause the fluctuation of the fluid in the tank, and turbulence may form inside the tank. Turbulence can cause ups and downs of tank bottom, which can abrade the corrosion-resistant coating on the inner surface of tank bottom and form a corrosion source.
22
At the same time, a series of cleaning operations of the tank will continuously scour the tank bottom, and the membrane layer at some positions of the bottom will be destroyed, resulting in oxygen concentration cell. Mechanical factors: The fluctuation of the fluid in the tank can make the bottom bear additional vibration and impact loads, which will cause the vibration damage of the tank bottom, leading to crevice corrosion and pitting corrosion.
Evaluation metric system
Based on the detailed analysis of the corrosion mechanism of tank bottom in the previous section, this section tries to establish a scientific, effective, and standardized evaluation metric system, as shown in Table 1.
Tank bottom risk evaluation metric system.

Evaluation method
Weight derivation and modification
After health evaluation model has been constructed, we need to assign weights for different evaluation metrics. The weight determination of evaluation metrics is an important part for reflecting the health status of tank bottom. AHP and entropy weight method are widely used in similar problems. However, AHP is strongly based on subjective opinions of experts, while entropy weight method does not work well when data are not sufficient. In this article, we applying Bayes theorem and combine these two methods to overcome their deficiencies. First, a priori value of metric weights are adopted through AHP method, then the entropy information of feedback data is taken to calculate posterior value of metric weights.
If we model the weights of evaluation metrics as probability distribution, we hope that we can estimate the distribution through experts’ knowledge when the amount of data is insufficient. At the same time, with the accumulation of data, the weights of evaluation metrics gradually adapt to the information in actual data. Finally, when the amount of data is large enough, the weights of the evaluation metrics can fully reflect the amount of information provided by each metric.
The process of assigning weights can be understood as continuous revision of the importance of each metric. Assume that the weights of the evaluation metrics follow Dirichlet distribution

where
There are mainly two reasons why we choose Dirichlet distribution: According to the practical meaning of metric weights, we have According to the hypothesis of Bayesian view, probability itself is a random variable with prior and posterior distributions. When the condition likelihood function can make the posterior distribution has the same form with the prior distribution, we say the distribution is the conjugate prior of the likelihood function. Considering the conjugation of Dirichlet distribution and polynomial distribution, we choose the likelihood function of polynomial distribution and assume the prior distribution as Dirichlet distribution, then the calculation of probability posterior distribution will have a good mathematical form.
After collecting a certain number of user feedback, we calculate the entropy weight of each evaluation metrics, which is denoted as

In conclusion, the proposed weight derivation method takes the following steps: Assume we are assigning weights to m evaluation metrics. Use AHP method to obtain their a priori values Choose a proper coefficient λ, then initialize the distribution parameters as Collect user feedback data and use entropy method to calculate evaluation weight values Modify evaluation metric weights:

Health evaluation
After the weights of evaluation model are derived and modified, the fuzzy synthetic evaluation method is adopted to compute reputation. The values of every evaluation metric are collected and calculated. Our health evaluation method is conducted as follows: First, for both quantitative and qualitative metrics, the membership functions of every evaluation metric are figured out according to a predetermined limitation. The single metric membership degree can be integrated to get the evaluating matrix. Then, according to the weights of evaluation metrics, the evaluation matrices of abstract levels are calculated. Finally, we determine the health status of tank bottom based on the rule of maximum degree of membership. More detailed explanation of the method is demonstrated in the “Case study” section.
Residual life prediction based on acoustic emission and corrosion risk pace
AE technology
AE detection technology is widely employed across the world because it can dynamically detect and analyze storage tanks. Compared with other nondestructive methods, the special characteristic of AE is that it does not affect daily production. When corrosion or leakage happens, the load of the tank will change, and the energy will be released in the form of elastic wave to generate AE signals. The sensors on the tank are set to receive the signals that exceed the threshold. The signals are then transformed into characteristic parameters through feature extraction circuit. Among them, ring-down count can effectively reflect the intensity of AE activity, as well as the corrosion status. AE activity represents the frequency of AE events. It can be calculated by dividing the hit count of all channels per unit time by the number of channels. The AE activity can be employed to predict the RUL of tank bottom.
Corrosion risk pace
In this article, the concept of risk is introduced to model tank bottom corrosion. Corrosion risk pace (CRP) is a scientific risk assessment method that makes use of the test result of MFL testing. CRP represents the average corrosion rate of tank bottom, which can reflect the health status of the most active corrosion area. Let

We can conclude from the above formula that

Assume that the corrosion increment of the region where corrosion depth is greater than h can be illustrated as follows

where k represents the corrosion rate, which can be considered to remain unchanged during the corrosion process. From the above formulas, it can be concluded that the corrosion depth increases along with time has the following form
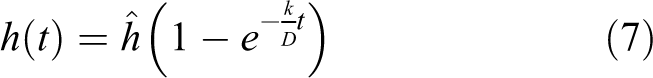
where

For the current corrosion area, we set the cumulative probability as 0.001 and calculate
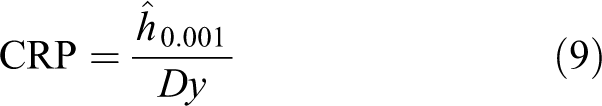
where
Residual life prediction
AE activity can reflect the corrosion of tank bottom to a certain extent, so we try to establish a quantitative model between AE activity and risk corrosion rate. In this article, we assume that there is an approximate linear relationship between AE activity and risk corrosion rate CRP.
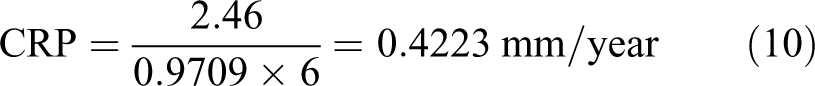
Firstly, we apply MFL testing to 10 experimental storage tanks and recognize the defects at the tank bottom. The number of bottom defects in storage tanks with different corrosion degrees was counted, and the cumulative probability distribution of bottom thinning at different locations was obtained. The risk curve of each experimental storage tank was drawn. One of the tanks has been served for 6 years, and the data of MFL detection are presented in Table 2.
Magnetic flux leakage detection data of experimental storage tanks.

According to the risk curve, the absolute value of gradient at the tail is 0.9709. Then, the CRP of the tank is
Similarly, the CRP of each tank is calculated using their risk curves, namely
Corrosion risk pace of experimental storage tanks.

CRP: corrosion risk pace.
Then, we carry out AE testing on these experimental tanks, the AE signals were analyzed and evaluated, the ring-down count of each channel is collected, and the AE activity of each tank bottom is calculated, namely
Acoustic emission result of experimental storage tanks.

AE: acoustic emission.
In Figure 2, we plot the AE activity and CRP with respect to the data of all experimental tanks, and the scatter plots are linearly fitted:
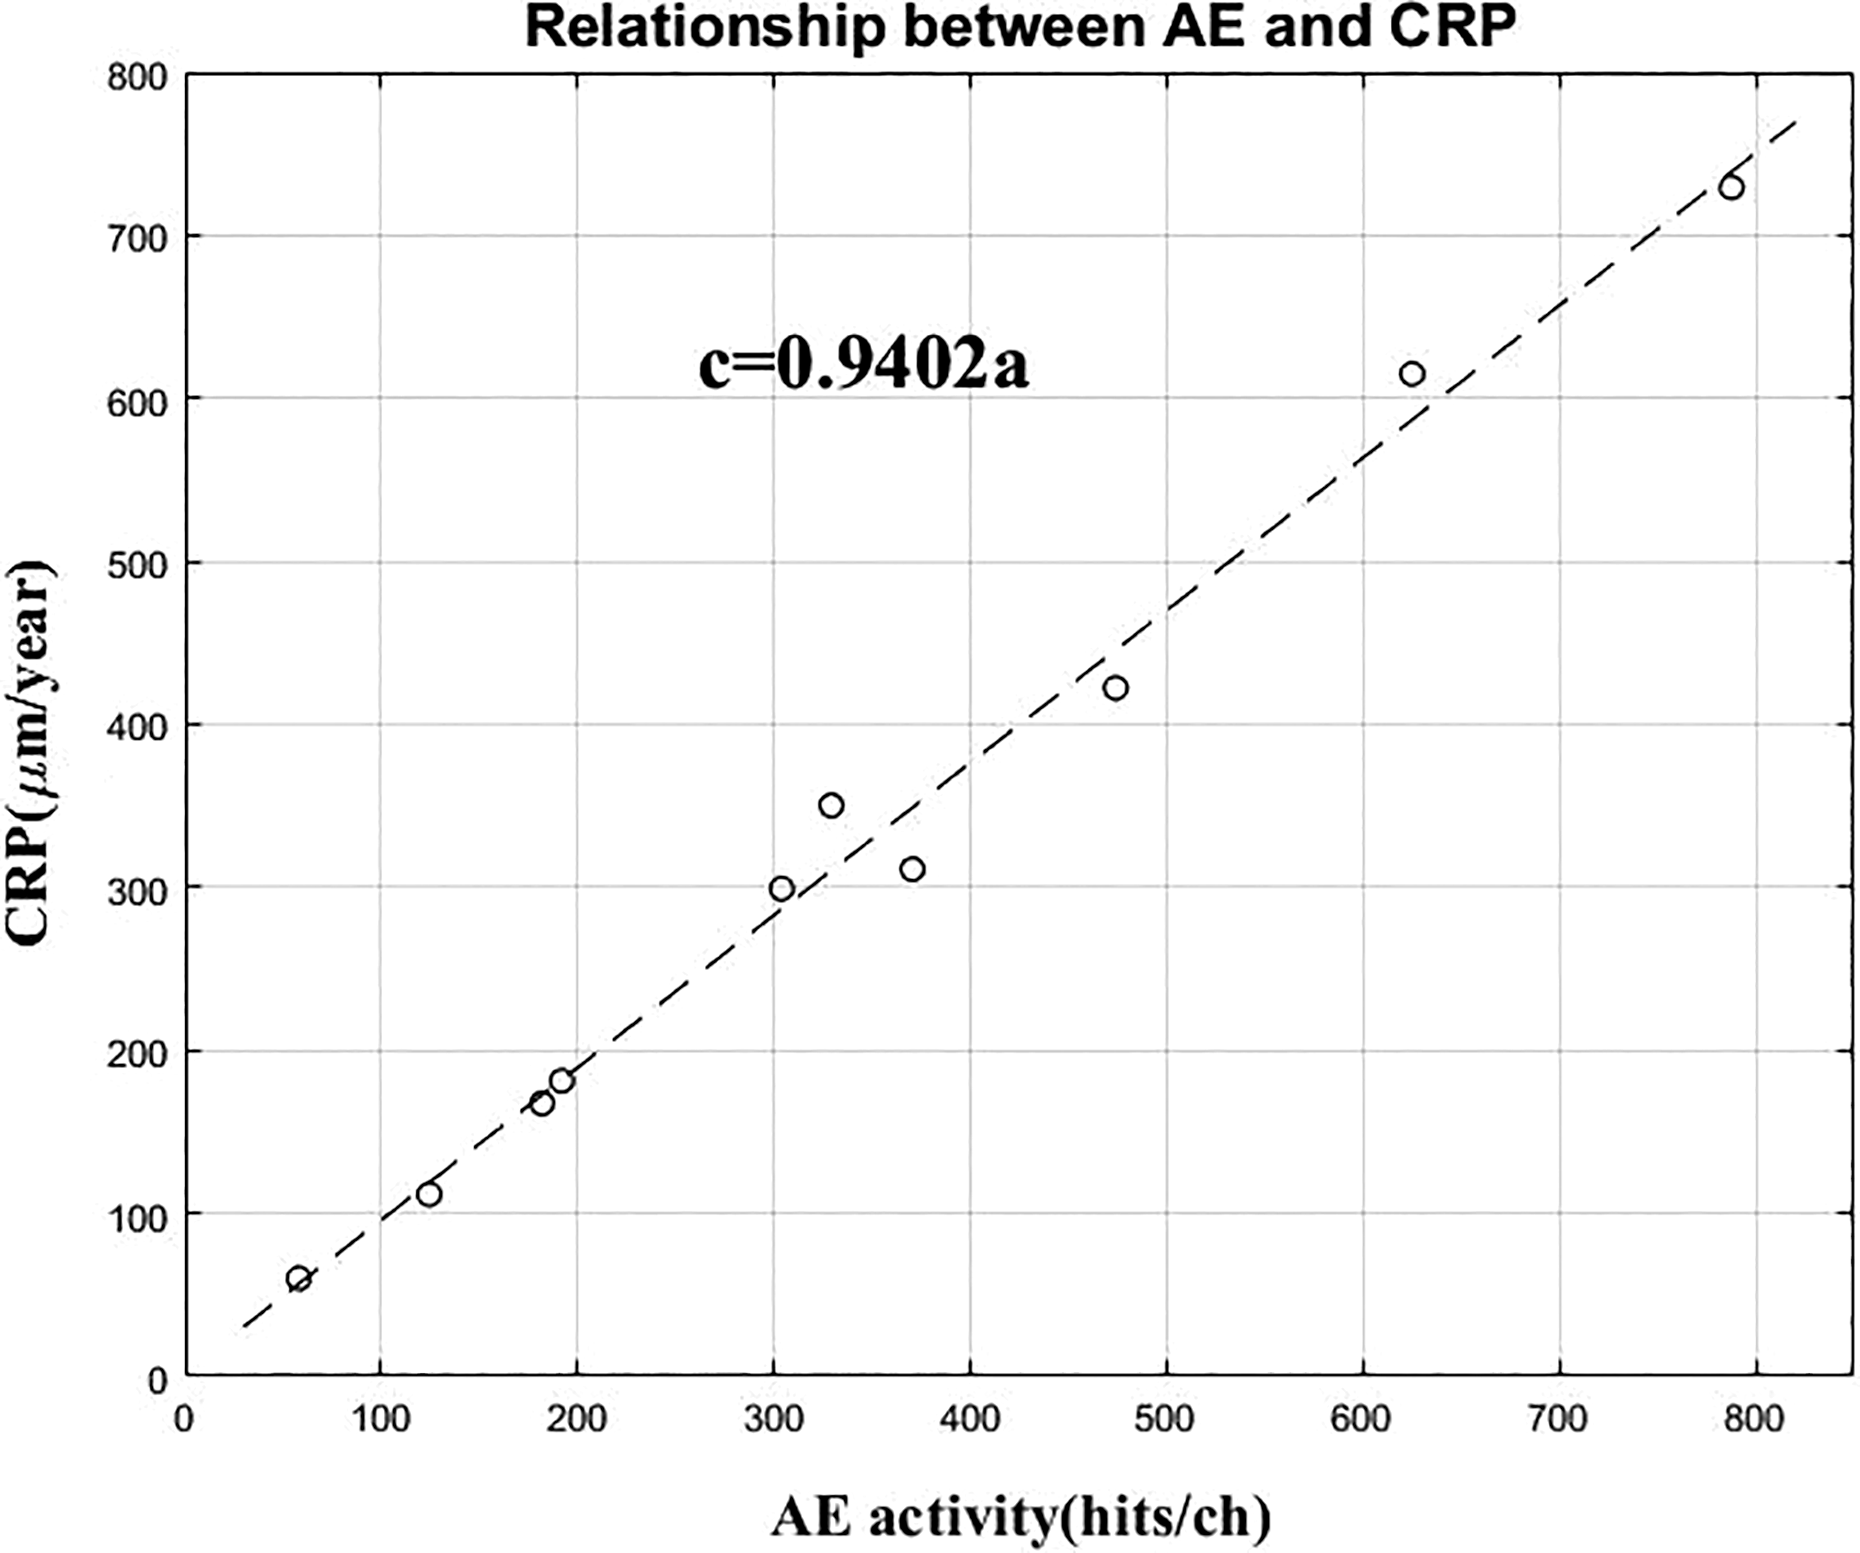
Relationship between AE activity and CRP. AE: acoustic emission; CRP: corrosion risk pace.
When predicting the RUL of an actual storage tank, the AE activity of the tank is obtained through AE testing, then the CRP of the tank bottom is calculated based on the quantitative relationship curve acquired before. According to the location of the tank, the medium in the tank, the foundation of the tank, the environmental temperature, and the anticorrosion measures, the computed CRP was quantitatively modified. 23 –25 In addition, past experiences show that for crude oil storage tanks, when the average CRP is 0.05–0.125 mm/year, the CRP of the most serious part is 0.6 mm/year. For gasoline, kerosene, naphtha, and diesel oil tanks, when the average CRP is 0.05–0.25 mm/year, the corrosion rate of the most serious part is 0.4 mm/year. Therefore, we can conclude that the CRP at the most serious location of tank bottom is about 12 times that of average CRP.
Let
Case study
In this section, we take an actual storage tank as an example to verify our proposed method. Firstly, a preliminary health analysis of the tank bottom is carried out. Assume that the metric weights of tank bottom quality can be obtained as presented in Table 5.
An example of weight derivation for evaluating metrics.

The corresponding membership function is set for each evaluation metric in the table in advance, and the corresponding membership matrix is calculated. Then, the evaluation matrices of different levels are calculated from bottom to top, and the final evaluation grade is obtained using the principle of maximum membership degree. Suppose that the membership matrix of foundation taper, asphalt sand anticorrosive quality, and settlement of foundation is as follows

Each row in the matrix represents the probability that three third-level indicators belong to the five grades of “extremely poor,” “poor,” “medium,” “good,” and “very good.” Then, the membership degree of tank foundation can be calculated as follows:

Similarly, the overall health status of the tank bottom can be evaluated, and the final conclusion is that the tank bottom is in a “medium” health level. The second step is to predict the remaining life of the tank based on the data. After online detection of AE for storage tanks, the data of AE are presented in Table 6.
The AE data of testing tank bottom.
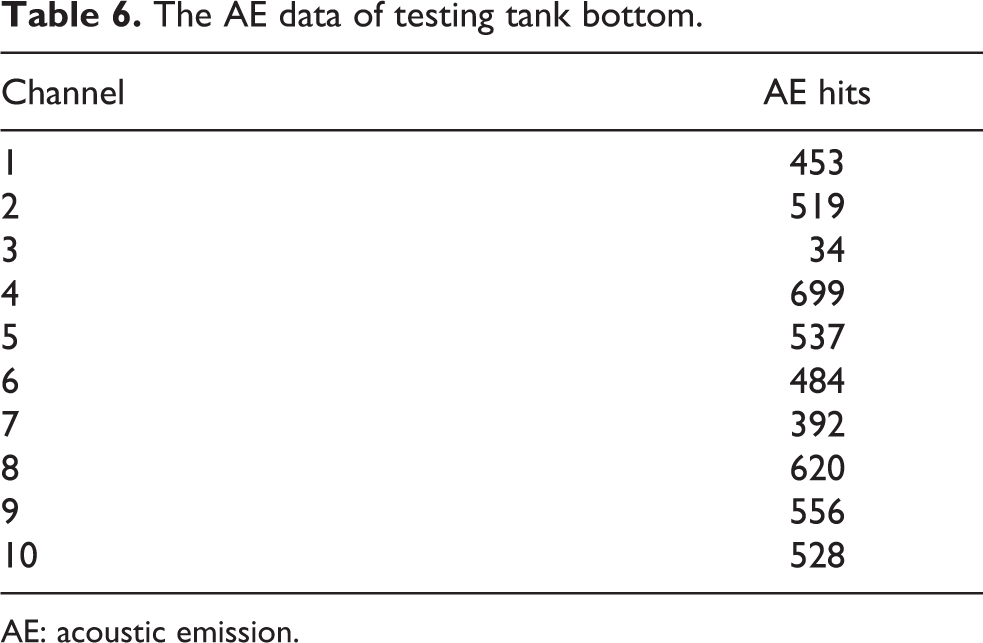
AE: acoustic emission.
The AE activity of the tank bottom is calculated:
Conclusion
During the past decades, a large number of new oil storage tanks have been installed in China. Under this circumstance, careful inspection is extremely important, especially for those aging facilities. Corrosion detection and health analysis of large storage tank bottom can prevent the occurrence of catastrophic accidents and help provide maintenance strategies, which can bring huge economic benefits to actual production. Traditional tank detection methods are usually carried out offline, which require stopping the regular operation of tank to pour oil and clean the tank bottom. However, nearly 80% of tank openings turn out to be waste of manpower, financial resources, and time.
To effectively solve the above issue, in this article, we propose a two-stage corrosion analysis and RUL prediction method for large storage tank bottom. The main contributions of this work are: The main influencing factors of tank bottom corrosion are systematically analyzed, and the health status evaluating metric system of tank bottom is established. Fuzzy comprehensive evaluation method is employed to make preliminary diagnosis, which determines whether a quantitative analysis is required. The quantitative model between AE activity and corrosion rate of storage tanks is established through AE and MFL testing of experimental storage tanks. Based on Chinese national standard, the RUL of storage tanks is predicted by combining AE with RBI technology. A comprehensive case study is conducted to show the feasibility of our approach.
In the future, we plan to collect more AE data and add multiple features to build a more complicated model. According to the characteristics of collected data, we are going to apply deep learning or sequence learning mechanisms to our research, which is expected to improve the accuracy of RUL prediction.
Footnotes
Declaration of conflicting interests
The authors declared no potential conflicts of interest with respect to the research, authorship, and/or publication of this article.
Funding
The author(s) disclosed receipt of the following financial support for the research, authorship, and/or publication of this article: This work was supported by the National Key R & D Program of China [no. 2018YFF0214705]: Management and Control System of Health Status for Typical Industrial Equipment Driven by Big Data.