
Abstract
With increase in the number of elderly people in the Japanese society, traffic accidents caused by elderly driver is considered problematic. The primary factor of the traffic accidents is a reduction in their driving cognitive performance. Therefore, a system that supports the cognitive performance of drivers can greatly contribute in preventing accidents. Recently, the development of devices for visually providing information, such as smart glasses or head up display, is in progress. These devices can provide more effective supporting information for cognitive performance. In this article, we focus on the selection problem of information to be presented for drivers to realize the cognitive support system. It has been reported that the presentation of excessive information to a driver reduces the judgment ability of the driver and makes the information less trustworthy. Thus, indiscriminate presentation of information in the vision of the driver is not an effective cognitive support. Therefore, a mechanism for determining the information to be presented to the driver based on the current driving situation is required. In this study, the object that contributes to execution of avoidance driving operation is regarded as the object that drivers must recognize and present for drivers. This object is called as contributing object. In this article, we propose a method that selects contributing objects among the appeared objects on the current driving scene. The proposed method expresses the relation between the time series change of an appeared object and avoidance operation of the driver by a mathematical model. This model can predict execution timing of avoidance driving operation and estimate contributing object based on the prediction result of driving operation. This model named as contributing model consisted of multi-hidden Markov models. Hidden Markov model is time series probabilistic model with high readability. This is because that model parameters express the probabilistic distribution and its statistics. Therefore, the characteristics of contributing model are that it enables the designer to understand the basis for the output decision. In this article, we evaluated detection accuracy of contributing object based on the proposed method, and readability of contributing model through several experiments. According to the results of these experiments, high detection accuracy of contributing object was confirmed. Moreover, it was confirmed that the basis of detected contributing object judgment can be understood from contributing model.
Introduction
In Japan, traffic accidents caused by elderly drivers have become a problem owing to an increase in the number of elderly people in the Japanese society. The most effective measure to drastically reduce the number of such accidents is the automation of cars, which has attracted a significant amount of research attention. 1 –3 However, in the current state of automated driving technology, automated driving is possible only under specific conditions and in very limited areas, such as regions with less population. Therefore, it is very challenging to replace every car with an automated vehicle in the next few years. Moreover, in the United States, there is an increasing number of states that require that operator can remote the vehicle as backup, rather than leaving the control of an autonomous vehicle completely mechanical. According to these reasons, it is considered that a person driving vehicle will continue to exist. Therefore, an approach for support the vehicle operation of drivers should be investigated thoroughly.
The main cause of traffic accidents is the cognitive mistakes committed by drivers. Several objects, such as pedestrians, changing traffic lights, and positional relation with the car in front of the driver, are appeared. Therefore, the driver must recognize these objects while driving and should be able to take appropriate action in response to each one of these objects. These operations involve advanced information processing, and cognitive mistakes, such as oversight or misjudgment, are events that are not limited to the elderly only. Therefore, a system that supports the cognitive performance of drivers can greatly contribute in preventing accidents.
Driving support technique differs from autonomous driving technique 4,5 that driver’s characteristics, such as cognitive performance and habit of operation, are considered at system design. Moreover, in the driving support system, it is important to provide feedback to driver efficient support information. This is because that the judgment of driving operation is left to driver. While driving support systems, such as adaptive cruise control or lane keeping assistant system, are already being used as cognitive support system. Most of their functions provide support information through voices or marks on their panel meters. However, such methods require judgment of the provided information. Therefore, the more information is given, the more confusion is caused. Therefore, herein, the presentation method of information has been discussed. Herein, the following two problems are examined.
The first problem is that of the user interface. Since a driver visually perceives the driving situation, information provided through voice or on panel meter requires comparison process with the visually perceived driving situation. Therefore, the driver needs time to make a judgment. Therefore, another user interface is considered to be necessary and visual information presentation on the field of vision could be an especially effective form of support. To address this problem, the development of devices for visually providing information, such as smart glasses 6 or head up display, 7 –9 is in progress. With a decrease in the prices of these devices and the development of mixture reality technology, it is possible that they will become widely used in the near future. Thus, it is considered that the problem of the user interface will be solved in the future.
Meanwhile, the other problem is the selection of information to be presented. It has been reported that the presentation of excessive information to a driver reduces the judgment ability of the driver and makes the information less trustworthy. 10 Thus, indiscriminate presentation of information in the vision of the driver is not an effective cognitive support. Therefore, a mechanism for determining the information to be presented to the driver based on the current driving situation is required.
Herein, the information to be presented to the driver is regarded as an object that the driver should recognize to avoid an accident. Steering or braking is crisis preventive operation for avoiding a collision. Such crisis avoidance inevitably has objects that trigger the crisis, and wrong recognition of these objects leads to an accident. Therefore, it is considered that the cognitive object with the highest priority while driving is the object that triggers a crisis. Hereafter, the object that contributes to avoidance action is referred to as a contributing object.
Based on the above background, this study aims to establish a method for detecting contributing objects among various objects that appear while driving a car. In addition, it is premised that the driving situation can be observed as a running image through a dashboard camera. The recent improvement in the object recognition technology will easily enable detection of objects appearing in the driving image. 11 –13 While, in this article, we propose a method that selects contributing objects among the detected objects. The proposed method expresses the relation between the time series change of an appearing object and avoidance operation of the driver by a mathematical model. This model is based on the idea that a specific time series change of the appearing object triggers avoidance operation of the driver in the future. Herein, this mathematical model is called the contributing model. It has the ability to output the occurrence probability of a future avoidance operation and to identify the object that increased its probability, that is, it is possible to identify the contributing object and present it to the driver before an avoidance operation is taken.
This article comprises the following sections. The “Preliminaries” section, as problem setting, organizes the support system assumed by this research and the premise and then clarifies the technological challenges to be addressed. The “Relevant study” section describes the related studies and organizes unresolved points by existing technologies and, then, clarifies the features of the proposed technology. The “Contributing model” and “Detection method of contributing object to driving operations based on contributing model” sections describe the proposed method, and finally, in the “Experiment” section, we discuss its evaluation experiment.
Preliminaries
The premise of this study is that a dashboard camera, which captures the running image, and sensors, which monitor the steering wheel angle, accelerator amount, and braking amount, are installed on the car employed for the study. Figure 1 shows the behavior of the cognitive support system assumed herein. First, the appearing objects are detected in the running image captured by the dashboard camera and meta-information, such as the detection object label, relative distance, and relative speed, are extracted. Following this, the extracted information is inputted into the contributing model and avoidance operation probability in relation to each appearing object after N assist frames is outputted. N assistis determined by the system designer. The object that calculates the output of high probability is regarded as a contributing object and is presented in the vision of the driver. In addition, this article only considers braking operation, and the occurrence of the operation here means the action of stepping on the brake pedal.

Cognitive assistance system assumed by this research.
To realize the above system, a technology for detecting objects from the running image and a technology to construct the contributing model for selecting the contributing objects are required. For the former, object detection technologies based on deep learning, such as Single Shot multi-box Detector (SSD) 14 –16 or YOLO, 17 –19 have been proposed. For the feature extraction, approaches such as Variational AutoEncoder 20 –22 have been proposed. This article postulates that the former problem can be solved by the existing technologies and focuses on the latter problem, namely that of the model construction technology.
Relevant study
Now, the contributing model is put in order. The contributing model is a model that inputs the information of each detection object label information and its time series characteristic value of the object and outputs the operation occurrence probability of the driver in relation to each detection object after N assist frames. Such methods for operation prediction have been proposed in the past and the modeling approach based on a statistical model is effective. 23,24 Driving behavior history data are accumulated in advance, and these accumulated data are used for the learning of the statistical model. For instance, when the feature value representing the pedestrian who is crossing is learned as input information of model and the braking amount is learned as output information of model, a driving behavior model that predicts the braking amount for the crossing pedestrian can be generated. Particularly, as the efforts to develop automatic driving technologies have been accelerated, an environment to collect and accumulate a large amount of data has become easier to prepare, and such data have become available to public. Thus, this approach has become realistic. There are two major challenges in applying this approach to this study.
One is that of input information selection problem. For instance, the literature
25,26
sets the time series feature value of pedestrians as the input information, and the literature
27
–29
sets the time series feature values of the vehicle in front and the oncoming vehicle as the input information. For these two, the difference in their input information is due to the difference in the driving situations being modeled, and their designers set the input information appropriate for their respective driving situation based on their experiences. However, the driving situation changes with each passing moment in reality and the input information to be selected also changes accordingly. Thus, it is difficult to set in advance the input information in accordance with the possibly occurring driving situation. The other problem is that of the transparency of the model. A failure by the system to provide information or present wrong information can potentially put the driver in a dangerous situation. Therefore, ensuring that the basis of output judgment is clear while designing a model is important for guaranteeing its safe operation. While, in the literature,
30
–32
to handle the information in comprehensive manner, a method is proposed to set the running image itself as the input information. These methods enable the internal parameter to learn how to automatically select the information derived from the output information among the comprehensively acquired input information during the learning process of the statistical model. Thus, it is possible to avoid the abovementioned problem of the input information selection and to generate a contributing model that enables the operation prediction. However, with these methods, the internal information of the model is a black box and it is impossible for the designer to understand the basis of output judgment. As this opacity of the model means impossibility to guarantee the behavior of the system, its practical application is difficult due to the safety concern. As discussed so far, a contributing model that solves the abovementioned selection problem of the input information and the problem of the transparency of the model is required to construct the desired system. The method proposed in this article aims to solve these problems, and it differs from existing technologies in possessing the following characteristics. For learning data, it only requires to prepare the input data of running images and the output data of operation information, and it does not require any other prior knowledge. Its structure generates the information processing between the input and the output as a rule group, and by identifying the rule that determines the output, it enables identification of the input that became the basis for the output judgment. It shows the ruling group that represents the information processing between the input and the output in a format with high transparency, and it enables the designer to understand the basis for the output decision.
Contributing model
Overview
Proposal contributing model is given as the input to the label and time series features of the detected object based on the image recognition techniques. The execution probability of driving operation after k frames comes as the output from the contributing model. Here, the label of the detected object is described as o
1, o
2,…, oj
,…, oJ
. And time series features of the object from t − l to t is described as

In this article, the above probability is called as contributing probability and expressed by a statistical model. Equation (1) can be expressed by Monte Carlo (MC) method 33 or long short-term memory (LSTM). 34 However, these methods are the estimation method of posterior probability and not able to estimate the factor which enhances the probability. On the other hand, the probability distribution of equation (1) is expressed using multi-hidden Markov model (HMM) in this article. HMM is time series probabilistic model which can model the time series data using transition of probabilistic distribution. The structure of HMM is so simple. Moreover, there is an established learning algorithm, such as Baum–Welch algorithm 35 and infinite HMM. 36 Therefore, HMM is frequently used to model time series data. However, HMM is not estimation method of the factor which enhances the probability as with MC and LSTM and is used generically to recognize time series patterns. In this article, equation (1) is expressed by the way that condition events are expressed by multi-HMM and each HMM learns the relationship with driving operation information t + k, A. Therefore, estimating equation (1) is possible to predict operation occurrence and estimate the factor by time series recognition based on HMMs.
In particular, HMM has a characteristic that model parameters express the probabilistic distribution and its statistics. This characteristic makes designer judge easily the modeled time series data. MC and LSTM can also recognize time series patterns, but the internal information of the model is black box. Therefore, it is difficult for these methods to analyze the modeled time series patterns. According to this reason, the contributing probability described in equation (1) is expressed using multi-HMM to generate the contributing model with high readability in this article.
Model structure
Proposal contributing model consisted of multi-HMMs as shown in Figure 2. The HMMs are sorted by object label. In this article, each HMM is described as follows


Model structure of contributing model and the policy of modeled time series features.
Each HMM models time series features until from object detection to execution of driving operation. Moreover, the following features are added to each HMM.
Firstly, a confidence degree is added to each HMMs. Each HMM is generated based on the unsupervised classification as will be described later. Therefore, it is hard to say that all generated models are reliable. According to this reason, the confidence degree is added to each HMM to evaluate reliability. This degree is defined as the following equation, which means the execution probability of driving operation based on the occurrence of objects and their time series change

Secondly, timescale information of time series data is added to each HMM. In general, to recognize time series data with different timescales as the same time series pattern, HMM learns time series data without its timescale. On the other hand, in this HMM, time until execution of driving operation is added to each HMM as probabilistic distribution because of execution prediction of driving operation after k frames. 37 As Figure 3 shows, this probabilistic distribution is added to each state of HMM. This probabilistic distribution is called as time probability in this article. Time probability pertains to transition time from arbitrary state to final state. Note that HMM models time series features until from object detection to execution of driving operation. Therefore, transition of final state means occurrence of operation execution. Then, this time probability expresses the following equation

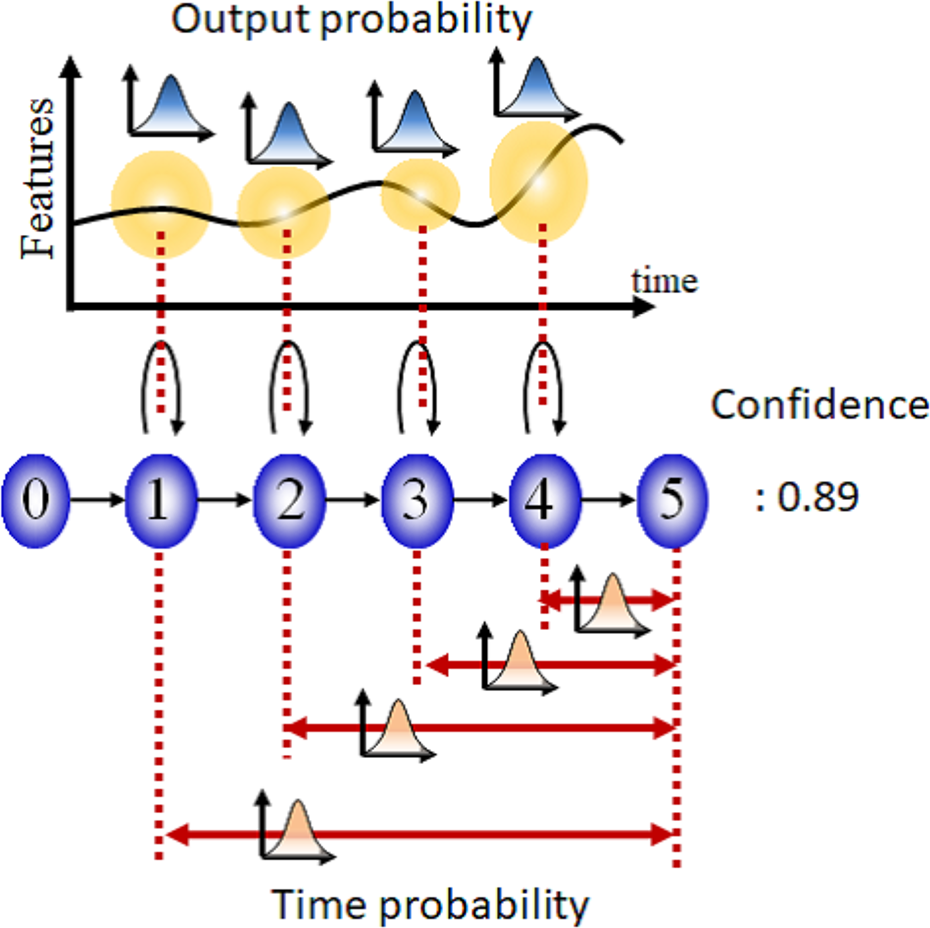
Added elements to HMM: confidence and time probability. HMM: hidden Markov model.
Thus, equation (1) is expressed as the following equation based on the proposal contributing model

Procedures of contributing model
Accumulation of time series data of detected objects
First of all, learning data are collected to learn contributing model. In this method, the learning data denote time series features with object label until object detection to execution of driving operation. Figure 4 shows the detail of learning data. Time series driving images and driver’s operation data are obtained while he drives. The obtained time series driving images are converted into label data and time series features of detected object based on image recognition technique. On the other hand, time series operation data are segmented. This segmentation point means the switch point of driving operation. Therefore, this point can be regarded as the execution point of driver’s next operation. Note that braking operation is only focused on in this article. Therefore, the segmentation point that brake operation data change from “OFF” to “ON” is regarded as execution point of driving operation.
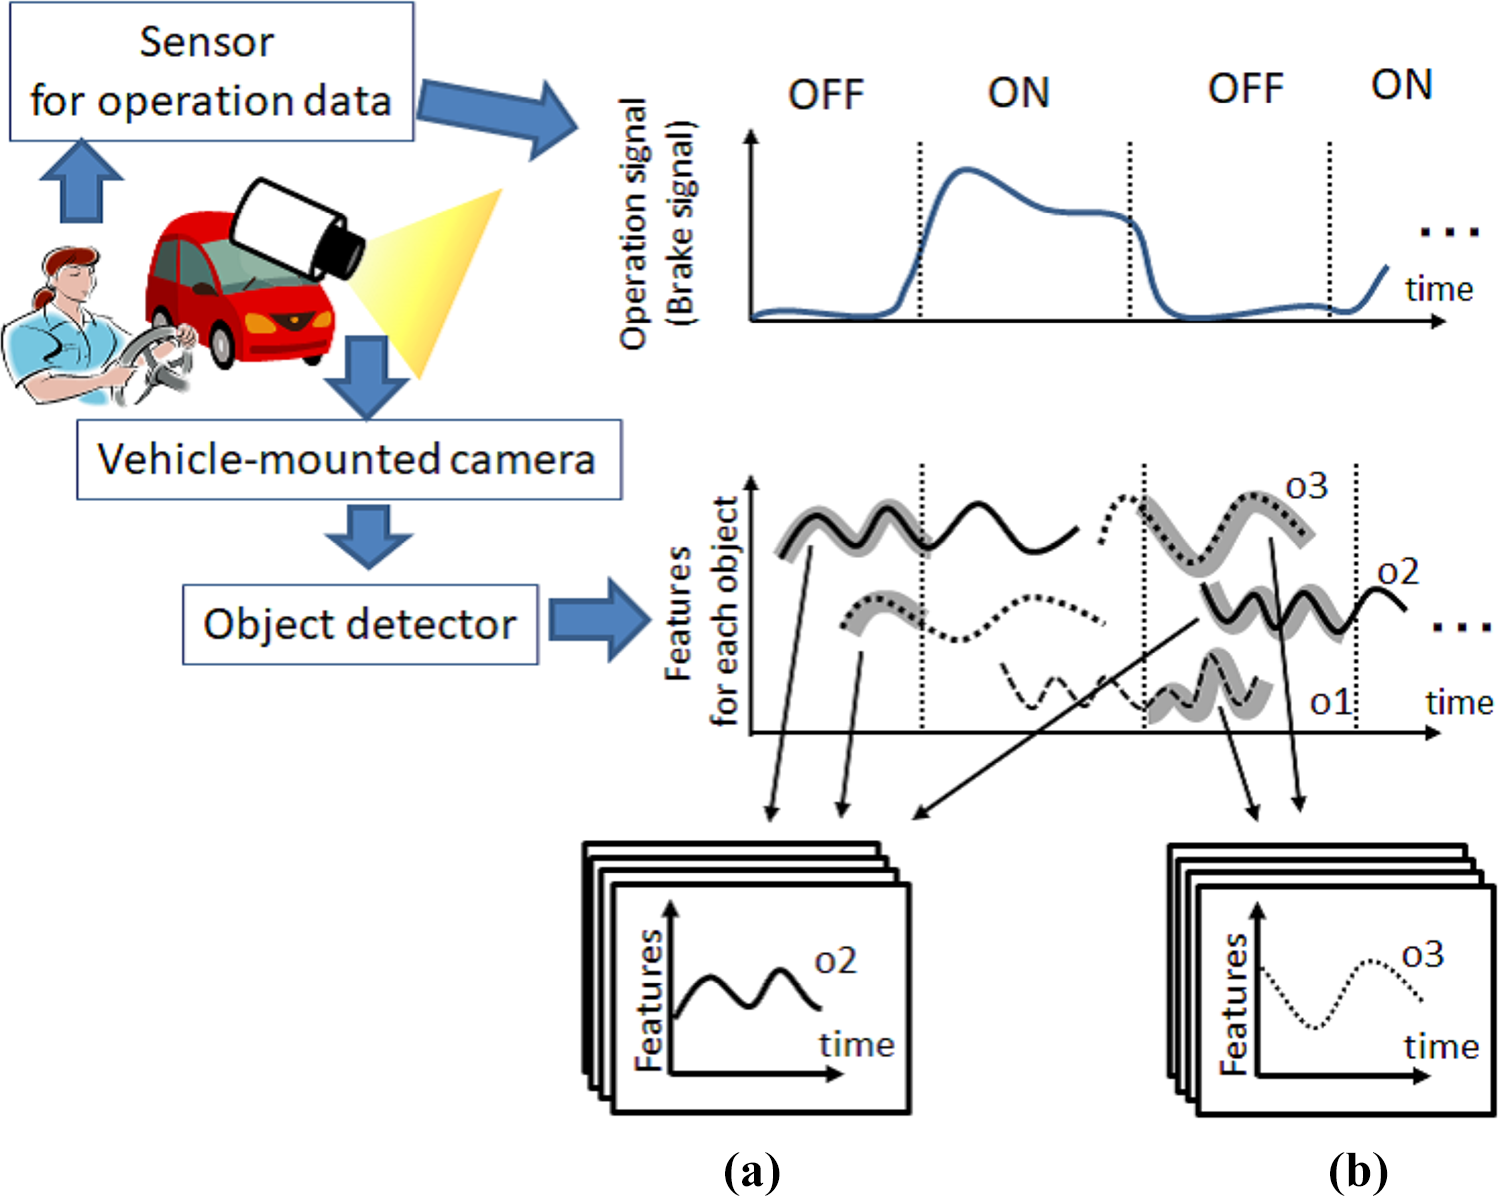
Collection of learning data and extraction of (a) Positive and (b) Negative data set.
Next, two kinds of data set are extracted from the collection data described above. First data set consisted of object label and time series features until from object detection to execution of driving operation (Figure 4(a)). These data are called as Positive data and described as the following equation

Another data set consisted of object label and time series features until detected object is undetectable without execution of driving operation (Figure 4(b)). These data are called as Negative data and described as the following equation

Here, to
j
is the time that object oj
is detected. ta
is the execution time of driving operation.
Competitive learning based on HMMs
Next, a set of Positive data is classified and modeled by HMM. Firstly, a set of Positive data is classified based on object label. Then, the classified data set is reclassified based on competitive learning using HMM.
41
The following is the procedure of competitive learning.
Step 1: Mλ
HMMs (λm
: m = 1, 2,…, Mλ
) are generated with random parameters.
Step 2: Likelihood P(pos(i)|λm
) of HMM λ is calculated when Positive data pos(i) is inputted.
Step 3: HMM(λ
max) which calculates maximum likelihood is chosen for input data pos(i).
Step 4: Positive data pos(i) is saved as learning data of HMM(λ
max).
Step 5: Steps 2–4 are executed for all Positive data.
Step 6: For the HMMs with learning data that its number is higher than threshold th
a
, relearning is executed by using saved learning data. Then, the saved learning data are deleted. For the HMMs with learning data that its number is lower than threshold, the saved learning data are deleted without relearning.
The above processes are repeated until repeat count is higher than threshold th b . Note that saved learning data are not deleted after repeat process and used for learning of time probability. On the other hand, the HMMs with learning data that the number is lower than threshold are deleted.
Learning of time probability in HMMs
In this section, time probability is added to generate HMMs by previous process. The time probability is expressed via two-dimensional (2-D) mixed normal distribution and added to each state of HMM. Here, learning method of time probability of state q of HMM(λm ) is described below.
Now, i-th Positive data saved in HMM(λm ) is described in the following equation

f 1 is the feature and T is the time series length. All Positive data saved in HMM(λm ) are input to HMM(λm ), and optimal state transition passes are estimated based on Viterbi algorithm. The estimated pass is described below.

s is the transition state and

Secondly, time k until transition state transits from state q to final state is calculated based on the following equation

The above (v, k) is calculated for all Positive data and used for learning of time probability. In this article, time probability of state q in HMM(λm ) is described as

Confidence estimation for generated HMMs
The generated HMMs by the process of previous section model time series features until from object detection to execution of driving operation. This is because that Positive data are used as learning data of HMM. However, all obtained positive data do not necessarily contribute to driving operation. For example, a driver executed brake operation when there are several objects while driving. In this case, it is not necessary that all appeared objects contributed to brake operation. It is considered that the driver judges and chooses the contributing objects in the appeared objects. However, in the proposed method, time series features of all appeared objects are collected as positive data. Therefore, the HMMs not relationship with execution of driving operation are contained in the generated HMMs by the process of previous section. According to this reason, the degree of confidence conf λ m is calculated and added to HMM(λm ) using a set of Negative data in this method. This value is evaluation index of relationship with execution of driving operation and is calculated based on the following equation

Here,
The threshold th c described in the previous section is set in the following equation

Here, th c (λm ) means the threshold of HMM(λm ). L ave(λm ) and L std(λm ) are the average and standard deviation of likelihoods for the data used in the HMM(λm ) training. ρ is a constant parameter determined experimentally.
Detection method of contributing object to driving operations based on contributing model
In this section, it is described how to choose the contributing object based on the contributing model. In this method, the appeared object that execution probability (contributing probability) of driving operation after N assist frame is higher than threshold th d is regarded as contributing object. When the time series driving images are obtained by mounted camera, the object detection and extraction of time series features processes are executed. Now, obtained time series features is described below

Here, Dt is the number of detected object at current time t. Each time series features is inputted to contributing model and likelihood P(Tt : t −ld,od |HMM(ol,λml )) is calculated for each HMM. Note that the time series features only is given as the input to HMMs with the same object label (od = ol ). Then, the HMMs which calculate likelihood higher than threshold th c are chosen. Here, final state free continuous Viterbi algorithm 42 is used to calculate likelihood. With this algorithm, similarity can be evaluated with respect to partial time series features from initial state to an arbitrary state. Therefore, current transition state can be estimated and the time v until transition of current state can be calculated as shown in Figure 5.

Outline of calculation method of contributing probability.
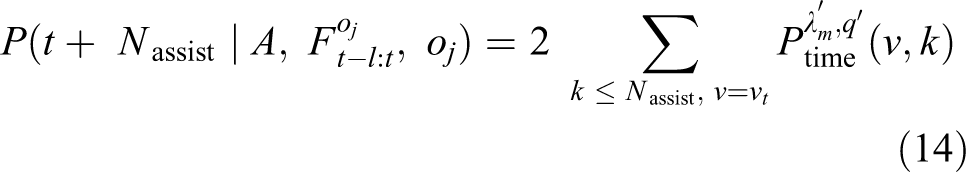
Finally, contributing probability is calculated based on the following equations. Here, λ′ is the HMM which calculates likelihood higher than threshold. q′ is the current state


Experiment
Experimental setup
The experimental environment is shown in Figure 6. The experiment involved a constructed driving simulation. The course on which the examinees drive is shown in Figure 6(c). Driving images and operational information when driving are collected sequentially, and for the operational information, the angle of the steering wheel (−450° to 450°), the accelerator volume (0–1), and the brake volume (0–1) are observed. However, the handle angle is also normalized as 0–1. In this experiment, the contributing model is generated using only the brake volume. For the object detection algorithm, SSD is used, and an SSD model is generated that can detect the four target types of pedestrians, other vehicles, traffic light, and red traffic light (Figure 6(d)). For feature values, the forward/backward distance and left/right distance shown in Figure 6(b) are used. The observation is set to within a distance of 50 m in a −90° to 90° direction in front of you.

Experimental environment: (a) driving simulator, (b) features of detected object, (c) course in the experiment, and (d) appearance objects.
In the experiment, one examinee drove for 2 h, and the data collected at the time were used to generate the inducement model. The setting parameters of the proposed method are Mλ = 100, th a = 100, th b = 30, th d = 0.8, N assist = 20 frame, and ρ = 3.0.
Evaluation of detection accuracy of contributing object
We evaluated the detection accuracy of contributing object using the generated contributing model. As test data, we asked the test subjects in question to newly drive for approximately 10 min, and these data were used as test data. These test data were input to the inducement model, and the contributing object was detected and presented based on the proposed method. We performed an evaluation and observations of these test results.
Figure 7 is an image, for a given driving scenario video, that visualizes the process within the contributing model up to the point that the contributing object is detected. Figure 7(a) shows changes in the object labels detected and their numbers. In Figure 7(b), the changes in the contributing probability are expressed. Figure 7(c) shows a driving scene in the 200th and 243rd frames. Based on Figure 7(a), we can confirm that in this scenario, a passenger and vehicle appear and are detected. Therefore, in the first half frames, whatever the detection object, the contributing probability is calculated to a low value, and it is not seen as a contributing object. Therefore, this is not presented as a contributing object (Figure 7(c), left). On the other hand, when we get to the latter half frames, the contributing probability for specific object increases, and in the 243rd frame, the threshold is exceeded. The object in question is a pedestrian crossing the road, and, as shown in Figure 7(d), right, object that exceeds the threshold is presented in a colored frame. From the above, we can confirm that contributing objects are selected from detection objects based on the current situation.

Visualization of the process with the contributing model up to the point that the contributing object is detected for a given driving scenario video: (a) the number of detected object, (b) the calculated contributing probability, and (c) the scene image for each frame.
Next, we evaluated the accuracy of whether the information was presented or not. Here, presentation of information refers to the provision of the object in a colored frame as described previously, and the object presented in a colored frame shall be called from hereafter a “presented object.” The following can be stated as evaluation indicators. We evaluated the information quantity (IQ), unpresented rate (UPR), and mistakenly presented rate (MPR). IQ refers to the amount of information provided to the examinee, and here the total number of presented objects is the value divided by the number of frames in which the information is presented. The UPR is the ratio in which the information is not presented in a driving scene in which the brake operation occurs. The MPR is the ratio in which information is presented in a scenario where the brake operation does not occur. Here, we compare the following two presentation methods. Method 1 is a method of presenting all objects that appear. This is positioned as a method of presentation that sees all appearing objects as contributing targets. Method 2 is presented for only other vehicles used as contributing objects. This is positioned as a method of presentation when the contributing object is set in advance by the designer.
The evaluation results are shown in Table 1. With method 1, as all the objects that appear are presented, we can confirm that there is a large IQ compared to the other method. Additionally, given the fact that the MPR is also high, we can confirm that information is presented under circumstances where it is not necessary for the driver to perform any operation. When this type of meaningless information is presented, this causes hesitation when judging the presented information, and, for this reason, it cannot be said to be an effective method of presentation. In the case of method 2, whereas, as only specific objects are presented, there is less IQ, we can confirm that there is a high UPR. This is thought to be because there is no information presented in regard to pedestrians or red traffic signals that would induce operation. In this way, if some of the contributing objects are not set in advance, it is not possible to present information in relation to the unset objects. In comparison with these methods, we can confirm that when using the proposed method, there is a low IQ, and the UPR and MPR are both low.
The result of performance evaluation: IQ, UPR, and MPR.
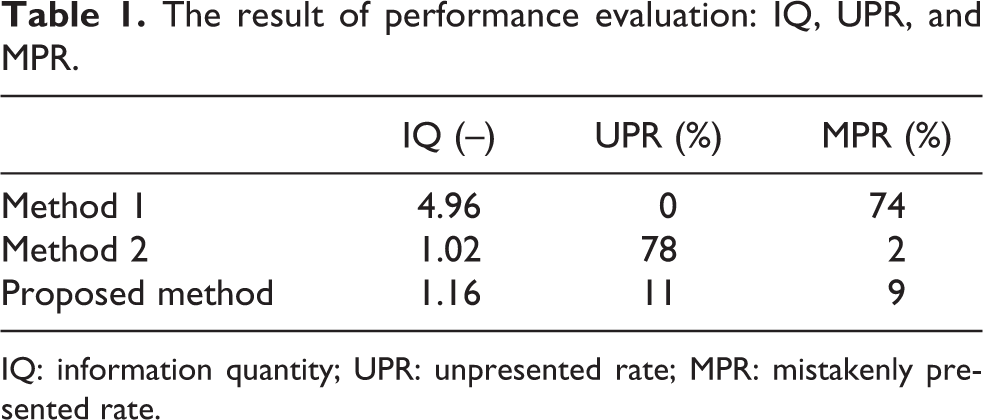
IQ: information quantity; UPR: unpresented rate; MPR: mistakenly presented rate.
Figure 8(a) shows a driving image when a non-presentation occurs, and Figure 8(b) shows a driving image when a mistaken presentation occurs, based on the proposed method. Figure 8(c) shows changes in the contributing probability when the non-presentation occurs as in Figure 8(a). From Figure 8(a) and (c), we can confirm that immediately after the driver has operated the brake, the contributing probability in relation to the vehicle in front is below the threshold. That is to say, when the timing at which the driver operates the brake is fast, this kind of non-presentation occurs. However, as it can be considered, due to the fact that the brake operation has been executed, that the driver has recognized the contributing object, the occurrence of this non-presentation is not a serious problem. On the other hand, from Figure 8(b), we can see that when following a vehicle in front of you, a mistaken presentation may occur. The driver reduces speed by operating the accelerator when approaching the vehicle in front, and does not, in fact, operate the brake. In response to this, the system judges this to be a situation in which a brake operation is induced and judges the vehicle in front to be contributing object. If we consider the fact that the driver uses the accelerator operation as an avoidance operation, judging the vehicle in front to be contributing object is not a mistaken judgment at all.

A driving scene when a non-presentation and mistaken presentation occurs: (a) the scene image of non-presentation, (b) the scene image at false presentation, and (c) the calculated contributing degree for (a) scene.
Next, we verified the accuracy of the presented information. As multiple objects may be presented as presentation information, there may be cases when the contributing object is being correctly presented and other cases when unrelated object is being presented. We evaluated the accuracy of the presented information in terms of correct rate (CR) and redundancy rate (RR). The CR is the rate at which the correct contributing object is presented in relation to the number of frames in which information is presented. The RR, on the other hand, is the rate at which unrelated objects are presented as contributing objects in relation to the number of frames in which information is presented.
The results are presented in Table 2. With method 1, as all of the objects that appear are presented, naturally contributing objects will be included in the presented information. The CR is therefore 100. However, as it is presenting objects other than the contributing objects, the RR is also high. In the case of method 2, we can see that as the contributing objects are set in advance, the CR is high and the redundancy rate is low. We can confirm that, compared to method 2 in which the contributing objects are set in advance, the proposed method can achieve an equivalent or higher level of precision.
The result of performance evaluation: CR and RR.

CR: correct rate; RR: redundancy rate.
Figure 9(a) shows a driving image in which the contributing object is correctly presented, and Figure 9(b) is an example of a driving image in which an unrelated object is presented as contributing object. From Figure 9(a), we can confirm that when the vehicle in front approaches crossing pedestrians, it is seen as and presented as contributing object. On the other hand, we can see that in the case of Figure 9(b), vehicles other than the vehicle in front are presented. This is because with the SSD used in object detection, objects with overlap are detected as objects, and the contributing probability is calculated respectively for each. At this time, for each of the vehicles, this is seen as a situation in which they are approaching, so the contributing probabilities are calculated highly. In response to this problem, it can be said that it is necessary to consider the positional relationship of the detected object when selecting contributing objects.

A driving scene when contributing and unrelated object are presented: (a) the scene image at collect presentation, (b) the scene image at redundancy presentation.
In this experiment, we set the information presentation parameter N assist to 20. As this is presented based on the proposed method, the result of measuring the time until the brake operation actually occurs was that this was an average of 20.64 frames, and the standard deviation was 14.01 frames Therefore, it can be confirmed that a model in which information on the timing at which the driver operation occurs is considered has been configured.
Evaluation of model readability
From the results in the previous section, we can confirm that it is possible to detect contributing objects and present information based on the proposed model. On the other hand, based on the fact that redundant information presentation occurs, it is possible that this causes the user to hesitate in their judgment. In such a case, it is necessary to confirm the behavior of the model and for the designer to take responsibility for explaining this. It is also desirable to be able to interpret the contents of the constructed driving action model. In the proposed method, as an HMM group is used in model construction, this kind of situation is modeled, and it is possible to interpret in what kind of situation information is being presented.
Figure 10 shows the generated HMM. The average value for output probability from the HMM initial state to the final state is expressed as a solid line, and each plot is a signal generated based on the output probability covariance matrix. The red plot expresses signals generated from the final state and means that the brake operation occurs when transitioning to this state. Additionally, Figure 10 includes confidence expressing the reliability of each HMM.

Time series data modeled by each HMM. Candidate object: (a) vehicle, (b) pedestrian, (c) traffic signal, and (d) red traffic signal. HMM: hidden Markov model.
As shown in Figure 10(b), we can confirm that, in regard to pedestrians, the brake operation in regard to the person crossing from the right and person crossing from the left is modeled. The confidence value, at 0.78, 0.83, is also calculated at a high value. Additionally, as shown in Figure 10(a), we can confirm that the situation is modeled in which, in relation to other vehicles, HMM with a confidence of 0.98 executes the brake operation when it approaches the vehicle in front. It can be envisaged that other situations may be modeled such as when the HMM involves being in the left lane in relation to oncoming traffic, but as the level of confidence is low, this can be said to be an HMM that cannot be calculated with a high contributing probability. That is to say, the proposed model does not see vehicles with these time series feature values as contributing objects. On the other hand, as shown in Figure 10(c), in the case of traffic light, all HMMs are calculated with a low level of confidence. Therefore, the proposed model does not see a traffic light as contributing object. This is because depending on its different colors, the response to traffic light may be, or may not be, to operate the brake. It is difficult, therefore, to consider the traffic light itself as contributing object. On the other hand, the red traffic light will always cause the brake operation to occur, so this can be confirmed, from Figure 10(d), to have a higher confidence. Therefore, the proposed model sees the red traffic light as contributing object.
Based on the above experiment results, we can confirm that the proposed contributing model has the following three characteristics: It is possible to calculate the future brake operation occurrence rate based on changes to the driving situation. It is possible to specify elements that will increase the probability of future brake operations occurring and present these to the driver. It is possible to visualize the contributing model and clarify under what circumstances information presentation shall occur.
In particular, the third characteristic can be said to be due to effects of using HMM in the model structure. HMM has clearly modeled time series data, and this enables simple interpretation on the part of the designer. In deep learning model structures, such as Convolution Neural Network, there is a high level of accuracy in relation to output, but it is difficult to show the grounds for this output. Therefore, this is not suited for applications for which an explanation of its safety is required. The proposed driving action method, on the other hand, can be said to be superior to other models from the perspective that the grounds of its output can be simply demonstrated.
Conclusion
In this article, we have tackled the problem of selecting presented information when constructing a driver cognitive support system. It has been reported that the presentation of excessive information to a driver reduces the judgment ability of the driver and makes the information less trustworthy. Therefore, a mechanism for determining the information to be presented to the driver based on the current driving situation is required. In this study, the objects that should be recognized by the driver are regarded as the objects that contribute to operations for avoiding danger, and we have proposed a method for selecting these contributing objects from the targets that appear when driving.
From the experiment results, we have confirmed that the proposed method has the following characteristics. The first is that the future brake operation execution probability can be calculated from the contributing model. High values appear in situations where the brake operation occurs, and it is possible to confirm the operation prediction that will take place when confirming the constantly changing driving situation. The second point is that the contributing object can be detected. With this model structure, it is possible to specify contributing objects by selecting HMM that increase the probability of brake operation execution. Based on this, the contributing object is detected before the brake operation is executed, and this can be presented to the driver. The third is that the grounds for judging the output of the contributing model can be interpreted. Using HMM in the model structure, we confirmed that what kinds of objects are regarded as contributing objects can be interpreted. Therefore, this can also be an effective model for applications where an explanation of its safety is required.
Future issues include examining whether the proposed model structure can be incorporated within a deep learning model structure. Whereas the proposed model is superior in terms of model transparency, it requires multiple procedures for generating the model. On the other hand, whereas the deep learning model has issues with model transparency, end-to-end learning is possible, and multiple procedures are not required. It is considered, therefore, that if the proposed model with superior transparency can be incorporated within the deep learning model structure, it will be possible to generate an inducement model with high transparency with one end-to-end learning procedure.
Footnotes
Declaration of conflicting interests
The author(s) declared no potential conflicts of interest with respect to the research, authorship, and/or publication of this article.
Funding
The author(s) received no financial support for the research, authorship, and/or publication of this article.