
Abstract
This article deals with the design of an automated system for creating a three-dimensional model of the environment with its texture. The method for creating a three-dimensional model of the environment is based on the use of a two-dimensional scanner for which the supporting hardware has been designed and constructed. The whole system extends the use of a two-dimensional scanner that is embedded in a robotic system. Supporting hardware rotates the scanner around the scan axis. This will create a three-dimensional model of the environment using a two-dimensional scanner. Thus, the resulting three-dimensional scan is formed by subsequent two-dimensional scans, each shifted with respect to the previous one. It was necessary to design the appropriate software for hardware management to control the movement of the engine, the scanner, and to process the measured data. The proposed system can be placed on various exploration robotic systems that map the space using the proposed method. Wheeled, band robotic systems or drones can be used to explore hard-to-reach environment.
Introduction
People are nowadays increasingly aware of the need to digitize the surrounding world. For example, digitization of historic buildings can help preserve cultural heritage for future generations, and based on these data, it is also possible to design procedures for renovating them. In addition, it provides many other benefits. Making virtual tours, the cities can be presented to potential visitors and thus develop tourism. Virtual models can also be useful in designing town plans. The digitization of industrial halls allows subsequent analysis and optimization of the production process.
The current trend of digitization, digital mapping, and three-dimensional (3-D) space offers new possibilities for developers and programmers and simplifies their work. Applications commonly used to view different graphical formats also begin to support formats that allow 3-D rendering. Standards have also been developed for the internal structure of these files.
A good (albeit not very recent) overview of scanning methods designed to perform 3-D scans using a two-dimensional (2-D) laser scanner is given by Wulf and Wagner.
1
The authors differentiate among four distinct scanning methods, namely
1
: – Pitching scan: It operates on a horizontal scan plane and is pitching up and down. – Rolling scan: The scan is rotating around the center of the scanner. – Yawing scan: It operates on a vertical scan plane and rotates around the upright z-axis, and the scanner is turned to the side. – Yawing scan top: It is the same as yawing scan, but the scanner is turned upward.
Naturally, each of the approaches provides a different field of view, but it should also be noted that the rotation of the 2-D sensor leads to an accumulation of points along the rotation axis (the points are more densely distributed in that region). 1 The scanning approach employed in the present article would fall into the category of yawing scans under this classification. The points would be most dense around the vertical rotational axis. There is also a slight distinction in our case in that we use a 360° scanner as opposed to the 180° scanners considered in the study by Wulf and Wagner. 1
2-D laser scanners have frequently been applied to mapping 3-D environments in the past, since 3-D scanners are still considered too expensive for applications in mobile robotics. There is a number of works that employ them in various ways—either just for mapping or for simultaneous localization and mapping (SLAM). Among such works, we can mention at least few. 2 –4 When the 2-D scanner is mounted on a moving robot, of course, sophisticated post-processing is needed in order to match and align the individual scans properly. In the present work, we do not address the matching and alignment issues and we require the scanning platform to remain stationary for the duration of the scan, which results in a single 3-D scan with a high order of precision.
However, the work of Kohlhepp et al. 2 can be given as an instance of a system that also does matching and alignment. To this end, the authors use the extended Kalman filter to track the 3-D position of the robot. This information is then used to help with the matching and alignment of the 3-D scans acquired using a rolling 2-D scanner. A similar approach—also based on the extended Kalman filter—is taken in the study by Weingarten and Siegwart. 4 Having said that, in the following, we will focus more narrowly on the ways in which various authors use 2-D scanners to perform 3-D scanning, and we will leave the matching and alignment aspects aside.
Nuchter et al. 3 use a pair of 2-D tiltable scanners (i.e. the pitching setup) mounted at the front and the back of a mobile robot in order to create a 3-D map of the environment (the intended application is autonomous mine mapping). The scans are acquired in a stop and go fashion. Each scan takes 8.9 s. The field of view of each scanner is 180° horizontally and 60° vertically with the resolution of 361 points in the horizontal and 341 points in the vertical direction.
The study by Weingarten and Siegwart 4 also uses the pitching setup. In this case, the 2-D scanner is rotated in the angular range of 270° with the number of steps being 601. Since each 2-D scan has the angular range of 180° and it itself produces 361 points, the resolution is 361 points horizontally times 601 points vertically. It takes about 1 min to create a complete scan in this way. 4
As an instance of a paper that uses yawing, we can mention the work of Martínez et al. 5 There the resulting 3-D scanner has a field of view of 360° horizontally and 67.5° vertically and the resolution of 537 points horizontally and 270 points vertically. The acquisition time is about 6.75 s in this case.
A notably different approach is taken by Llamazares et al. 6 There the 2-D scanner is mounted on the robot in a fixed position, angled toward the ground. The 2-D slices that make up the 3-D scan are formed as the robot moves forward. Regrettably, this study 6 neglects to mention the details such as the resolutions of the resulting scans and the overall speed of scanning, so we cannot make any quantitative comparison with the abovementioned approaches.
A further instance of a system, which uses pitching, is presented in the study by Chou and Liu. 7 The interesting feature of this solution is the use of a four-bar linkage on which the 2-D scanner is mounted—this provides the required movement. Since the movement of the scanner is not simply rotatory in this case, a linkage transformation is applied to recover its position and thus also the correct positions of the measured points.
One way in which the present work differs significantly from all the abovementioned approaches is that it combines the 3-D scan with textures collected using a rotating camera. This not only increases the interpretability of the 3-D scan considerably but also significantly contributes to providing a more faithful reconstruction of the original scene.
A paper, which is comparably close to the present work in the fact that it also combines a 2-D scanner with a (stereo) camera, is the study by Lin. 8 There, however, the camera is used with the express purpose of improving SLAM precision and not for collecting textures or providing scene reconstructions.
As a sample of other interesting applications of 3-D scanning using 2-D scanners, we can mention the study by Wang et al., 9 which uses the scanner to do 3-D plant structure phenotyping, or the studies by Schadler et al. 10 and Droeschel et al., 11 which use such scanners to map rough terrain with the intent of performing autonomous navigation, drivability assessment, and other related tasks.
The proposed method for creating a virtual space model is based on the measurement and processing of spatial data. This issue is addressed by several expert groups who have achieved significant results.
Researchers at the Technical University of Košice, the Institute of Geodesy, Cartography, and Geographic Information Systems, carried out the measurement of the Urban Tower (Figure 1) using the Trimble VX Spatial Station and the Leica ScanStation 2. The Urban Tower is a gothic bell tower at St. Elisabeth’s Dome in Košice. The Trimble VX Spatial Station was scanned from four positions and from three positions by the Leica ScanStation 2. The individual points in which the measurements were made were placed into a common coordinate system. The resulting cloud of points has reached 43.64 million points, with 8 million points remaining after filtration. 12

3-D model of the urban tower. 3-D: three-dimensional.
A 3-D object model can also be created from photographs. This method is used by several authors, some focused on smaller objects (e.g. historical vases, statues; Figure 2) 13 and some on larger objects such as buildings (Figure 3) and mountains (Figure 4).
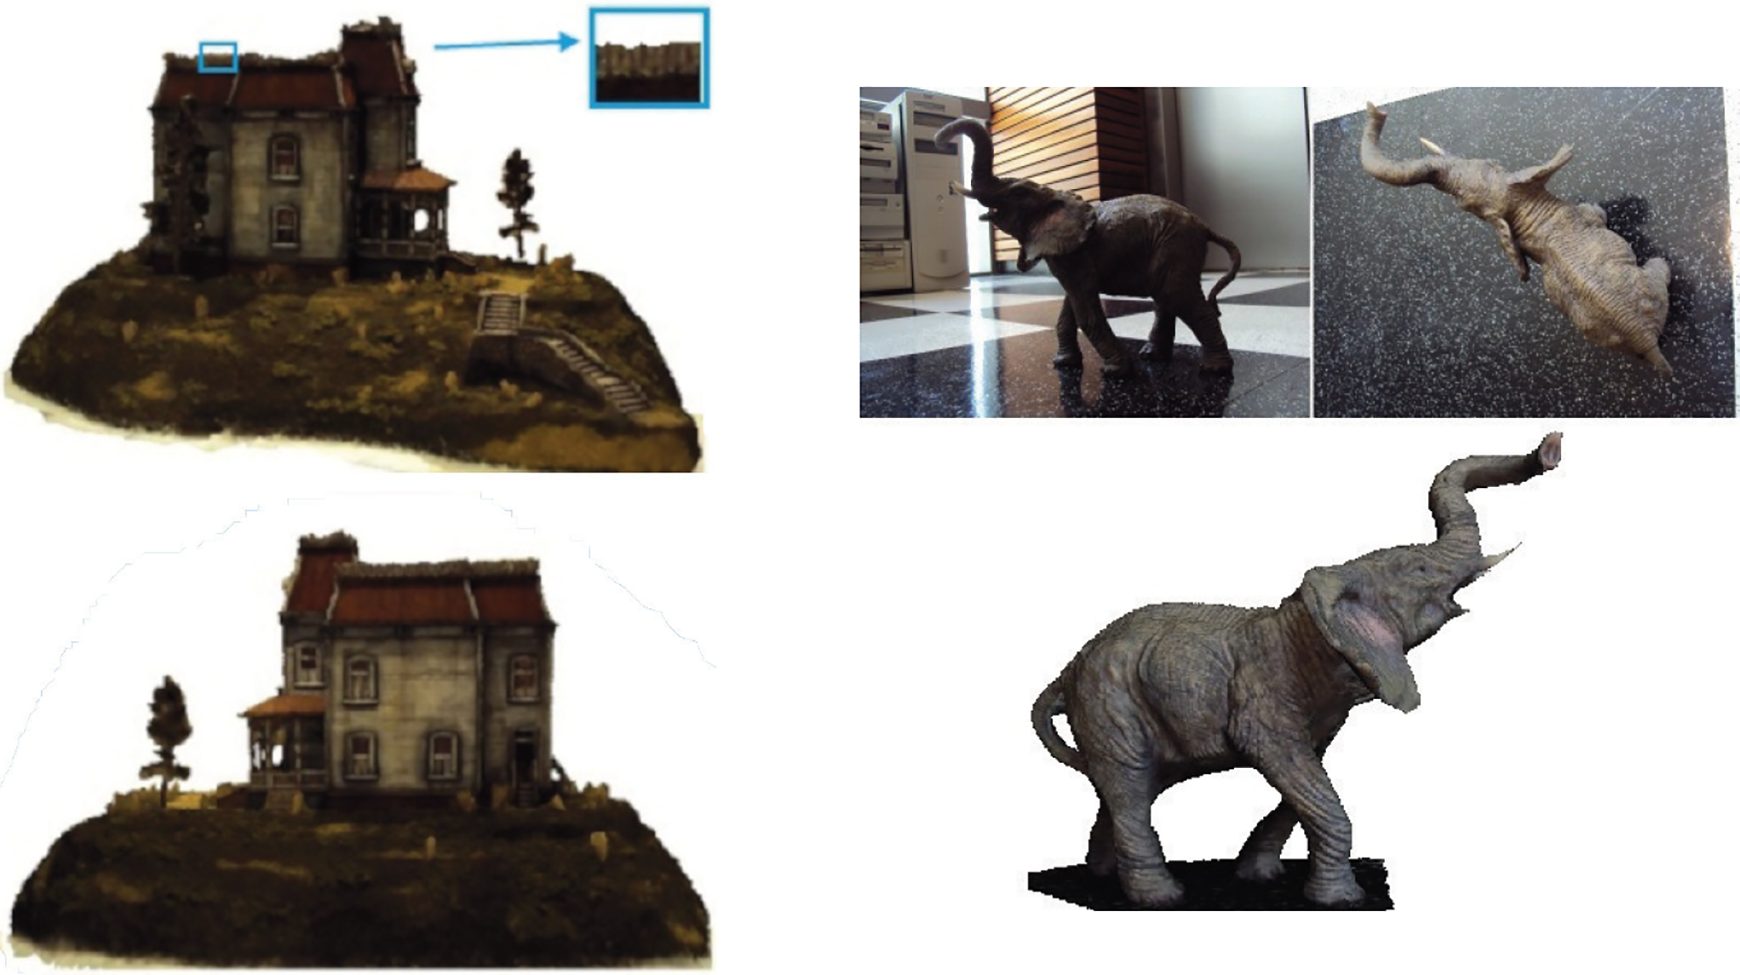
3-D models generated with the use of photos. 13 3-D: three-dimensional.

3-D model of building frontage. 14 3-D: three-dimensional.

3-D model of mountains. 14 3-D: three-dimensional.
If we need to create a 3-D model of the outer environment, stable, terrestrial laser scanners can be used to measure the space around the scanner and then programmatically create a virtual model of the scanned space. 15 The virtual model can then be used for a variety of purposes—for example, to measure the size of the objects being scanned in the model or to observe the interrelationships between the objects. If structures and installations alongside the track intersect into the area in which the vehicles are moving, there is a risk of collisions of vehicles with these objects with possible damage to vehicles and off-road objects or injury to passengers. Some off-road objects may hinder the driver’s view and the virtual model will help to discover them. 16,17
One of the systems which utilizes the measurement and analysis of the ground plan for the navigation is the system Voyage II (see Figure 5) proposed by Zhang et al. 18 Authors dealt with 2-D SLAM which has been used to calculate the optimal trajectory of the robotic system. The dimensions of the surrounding space were captured by LiDAR VLP-16, inertial measurement unit, 19,20 Navigation Satellite Timing And Ranging Global Positioning System (NAVSTAR GPS), and encoders placed on motors. Adaptive Monte Carlo localization has been used to navigate the robot in the obtained map. In outdoor environment, the readings from GPS were used to navigate the robot.
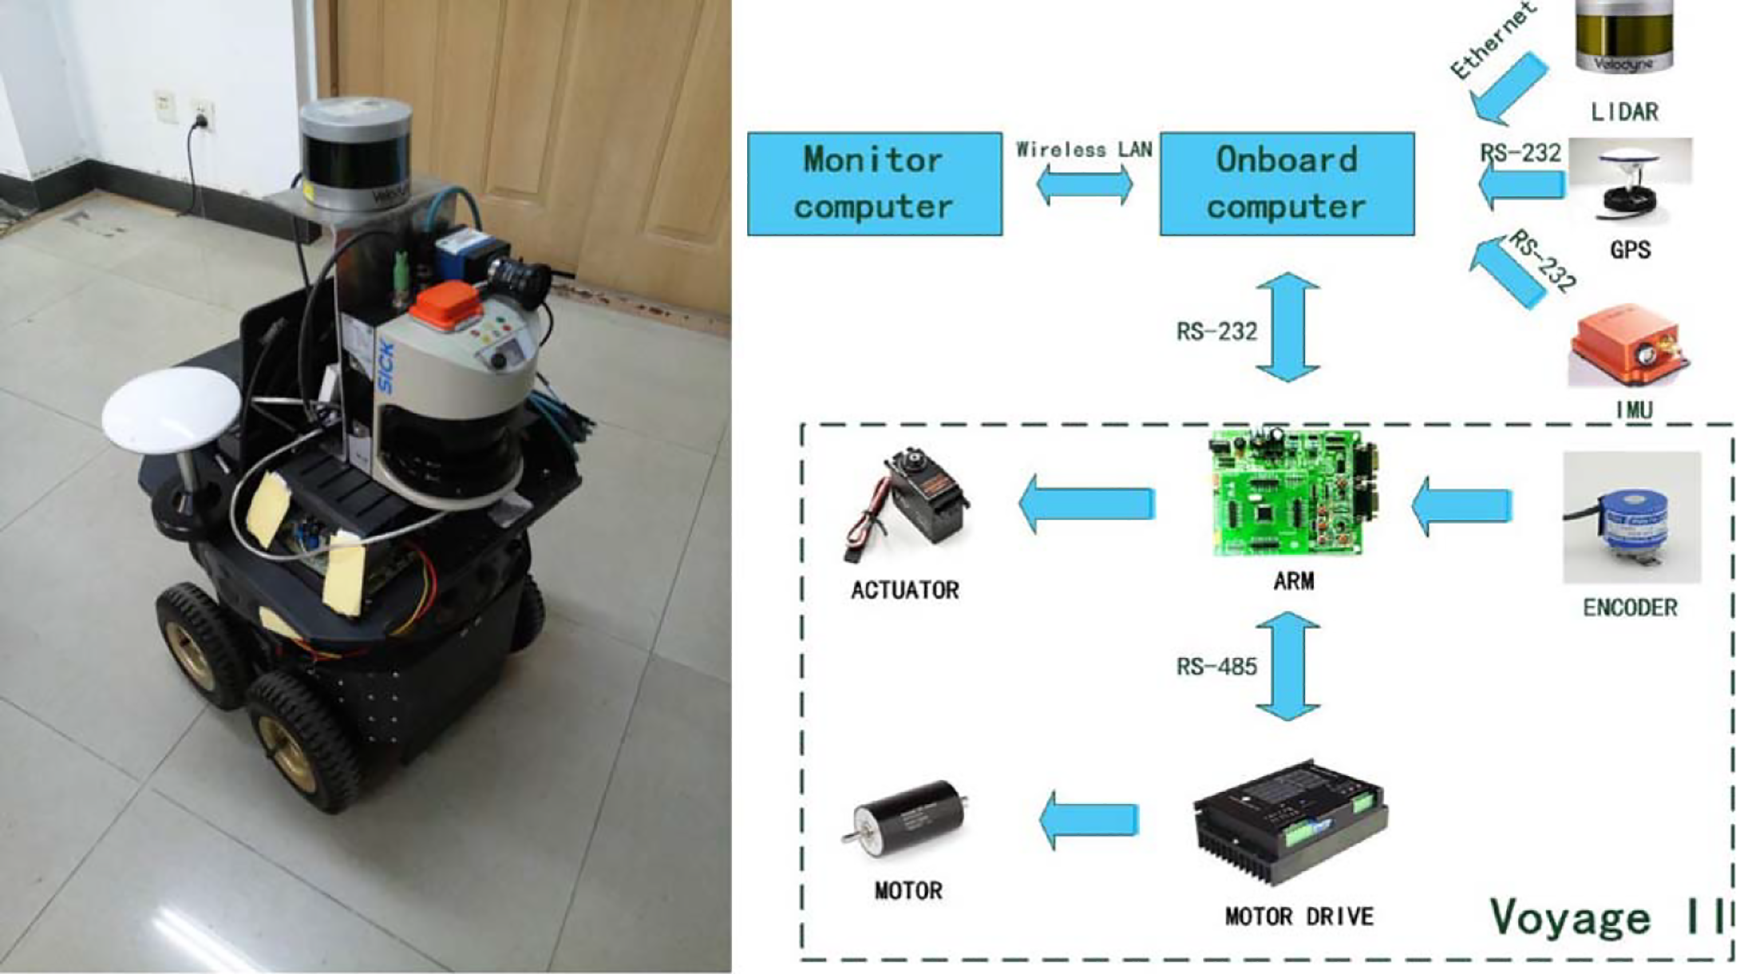
Robotic system Voyage II (left), block diagram (right). 18
This work proposes a design of an automated system for capturing the 3-D model of the environment including its texture. The method of capturing the 3-D model of the environment is based on 2-D scanner with an aid of the designed supplementary hardware. Resultant 3-D model can be used for various purposes such as navigation along precomputed trajectory, 21,22 searching for collisions between the moving objects and the environment, searching for defects on the surface of the objects, object classification, and so on, which is not the objective of this article.
The method for creation of 3-D model
The algorithm is based on scanning and camera data acquisition. After converting the data from the scanner, we obtain the 3-D model of the environment as a cloud of points. By fusing these data and data from the cameras, we get a 3-D model with the texture corresponding to the environment. The created model can then be used for space navigation or virtual space exploration.
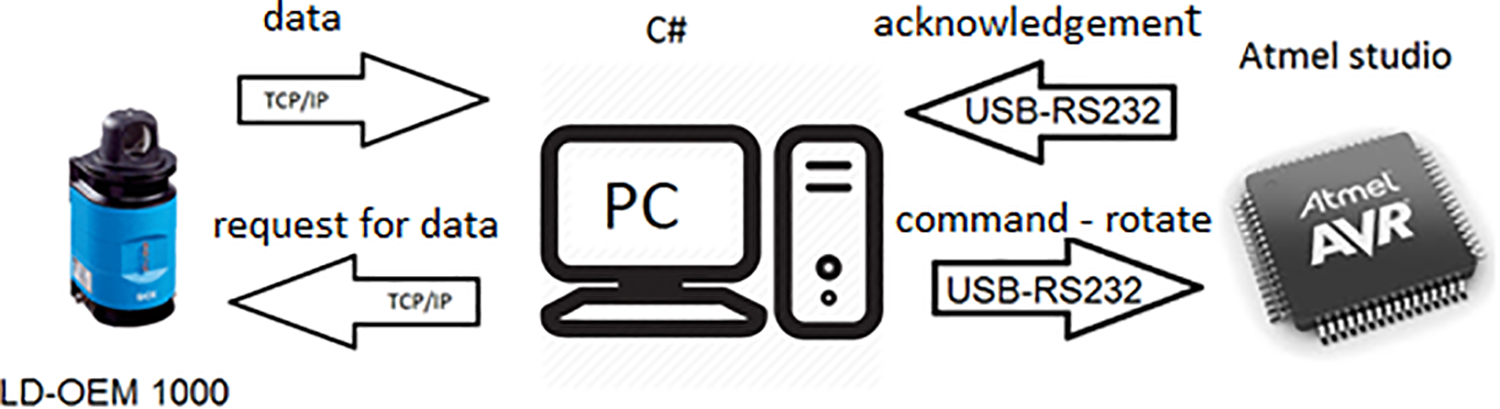
The hardware (HW) solution (Figure 6) is based on using laser scanner LD-OEM 1000 manufactured by the SICK company (SICK AG, Waldkirch, Deutschland). This laser scanner is rotated using rotating platform with the stepper motor Vexta.

HW implementation—testing in the laboratory.
Our laser scanner LD-OEM 1000 can scan 360° space in one axis. This scanner is used either to perform localization or to map space during movement. In order to create a system that resembles a terrestrial scanner using a 2-D scanner, we need to ensure that it rotates around another axis. This approach is used in the literature. 7,23 The LD-OEM 1000 laser scanner used in our system scans the space in the vertical axis. By placing it on a templet that is rotated by the engine around the horizontal axis, we have reached the condition of rotation around another axis. The principle of scanning the space is that the scanner performs a vertical scan, and when finished, the motor rotates the scanner around the axis of measurement by the specified angle. It scans and turns again until all the desired values are found. The engine is controlled by a microprocessor. The important thing is to maintain the correct sequence of commands and not to get a bad measurement or suffer loss of data. The 3-D modeling system consists of two basic subroutines. The first controls the engine, and the second the scanner. A block diagram of communication is shown in Figure 7.
The solution suggestion.
The role of the first subprogram is to ensure operation of the motor that rotates the scanner based on the received data processing information from the scanner. We used the Vexta PK 566 stepper motor with a 20:1 gearbox to rotate the scanner pad. The motor itself has 0.72° per 1 step and a nominal current draw of 1.4A. It is a five-phase stepper motor driven by a driver. Engine management makes it easier to use the driver. Motor control is implemented using 5 V pulses. For one-way rotation, we send impulses to the connector labeled clockwise (CW). For rotation to the counter, we send the same pulse to the counterclockwise (CCW) connector. Motor control is provided by alf and vegard’s RISC processor (AVR) Atmega 128P (Atmel®AVR®) microcomputer, which is programmed in Atmel Studio 7.
One of the basic functions that the AVR Atmega 128P performs is counting the number of pulses sent to the driver. This number must not exceed 5000. This requirement is set to prevent the engine from turning over 360°. The second subroutine has the role of managing scanning by scanning itself to store and process data.
Figure 8 shows an example of the graphical user interface (GUI). The program is divided into two main parts. The first part, called “Engine,” serves to communicate with the AVR. The following parameters are set: the required angle in degrees and the communication interface. Using the “Calculation” button, appropriate measuring angles are calculated from the appropriate measuring angles. This action is necessary because the engine can only take whole steps. If the user specified that the measurement is to be performed at every 6°, it would be calculated that we need 166.667 steps for the measurement. Since the engine cannot execute 0.667 steps, the program picks up the specified value and provides the five closest appropriate angles to the user. These will appear in the drop-down list named “Possible angles.”

Example of the GUI.
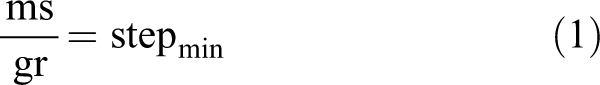
The calculation of these angles is as follows. We take into account the 360° measurement range (measured area ma = 360°), the engine has one step defined 0.72° (motor step ms = 0.72°), and a gear ratio of 20:1 (gear ratio gr = 20) is used. The resulting minimum angle is
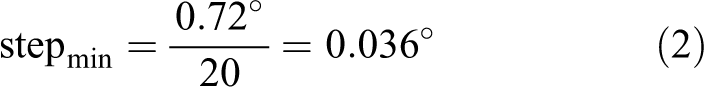
For a 360° measurement, with a minimum step of 0.036°, it is 10,000 steps per turn:

So when we want 6° measurement (actual measurement am = 6°), we need a certain number of steps

The program takes only the integer part (166) and multiplies it by 0.036° (
Scanning of the space requires scanner data. The scanner is in the transmission control pprotocol/internet protocol (TCP/IP) server mode. Upon acceptance of the scanning request, the scanner will send us scan space data. Here follows a sample of such data for a 72° measurement:
“
From the analysis of multiple measurements and data in the manual of the laser scanner, the following description of the received packet was determined:
Data part (31 Bytes).
A port of the data area in which encoded measured lengths are stored.
2th-4th measurement
End of data part.
The principle of calculating the basic parameters that are required for the calculation of the point cloud is as follows.
Calculation of angular resolution and initial angle (in degrees) is implemented in the following way. Angle and initial angle values are transmitted in their hexadecimal form (e.g.

The measured distances are stored in the packet behind initial angle and the size of each measured value is two bytes. The value of each measured distance is transmitted in its hexadecimal form (e.g.

After the measured data are converted and processed, the cloud of points is calculated.
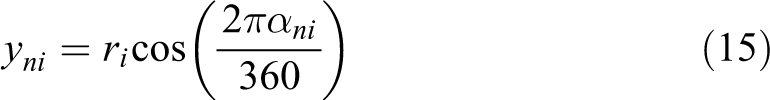
The mathematical equations for calculating the cloud of points are based on the parametric equations of the circle. Parametric equations of the circle serve to calculate the x, y of the coordinates of the point of interest (Figure 9), given by the radius (r) and angle (α).

Coordinates of a point on a circle.
The x coordinate of the point is equal to the multiple of the angle (α) of the cosine and the radius (r). The y coordinate of the point is equal to the multiple of the sine of the angle (α) and the radius (r).
The parametric circle equations for calculating one point on a circle are


The laser scanner provides data of the measured points using the initial angle (α0), the number of measured points, the angle difference between the individual points (Δα), and the distance between the laser scanner and the measured points (r). To calculate the ith point’s coordinates, the parametric equations of the circle need to be adjusted.
The angle α is given by the sum of the constant, expressing the mechanical rotation of the laser scanner, the initial angle, and the multiplicity of the sequence number of the point and the angular difference.
Based on the number of points measured, the recirculation of the calculation cycle is set. The calculation is repeated as many times as there are measured points. The reference number of the measured point is incremented in each calculation cycle.
The adjusted parametric circle equations for calculating the ith measured point are


where the variables of the parametric equations have the following meanings:
xi
and yi
are the coordinates of the ith measured point. α0 is the value of the initial angle in degrees.
i is the serial number of the currently calculated point. Δα is the value of the angular increment (increment) in degrees.
ri
is the value of the ith point distance from the laser scanner. Value “90” represented angular rotation (90°) of laser scanner.
These equations give us a 2-D cross-section of the space in the form of a point cloud. They are used for linear measurement of the space during constant motion. To calculate a 3-D model for a system that mimics the terrestrial scanner, the equation needs to be extended by incremental rotation of the scanner after each measurement.
The input variables of the proposed method are as follows: The angle of rotation of the measuring device The angle of the measured point αi. The measured distance ri.
The first part at each cycle step is the auxiliary calculation of angles, where the angle of rotation of the laser scanner head is added to the angle of rotation of the measuring unit


The following part is the calculation of points with the application of the shift at each angle


The results of the simulation of the measured model can be seen at a 0° angle (Figure 10) and at a 45° angle (Figure 11).

Draft view, side view, plan view—simulation for angles of rotation

Draft view, side view, plan view—simulation for angles of rotation
After creating a cloud of points from the measured space, the texture is created and applied. To create the texture, we have designed a method based on adaptive data selection. We had to take into account the speed of camera’s movement, the distance of the recorded objects from the camera to calculate the camera’s amplitude, and also the frames per second (fps) of the camera used (the number of images recorded per second). Taking into account all the design factors, we expected the output of this formula to be the number and width of the video image to be selected and used in the panorama.
Parameters of the LG G3 camera are as follows: a 13 megapixel camera with laser focus; we can choose from multiple resolutions for recording video, namely, slow motion, where the camera records 120 fps, and we also have the HD-1280 × 720/FullHD-1920 × 1080/UltraHD-3840 × 2160 resolution. With these resolutions, the camera records with 30 fps. We used the FullHD resolution of 1920 × 1080 pixels at 30 fps.
From these values, we can then calculate the required image width (iw) as follows
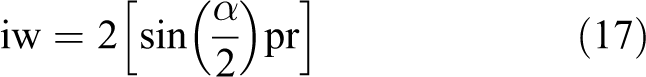
The prone (pr) is calculated as (see Figure 12)
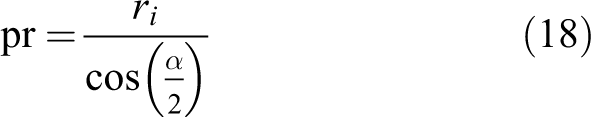

Scanning of picture information in motion.
The resulting equation is

Furthermore, we will use with these values to calculate the dimensions of other images from the video. In this calculation, we also have to include the camera’s velocity of motion in meters per second (v) from which we get the distance per second. We divide this value by the width of the camera’s image and then we get a number that gives us the frequency of selecting images (
The resulting formula for the calculation is determined as follows

In this method, we have many parts of the images, and the resultant panorama was created from several smaller pictures that are more accurately linked. This method was at first tested in the laboratory (Figure 13) and then an outdoor experiment has been performed.

Result of testing in the laboratory.
Practical measurement and testing
As an output format, we chose .obj format. This format is suitable for viewing objects in the 3-D space. The advantage of the .obj format is also in its compatibility with multiple display software. The internal structure of the .obj file format is freely available and data storage is very easy to algorithm processing. The inner structure is determined by at least the top of the edges of the objects. Other parameters are the edges of objects or the points and edges of the texture applied to the objects.
The object of the scanning was the AB210 room, located at the Department of Control and Information Systems at the Faculty of Electrical Engineering and Information Technology, University of Žilina. This measurement was performed with a scanning resolution of 0.25° scanner and an engine shift of 0.108°. The scanner was not placed in the center of the room during scanning to show the difference when measuring close and distant objects. Non-dotted areas represent the areas where the scanner did not scan. It is due to the shading caused by some object (such as desk, cabinet, etc.). Figure 14 shows photo and resulting 3-D models of the scanned areas.
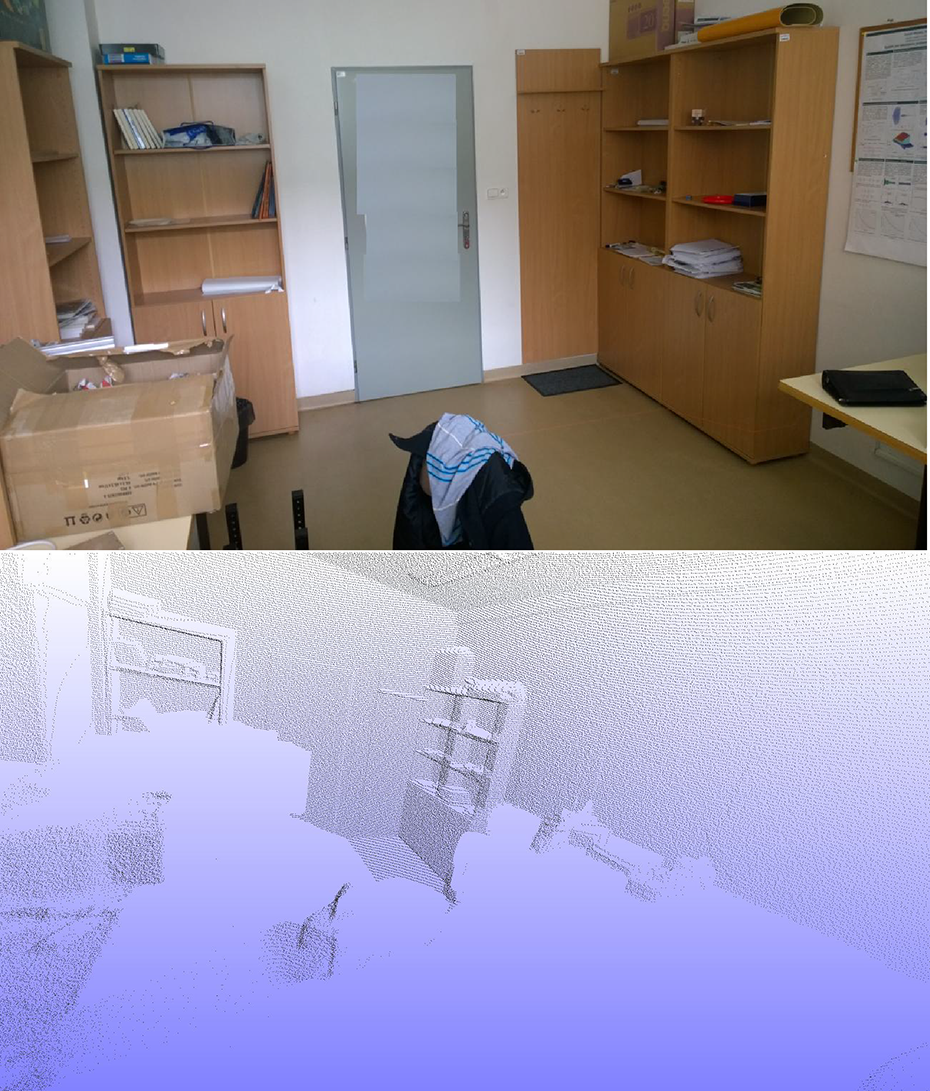
Real photo of the scanned space, preview of the resulting 3-D model. 3-D: three-dimensional.
The algorithm was practically tested on the test object (Figure 15).

Photo from the practical testing.
From this measurement, a texture and a 3-D model were created in the form of a cloud of points. The texture was applied to the model (Figure 16) which created the resulting 3-D model with the corresponding texture (Figure 17).

Texture of 3-D object. 3-D: three-dimensional.

The final 3-D model with the appropriate texture. 3-D: three-dimensional.
Conclusion
In this article, we have proposed a method for the measurement of a full 3-D model of the environment including its visual texture. The method merges two sets of data into a single fused result. First, the algorithm processes data from a 2-D laser scanner mounted at the top of a rotational platform driven by a stepper motor. The output of the laser scanner (the 2-D profile in polar coordinates) with the rotational angle of the platform is converted into a 3-D cloud of points. Then, the image captured by a camera is transformed into a texture, which is applied to the obtained 3-D model.
The obtained 3-D model of the real environment can be used for various purposes in robotics, reconstruction of buildings, historical documentation, or in providing virtual reality, which is especially suitable in dangerous areas where humans would be exposed to excessive danger, but they can control a robot remotely while its movement can be visualized inside a textured 3-D model. The main advantage of our method is its simplicity (360° of view during one scan without the need to change the position of the scanner) and its high precision (the error of the measured position is in the order of millimeters for indoor applications).
There are many applications which use captured 3-D models of the real objects. Besides the navigation of the robotic system in real environment and visualization of its movement, the 3-D model can be used for searching for collisions between moving objects in the environment; searching for defects on the surface of the objects; classification of the objects by their shape; and others.
Main advantage of the proposed solution compared to the commercially available terrestrial scanners is the structure of the output 3-D model of the object. The most important difference is that many terrestrial scanners provide the model as a cloud of colored points, while our system provides the model composed of surfaces with applied texture. This difference is significant at closer scale when the model becomes easily readable and contains more information. This increases its usability in mentioned applications.
Footnotes
Declaration of conflicting interests
The author(s) declared no potential conflicts of interest with respect to the research, authorship, and/or publication of this article.
Funding
The author(s) disclosed receipt of the following financial support for the research, authorship, and/or publication of this article: This work was supported by APVV-17-0014 from Slovak Research and Development Agency.