
Abstract
Correct cognition of the environment is the premise of mobile robots to realize autonomous navigation control tasks. The inconsistency caused by time-varying environmental information is a bottleneck for the development and application of cognitive environment technologies. In this article, we propose an environmental cognition method that uses a hand-drawn map. Firstly, we use the single skeleton refinement and fuzzy c-means algorithms to segment the image. Then, we select candidate regions combining the saliency map. At the same time, we use the superpixels straddling method to filter the windows. The final candidate object regions are obtained based on a fusion of saliency segmentation and superpixels clustering. Based on the above objectness estimation results, we use a human–computer interaction method to construct an inaccurate hand-drawn environment map for navigation. The experimental results from PASCAL VOC2007 validate the efficacy of the proposed objectness measure method, where our result of 41.2% on mean average precision is the best of the tested methods. Furthermore, the experimental results of robot navigation in the actual scene also verified the effectiveness of the proposed approach.
Introduction
Environmental mapping and path planning are essential problems in the robot research field, and several solutions have been presented in recent decades. 1 –7 In these methods, mobile robots depend mainly on metric maps, topological maps, hybrid maps, and so on to complete navigation tasks. Although the existing approaches or composed methods have been demonstrated to be efficient and accurate, they mostly rely on two primary assumptions: a precise map of the scenario is available beforehand and the environment is static.
In some applications, such as robots operating in the real-world environments, the challenge of adapting to variable working environmental conditions has come to the forefront. Conventional static map-based approaches fail in such applications. More significantly, there are many circumstances in which robots have no way to create a map in advance for a new environmental condition. Examples include rescue scenarios and environments which are potentially harmful to humans. To overcome these difficulties, researchers have attempted to present a series of robust methods for dynamic environments. 8 –10 However, most of these methods require careful model update strategies, and the algorithms do not perform particularly well when sudden changes occur. On the other hand, several techniques use hand-drawn maps and sketches to provide a rough description of the environment. 11 –13 While these techniques seem convenient, they still have shortcomings such as their reliance on manually designed road signs, insufficient computational rates, and limited mapping capability to transfer data between hand-drawn maps and actual maps.
In this article, we present an approach to all these issues using a navigation method based on a hand-drawn map and an objectness measure approach. Inspired by the way humans ask for directions in unfamiliar environments, our process involves the initial specification of ordinary objects in the environment based on data from users, as well as a rough path for movement of the robot, which then needs to locate itself by detecting and recognizing specific objects. Generic object detection and recognition have been extensively studied over the decades, and numerous methods have been proposed based on hand-designed features such as HOG,
14
LBP,
15
and SIFT
16
. Recently, many deep learning-based approaches, such as Fast R-CNN,
17
Faster R-CNN,
18
and YOLO,
19
achieved auspicious performance. However, both traditional and CNN-based approaches require manual effort for feature coding and clustering. The difference is that since a convolutional neural network contains more layers of simple and complex cells, the CNN-based methods have more powerful abilities to characterize images. However, the navigation environment has only a limited amount of data, and conventional embedded robot platforms do not have the computational resources required for deep learning. For these reasons, we mainly focus on the problem of robust visual navigation, and the proposed method is distinct from the traditional methods of detecting and recognizing objects in the entire image. We offer an objectness measure of image windows based on color and superpixel features. Feature extraction and matching are performed only on the regions suspected to contain objects, which improve computational efficiency dramatically. After self-positioning through object recognition, the robot follows a path that is planned based on the hand-drawn map information, such as the position and direction provided by the user. It then completes navigation using an obstacle avoidance algorithm. This new navigation method has the following advantages: The robot does not require precise distance information regarding its operating environment. It only requires the user to provide several semantic object symbols and approximate distance ratios. The user can roughly outline the relative position of the objects in an easily accessible map for navigation. It is consistent with human cognitive habits by using landmarks and qualitative path guidance to extract the navigation information.
In particular, this article makes the following two main contributions: We propose a novel objectness measure method which uses image segmentation and superpixel analysis simultaneously. The process can further reduce the computational cost of the object detection stage. We propose a new navigation method based on a hand-drawn map, which is composed of specific objects and a rough path.
Based on this, the robot can operate quickly in an unfamiliar or changing environment and does not require precise distance information. It only requires the user to provide several semantic object symbols and approximate distance ratios.
As a whole, our work mainly focuses on a robot navigation method based on hand-drawn maps. We begin by describing the objectness measure algorithm, which is based on a combination of color and superpixel features. Based on the objectness measure results, we propose a human–computer interaction navigation method and verify its performance through a series of robot navigation experiments.
Our approach
In this section, we first introduce our objectness measure algorithm, which quantifies how likely it is for an image window to contain an object of any class. Then, we recognize the specific objects in those windows. Finally, according to the landmark objects and the rough path provided by the users, we discuss the navigation method based on a hand-drawn map.
Objectness measure algorithm
Color contrast and saliency map
Color information plays an essential role in object recognition applications. In many cases, an object has a different color than the environment around it. In the field of visual attention research, color information is also widely used as a fundamental and distinctive feature.
In this article, we use the central-ambient contrast saliency calculation method 20 to obtain the saliency map, which contains the location information of an area. The different gray values of the saliency map represent the specificity of the color contrast near an actual scene image. The proposed image segmentation algorithm is used to combine single skeleton refinement and fuzzy c-means (FCM) image segmentation. Finally, we merge the image segmentation results with the saliency map. The flowchart is shown in Figure 1.

Outline of the CCS. CCS: color contrast and saliency.
The CCS method first uses the L0 norm algorithm 21 to smooth the input image and then to calculate the gradient image for each color channel of an RGB image. Next, we use the morphological reconstruction technique to mark the foreground objects and the background objects, and the three-channel gradient amplitude image is synthesized to ensure that only the foreground and background marked pixels have local minima. Finally, the image is coarsely segmented using a single refinement of the skeleton extraction method, 22 which can partly overcome shortcomings of traditional methods such as over- and under-segmentation.
After the above preprocessing steps, a subset of n pixels based on the skeleton data can be obtained. These pixels have consistency in the color feature space. Since n is much smaller than the number N of original image pixels, the speed of fuzzy clustering for these subsets will be much greater than grouping N pixels of an original image. Due to the morphological optimization step, over-segmentation will be significantly restrained, but there will still be some over-segmentation, and the over-segmented regions still need to be merged to achieve a better effect.
In our approach, we combine the regions with less than 5% of the partition area and calculate the color features of each part. After that, we use the improved FCM algorithm
23
to merge regions and obtain the final segmentation map. Finally, considering the segmentation map results and the previously obtained scene saliency map, we set the threshold
Superpixel clustering and straddling
A superpixel is a group of connected pixels with similar color or gray levels. The segmentation of superpixels refers to dividing an image into hundreds of nonoverlapping superpixels. With further image processing tools applied to segmented superpixels, we can compute features on more specific image areas, and this reduces the input entities for the subsequent image processing algorithms.
In this article, we use the simple linear iterative clustering (SLIC) method 24 to segment the image. Although it is computationally fast and works well, the SLIC method only takes the color and coordinates of each pixel as a feature. If the segmentation boundaries are not clear enough, the objects contained in the boundaries will not be well-preserved. Considering these conditions, we use the GPU-accelerated algorithm for density-based clustering (G-DBSCAN) 25 to optimize and accelerate superpixel segmentation. Compared to other clustering algorithms, G-DBSCAN is fast and also has the advantage of being insensitive to noise without needing the number of clusters in advance. Then we use the superpixel straddling-based method to obtain the final result. The overall algorithm flow is shown in Figure 2.

Outline of the SCS. SCS: superpixel clustering and straddling.
In the above algorithm, we realize that performing object detection at multiple scales can improve accuracy. 26 We first use a graph-based image segmentation algorithm to segment the image into N regions. Then, the similarity between each part and its neighboring regions is calculated, and the two regions corresponding to the maximum similarity value are combined. Since the size of an actual object in the image should be within a certain range, a preliminary screening is performed using the combined area of the window region to eliminate unlikely candidate windows. The above process is repeated until all areas are merged into the same area. Finally, a series of candidate windows are generated for further evaluation. The algorithm is shown in Algorithm 1.
Hierarchical grouping-based method.


After evaluating a series of candidate windows L, we use equation (1) to calculate the score
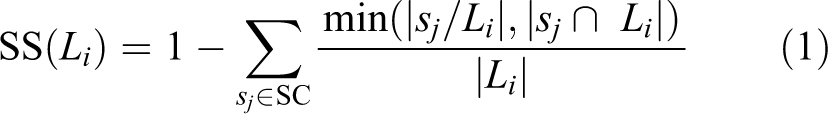
In equation (1), Li
is a candidate detection window generated by the hierarchical grouping-based method, sj
stands for a superpixel, and SC denotes the superpixel collection. For each candidate window, we compute the spatial relationship of the window with all superpixels. Among them,
Navigation in hand-drawn maps
Inaccurate environment map construction
Most robot navigation systems provide environmental maps to guide the robot, such as metric maps, topological maps, or hybrid maps. Considering the limitation of these kinds of plans, we propose a hand-drawn map-building approach to guide the robot, inspired by the way humans ask for directions in a new place. The following describes the map creation process using the actual scene of a robot lab room as an example.
The experimental scene is shown in Figure 3. The upper left corner is the floor plan of the scene, and the rest are actual photos. The size of the indoor stage is approximately 13 × 18 m2. The initial position of the robot is near the left door in room A, and the target area is the right door in room B. In this environment, there are objects such as tables, humidifiers on the table, benches, robots, air conditioners, tool boxes, trash cans, and cabinets. If the robot wants to reach the right door from the left door, it needs to move around the table with the humidifier, pass by the robot and the toolbox, go through the walkway beside the test bench to the right, bypass the trash can, and then move behind the lab bench. The hand-drawn map formed based on the above information is a sketch of the environment. The position, path, and orientation of the hand-drawn map are all inaccurate, but the relative locations of landmarks follow the actual scene.

Experimental scene sketch and photographs.
Based on the above analysis, we developed an interactive application, as shown in Figure 4. The user needs first to take photos of the principal objects in the scene and then categorize them for use by image processing programs such as subsequent feature extraction and model training. During the actual operation, we obtained multi-angle images of each target object from different distances (0.5–3 m).

Human–computer interaction mapping interface.
As the program runs, the system automatically loads all the folder names in the path (corresponding to each semantic object, each folder contains multiple corresponding entity images). The user needs to click the Add button to add the objects and drag them to their relevant location areas. The program will then open a dialog popup box for setting the approximate distance. Finally, a user can use the mouse to complete the corresponding hand-drawn path sketch. In the experimental environment, we hand-sketched a map following the above steps, as shown in Figure 4. The rectangular boxes in the figure indicate the relative positions of the landmarks. The curve represents an approximate route that the robot could follow to reach the target area. The semantic text in the rectangular box corresponds to multiple images in the database, and more detailed classification criteria can be developed according to actual scene requirements. After the sketched map is completed, the system automatically converts the sketch into an inaccurate map, which contains the sequence order, relative position, and approximate distance between each landmark.
Since the map is inaccurate, it only can play a guiding role for the robot. Therefore, in actual operation, the path is divided into multiple path sections, so that the robot needs to consider only the routes between adjacent guiding points. We use distance measuring sensors to provide longitudinal distance information of objects and obstacles. Directional control of the robot is achieved by combining the horizontal coordinate relationships of the matched local descriptors.
Recognition of landmarks and robot navigation
Traditional target recognition methods generally rely on image segmentation techniques, which use artificially defined classifiers to perform feature matching on a series of sliding windows. This approach requires a lot of computational resources. Therefore, the subsequent detection system can only select weak features and classifiers to improve the execution efficiency. The breakthrough of the proposed method is that it reduces the number of sliding windows: The objectness technique can significantly reduce the number of candidate windows that need to be evaluated. Ideally, there is a one-to-one correspondence between real objects and the objectness windows in any given image. In actual situations, one possibility is that some objects are not detected, and this failure causes subsequent target recognition to be difficult. Another possibility is that objects are detected, but there is a large number of redundant windows, which will affect the overall algorithm performance.
The objectness technique proposed in this article considers both color and superpixel features. Among them, the CCS method utilizes the color information and combines with saliency maps to find more accurate windows. However, when the object color contrast is insufficient, the algorithm often fails. The performance of the SCS method mainly depends on the effectiveness of superpixel segmentation. In general, for small target objects, the performance is often unsatisfactory. The CCS and SCS approaches are independent, and each has its advantages and disadvantages. Besides considering these as preprocessing step options, it is necessary to ensure that all object areas are detected. Under this premise, even if there are a few invalid non-object window regions, they can be filtered out in the subsequent object recognition process. Therefore, the output of the final objectness windows for the CCS and SCS is the union of the corresponding outputs of the two techniques.
The specific algorithm flow includes the following details: First, the objectness measure algorithm is used to extract all regions that may contain objects in the image. Then, an optimized bag-of-words (BoW) model 27 is used to determine the object categories in those regions. When a target object is identified, navigation is performed based on the positional relationship between the features of the target object and the features of a possible matching object in the database. The robot contains three kinds of action states, including turn left, turn right, and go straight. The robot navigation strategy is based on the coordinate relationship shown in Figure 5.
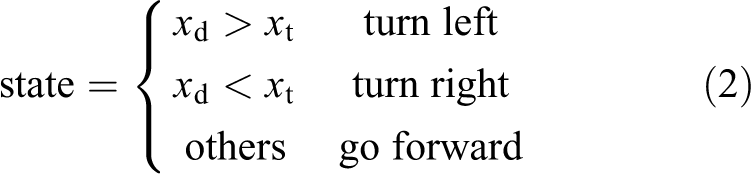
where xt and xd represent the horizontal coordinate of the RootSIFT local descriptor 28 of the current target object and the horizontal coordinate in the target database. The dividing line divides the image equally. The abscissa on the left side of the dividing line is less than 0. Correspondingly, the abscissa on the right side is greater than 0. The robot will continue forward at the same speed, and the turn radius is proportional to the coordinate difference of the local feature descriptors.

Robot motion strategy selection. (a) turn left, (b) go straight, and (c) turn right.
Experimental evaluation
System structure of the experimental robot
The experimental system adopts the DaNI robot hardware platform. The bottom layer of the platform uses the NI sbRIO-9632 embedded controller to collect ultrasonic sensor and encoder signals and perform motion control. A Gigabit Ethernet camera and a laser sensor are also installed on the platform. The upper computer, a Lenovo Y7000, is responsible for monitoring and data processing, and the data are transferred through a CISCO Router in bridging mode.
The system software follows a typical client–server architecture. The PC is responsible for the creation of interactive maps, image processing, and real-time display of movement status. The role of the embedded controller is to collect sensor data (including image information) and send them to the PC wirelessly. The embedded controller also receives control commands from the PC and sends them to the motor drive unit. We used the LabVIEW 2016 Robotics and Vision modules to realize the communication, motion control, and visual acquisition functions. The image processing functions were developed in the Visual Studio 2015 environment. Figure 6 depicts the physical map of the robot and the information transfer relationship.

DaNI robot system structure.
Experimental results
To test the image processing and navigation algorithm, we conducted a series of experiments in a robot lab room (seen in Figure 3). We manually set the start and end points of the robot motion and sketched a reference map, as shown in Figure 4. This series of experiments verified the adequacy of the model. Experiment 1 was mainly used to evaluate the performance of the objectness measure, while experiments 2–4 analyzed the effect of the navigation algorithm when the environment changes.
Experiment 1
Before starting the robot navigation experiment, we first verified the performance of the environmental sampling preprocessing algorithm in the published PASCAL VOC 2007 object image data set. The data set includes 9963 images with a total of 24,640 labeled objects, which can be used for quantitative comparison.
To compare the recognition accuracy, we chose the following set of methods: the DNNs-based method, 29 the CNNs-based method WSL, 30 and the weakly supervised method WSDDN. 31 The results are shown in Table 1.
Different methods on VOC2007 recognition accuracy results.

Bold entries represent the best result for the category.
According to the results, our method can improve the detection efficiency effectively due to the utility of the objectness measure. Our approach achieved the highest recognition accuracy results for the nine types of objects. The average recognition accuracy rate was 41.2%, which was the best among the methods tested. It is worth noting that, compared with the comparison method, we only use the common BoW model framework. Therefore, the experimental results fully verified the effectiveness of objectness on the performance improvement of the recognition results.
Experiment 2
When sketching a hand-drawn map, we intentionally changed the targets’ position and the shape of the guide line to confirm the performance of the navigation algorithm. The results of the experiment are shown in Figure 7, where • and ◎ denote the starting and end positions of the robot, respectively. The symbol ★ represents a landmark, the black line is the manual guideline, and the dashed line represents the actual trajectory of the robot.

Result for the change of referenced objects location or hand-drawn sketch map. (a) and (b) have the same guiding-line, but the positions of the landmarks are different, (c) and (d) have their independent guide-line and landmark locations.
According to the experimental results, the robot completed the navigation task in these four experiments correctly. When changing the artificial drawing path, the actual running trend of the robot will adjust accordingly. When the critical target position is changed within a certain range, the robot can tolerate some errors and is not affected. If the relative position information of each target is not changed, the robot can still correctly move to the end point in combination with the guidance given by the artificially provided walking path.
Experiment 3
This experiment explored the effects of different numbers of landmarks, as well as the location of the targets for robot navigation. We observed the actual operation of the robot by changing the number of objects. Figure 8 shows the results of four navigation experiments, where Figure 8(a) contains eight targets, Figure 8(b) has six targets, Figure 8(c) has four targets, and Figure 8(d) also has four targets but in different positions from Figure 8(c).

Result for different numbers of referenced object. (a) contains eight landmarks, (b) contains six landmarks, (c) contains four landmarks and (d) contains four landmarks but not evenly laid.
According to these results, the location and number of landmarks have a significant influence on navigation. In the first case, if the experimental room size is not large, even if the number of landmarks is reduced from 8 to 4 (as shown in Figure 8(c)), to make sure the robot cannot directly observe the next landmark position. The robot needs to rely on the odometer to locate and navigate according to the guidance of the hand-drawn path to complete the navigational task. In the second case, if the robot is in a larger environment and the number of targets is small with an uneven distribution (Figure 8(d)), once the landmark information is lost, the robot cannot complete the navigation task despite the guidance of the odometer and the manual path provided.
Experiment 4
To further verify the robustness of the proposed algorithm, we consider the impact of landmark categories and obstacles on navigation results. The experimental results are shown in Figure 9, where Figure 9(a) contains eight key targets, including three same objects (indicated by ♦). Correspondingly, the same objects in Figure 9(b) are arranged in sequence. Figure 9(c) and (d) shows the presence of static (indicated by ━) and pedestrian walking as dynamic obstacles (indicated by ▴, the arrow indicates movement direction), with a speed of 0.4 m/s.

Results of the same object outline or the presence of obstacles. (a) contains eight landmarks, including three same objects, (b) contains eight landmarks, including three same ones which are arranged in sequence, (c) and (d) show the navigation effects in the presence of static and dynamic obstacles.
According to the results, when there are multiple landmarks of the same category in the environment, the order in which the robot encounters them does not affect the navigation results. The reason is mainly due to the supporting role of hand-drawn paths. The robot only pays attention to the nearest guidance points. Therefore, even if there are some of the same objects, if the distance sensor is used to provide the approximate distance information of the object, correct navigation can be carried out using the matched coordinates for the local descriptors from the image recognition output.
When the robot detects an obstacle, the system first records the original direction of the movement and the relative positions of the next key target relative to the current object (determining the rotation direction in cases where the robot avoids obstacles). Then, it executes the obstacle avoidance process while detecting the location of the target. In the experiments, dynamic obstacles were also added to test the experimental results. On the left side of the first dynamic obstacle, the robot smoothly passes by and continues the navigation process. As for the dynamic obstacle on the right side, because this obstacle moves in the same direction as the obstacle avoidance movement of the robot, the robot must perform an obstacle avoidance maneuver many times to complete its navigation.
Conclusions
This article proposes a robot navigation method based on hand-sketched maps which do not need to be accurate. The robot navigation problem is approached as an object detection and identification task. First, the user selects a series of representative landmark objects and sketches a guide route. Then, the proposed objectness measure method based on color and superpixel features is used to detect and classify objects in predetermined categories. Compared to the traditional sliding window technology, the number of candidate image windows is greatly reduced, which in turn reduces the image processing time. Compared to the conventional robot navigation method that requires a precise map of the working environment, the proposed approach to navigation is simple and easy to use, and can guide the robot to operate smoothly in an indoor environment effectively. Therefore, it is suitable for wide adoption in fields such as museum guides and home service robots.
Footnotes
Declaration of conflicting interests
The author(s) declared no potential conflicts of interest with respect to the research, authorship, and/or publication of this article.
Funding
The author(s) disclosed receipt of the following financial support for the research, authorship, and/or publication of this article: This work is supported by the Natural Science Foundation of Higher Education Institutions of Jiangsu Province [grant no. 16KJB520048], “QingLan” Project of Jiangsu Province, Changzhou Applied Basic Research Planned Project [grant no. CJ20180010], Key Laboratory of Industrial IoT [grant no. KYPT201803Z], the Natural Science Foundation of CCIT [grant no. CXZK201705Z], and Changzhou Key Laboratory of high technology [grant no. CM20183004].